CN103179995A - Iv monitoring by video and image processing - Google Patents
Iv monitoring by video and image processing Download PDFInfo
- Publication number
- CN103179995A CN103179995A CN2011800331028A CN201180033102A CN103179995A CN 103179995 A CN103179995 A CN 103179995A CN 2011800331028 A CN2011800331028 A CN 2011800331028A CN 201180033102 A CN201180033102 A CN 201180033102A CN 103179995 A CN103179995 A CN 103179995A
- Authority
- CN
- China
- Prior art keywords
- image
- droplet
- infusion
- methods
- images
- Prior art date
- Legal status (The legal status is an assumption and is not a legal conclusion. Google has not performed a legal analysis and makes no representation as to the accuracy of the status listed.)
- Pending
Links
Images


Classifications
-
- H—ELECTRICITY
- H04—ELECTRIC COMMUNICATION TECHNIQUE
- H04N—PICTORIAL COMMUNICATION, e.g. TELEVISION
- H04N7/00—Television systems
- H04N7/18—Closed-circuit television [CCTV] systems, i.e. systems in which the video signal is not broadcast
- H04N7/188—Capturing isolated or intermittent images triggered by the occurrence of a predetermined event, e.g. an object reaching a predetermined position
Landscapes
- Engineering & Computer Science (AREA)
- Multimedia (AREA)
- Signal Processing (AREA)
- Image Analysis (AREA)
- Image Processing (AREA)
Abstract
Description
对相关申请的交叉引用: Cross-references to related applications:
申请号US12825368:IV Monitoring by Digital Image Processing,同一申请人 Application number US12825368: IV Monitoring by Digital Image Processing, the same applicant
联邦政府资助的研究: Federally funded research:
所属技术领域Technical field
无/不适用 none/not applicable
联合研究协议/合同中涉及的其他方的名字: Names of other parties involved in the joint research agreement/contract:
无/不适用 none/not applicable
(核苷酸和/或氨基酸)序列或程序: (nucleotide and/or amino acid) sequence or program:
无/不适用 none/not applicable
本发明和下列应用有关: The present invention is relevant to the following applications:
1.输液监测 1. Infusion monitoring
2.输液监测中条形码的使用 2. The use of barcodes in infusion monitoring
背景技术/现有技术 Background technology/existing technology
输液通常需要较长的时间完成。有很多的尝试试图自动监视输液过程,并且已经存在一些现有的系统。它们中的绝大多数基于对物理量的测量。 Infusions usually take longer to complete. There have been many attempts to automate the monitoring of the infusion process, and there are already some existing systems. The vast majority of them are based on the measurement of physical quantities. the
对液滴滴数计数是这些方法中的一大类,它们通常使用一些光学传感设备来完成。在这一领域中有若干项美国专利,例如: Counting the number of droplets is a large class of these methods, and they are usually done using some optical sensing device. There are several US patents in this field, such as:
1.美国专利4,383,252Intravenous Drip Feed Monitor,其使用二极管(diode)和光电晶体管(phototransistor)来检测液滴。 1. US Patent 4,383,252 Intravenous Drip Feed Monitor, which uses a diode (diode) and a phototransistor (phototransistor) to detect droplets. the
2.美国专利6,736,801Method and Apparatus for Monitoring Intravenous Drips,其使用红外或其他类型的发射极配合传感器来对液滴滴数计数。 2. US Patent 6,736,801 Method and Apparatus for Monitoring Intravenous Drips, which uses infrared or other types of emitters to cooperate with sensors to count the number of droplets. the
基于液滴计数技术原理的设备通常有如下两个功能: Devices based on the principle of droplet counting technology usually have the following two functions:
1.当液滴滴速和某预设值偏离太大时报警。 1. When the droplet speed deviates too much from a preset value, it will alarm. the
2.当输液过程结束后报警,以防止药液进入血管周围组织。 2. When the infusion process is over, it will alarm to prevent the liquid medicine from entering the perivascular tissue. the
我们的发明从一个不同的角度来解决这些问题。我们使用一个视频/图像采集设备记录液滴滴落过程并从视频中分析出滴速。我们也检测滴管中液面的位置并在液面位置下降的时候报警通知病人。 Our invention addresses these issues from a different angle. We use a video/image acquisition device to record the droplet dripping process and analyze the droplet velocity from the video. We also detect the liquid level in the dropper and alarm the patient when the liquid level drops. the
总结和概括(Summary): Summary and generalization (Summary):
我们的发明有两个目的:一是监测输液速度,二是当输液结束之后发出警报。这两种功能可由同一设备,应用不同的算法完成。在下述示例性的软硬件实现中,此设备主要由一个盒体、一个视频/图像采集设备和一个处理器构成。输液器的滴管部分被放置在盒体内一个确定的位置,因此其和视频/图像采集设备的相对位置也是固定的。 Our invention has two purposes: one is to monitor the infusion rate, and the other is to send an alarm when the infusion is over. These two functions can be performed by the same device, using different algorithms. In the following exemplary hardware and software implementation, the device mainly consists of a box, a video/image acquisition device and a processor. The dropper part of the infusion set is placed in a definite position in the box body, so its relative position with the video/image acquisition device is also fixed. the
对于滴速监测,我们要分析一连串的图像序列。在每一幅图像中,我们都计算相同的一种测量量,而对这个测量量的要求则是其必须具有和液滴下滴过程相同的周期性。从每一幅图像中都取得这样的一个测量量,由此对于一连串的图像序列我们会得到一个信号。为了确定液体滴速,我们对此信号进行离散傅立叶变换(Discrete FourierTransform),并以变换所得系数中绝对值(magnitude/norm/范数/模长)最大的非常数项系数的项数(index;指第几项,并不是指总的项数)作为这一系列图像中液滴下滴过程的周期数。从周期数我们可以进而计算出滴速。 For drip velocity monitoring, we analyze a series of image sequences. In each image, we calculate the same kind of measurement, and the requirement for this measurement is that it must have the same periodicity as the droplet process. Such a measurement is taken from each image, whereby we obtain a signal for a sequence of images. In order to determine the liquid drop speed, we perform discrete Fourier transform (Discrete FourierTransform) on this signal, and use the number of items (index; Refers to the number of items, not the total number of items) as the cycle number of the droplet drop process in this series of images. From the number of cycles we can then calculate the drop rate. the
在下面的讨论中我们分别给出了将测量量选取为液滴的大小,液滴的位置,以及图像中某一区域平均灰度值这三种情况下的例子。实验显示在很宽的实际滴速范围内,我们的方法都能够给出准确的滴速测量。 In the following discussion, we respectively give examples of the three cases where the measurement quantity is selected as the size of the droplet, the position of the droplet, and the average gray value of a certain area in the image. Experiments show that our method can give accurate drop velocity measurements over a wide range of actual drop velocity. the
在图3的说明部分我们对于如何选取上文所提到的”测量量”提出了一个判据,并对此判据的正确性与有效性给出了数学上的论证。这一论证确立了一个理论基础,即任何具有和液体下滴过程相同周期特征的测量量均可被选取,并由其计算出滴速。我们通过实验结果证明了此论断。 In the explanatory part of Figure 3, we put forward a criterion for how to select the "measurement quantity" mentioned above, and give a mathematical demonstration of the correctness and effectiveness of this criterion. This argument establishes a theoretical basis, that is, any measurement with the same periodic characteristics as the liquid dripping process can be selected, and the dripping velocity can be calculated from it. We prove this assertion through experimental results. the
为了检测输液过程的结束我们需要找出液面在滴管中的位置。然而因为下滴的液体会导致液面的起伏颤动,我们需要先计算若干帧相邻图像的平均值以消除这种起伏颤动现象。随后我们对图像进行边缘检测,并将滴管图像中最长的水平方向线段的位置识别为液面的位置。当该液面位置下降时,此设备会通过警报等方式通知病人和护士。 To detect the end of the infusion process we need to find out where the liquid level is in the dropper. However, because the dripping liquid will cause the fluctuation of the liquid level, we need to calculate the average value of several frames of adjacent images to eliminate this fluctuation and vibration. We then perform edge detection on the image and identify the position of the longest horizontal line segment in the dropper image as the position of the liquid surface. When the liquid level drops, the device notifies the patient and the nurse, for example, through an alarm. the
使用条形码的目的是为了给软件算法提供必要的信息。滴管的型号、各种尺寸等信息可以帮助软件算法选取图像中合适的区域进行计算。条形码可由视频/图像采集设备读入并由软件算法加以分析,进而从中提取出所需要的信息。条形码中还可以包含有其他有用的信息,如输液袋/瓶中液体的体积,据此我们还可以在输液过程中估算出完成输液所需要的剩余时间。 The purpose of using the barcode is to provide the necessary information to the software algorithm. Information such as the model and various sizes of the dropper can help the software algorithm select a suitable area in the image for calculation. The barcode can be read by the video/image capture device and analyzed by the software algorithm, and then the required information can be extracted from it. The barcode can also contain other useful information, such as the volume of liquid in the infusion bag/bottle, based on which we can also estimate the remaining time required to complete the infusion during the infusion. the
本发明的优越性在于:1)准确性2)经济性3)方便性。仅仅使用低成本的视频/图像采集装置,我们就可以在测定滴速上达到非常高的准确性。在实际使用中,它可以节省病人和护士难以计数的时间。 The advantages of the present invention are: 1) accuracy, 2) economy, and 3) convenience. Using only a low-cost video/image capture device, we can achieve very high accuracy in determining drop velocity. In practice, it can save patients and nurses countless hours. the
附图说明 Description of drawings
图1给出了一种可能的硬件实现 Figure 1 shows a possible hardware implementation
图2A-2E给出了拍摄到的滴管图像和对图像的预处理。 Figures 2A-2E show the captured images of the dropper and the preprocessing of the images. the
1.图2A左边显示了一幅拍摄到的图像,右边图中被矩形包围的则是进行分析的区域。 1. The left side of Figure 2A shows a captured image, and the area surrounded by a rectangle in the right figure is the area for analysis. the
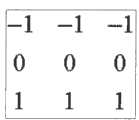
2.图2B显示了垂直方向的索贝尔(Sobel)梯度算子。 2. Figure 2B shows the Sobel gradient operator in the vertical direction. the
3.图2C显示了垂直方向的蒲瑞维特(Prewitt)梯度算子。 3. Figure 2C shows the Prewitt gradient operator in the vertical direction. the
4.图2D显示了拉普拉斯(Laplacian)算子。 4. Figure 2D shows the Laplacian operator. the
5.图2E分别显示了图2A中在矩形区域中的部分以及它的索贝尔,蒲瑞维特和拉普拉斯运算结果。 5. Figure 2E shows the part in the rectangular area in Figure 2A and its Sobel, Prewitt and Laplace operation results. the
图3A-3D显示了对一个序列中的数幅图像进行的分析步骤。每一幅图的左上图是原始图像,右上图是索贝尔梯度算子的运算结果,左下图是对索贝尔运算结果所做的二值化,右下图是左下图进行腐蚀(erosion)后的结果。 Figures 3A-3D show the analysis steps performed on several images in a sequence. The upper left image of each image is the original image, the upper right image is the operation result of the Sobel gradient operator, the lower left image is the binarization of the Sobel operation result, and the lower right image is the erosion of the lower left image. the result of. the
图像标题中的数字: Numbers in image captions:
1.左上图标题中的数字是该图在图像序列中的项数(index,第几项)。 1. The number in the title of the upper left picture is the number of items (index, number) of the picture in the image sequence. the
2.右下图标题中的数字包括三个部分: 2. The number in the title of the lower right figure includes three parts:
a.分号前的第一个数字是图中联通分量的个数。 a. The first number before the semicolon is the number of connected components in the figure. the
b.紧跟分号后的第二个数字是以像素个数计的图中最大连通分量的大小。 b. The second number following the semicolon is the size of the largest connected component in the graph in pixels. the
c.最后一个数字是最大分量几何中心(centroid,质心,重心)的纵坐标。 c. The last number is the ordinate of the geometric center (centroid, center of mass, center of gravity) of the largest component. the
图3E给出了图3A-3D中右下图中腐蚀算法所用的核(kernel)。 Fig. 3E shows the kernel (kernel) used by the erosion algorithm in the bottom right diagram of Figs. 3A-3D. the
图4给出了使用离散傅立叶变换从一系列测量量中确定滴速的方法。 Figure 4 shows the method for determining the drip velocity from a series of measurements using the discrete Fourier transform. the
1.图4A显示了从一个序列的图像中取得的如图3A-3D中的的几何中心(centroid,质心,重心)的纵坐标。 1. Figure 4A shows the vertical coordinates of the geometric center (centroid, center of mass, center of gravity) obtained from a sequence of images as shown in Figures 3A-3D. the
2.图4B显示了图4A的离散傅立叶变换结果。 2. Figure 4B shows the discrete Fourier transform results of Figure 4A. the
3.图4C从一个序列的图像中取得的如图3A-3D中的最大连通分量的大小(像素个数/面积)。 3. Figure 4C shows the size (number of pixels/area) of the largest connected component as shown in Figures 3A-3D obtained from a sequence of images. the
4.图4D显示了图4C的离散傅立叶变换结果。 4. Figure 4D shows the discrete Fourier transform results of Figure 4C. the
5.图4E-4F对另一个图像序列重复了图4A-4B的过程。 5. Figures 4E-4F Repeat the process of Figures 4A-4B for another sequence of images. the
6.图4G-4H对另一个图像序列重复了图4A-4B的过程。 6. Figures 4G-4H Repeat the process of Figures 4A-4B for another sequence of images. the
7.图4I显示了图4A所对应的图像序列中图像平均灰度值随时间的变化。 7. Figure 4I shows the change of the average gray value of the image in the image sequence corresponding to Figure 4A over time. the
8.图4J给出了放大显示后的图4I的离散傅立叶变换结果。 8. Figure 4J shows the discrete Fourier transform results of Figure 4I after enlarged display. the
图5A-5F给出了检测滴管中液面位置的方法 Figure 5A-5F has provided the method for detecting the liquid level position in the dropper
1.图5A显示了视频中连续10幅图像的灰度图像。 1. Figure 5A shows a grayscale image of 10 consecutive images from the video. the
2.图5B显示了对图5A使用垂直方向索贝尔梯度算子(图2B)的结果。 2. Figure 5B shows the result of using the vertically oriented Sobel gradient operator (Figure 2B) on Figure 5A. the
3.图5C显示了对图5B做二值化的结果。 3. Figure 5C shows the result of binarizing Figure 5B. the
4.图5D显示了图5C中每一行中连续线段(连在一起的点)的最大长度。 4. Figure 5D shows the maximum length of consecutive line segments (connected points) in each row in Figure 5C. the
5.图5F显示了图5C中每一行中连续线段(连在一起的点)的最大长度,但仅仅显示了在滴管两端以内并且不包括两端的区域内的那些行。 5. Figure 5F shows the maximum length of consecutive line segments (dots connected together) in each row in Figure 5C, but only those rows in the region within and excluding the ends of the dropper. the
6.图5F显示了检测到并标记出的液面和滴管底部的位置。 6. Figure 5F shows the detected and marked positions of the liquid level and the bottom of the dropper. the
图6A-6B显示了如何使用条形码向监测设备提供信息。 Figures 6A-6B show how barcodes can be used to provide information to monitoring equipment. the
1.图6A显示了一个典型的条形码的示例。 1. Figure 6A shows an example of a typical barcode. the
2.图6B显示了对图6A的扫描结果。 2. Figure 6B shows the scan results for Figure 6A. the
图7显示了文中若干算法的流程图 Figure 7 shows the flow chart of several algorithms in the paper
1.图7A显示了一种滴速监测的实现的算法。 1. Figure 7A shows an algorithm for implementing drip rate monitoring. the
2.图7B显示了一种报警功能的实现的算法。 2. Figure 7B shows an algorithm for realizing the alarm function. the
3.图7C显示了一种条形码读取的实现的算法。 3. Figure 7C shows an algorithm for the implementation of barcode reading. the
附图说明-幅图中的数字标记 DESCRIPTION OF DRAWINGS - NUMBERS IN THE DRAWINGS
11盒体 11 boxes
12视频/图像采集设备 12Video/image acquisition equipment
13处理器 13 processors
14光源 14 light sources
15盒体外的显示设备 15 display devices outside the box
16滴管 16 dropper
17固定在盒体内壁上的条形码标签 17 Barcode labels fixed on the inner wall of the box
详细说明 Detailed description
引论 Introduction
这项发明的第一个目的是确保输液的安全。在医疗实践中,人们常常对重力输液的滴速有特定的要求。新生儿、成人、心血管疾病病人以及肾病病人等不同的病人对输液速度都有着不同的要求。如果液体的实际滴速和医生指定的速度差别太大的话,则有可能对病人产生不良影响。在极端情况下,甚至可能威胁到病人的生命安全。 The first purpose of this invention is to ensure the safety of infusion. In medical practice, people often have specific requirements on the drip rate of gravity infusion. Different patients, such as neonates, adults, cardiovascular disease patients and kidney disease patients, have different requirements for infusion speed. If the actual drip speed of the liquid is too different from the speed specified by the doctor, it may have adverse effects on the patient. In extreme cases, it may even threaten the patient's life. the
这项发明的第二个目的是确保输液疗法的疗效。许多药物都对给药的速率有特定要求。如果滴速过快或者过慢,则达不到所需要的疗效。 The second purpose of this invention is to ensure the curative effect of infusion therapy. Many drugs have specific requirements for the rate at which they are administered. If the drip rate is too fast or too slow, the desired curative effect cannot be achieved. the
这项发明的第三个目的是节省护士和病人的时间。在普通的重力输液过程中,护士和病人都需要经常性地检查滴速并在滴速误差过大时及时做出调节,而这一过程占用了他(她)们大量的时间和注意力。同时,准确的剩余输液时间也很难估计,这使得无论是护士还是病人都难以将其他事项和输液并在一起在时间上统筹安排。 A third purpose of this invention is to save nurses and patients time. In the ordinary gravity infusion process, both the nurse and the patient need to check the drip rate frequently and make timely adjustments when the drip rate error is too large, and this process takes up a lot of time and attention of him (her). Simultaneously, it is also difficult to estimate the accurate remaining infusion time, which makes it difficult for both nurses and patients to arrange other matters and infusion together in time. the
在当前的医疗实践中显然已经存在解决这些问题的方案,如使用输液泵。然而输液泵的高昂价格(通常都在1000美元以上)限制了它们在普通治疗中的使用,尤其是在发展中国家。除了输液泵之外,市场上也存在用红外信号等手段测定滴速的设备。本发明人并没有机会能够试用这类设备,因此不能对它们的性能做出评价。 Solutions to these problems already exist in current medical practice, such as the use of infusion pumps. However, the high price of infusion pumps (often more than $1,000) has limited their use in general therapy, especially in developing countries. In addition to infusion pumps, there are also devices on the market that use infrared signals and other means to measure the drip rate. The inventors have not had the opportunity to try out such devices and therefore cannot comment on their performance. the
在这项发明中,我们阐明了一种不同于输液泵和红外检测手段,而是使用视频和图像处理技术来测量液体滴速的准确并且低成本的方法。我们的方法在一个对于医疗实践中的实际滴速显得绰绰有余的很宽的一个滴速范围内都能够测得准确的结果,并且由于其仅仅需要一个低分辨率和低帧率的视频/图像采集设备和一个低成本的处理器,因此具有很高的经济性上的优势。除了测速之外,这一设备还具有检测滴管中液面位置的能力,因此能够在输液结束液面行将下降之时及时向护士和病人报警,从而防止了由于没有及时关闭输液器而使血液由于血压向输液器内倒流的情况。 In this invention, we demonstrate an accurate and low-cost method of measuring liquid drip velocity using video and image processing techniques instead of infusion pumps and infrared detection methods. Our method is capable of measuring accurate results over a wide range of drip rates that is more than sufficient for practical drip rates in medical practice, and since it only requires a low-resolution and low-frame-rate video/image acquisition equipment and a low-cost processor, so it has a high economic advantage. In addition to speed measurement, this device also has the ability to detect the position of the liquid level in the dropper, so it can promptly alarm the nurse and patient when the liquid level is about to drop after the end of the infusion, thus preventing the blood from being caused by not closing the infusion set in time. Due to the backflow of blood pressure into the infusion set. the
在下面的说明中我们会详述这项发明的各项细节。 In the following description we will detail the details of this invention. the
图1-硬件和机体结构的一个示例 Figure 1 - An example of hardware and airframe structure
11是一个由不透光的不透明材料制成的盒体,选用不透光的材料的目的在于阻止外界的光线进入盒内,从而为视频/图像采集设备提供一个理想且恒定的照明环境。 11 is a box body made of light-tight opaque material. The purpose of choosing the light-tight material is to prevent external light from entering the box, so as to provide an ideal and constant lighting environment for video/image acquisition equipment. the
12是一个固定在盒体门上的视频/图像采集设备。当盒体门关闭时此视频/图像采集设备的方向会朝向滴管。 12 is a video/image acquisition device fixed on the box body door. The video/image capture device is oriented towards the dropper when the box door is closed. the
13是一个具有对采集到的视频/图像独立做出分析的能力的处理器。 13 is a processor capable of independently analyzing the collected video/image. the
14是位于盒体内的一个光源,它的目的是为了给视频/图像采集设备提供一个理想的照明环境。 14 is a light source located in the box body, and its purpose is to provide an ideal lighting environment for the video/image acquisition equipment. the
15是盒体门的外侧。它可以将当前的滴速、剩余时间等信息在一个低能耗的显示设备上显示出来,比如一个LCD屏。 15 is the outside of box body door. It can display the current drip speed, remaining time and other information on a low-power display device, such as an LCD screen. the
16是一个放置在盒内的滴管,其两端的位置均以固定。 16 is a dropper that is placed in the box, and the positions of its two ends are all fixed. the
17是一段条形码,它可被视频/图像采集设备读取,从而向软件算法提供输液过程的有关信息。 17 is a section of bar code, which can be read by video/image acquisition equipment, thereby providing relevant information of the infusion process to the software algorithm. the
18是一个远程监控中心,它可以对一批视频/图像采集设备采集到的视频/图像进行分析处理,完成每一个视频/图像采集设备单独配对的处理器(13)所完成的任务。 18 is a remote monitoring center, which can analyze and process the videos/images collected by a batch of video/image acquisition devices, and complete the tasks completed by the processor (13) paired independently of each video/image acquisition device. the
图2-(图像的)预处理 Figure 2 - (image) preprocessing
我们在这里给出一个示例,该示例使用解析度为320×240,帧率为每秒15帧的视频/图像采集设备。作为电子设备上的一种常见元件,这种规格的视频/图像采集设备只需要几美元的价格就可以从中国的制造商那里购买到。图2A是一幅由上述视频/图像采集设备采集到的图像,其中滴管位于图像的中央。在图2A的右半部分中我们用一个矩形标示了我们真正将要对图像进行分析处理的区域。 Here we give an example using a video/image capture device with a resolution of 320×240 and a frame rate of 15 frames per second. A common component on electronic equipment, a video/image capture device of this size can be purchased from a Chinese manufacturer for only a few dollars. FIG. 2A is an image captured by the video/image capture device described above, where the dropper is located in the center of the image. In the right half of Figure 2A, we use a rectangle to mark the area where we will actually analyze and process the image. the
为什么我们要在图像中指定这样的一个区域?我们注意到:1)这块区域从滴管中滴嘴的底端一直延伸到滴管的中部2)液面的位置并没有被包括在内。 Why do we specify such an area in the image? We note that: 1) This area extends from the bottom of the dripper to the middle of the dripper 2) The position of the liquid level is not included. the
选择这样一块区域的原因是为了用最小的成本实现最高的准确性。 The reason for choosing such an area is to achieve the highest accuracy at the lowest cost. the
倘若不需要考虑成本,那么我们完全可以使用具有更高解析度和帧率的高端视频/图像采集设备。在极端(使用最好设备)的情况下,我们用和实验室中用高速摄像机拍摄下落物体的轨迹一样的方式拍摄液滴下落的过程。配合使用具有强大计算能力的处理芯片,我们可以对包括滴速在内的各种参数进行测量。然而如果需要这样高额的成本,那么在商业上这个设备和输液泵相比则并没有竞争力,从而很有可能我们发明的产品并不会有很好的市场前景。 If cost is not a concern, then we can use high-end video/image capture devices with higher resolution and frame rate. In the extreme case (with the best equipment), we film the droplet as it falls in the same way that a high-speed camera would film the trajectory of a falling object in the lab. Combined with a processing chip with powerful computing power, we can measure various parameters including drip speed. However, if such a high cost is required, then this device is not competitive commercially with the infusion pump, so it is very likely that the product we invented will not have a good market prospect. the
由于我们志在降低成本,因此完整地分析液滴下落的全过程并不是一个非常现实的做法。滴管的最大全长通常小于5厘米(2英寸),而滴管中液面的高度通常会超过1厘米(0.4英寸)。因此,液滴从滴嘴下落至到达液面经过的剩余距离通常小于4厘米(1.6英寸)。假设不存在空气阻力,那么液滴下落至液面需要的时间约 
另一个问题是为什么我们不降注意力集中在液面?下落的液滴会激起液面的起伏颤动,这一现象也可以用来确定滴速。液面的起伏虽然较之液滴在滴嘴处形成的过程为快,然而却通常慢于下落的过程。这个方法是可行的并且我们不应该将它排除在外,然而即使是使用这种方法,其确定滴速的根本原理和我们在此示例实现中用到的都是一样的。 Another question is why don't we focus on the liquid level? Falling droplets will cause fluctuations in the liquid surface, which can also be used to determine the drop velocity. Although the rise and fall of the liquid level is faster than the process of the droplet forming at the drip nozzle, it is usually slower than the falling process. This method is possible and we shouldn't rule it out, however even with this method the underlying principles for determining the drip velocity are the same as we used in this example implementation. the
前面我们讨论了选择图像中一小块区域进行分析的原因。因为相较与下落和液滴在液面激起的起伏颤动,液滴的形成是最缓慢的,因此我们出于计算上的各种优越性和其对视频/ 图像采集设备的低要求而选择其加以分析。在后续的说明中我们会看到,滴速的确定是通过对采集到的信号进行离散傅立叶变换实现的。不论我们从图像中的那个部分采集信号,确定滴速的根本原理都不会改变。因此,本说明中选取图像某一特定部分进行的分析仅仅应当被理解为一种为了讲清楚原理和方法所给出的示例,而不应当被理解为和用作对本发明所要求保护的范围的限制。 Earlier we discussed the reasons for choosing a small area of the image for analysis. Because the droplet formation is the slowest compared with the drop and the fluctuation of the droplet on the liquid surface, we choose it for various advantages in calculation and its low requirements for video/image acquisition equipment It is analyzed. As we will see in the subsequent description, the determination of the dripping speed is realized by performing discrete Fourier transform on the collected signal. Regardless of where in the image we acquire the signal from, the fundamentals of determining drop velocity do not change. Therefore, the analysis of a specific part of the image selected in this description should only be understood as an example for clarifying the principles and methods, and should not be understood and used as a guideline for the scope of protection claimed by the present invention. limit. the
至此仍有一个没有解决的问题:在图像中如何确定分析区域(窗口)的位置?在这一示例性实现中图2A右侧中矩形所标识的分析区域的位置和大小是人为指定的,然而在真正的产品中该如何处理?当然,设备可以对图像中的内容进行物体/目标识别,对滴管的各部分进行分析并最终自动选取分析窗口。这一方法是可行的。因为图像中的内容并不复杂,加之滴管被固定在盒体内一个确定的位置,所以识别并不会十分困难。然而,即使我们能对某种滴管的各部分能做出准确的识别,就能同样保证对其他类型的滴管都能识别准确吗?识别算法在一种类型滴管上的成功并不能确保对其他类型滴管的同样成功。更重要的一点是,在医疗领域错误是不被容许的。 So far, there is still an unsolved problem: how to determine the position of the analysis area (window) in the image? In this exemplary implementation, the position and size of the analysis area identified by the rectangle on the right side of FIG. 2A is artificially specified, but how to deal with it in a real product? Of course, the device can perform object/target recognition on the content in the image, analyze each part of the dropper and finally automatically select the analysis window. This method is feasible. Because the content in the image is not complicated, and the dropper is fixed in a certain position in the box, it is not very difficult to identify. However, even if we can accurately identify the parts of a certain type of dropper, can we also guarantee accurate identification of other types of droppers? The success of the recognition algorithm on one type of dropper does not ensure the same success on other types of droppers. More importantly, mistakes are not tolerated in the medical field. the
我们对这一问题的解决方法是使用条形码。参见图1的17部分,视频/图像采集设备可以拍摄条形码并经软件算法提取出输液过程各方面的信息,其中包括输液滴管的类型和型号。对于不同类型和型号的滴管我们会选取不同的分析窗口进行相应的分析。
Our solution to this problem is to use barcodes. Referring to
接下来我们说明如何对图像进行增强/如何使得图像更便于分析。 Next we explain how to enhance the image / how to make the image easier to analyze. the
图2E中的第一幅图是图2A中矩形窗口中的内容。这是一幅灰度图像,从其在整幅图像中的位置我们可以知道图中上端较亮的部分是一个正在形成中、并且正在反射光线的液滴的下部。为了能够更方便地使用计算方法取得图像中的信息我们使用对其使用数字图像处理技术进行增强。图2B是一个垂直方向上的索贝尔(Sobel)梯度算子,图2C是一个垂直方向上的蒲瑞维特(Prewitt)算子,图2D是一个拉普拉斯(Laplacian)算子。有关这些算子的介绍请参看[Digital Image Processing,2ed,Prentice Hall,2002,Gonzalez,Woods]一书第三章和第10.13小节的内容。 The first image in Figure 2E is the contents of the rectangular window in Figure 2A. This is a grayscale image, and from its position in the overall image we know that the brighter upper part of the image is the lower part of a droplet that is forming and reflecting light. In order to obtain the information in the image more conveniently by using calculation methods, we use digital image processing technology to enhance it. Figure 2B is a Sobel gradient operator in the vertical direction, Figure 2C is a Prewitt operator in the vertical direction, and Figure 2D is a Laplacian operator. For an introduction to these operators, please refer to Chapter 3 and Section 10.13 of [Digital Image Processing, 2ed, Prentice Hall, 2002, Gonzalez, Woods]. the
图2E中的第二、三、四幅图分别显示了对第一幅图应用索贝尔,蒲瑞维特和拉普拉斯算子的效果。在图2B和2C中我们仅仅给出了垂直方向上的索贝尔和蒲瑞维特算子,然而图2E中现实的是应用对应的”全”梯度的结果。更精确的说,我们通过将水平和垂直方向上算子运算结果的绝对值相加来得到对其梯度绝对值的一个逼近: The second, third, and fourth panels in Figure 2E show the effects of applying Sobel, Prewitt, and Laplace operators to the first panel, respectively. In Figures 2B and 2C we only show the Sobel and Prewitt operators in the vertical direction, while Figure 2E shows the result of applying the corresponding "full" gradients. More precisely, we obtain an approximation to the absolute value of its gradient by adding the absolute values of the operator results in the horizontal and vertical directions:
|Gradient|=|Gx|+|Gy| |Gradient|=|G x |+|G y |
这是数字图像处理中的一个标准做法。具体请参考[Digital Image Processing,2ed,Prentice Hall,2002,Gonzalez,Woods]一书的第579页。 This is a standard practice in digital image processing. For details, please refer to page 579 of the book [Digital Image Processing, 2ed, Prentice Hall, 2002, Gonzalez, Woods]. the
从图2E中我们看到,索贝尔梯度给出了灰度值强度范围最大,对比最为明显的结果,并比蒲瑞维特梯度的结果更为明亮。拉普拉斯算子的结果灰度之强度范围最小,对比度最弱。不论是蒲瑞维特,拉普拉斯还是不计其数的其他各种各样的增强技术,乃至包括在图像频域中所做的滤波,都各有其独特的作用和实用价值,然而它们共同的目的却都是为了增强图像中的一些显著的特征。因此虽然我们在接下来的后续步骤说明中使用的是索贝尔梯度 运算的结果,这一选择却仅仅应当被视作一种为了说明问题所给出的示例,而并非是对本发明所要求保护的范围的限制。 From Figure 2E we can see that the Sobel gradient gives the result with the largest intensity range of gray values and the most obvious contrast, and is brighter than the result of the Prewitt gradient. The result of the Laplacian operator has the smallest intensity range and the weakest contrast. Whether it is Prewitt, Laplace or countless other various enhancement techniques, even including filtering in the frequency domain of the image, each has its unique role and practical value, but they have a common The purpose is to enhance some salient features in the image. Therefore, although we use the result of the Sobel gradient operation in the following follow-up step explanation, this choice should only be regarded as a kind of example given for explaining the problem, rather than the claimed protection of the present invention. Scope limitation. the
图3-从图像中提取特征信息 Figure 3 - Extract feature information from images
下面我们说明如何从视频(图像的序列)中提取数字特征信息。图3A中包含4幅图像,第一行左侧是视频中的原始图像,右侧是索贝尔梯度运算的结果。在原始图像的顶端有一个数字显示了该图像在图像序列中的项数(index,第几项)。因此”原始第30幅图像”说明图像是序列中的第30帧。第二行左侧是对索贝尔梯度运算的结果再依据阈值进行二值化(thresholding)的结果,而图像上方标题中的”大津法”表明阈值是根据(大津展之(Nobuyuki Otsu)的算法自动选取的,因此这个过程并不需要人工干预。根据阈值做二值化的目的是为了将索贝尔梯度的灰度值图像结果转成二值图像。第二行的右侧是对二值图像进行腐蚀(erosion)的结果。 Below we illustrate how to extract digital feature information from videos (sequences of images). Figure 3A contains 4 images, the left side of the first row is the original image in the video, and the right side is the result of the Sobel gradient operation. There is a number at the top of the original image that shows the number of items (index, item number) of the image in the image sequence. So "original 30th image" means that the image is the 30th frame in the sequence. The left side of the second line is the result of thresholding the results of the Sobel gradient calculation, and the "Otsu method" in the title above the image indicates that the threshold is based on (Nobuyuki Otsu)'s algorithm It is automatically selected, so this process does not require manual intervention. The purpose of binarization according to the threshold is to convert the gray value image result of the Sobel gradient into a binary image. The right side of the second line is the binary image The result of corrosion (erosion).
为什么我们需要做腐蚀操作?其目的是为了消去一些不必要的,相对较小的点。在图3B-3D中我们看到二值化的结果包含了若干个连通分量,而其中绝大多数的连通分量都是不必要的,这一点在图3D中尤为明显。我们这样做的依据是:液滴反光形成的亮斑是图像中几个较亮的区域中最大的一块,因此我们不需要对其他较小的亮斑感兴趣。因此腐蚀对我们来说仅仅是将这些较小部分消除的一个工具。在图3E中我们给出了腐蚀所用的核(kernel)。当然,对于由更高解析度视频/图像采集设备拍得的图像我们应当选择更大的核。腐蚀是数字图像处理中一项基本的形态学(morphology)运算。有关其细节请参见[Digital Image Processing,2ed,Prentice Hall,2002,Gonzalez,Woods]的第九章。 Why do we need to do corrosion operations? Its purpose is to eliminate some unnecessary, relatively small points. In Fig. 3B-3D we see that the result of binarization contains several connected components, and most of them are unnecessary, which is especially obvious in Fig. 3D. We do this on the basis that the blob formed by the droplet's reflection is the largest of several brighter areas in the image, so we don't need to be interested in other smaller blobs. So corrosion is just a tool for us to get those smaller parts out. In Figure 3E we show the kernel used for etching. Of course, we should choose a larger kernel for images captured by higher resolution video/image capture devices. Erosion is a basic morphology operation in digital image processing. See Chapter 9 of [Digital Image Processing, 2ed, Prentice Hall, 2002, Gonzalez, Woods] for details. the
经腐蚀后的图像的标题包含三部分。第一部分是图像中连通分量的个数。在此示例实现中我们使用的是8邻接(8-connectivity/8-adjacency)的定义,然而在实际产品的上的实现中我们既可以使用8邻接也可以使用4邻接(4-connectivity/4-adjacency)。对于什么是8邻接和4邻接请参见[Digital Image Processing,2ed,Prentice Hall,2002,Gonzalez,Woods]的第2.5节。标题的第二部分是以像素个数计的最大连通分量大小。第三部分是最大连通分量几何中心(centroid,质心,重心)的纵坐标,即其所含各像素纵坐标的平均值。举例来说,图3D右下角图像的标题是“7;26,11.77”,这表示图像中含有7个连通分量,其中最大的连通分量的大小以像素个数计为26个像素,其纵坐标的平均值是11.77。 The title of the etched image consists of three parts. The first part is the number of connected components in the image. In this example implementation we use the definition of 8-connectivity/8-adjacency, but in the actual product implementation we can use either 8-connectivity or 4-adjacency (4-connectivity/4-adjacency) adjacency). For what is 8-adjacency and 4-adjacency, please refer to Section 2.5 of [Digital Image Processing, 2ed, Prentice Hall, 2002, Gonzalez, Woods]. The second part of the header is the maximum connected component size in pixels. The third part is the ordinate of the geometric center (centroid, centroid, center of gravity) of the largest connected component, that is, the average value of the ordinate of each pixel contained therein. For example, the title of the image in the lower right corner of Figure 3D is "7; 26, 11.77", which means that the image contains 7 connected components, and the size of the largest connected component is 26 pixels in terms of number of pixels. The average value is 11.77. the
图3A-3D中的原始图像来自序列中的第30,33,37和38幅图,我们之所以没有将图像按前后紧密相连的顺序放在这里是为了节省说明部分文字和配图所占用的空间。将第30和33幅图像比较,我们看到液滴的大小在增大并且其位置在降低。这一趋势在梯度、二值化和腐蚀结果中均很明显。最大分量包含的像素数由11增加到17,其纵坐标平均值由6.727增加到9.529,这两点都是和我们观察到的液滴变大和位置降低的趋势是一致的。
The original images in Figure 3A-3D are from the 30th, 33rd, 37th and 38th pictures in the sequence. The reason why we did not put the images here in the order of the front and back is to save the description part of the text and pictures. space. Comparing
图3C是序列中液体已然开始下落的第37幅图像。重力已经将液滴拉长,这一点同时在梯度、二值化和腐蚀的结果中都很明显。和图3B相比其最大连通分量的纵坐标由9.529增加到14.76,然而其所包含的像素数却并没有变化。 Figure 3C is the 37th image in the sequence where the liquid has started to fall. Gravity has elongated the droplet, which is simultaneously apparent in the gradient, binarization, and erosion results. Compared with Figure 3B, the ordinate of the largest connected component increases from 9.529 to 14.76, but the number of pixels it contains does not change. the
图3D是序列中的第38幅图,这幅图中的内容并不像前面几幅图那么清晰。在图像的中央位置有一块较为明亮的亮斑,但我们难以判断这块亮斑是一个下落液滴的头部或尾部,亦 或是由于滴管表面对光的反射。在图像的上端又有一个正在形成的液滴。这幅图的梯度、二值化和腐蚀同样难以解读。二值化结果中包含有数块大小不能轻易忽视的部分,即使再经过腐蚀这些连通部分也为数不少,并且腐蚀的结果图像和原始图像看上去在特征方面并不是完全一致。 Figure 3D is the 38th picture in the sequence, and the content of this picture is not as clear as the previous pictures. There is a relatively bright spot in the center of the image, but it is difficult to tell whether this bright spot is the head or tail of a falling drop, or is due to the reflection of light from the surface of the dropper. At the upper end of the image there is another droplet forming. The gradient, binarization, and erosion of this image are also difficult to interpret. The binarization result contains several parts whose size cannot be easily ignored. Even after erosion, there are still many connected parts, and the erosion result image and the original image do not seem to be exactly the same in terms of features. the
这一结果是否说明我们的算法在正确性方面是存疑的?这是我们在论证整套方法的正确性之前必须回答的一个非常重要的问题。我们可以通过数学的论证来证明算法的正确性:因为液滴滴落是一个周期性过程,因此捕捉到的图像序列也是具有周期性的。算法本身是一个固定的、机械的(指机械地执行特定的步骤)流程,因此对于相同的输入其总是得到相同的结果。因而机械流程对于周期性输入信号的输出也是周期性的。用符号来表示这一事实: Does this result suggest that our algorithm is questionable in terms of correctness? This is a very important question that we must answer before we can demonstrate the correctness of the whole set of methods. We can prove the correctness of the algorithm through a mathematical argument: because the droplet is a periodic process, the captured image sequence is also periodic. The algorithm itself is a fixed, mechanical (meaning that specific steps are performed mechanically) process, so it always gets the same result for the same input. The output of a mechanical process is thus also periodic with respect to a periodic input signal. Symbolize this fact:
图像(t+T)=图像(t) image(t+T) = image(t)
因此F(图像(t+T))=F(图像(t)) So F(image(t+T))=F(image(t))
因此即使在提取的特征信号中存在着像图3D这样的“噪声”,我们仍然能够保证在一定时间上采集到的信息是一个周期信号。因为这个周期信号的周期性和液滴滴落过程的周期性是一致的,我们可以用离散傅立叶变换从中计算出滴速。 Therefore, even if there is "noise" like Figure 3D in the extracted feature signal, we can still guarantee that the information collected at a certain time is a periodic signal. Because the periodicity of this periodic signal is consistent with the periodicity of the droplet dripping process, we can use discrete Fourier transform to calculate the dripping speed from it. the
不仅如此,正如我们在前文关于图2的说明中讨论过的,液滴的形成相对于其下落来说是一个缓慢得多的过程,因此对于一个图像序列中的绝大多数图像,我们的算法都可以从中提取出特征明显的信息,因此最终取得的特征信号的周期性并不会因为很小一部分的异常信号而改变。 Not only that, but as we discussed earlier in the note on Figure 2, droplet formation is a much slower process than its fall, so for the vast majority of images in an image sequence, our algorithm Information with obvious characteristics can be extracted from it, so the periodicity of the final characteristic signal will not be changed by a small part of abnormal signals. the
上面这些关于周期性的数学讨论具有非常根本的重要性。其在一个非常基础的层面上指出了不论是从图像中取得的哪一种测量量,只要这种测量量能够忠实得捕捉到液滴滴落过程的周期性,这种测量量就可以被用来确定滴速。因而,虽然在这一示例性的实例中出于计算效率和对视频/图像捕捉设备成本的考虑我们主要分析的是液滴的形成过程,但是从原理上来说我们的方法也同样允许分析液滴的下落过程、液滴在水面激起的起伏颤动、以及其他难以计数的可以想象到的测量方式。我们提取的信号同样不必局限于图像中最大部分的像素个数/面积或垂直方向位置,而是可以扩展到其他任何和液滴滴落过程表现出了相同的周期性的可计算量。例如,倘若某一特定区域内总体的明亮度(灰度值)由于液滴对光的反射而发生周期性的变化,那么这个量也同样可以被用来确定滴速。 These mathematical discussions of periodicity above are of very fundamental importance. It points out at a very basic level that no matter what kind of measurement is taken from the image, as long as the measurement can faithfully capture the periodicity of the droplet dripping process, this measurement can be used to determine the drop rate. Thus, although in this illustrative example we primarily analyze droplet formation for reasons of computational efficiency and cost of video/image capture equipment, in principle our method also allows analysis of droplet The falling process of water droplets, the ups and downs caused by liquid droplets on the water surface, and countless other imaginable measurement methods. The signal we extract is also not limited to the pixel number/area or vertical position of the largest part of the image, but can be extended to any other computable quantity that exhibits the same periodicity as the droplet dropping process. For example, if the overall brightness (gray value) in a particular area changes periodically due to the reflection of light by the droplets, then this quantity can also be used to determine the drop velocity. the
另一个问题为什么我们选用腐蚀(erosion)来消去那些较小的部分?事实上这里并没有什么内在的,固有的原因使得我们选择腐蚀而非其他的方法;腐蚀只是用于消除图像中不必要的部分的众多方法中的一种。在此示例性的实例中我们对腐蚀过后图像中剩余的各个连通部分依据像素数/面积进行了排序,然而在排序之前我们也可以略去腐蚀这一步骤,而仅是丢弃掉那些较小的区块。我们在此需要再次强调,本实例实现中所采用的处理方法仅仅是捕捉液滴滴落过程周期性的众多方法中的一种,而其他各种各样的方法,只要能够捕捉到同样的周期性,则都能工作。具有根本性意义的则是对提取的特征信号应用离散傅立叶变换从而确定液滴滴落的周期。 Another question why do we choose erosion (erosion) to eliminate those smaller parts? There is actually nothing inherent here that makes us choose erosion over other methods; erosion is just one of many methods used to remove unnecessary parts of an image. In this illustrative example, we sort the remaining connected parts in the image after erosion according to the number of pixels/area. However, we can also omit the erosion step before sorting, but only discard those smaller ones blocks. We need to emphasize here again that the processing method used in this example implementation is only one of many methods to capture the periodicity of the droplet dripping process, and other various methods, as long as they can capture the same periodicity sex, both work. It is of fundamental significance to apply discrete Fourier transform to the extracted characteristic signal to determine the period of droplet falling. the
图4-通过离散傅立叶变换确定滴数 Figure 4 - Determination of the number of drops by discrete Fourier transform
对于图3A-3D所对应的图像序列(视频)中的每一幅图我们都计算了两个数质量:1)最大连通分量的像素数/面积2)最大连通分量的平均纵坐标。总这两项信息中的任何一项我们都可以立刻计算出滴速。 For each picture in the image sequence (video) corresponding to Figures 3A-3D, we calculated two quantities: 1) the number of pixels/area of the largest connected component 2) the average ordinate of the largest connected component. Any item in these two pieces of information can be calculated immediately by us. the
图4A显示了一个包含180幅图像的序列中每一幅图像中提取出的最大连通分量的平均纵坐标。这个信号中的周期性非常直观明显,因此我们可以很容易的数出其中的周期数。在每一个周期中平均纵坐标单调上升,这一点和液滴在重力的作用下下落是一致的。 Figure 4A shows the mean ordinate of the largest connected components extracted for each image in a sequence of 180 images. The periodicity in this signal is very intuitive, so we can easily count the number of cycles. The average ordinate rises monotonically in each cycle, which is consistent with the drop falling under the force of gravity. the
我们应该如何求出其中包含的周期数?如果缺乏数字信号处理方面的知识,那么不少人可能会试图去数这个信号中的“局部峰值”。在某些的情况下这种简单原始的方式是有可能成功的,但是在多数情况下都很容易出错。数字信号处理领域中标准的方法是对这一信号首先进行离散傅立叶变换,随后找出变换结果中具有最大绝对值(magnitude/norm/范数/模长)的对应信号中非常数分量的频谱分量。 How should we find the number of cycles contained in it? Without knowledge of digital signal processing, many people may try to count "local peaks" in this signal. This simple and primitive approach may be successful in some cases, but it is error-prone in many cases. The standard method in the field of digital signal processing is to first perform a discrete Fourier transform on this signal, and then find the spectral component of the non-constant component in the corresponding signal that has the largest absolute value (magnitude/norm/norm/modulus length) in the transformed result . the
图4B给出了对图4A进行离散傅立叶变换(DFT)的结果。最大值位于零处,代表信号中恒定的平均量(直流分量),然而这个分量与信号的周期性并无关系。除去零这一位置剩余的部分是对称的因此我们只需要在相对称的两部分中的任何一部分中找出最大值,在这里我们选择左半边。我们发现最大值位于坐标(13,354),说明354是信号中最强分量的傅里叶系数,并且在180幅图像中这个信号重复了13个周期。 Figure 4B shows the results of discrete Fourier transform (DFT) of Figure 4A. The maximum at zero represents a constant average amount (DC component) in the signal, however this component is not related to the periodicity of the signal. The remaining part except zero is symmetrical so we only need to find the maximum value in any of the two symmetrical parts, here we choose the left half. We found that the maximum is located at coordinates (13, 354), indicating that 354 is the Fourier coefficient of the strongest component in the signal, and this signal repeats for 13 cycles in 180 images. the
有关离散傅立叶变换(DFT)的介绍请参见[Discrete-Time Signal Processing,2ed,Prentice Hall,1999,Oppenheim,Schafer,Buck]一书的第八章。
For an introduction to the discrete Fourier transform (DFT) see
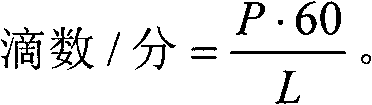
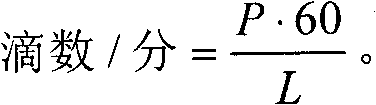
由此我们可以立刻计算出滴速: From this we can immediately calculate the drop rate:
180/15(每秒钟的帧数)=12秒 180/15 (frames per second) = 12 seconds
在12秒内信号重复了13次 Signal repeated 13 times in 12 seconds
因此,滴速是13×(60/12)=65滴/分 Therefore, the dripping speed is 13×(60/12)=65 drops/min
我们查看了这段信号所对应的原视频,人工数出的滴数是67滴/分钟。这实际上和我们计算所得的结果是一样的,因为即使是人工计数数出的也不一定是整数滴数。如果滴速是完全恒定的,那么12秒内会有67/6=13.4滴。因为离散傅立叶变换只计算整数项对应的傅立叶系数,因此13和13.4在这一意义上是相等的。 We checked the original video corresponding to this signal, and the number of drops counted manually was 67 drops/minute. This is actually the same as what we calculated, because even manual counting does not necessarily count the whole number of drops. If the drop rate is perfectly constant, there will be 67/6 = 13.4 drops in 12 seconds. Because the discrete Fourier transform only computes Fourier coefficients corresponding to integer terms, 13 and 13.4 are equivalent in this sense. the
图4C显示了相同的图像序列中最大连通分量像素个数/面积的变化。笼统地说,最大联通分量的像素个数/面积在每个周期内先增加后减小,这和液滴的形成与下落是对应一致的,但是这一较弱的规律性有不少的意外。直观上人工计数也要困难得多,更不要说使用简单原始的“局部峰值”计数了。然而,图4D中的离散傅立叶变换仍然为我们做出了正确的决定并识别出了13次重复。因此,我们得到了和图4B中一样的65滴/分钟的结果。 Figure 4C shows the change in the number/area of the largest connected component pixels in the same image sequence. Generally speaking, the number of pixels/area of the maximum connected component first increases and then decreases in each cycle, which is consistent with the formation and fall of droplets, but there are many surprises in this weak regularity . Intuitively it is also much more difficult to count manually, let alone count using simple raw "local peaks". However, the DFT in Figure 4D still made the correct decision for us and identified 13 replicates. Therefore, we got the same result of 65 drops/min as in Fig. 4B. the
图4E-4F对一个由180幅(12秒)图像构成,实际人工计数所得滴数是117滴/分钟的液滴滴落过程重复了图4A-4B中的运算,所得结果是23×(60/12)=115滴/分钟。 Fig. 4E-4F repeats the operation in Fig. 4A-4B to a droplet dripping process that is constituted by 180 (12 seconds) images, and the actual number of drops obtained by manual counting is 117 drops/min, and the obtained result is 23 * (60 /12)=115 drops/min. the
图4G-4H对一个由180幅(12秒)图像构成,实际人工计数所得滴数是26滴/分钟的液滴滴落过程重复了图4A-4B中的运算,所得结果是5×(60/12)=25滴/分钟。 Fig. 4G-4H repeats the operation in Fig. 4A-4B for a droplet drop process consisting of 180 (12 seconds) images, and the actual number of drops obtained by manual counting is 26 drops/minute, and the obtained result is 5 × (60 /12) = 25 drops/min. the
从这三个例子中我们可以得出本方法所确定的滴速是非常准确的的这样一个结论。在实际中滴速很少低于30滴/分钟或高于120滴/分钟,而我们的方法对极端及中间速率都能够很好地工作。 From these three examples, we can draw such a conclusion that the dripping speed determined by this method is very accurate. Drop rates are rarely lower than 30 drops/min or higher than 120 drops/min in practice, and our method works well for both extreme and intermediate rates. the
这些例子同时也说明,相对于最大连通分量的像素数/面积,其纵坐标是一个更好的测量量。但即使是在使用最大连通分量的像素数/面积这一测量量并导致我们人工计数出现困难的情况下,我们的方法仍然能够计算出准确的滴速。事实上在两个极端滴速情况下也是如此(26滴/分钟和117滴/分钟)。这些事实证明了我们数学论断的正确性,即任何准确地捕捉到了液滴滴落过程周期性的测量量都可以用来测定滴速。 These examples also illustrate that the ordinate is a better measure than the number of pixels/area of the largest connected component. But our method was able to calculate the accurate drip velocity even when using the measure of the number of pixels/area of the largest connected component and making our manual counting difficult. This is in fact also the case at the two extreme drop rates (26 drops/min and 117 drops/min). These facts justify our mathematical assertion that any measurement that accurately captures the periodicity of the droplet fall can be used to determine the drop velocity. the
图4I-4J是最后一个用于显示和证明(demonstrate)在测量量的选择上我们有多大的自由度的一个例子。在这个例子中选择的是和图4A-4D对应的同样一个图像序列。没有做梯度,没有做二值化,没有做腐蚀,我们仅仅计算了序列中每一幅图像的平均灰度值。在图4I中这一过度简单的测量方法仍然显示出了周期性,而图4J中的离散傅里叶变换仍然找出了和图4B、图4D结果相同的周期数。 Figures 4I-4J are a final example to show and demonstrate how much freedom we have in the choice of measurements. In this example, the same image sequence as that corresponding to Figs. 4A-4D is selected. No gradient, no binarization, no erosion, we just calculated the average gray value of each image in the sequence. This oversimplified measurement method in Figure 4I still shows periodicity, and the discrete Fourier transform in Figure 4J still finds the same number of cycles as the results in Figure 4B and Figure 4D. the
这最后一个例子的目的是为了再次强调,我们计算滴速的根本性方法是离散傅里叶变换的使用,而并非某一个特定测量量的选取。最大部分的像素数/面积和位置仅仅是一种可行的实现方案,他们仅应当被理解为为了说明清楚问题所给出的示例,而并非是对本发明所要求保护的范围的限制。非常广泛的、各种各样的测量量都可以被用来实现我们的目的。 The purpose of this last example is to re-emphasize that the fundamental method by which we calculate the drip velocity is the use of the discrete Fourier transform, not the choice of a particular measurement. The number/area and position of the largest part of pixels is only a feasible implementation solution, and they should only be understood as examples for clarifying the problem, rather than limiting the scope of protection claimed by the present invention. A very wide variety of measurements can be used for our purposes. the
图5-当输液过程结束时报警 Figure 5 - alarm when the infusion process ends
我们在这里再说明本发明的一个关键功能:当输液过程结束时报警。相对于滴速监测来说,这是一个相对简单的工作。 We illustrate a key function of the present invention again here: report to the police when the infusion process ends. Compared with drip rate monitoring, this is a relatively simple job. the
当药液容器内的药液滴完后,滴管中的液面会下降,因此我们需要找出液面的位置,并在这一位置开始下降的时候触发警报。 When the liquid in the liquid medicine container drops, the liquid level in the dropper will drop, so we need to find out the position of the liquid level and trigger an alarm when this position starts to drop. the
这是基于边缘检测来实现的。图5A是视频中连续10幅图像的平均图像。为什么我们要求图像的平均?这是因为如果我们从视频中任取一幅图像,有可能这幅图像拍摄于液面被下落的液滴激起起伏颤动的瞬间,在这个时刻液面存在着振动,因此会带来检测上的困难。对连续图像取平均值可以显著地削弱这一现象,并且不论我们取平均值的一连串图像从哪里开始,平均图像中的液面总是近似水平的。 This is achieved based on edge detection. Figure 5A is the average of 10 consecutive images from the video. Why do we ask for the average of the images? This is because if we randomly take an image from the video, it is possible that this image is taken at the moment when the liquid surface is fluctuated by the falling droplets. At this moment, the liquid surface is vibrating, so it will bring detection Difficulties. Averaging consecutive images significantly weakens this phenomenon, and no matter where the sequence of images we average begins, the liquid level in the average image is always approximately horizontal. the
图5B将图2B中的垂直方向索贝尔梯度算子应用到了图5A上。因为我们仅检测水平方向上的边缘,因此只使用垂直方向梯度算子就足够了。除此之外还有无数的其他方法,包括在空间域(spatial domain)和频域(frequency domain)做滤波,都可以达到这个目的,因此我们在这里选择使用的的索贝尔梯度算子仅应当被理解为为了说明清楚问题所给出的示例,而并非对本发明所要求保护范围的限制。 FIG. 5B applies the vertical Sobel gradient operator in FIG. 2B to FIG. 5A . Since we only detect edges in the horizontal direction, it is sufficient to use only the gradient operator in the vertical direction. In addition, there are countless other methods, including filtering in the spatial domain (spatial domain) and frequency domain (frequency domain), can achieve this purpose, so the Sobel gradient operator we choose to use here should only It should be understood as an example given for the purpose of clarifying the problem, rather than limiting the scope of protection claimed by the present invention. the
图5C对图5B做了二值化,而二值化的阈值是由大津展之算法确定的。这将图5B的灰度图像转化成图5C的二值图像,使得我们能够更方便地使用计算方法取得图像中的信息。 Fig. 5C is binarized to Fig. 5B, and the threshold of binarization is determined by Otsu Zhanyuki's algorithm. This converts the grayscale image in Figure 5B into the binary image in Figure 5C, making it easier for us to use computational methods to obtain information in the image. the
图5D显示了图5C中每一行的最大连续像素数目。我们可以清楚地看到较高的数值对应着一些较为明显的水平方向线段,而最高的数值集中在图像中的边缘和滴管的底端。 Figure 5D shows the maximum number of consecutive pixels for each row in Figure 5C. We can clearly see that higher values correspond to some more pronounced horizontal lines, while the highest values are concentrated around the edges of the image and the bottom of the eyedropper. the
图中有若干个较高的连续像素数目,到底哪一个才是液面的位置呢?一种方法是几个较高高连续像素数目中所在水平位置较高的一个,因为液面的位置不可能低于滴管的底部。像这样的一些判据听起来似乎言之成理,但是其逻辑和理论基础却不坚实。我们需要更为可靠的判据来确保医疗实践中的安全性。 There are several higher numbers of continuous pixels in the picture, which one is the position of the liquid surface? One method is the higher one of several higher numbers of consecutive pixels at the horizontal position, because the position of the liquid level cannot be lower than the bottom of the dropper. Criteria like these sound plausible, but their logical and theoretical foundations are not solid. We need more reliable criteria to ensure safety in medical practice. the
假设我们已经知道滴管各种的各种尺度,同时因为滴管是固定在盒体内的(见图1)并且视频/图像采集设备的位置也是固定的,因此在图5C中滴管的顶部和底部的位置也是确定的。因此我们就没有必要计算在这两个边界及它们以外的每行中最大连续像素的个数,而经过这一简化我们得到了图5E。图5E中单独的一个最高值指示了液面的位置。在图5F中检测到的液面位置和已知的滴管底端位置被一起标出。当着两个位置接近时,此设备将会发出警报告知病人和护士。 Suppose we already know the various scales of the dropper, and because the dropper is fixed in the box (see Figure 1) and the position of the video/image acquisition device is also fixed, so in Figure 5C the top of the dropper and The position of the bottom is also determined. Therefore, it is not necessary for us to calculate the maximum number of consecutive pixels in each line between these two boundaries and beyond them, and after this simplification we get Figure 5E. A single highest value in Figure 5E indicates the location of the liquid level. The detected liquid level position is marked together with the known dropper bottom position in Fig. 5F. When the two locations are close, the device will sound an alarm to notify the patient and the nurse. the
我们如何能够知道滴管的各种准确尺度呢?这同时又提醒了我们在图2的说明中提到的一个仍未解决的问题:如何确定图像中进行计算分析的窗口/矩形区域的位置?我们前面说过过这一问题将借助条形码来解决,接下来在图6中我们将该问题和在液面检测这里遇到的新问题的解决方法放在一起讨论。 How can we know the exact dimensions of the dropper? This at the same time reminds us of a still unresolved problem mentioned in the illustration of Figure 2: how to determine the location of the window/rectangular region in the image for computational analysis? We said before that this problem will be solved with the help of barcodes. Next, in Figure 6, we will discuss this problem and the solution to the new problem encountered here in liquid level detection. the
图6-使用条形码 Figure 6 - Using Barcodes
图6A显示了条形码的一种编码方式,这种编码方式被称为通用产品代码(Universal Product Code,UPC)。黑色的横条代表1,白色的横条代表0。在条码的顶端、中部和底端有一些较长的横条,它们分别表示一些特殊的序列101,01010和101,识别程序可以从顶端或底端这些特殊序列中检测出单根(单位)横条的宽度。所有其他看上去比单根(基本)横条更宽的横条都是由单位横条构成的。 Figure 6A shows an encoding method of a barcode, which is called a universal product code (Universal Product Code, UPC). Black bars represent 1 and white bars represent 0. There are some longer horizontal bars at the top, middle and bottom of the barcode, which represent some special sequences 101, 01010 and 101 respectively. The recognition program can detect a single (unit) horizontal bar from these special sequences at the top or bottom. The width of the bar. All other bars that appear wider than a single (basic) bar are made of unit bars. the
条形码的图像可以被拍摄到,程序将会向下(或向上)找出第一段连续的黑色宽度,用以像素数计的宽度大小作为后续扫描依据的基本单位宽度。接下来程序会继续向下扫描,以基本宽度为单位测量每一段黑色或白色宽度的大小(除以基本宽度),并在这一过程中丢弃掉顶端、中部和底端的特殊序列(详细的细节请参见UPC标准)。每一个十进制数字由七个单位宽度表示,在中间的特殊序列前后各有六个十进制数字。程序会将黑色单位宽度转换为1,白色单位宽度转换为0,由此生成如图6B所示的每一个十进制数字所对应的比特序列。图6B中的比特序列将依据对应的条形码编码方式被解码到其所表示的十进制数字。当然,上面示例中使用通用产品代码标准是为了讲清楚概念,我们也可以专门为输液监测设计一套编码方案。 The image of the barcode can be photographed, and the program will find the first continuous black width downwards (or upwards), and use the width in pixels as the basic unit width for subsequent scanning. The program then continues to scan down, measuring the size of each segment of black or white width in units of the base width (divided by the base width), and discarding special sequences at the top, middle, and bottom in the process (details See UPC standard). Each decimal digit is represented by a width of seven units, with six decimal digits before and after the special sequence in the middle. The program will convert the black unit width to 1, and the white unit width to 0, thereby generating a bit sequence corresponding to each decimal number as shown in FIG. 6B. The bit sequence in FIG. 6B will be decoded into the decimal digits it represents according to the corresponding barcode encoding method. Of course, the general product code standard used in the above example is to clarify the concept, and we can also design a coding scheme specifically for infusion monitoring. the
这些十进制数字可以用来表示任意的信息: These decimal numbers can be used to represent arbitrary information:
1.可以在一定的范围内(某所医院,某个国家,或国际上)制定输液容器使用的条形码的标准,使得十进制数序列的不同部分如同一个文件中不同的节(段)一样表示不同的信息。例如,前五个数字可以表示药物种类,接下来的三个数字表示药液容积,再接下来的三个表示对给药速率的要求,等等。尤其是在一个全球性的这种标准已 经建立的情况下,此标准的解读信息可以被存储在硬件的内部存储器之中,从而监测设备不需要再向某中央服务器查询特定标准的解读信息就可以独立工作。 1. It is possible to formulate barcode standards for infusion containers within a certain range (a certain hospital, a certain country, or internationally), so that different parts of the decimal number sequence are like different sections (segments) in a file. information. For example, the first five numbers may indicate the type of drug, the next three numbers indicate the volume of the drug solution, the next three numbers indicate the required rate of administration, and so on. Especially when a global standard of this kind has been established, the interpretation information of this standard can be stored in the internal memory of the hardware, so that the monitoring device does not need to query a certain central server for the interpretation information of a specific standard. Can work independently. the
2.也可以使用非标准的编码方式,如某医院的内部编码。在这种情况下,更为方便的做法是监测设备先将读取到的条形码发送到某中央服务器,然后从服务器读取解码后的信息。 2. You can also use non-standard coding methods, such as the internal coding of a hospital. In this case, it is more convenient for the monitoring device to first send the read barcode to some central server, and then read the decoded information from the server. the
条形码标签可由药品生产商或医院打印在类似于带有黏胶的贴纸的表面上。在给药时标签会像图1中一样放在盒体的内壁上。因为标签被放置在一个固定的区域,所以程序不需要通过任何识别算法来在图像中找到标签的位置。 Barcode labels can be printed by drug manufacturers or hospitals on a surface similar to an adhesive sticker. The label will be placed on the inner wall of the box as in Figure 1 when the drug is administered. Because the labels are placed in a fixed area, the program does not need to go through any recognition algorithms to find the location of the labels in the image. the
从条形码提供的信息中我们可以知道滴管的型号和准确尺寸,从而回答了在图2和图5的说明中提出的问题。这些信息可以让设备知道其应该在图像中的哪个部分进行分析和在哪一块区域检测液面。 From the information provided by the barcode, we can know the model and exact size of the dropper, thus answering the questions raised in the illustrations of Figures 2 and 5. This information lets the device know where in the image it should analyze and where to detect fluid levels. the
除了这两种信息,条形码还可以告诉程序药液的容量。由于滴速可以被监测并且容量已知,已给药和剩余的药量也都可以计算出来。根据滴速设备可以估算输液完成需要的剩余时间。这在世界范围内可以为病人和护士节省难以计数的时间。 In addition to these two pieces of information, the barcode can also tell the program the volume of the drug solution. Since the drip rate can be monitored and the volume is known, both the administered and remaining doses can be calculated. Based on the drip rate the device can estimate the time remaining for the infusion to complete. This saves patients and nurses countless hours worldwide. the
我们使用条形码向监测程序提供信息,它的使用增强了原有配置的功能。也可以使用二维条形码或其他的编码方式,它们都可以从拍摄到的图像中获取并处理。因此,图6中具体的例子仅应当被理解为为了说明清楚问题所给出的示例,而并非是对本发明所要求保护的范围的限制。 We use barcodes to provide information to the monitoring program, and its use enhances the functionality of the original configuration. Two-dimensional barcodes or other coding methods can also be used, which can be obtained and processed from the captured images. Therefore, the specific example in FIG. 6 should only be understood as an example for clarifying the problem, rather than limiting the scope of protection claimed by the present invention. the
致谢 thanks
我们在此声明,作为为了说明问题而使用的编程环境,我们使用了The Mathworks,Inc.公司的MATLAB
Claims (11)


Applications Claiming Priority (3)
| Application Number | Priority Date | Filing Date | Title |
|---|---|---|---|
| US12/804,163 | 2010-07-15 | ||
| US12/804,163 US8531517B2 (en) | 2010-07-15 | 2010-07-15 | IV monitoring by video and image processing |
| PCT/CN2011/073805 WO2012006896A1 (en) | 2010-07-15 | 2011-05-09 | Iv monitoring by video and image processing |
Publications (1)
| Publication Number | Publication Date |
|---|---|
| CN103179995A true CN103179995A (en) | 2013-06-26 |
Family
ID=45466656
Family Applications (1)
| Application Number | Title | Priority Date | Filing Date |
|---|---|---|---|
| CN2011800331028A Pending CN103179995A (en) | 2010-07-15 | 2011-05-09 | Iv monitoring by video and image processing |
Country Status (6)
| Country | Link |
|---|---|
| US (1) | US8531517B2 (en) |
| EP (1) | EP2593160A1 (en) |
| JP (1) | JP2014502379A (en) |
| CN (1) | CN103179995A (en) |
| IN (1) | IN2013MN00280A (en) |
| WO (1) | WO2012006896A1 (en) |
Cited By (13)
| Publication number | Priority date | Publication date | Assignee | Title |
|---|---|---|---|---|
| CN104107471A (en) * | 2014-06-26 | 2014-10-22 | 联想(北京)有限公司 | Information processing method and electronic equipment |
| CN105498042A (en) * | 2016-01-08 | 2016-04-20 | 山东师范大学 | Video-based non-light-shielding type transfusion automatic alarm method and device thereof |
| CN106964022A (en) * | 2017-03-13 | 2017-07-21 | 西南交通大学 | transfusion monitoring device |
| CN106997587A (en) * | 2017-03-23 | 2017-08-01 | 武汉大学 | A kind of measuring method of the intravenous fluid drip speed based on machine vision |
| CN107106768A (en) * | 2015-01-13 | 2017-08-29 | 株式会社村田制作所 | Dropping amount measuring device, dropping amount controller, dripping device, and liquid droplet volume measuring device |
| CN107261257A (en) * | 2017-05-25 | 2017-10-20 | 上海禹康医疗器械有限公司 | Air detection method and device in a kind of woven hose based on machine vision |
| CN110013574A (en) * | 2019-05-10 | 2019-07-16 | 上海市东方医院(同济大学附属东方医院) | Drainage liquid amount real-time monitoring method |
| CN111415368A (en) * | 2020-03-09 | 2020-07-14 | 武汉大学 | A fast measurement method for droplet velocity of mobile devices based on deep learning |
| CN112642022A (en) * | 2020-12-31 | 2021-04-13 | 遵义师范学院 | Infusion monitoring system and monitoring method |
| CN112986105A (en) * | 2021-02-07 | 2021-06-18 | 睿科集团(厦门)股份有限公司 | Liquid drop counting and speed measuring method based on machine vision |
| CN113144327A (en) * | 2021-03-18 | 2021-07-23 | 华南理工大学 | Medical intelligent auxiliary infusion device and infusion method based on machine vision |
| CN114596521A (en) * | 2022-02-10 | 2022-06-07 | 合肥师范学院 | Venous transfusion monitoring method and system based on vision measurement |
| CN118750683A (en) * | 2024-08-30 | 2024-10-11 | 南昌大学第二附属医院 | Smart infusion stand with remote monitoring |
Families Citing this family (40)
| Publication number | Priority date | Publication date | Assignee | Title |
|---|---|---|---|---|
| US20110135144A1 (en) * | 2009-07-01 | 2011-06-09 | Hand Held Products, Inc. | Method and system for collecting voice and image data on a remote device and coverting the combined data |
| US9151646B2 (en) | 2011-12-21 | 2015-10-06 | Deka Products Limited Partnership | System, method, and apparatus for monitoring, regulating, or controlling fluid flow |
| US9128051B2 (en) | 2010-10-19 | 2015-09-08 | Baxter International Inc. | Optical imaging system for air bubble and empty bag detection in an infusion tube |
| US8622979B2 (en) | 2010-10-19 | 2014-01-07 | Baxter Healthcare S.A. | Infusion system using optical imager for controlling flow and method thereof |
| US9476825B2 (en) | 2010-10-19 | 2016-10-25 | Baxter International Inc. | Optical imaging system with multiple imaging channel optical sensing |
| US9144644B2 (en) | 2011-08-02 | 2015-09-29 | Baxter International Inc. | Infusion pump with independently controllable valves and low power operation and methods thereof |
| US9746093B2 (en) | 2011-12-21 | 2017-08-29 | Deka Products Limited Partnership | Flow meter and related system and apparatus |
| US10563681B2 (en) | 2011-12-21 | 2020-02-18 | Deka Products Limited Partnership | System, method, and apparatus for clamping |
| US9435455B2 (en) | 2011-12-21 | 2016-09-06 | Deka Products Limited Partnership | System, method, and apparatus for monitoring, regulating, or controlling fluid flow |
| US9372486B2 (en) | 2011-12-21 | 2016-06-21 | Deka Products Limited Partnership | System, method, and apparatus for monitoring, regulating, or controlling fluid flow |
| US10488848B2 (en) | 2011-12-21 | 2019-11-26 | Deka Products Limited Partnership | System, method, and apparatus for monitoring, regulating, or controlling fluid flow |
| US9724467B2 (en) | 2011-12-21 | 2017-08-08 | Deka Products Limited Partnership | Flow meter |
| US9746094B2 (en) | 2011-12-21 | 2017-08-29 | Deka Products Limited Partnership | Flow meter having a background pattern with first and second portions |
| US10228683B2 (en) | 2011-12-21 | 2019-03-12 | Deka Products Limited Partnership | System, method, and apparatus for monitoring, regulating, or controlling fluid flow |
| CN103285442A (en) * | 2012-03-01 | 2013-09-11 | 苏州优点优唯医疗科技有限公司 | Transfusion rack and transfusion monitoring system |
| DE102012020945B4 (en) | 2012-10-25 | 2019-10-10 | Fresenius Medical Care Deutschland Gmbh | Apparatus, system and method for monitoring, displaying and operating medical fluid management devices |
| US9759343B2 (en) | 2012-12-21 | 2017-09-12 | Deka Products Limited Partnership | Flow meter using a dynamic background image |
| US9234850B2 (en) * | 2013-03-14 | 2016-01-12 | Baxter International Inc. | Drip chamber with integrated optics |
| US9352081B2 (en) | 2013-03-14 | 2016-05-31 | Baxter International Inc. | Drip chamber with hydrophobic interior surface |
| CN111135382B (en) * | 2013-03-15 | 2022-06-14 | 德卡产品有限公司 | Systems, methods and apparatus for monitoring, regulating or controlling fluid flow |
| CN103127583A (en) * | 2013-03-19 | 2013-06-05 | 南京理工大学 | Transfusion monitoring device based on video images |
| USD751690S1 (en) | 2013-11-06 | 2016-03-15 | Deka Products Limited Partnership | Apparatus to control fluid flow through a tube |
| USD752209S1 (en) | 2013-11-06 | 2016-03-22 | Deka Products Limited Partnership | Apparatus to control fluid flow through a tube |
| USD751689S1 (en) | 2013-11-06 | 2016-03-15 | Deka Products Limited Partnership | Apparatus to control fluid flow through a tube |
| USD749206S1 (en) | 2013-11-06 | 2016-02-09 | Deka Products Limited Partnership | Apparatus to control fluid flow through a tube |
| USD745661S1 (en) | 2013-11-06 | 2015-12-15 | Deka Products Limited Partnership | Apparatus to control fluid flow through a tube |
| ES2732209T3 (en) | 2014-01-29 | 2019-11-21 | Becton Dickinson Co | System and method to ensure fluid administration and patient medication at the point of clinical use |
| CA2938189C (en) | 2014-01-29 | 2019-01-15 | Becton, Dickinson And Company | System and method for assuring patient medication and fluid delivery at the clinical point of use |
| USD905848S1 (en) | 2016-01-28 | 2020-12-22 | Deka Products Limited Partnership | Apparatus to control fluid flow through a tube |
| CN113855905B (en) | 2016-01-28 | 2024-01-12 | 德卡产品有限公司 | Drip chambers and equipment used to infuse fluids into patients |
| USD854145S1 (en) | 2016-05-25 | 2019-07-16 | Deka Products Limited Partnership | Apparatus to control fluid flow through a tube |
| DE202016008343U1 (en) * | 2016-05-31 | 2017-08-10 | Atmos Medizintechnik Gmbh & Co. Kg | Vacuum therapy device |
| WO2019091577A1 (en) * | 2017-11-13 | 2019-05-16 | Koninklijke Philips N.V. | Systems and methods for monitoring and controlling intravenous flow/drip rate |
| CN109443400A (en) * | 2018-10-18 | 2019-03-08 | 广州智颜科技有限公司 | Squeeze bottle dropping liquid condition checkout gear and its detection method |
| CN110141724B (en) * | 2019-06-04 | 2024-08-30 | 苏州慧尔生医疗科技有限公司 | Drip speed monitoring device of infusion apparatus drip cup |
| WO2021021596A1 (en) | 2019-07-26 | 2021-02-04 | Deka Products Limited Partnership | Apparatus for monitoring, regulating, or controlling fluid flow |
| USD964563S1 (en) | 2019-07-26 | 2022-09-20 | Deka Products Limited Partnership | Medical flow clamp |
| CN110853077B (en) * | 2019-10-17 | 2023-05-30 | 广西电网有限责任公司电力科学研究院 | An Adaptive Feature Extraction Method for Infrared Dynamic Frames Based on Morphology Change Estimation |
| CN111870775B (en) * | 2020-07-23 | 2022-03-25 | 深圳圣诺医疗设备股份有限公司 | Infusion detection and identification method and device and infusion equipment |
| CN117636404B (en) * | 2024-01-26 | 2024-04-16 | 贵州信邦富顿科技有限公司 | Fall detection method and system based on non-wearable equipment |
Citations (5)
| Publication number | Priority date | Publication date | Assignee | Title |
|---|---|---|---|---|
| US5331309A (en) * | 1990-02-06 | 1994-07-19 | Terumo Kabushiki Kaisha | Drip detecting device and drip alarming device and drip rate control device which incorporate drip detecting device |
| GB2309801A (en) * | 1996-01-31 | 1997-08-06 | Meldet Ltd | System for delivery of drugs and therapeutic agents |
| US6159186A (en) * | 1998-03-13 | 2000-12-12 | Wft Projects (Proprietary) Limited | Infusion delivery system |
| CN201110955Y (en) * | 2007-12-07 | 2008-09-03 | 华中科技大学 | A medical infusion speed monitoring and control device based on machine vision |
| CN201379841Y (en) * | 2008-06-26 | 2010-01-13 | 吴秀华 | Networked video and audio monitoring system for transfusion |
Family Cites Families (53)
| Publication number | Priority date | Publication date | Assignee | Title |
|---|---|---|---|---|
| BE568988A (en) * | 1957-05-23 | |||
| DE2631951A1 (en) * | 1976-07-15 | 1978-01-19 | Fraunhofer Ges Forschung | Measuring the volume of a drop, esp. a glass gob - using a television camera and an electronic circuit processing the video signals |
| US4397648A (en) * | 1980-11-07 | 1983-08-09 | Ivac Corporation | Drop sensing unit and associated drip chamber for IV fluid administration |
| US4383252A (en) * | 1980-11-24 | 1983-05-10 | Purcell Harold F | Intravenous drip feed monitor |
| US4577197A (en) * | 1985-01-17 | 1986-03-18 | Xerox Corporation | Ink jet printer droplet height sensing control |
| US4680977A (en) * | 1985-03-06 | 1987-07-21 | Ivac Corporation | Optical flow sensor |
| US4668216A (en) * | 1985-03-11 | 1987-05-26 | Ivac Corporation | System for mounting a drop sensor to a drip chamber |
| JPS63117766A (en) * | 1986-11-05 | 1988-05-21 | 日機装株式会社 | Infusion apparatus |
| US5045069A (en) * | 1989-01-17 | 1991-09-03 | Robert Imparato | Portable infusion monitor |
| KR930003929A (en) * | 1991-08-23 | 1993-03-22 | 겐시로 오가와 | Sap volume control device |
| US5278626A (en) * | 1991-09-05 | 1994-01-11 | Amherst Process Instruments, Inc. | Non-volatile residue system for monitoring impurities in a liquid |
| NL9101825A (en) * | 1991-10-30 | 1993-05-17 | Academisch Ziekenhuis Vrije Un | METHOD FOR ACCURATE FLOW FLOW DETERMINATION OF LIQUIDS AND AN APPARATUS FOR CARRYING OUT THAT METHOD |
| IT1255495B (en) * | 1992-09-18 | 1995-11-09 | Francesco Bellifemine | DEVICE FOR THE SURVEILLANCE OF A PHLEBOCLYSIS PLANT |
| JPH07275690A (en) * | 1994-04-05 | 1995-10-24 | Mitsubishi Electric Corp | Flotation apparatus |
| US5601980A (en) * | 1994-09-23 | 1997-02-11 | Hewlett-Packard Company | Manufacturing method and apparatus for biological probe arrays using vision-assisted micropipetting |
| IT1271099B (en) * | 1994-11-25 | 1997-05-26 | Francesco Bellifemine | DEVICE FOR THE SURVEILLANCE AND CONTROL OF AN IMPROVED FLEBOCLYSIS PLANT |
| LU88565A1 (en) * | 1994-12-07 | 1996-07-15 | Midex Marketing Ltd | Device for monitoring the flow rate of an intravenous infusion |
| US6015083A (en) * | 1995-12-29 | 2000-01-18 | Microfab Technologies, Inc. | Direct solder bumping of hard to solder substrate |
| AU6683498A (en) * | 1997-03-03 | 1998-09-22 | Medical Solutions, Inc. | Method and apparatus for pressure infusion and temperature control of infused liquids |
| GB9803299D0 (en) * | 1998-02-18 | 1998-04-08 | Gallagher George | Improved method and apparatus for monitoring intravenous drips |
| US6213354B1 (en) * | 1999-12-29 | 2001-04-10 | Elite Engineering Corporation | System and method for dispensing fluid droplets of known volume and generating very low fluid flow rates |
| EP1316066A2 (en) * | 2000-08-31 | 2003-06-04 | Koninklijke Philips Electronics N.V. | Extracting a string of points following a threadlike structure in a sequence of images |
| US20040073294A1 (en) * | 2002-09-20 | 2004-04-15 | Conor Medsystems, Inc. | Method and apparatus for loading a beneficial agent into an expandable medical device |
| US7163740B2 (en) * | 2001-06-02 | 2007-01-16 | The Procter & Gamble Company | Process for printing adhesives, adhesive articles and printing equipment |
| US6599282B2 (en) * | 2001-09-05 | 2003-07-29 | Zeev Burko | Intravenous set flow volumetric measurement device |
| US20110206247A1 (en) * | 2001-11-21 | 2011-08-25 | Dachille Frank C | Imaging system and methods for cardiac analysis |
| US6793149B2 (en) * | 2002-02-04 | 2004-09-21 | S. C. Johnson & Son, Inc. | Method and apparatus for evaporating multi-component liquids |
| US20050001869A1 (en) * | 2003-05-23 | 2005-01-06 | Nordson Corporation | Viscous material noncontact jetting system |
| DE102004023080B4 (en) | 2004-05-11 | 2009-01-15 | Fresenius Medical Care Deutschland Gmbh | Method and device for monitoring the supply of substitution fluid during extracorporeal blood treatment |
| EP1626278A3 (en) * | 2004-08-03 | 2006-06-21 | OnChip Cellomics Consortium | Cellomics system |
| JP4007357B2 (en) * | 2004-09-29 | 2007-11-14 | 富士フイルム株式会社 | Image forming apparatus and method |
| CN100558417C (en) * | 2004-10-19 | 2009-11-11 | 泰尔茂株式会社 | Infusion Sets and Clips |
| KR100873904B1 (en) * | 2004-12-30 | 2008-12-15 | 삼성전자주식회사 | Jetting Performance Tester |
| US7499581B2 (en) * | 2005-02-10 | 2009-03-03 | Forhealth Technologies, Inc. | Vision system to calculate a fluid volume in a container |
| JP2007229928A (en) * | 2006-02-27 | 2007-09-13 | Konica Minolta Holdings Inc | Liquid ejector and liquid ejection method |
| US20070293817A1 (en) * | 2006-06-16 | 2007-12-20 | Jun Feng | Portable IV infusion mornitoring system |
| US7776927B2 (en) * | 2007-03-28 | 2010-08-17 | President And Fellows Of Harvard College | Emulsions and techniques for formation |
| KR100878763B1 (en) * | 2007-05-09 | 2009-01-14 | 삼성전자주식회사 | Volume measurement method of ink droplets and nozzle control method of ink jet head using the same |
| CN101679093A (en) * | 2007-05-14 | 2010-03-24 | 柯尼卡美能达精密光学株式会社 | Process for producing glass molding, apparatus therefor and glass molding |
| US7783107B2 (en) * | 2007-09-06 | 2010-08-24 | Seiko Epson Corporation | Characterization of a printed droplet |
| DE102008003387A1 (en) * | 2008-01-07 | 2009-07-09 | Krüss GmbH, Wissenschaftliche Laborgeräte | Method and device for determining the contact angle from the drop radius of curvature by optical distance measurement |
| KR101460156B1 (en) * | 2008-01-25 | 2014-11-10 | 삼성전자주식회사 | Droplet ejecting apparatus having a piezoelectric type voltage generator, and droplet ejecting method using the same |
| US7918834B2 (en) * | 2008-03-06 | 2011-04-05 | T3M | Drop counter |
| US9664619B2 (en) * | 2008-04-28 | 2017-05-30 | President And Fellows Of Harvard College | Microfluidic device for storage and well-defined arrangement of droplets |
| JP2009298012A (en) * | 2008-06-13 | 2009-12-24 | Konica Minolta Holdings Inc | Apparatus and method for inspecting discharge of liquid droplet, and image forming device |
| US20110275063A1 (en) * | 2008-07-11 | 2011-11-10 | President And Fellows Of Harvard College | Systems and methods of droplet-based selection |
| KR100997451B1 (en) * | 2008-10-02 | 2010-12-07 | (주)유니젯 | Ink drop volume measuring device and method |
| US8184848B2 (en) * | 2009-06-17 | 2012-05-22 | National Applied Research Laboratories | Liquid level detection method |
| TWI393074B (en) * | 2009-12-10 | 2013-04-11 | Ind Tech Res Inst | Apparatus and method for moving object detection |
| TWI420084B (en) * | 2009-12-11 | 2013-12-21 | Primax Electronics Ltd | Intravenous drip monitoring method and related intravenous drip monitoring system |
| US20110178476A1 (en) * | 2010-01-19 | 2011-07-21 | Gwg International Inc. | Drip detector with multiple symmetric sensors and signal transmission by zigbee network |
| US10744759B2 (en) * | 2010-06-29 | 2020-08-18 | CARDINAL HEALTH SWITZERLAND 515 GmbH | First drop dissimilarity in drop-on-demand inkjet devices and methods for its correction |
| US20110317004A1 (en) * | 2010-06-29 | 2011-12-29 | Kai Tao | IV Monitoring by Digital Image Processing |
-
2010
- 2010-07-15 US US12/804,163 patent/US8531517B2/en active Active - Reinstated
-
2011
- 2011-05-09 EP EP11806238.9A patent/EP2593160A1/en not_active Withdrawn
- 2011-05-09 CN CN2011800331028A patent/CN103179995A/en active Pending
- 2011-05-09 WO PCT/CN2011/073805 patent/WO2012006896A1/en not_active Ceased
- 2011-05-09 JP JP2013518936A patent/JP2014502379A/en not_active Withdrawn
-
2013
- 2013-02-08 IN IN280MUN2013 patent/IN2013MN00280A/en unknown
Patent Citations (5)
| Publication number | Priority date | Publication date | Assignee | Title |
|---|---|---|---|---|
| US5331309A (en) * | 1990-02-06 | 1994-07-19 | Terumo Kabushiki Kaisha | Drip detecting device and drip alarming device and drip rate control device which incorporate drip detecting device |
| GB2309801A (en) * | 1996-01-31 | 1997-08-06 | Meldet Ltd | System for delivery of drugs and therapeutic agents |
| US6159186A (en) * | 1998-03-13 | 2000-12-12 | Wft Projects (Proprietary) Limited | Infusion delivery system |
| CN201110955Y (en) * | 2007-12-07 | 2008-09-03 | 华中科技大学 | A medical infusion speed monitoring and control device based on machine vision |
| CN201379841Y (en) * | 2008-06-26 | 2010-01-13 | 吴秀华 | Networked video and audio monitoring system for transfusion |
Cited By (19)
| Publication number | Priority date | Publication date | Assignee | Title |
|---|---|---|---|---|
| CN104107471A (en) * | 2014-06-26 | 2014-10-22 | 联想(北京)有限公司 | Information processing method and electronic equipment |
| CN107106768A (en) * | 2015-01-13 | 2017-08-29 | 株式会社村田制作所 | Dropping amount measuring device, dropping amount controller, dripping device, and liquid droplet volume measuring device |
| CN105498042B (en) * | 2016-01-08 | 2019-02-19 | 山东师范大学 | A video-based non-light-shielding infusion automatic alarm method and device thereof |
| CN105498042A (en) * | 2016-01-08 | 2016-04-20 | 山东师范大学 | Video-based non-light-shielding type transfusion automatic alarm method and device thereof |
| CN106964022A (en) * | 2017-03-13 | 2017-07-21 | 西南交通大学 | transfusion monitoring device |
| CN106964022B (en) * | 2017-03-13 | 2023-05-26 | 西南交通大学 | Infusion monitoring device |
| CN106997587B (en) * | 2017-03-23 | 2020-06-23 | 武汉大学 | A method for measuring the flow rate of intravenous injection droplets based on machine vision |
| CN106997587A (en) * | 2017-03-23 | 2017-08-01 | 武汉大学 | A kind of measuring method of the intravenous fluid drip speed based on machine vision |
| CN107261257A (en) * | 2017-05-25 | 2017-10-20 | 上海禹康医疗器械有限公司 | Air detection method and device in a kind of woven hose based on machine vision |
| CN110013574A (en) * | 2019-05-10 | 2019-07-16 | 上海市东方医院(同济大学附属东方医院) | Drainage liquid amount real-time monitoring method |
| CN111415368A (en) * | 2020-03-09 | 2020-07-14 | 武汉大学 | A fast measurement method for droplet velocity of mobile devices based on deep learning |
| CN111415368B (en) * | 2020-03-09 | 2022-03-04 | 武汉大学 | Method for quickly measuring dropping speed of liquid drops of mobile equipment based on deep learning |
| CN112642022A (en) * | 2020-12-31 | 2021-04-13 | 遵义师范学院 | Infusion monitoring system and monitoring method |
| CN112986105A (en) * | 2021-02-07 | 2021-06-18 | 睿科集团(厦门)股份有限公司 | Liquid drop counting and speed measuring method based on machine vision |
| CN113144327A (en) * | 2021-03-18 | 2021-07-23 | 华南理工大学 | Medical intelligent auxiliary infusion device and infusion method based on machine vision |
| CN114596521A (en) * | 2022-02-10 | 2022-06-07 | 合肥师范学院 | Venous transfusion monitoring method and system based on vision measurement |
| CN114596521B (en) * | 2022-02-10 | 2024-12-03 | 合肥师范学院 | A method and system for monitoring intravenous infusion based on visual measurement |
| CN118750683A (en) * | 2024-08-30 | 2024-10-11 | 南昌大学第二附属医院 | Smart infusion stand with remote monitoring |
| CN118750683B (en) * | 2024-08-30 | 2025-02-07 | 南昌大学第二附属医院 | Smart infusion stand with remote monitoring |
Also Published As
| Publication number | Publication date |
|---|---|
| EP2593160A1 (en) | 2013-05-22 |
| WO2012006896A1 (en) | 2012-01-19 |
| US8531517B2 (en) | 2013-09-10 |
| IN2013MN00280A (en) | 2015-06-12 |
| JP2014502379A (en) | 2014-01-30 |
| US20120013735A1 (en) | 2012-01-19 |
Similar Documents
| Publication | Publication Date | Title |
|---|---|---|
| CN103179995A (en) | Iv monitoring by video and image processing | |
| US20110317004A1 (en) | IV Monitoring by Digital Image Processing | |
| US20230419641A1 (en) | Method For Estimating Blood Component Quantities In Surgical Textiles | |
| JP6756713B2 (en) | Determining drug dosage | |
| US20140351073A1 (en) | Enrollment apparatus, system, and method featuring three dimensional camera | |
| US20120230553A1 (en) | Apparatus and method for detecting eye state | |
| CN107073226A (en) | The dose data from medication injection device is recorded using OCR (OCR) | |
| CN113298089A (en) | Venous transfusion liquid level detection method based on image processing | |
| CN108986125B (en) | Object edge extraction method and device and electronic equipment | |
| CN107331118B (en) | Fall detection method and device | |
| CN107403128A (en) | A kind of item identification method and device | |
| CN108171098A (en) | A kind of code detection method and equipment | |
| WO2019061659A1 (en) | Method and device for removing eyeglasses from facial image, and storage medium | |
| Rumi et al. | IoT enabled prescription reading smart medicine dispenser implementing maximally stable extremal regions and OCR | |
| Liong et al. | Automatic surface area and volume prediction on ellipsoidal ham using deep learning | |
| CN107563311A (en) | A kind of contactless rhythm of the heart algorithm in real time based on camera | |
| Zhu | New algorithm of liquid level of infusion bottle based on image processing | |
| US20190303645A1 (en) | Electronic device, iris recognition method and computer-readable medium | |
| JP2016012174A (en) | Intake amount estimation device, intake amount estimation method and program | |
| CN110765815A (en) | Display stand occlusion detection method and device | |
| Charles et al. | Real-time screen reading: reducing domain shift for one-shot learning. | |
| Zhu | The Design and Implementation of Intelligent Transfusion Monitor System Based on Image Processing | |
| EP4156195B1 (en) | Machine learning enabled detection of infusion pump misloads | |
| CN113506309B (en) | Medical data variable measurement monitoring method and system based on artificial intelligence | |
| Yuthong et al. | Lung volume monitoring using flow-oriented incentive spirometer with video processing |
Legal Events
| Date | Code | Title | Description |
|---|---|---|---|
| C06 | Publication | ||
| PB01 | Publication | ||
| C10 | Entry into substantive examination | ||
| SE01 | Entry into force of request for substantive examination | ||
| C02 | Deemed withdrawal of patent application after publication (patent law 2001) | ||
| WD01 | Invention patent application deemed withdrawn after publication |
Application publication date: 20130626 |