CN102800192A - Forecasting method of traffic capacity of bus rapid transit system - Google Patents
Forecasting method of traffic capacity of bus rapid transit system Download PDFInfo
- Publication number
- CN102800192A CN102800192A CN2012102815421A CN201210281542A CN102800192A CN 102800192 A CN102800192 A CN 102800192A CN 2012102815421 A CN2012102815421 A CN 2012102815421A CN 201210281542 A CN201210281542 A CN 201210281542A CN 102800192 A CN102800192 A CN 102800192A
- Authority
- CN
- China
- Prior art keywords
- bus
- traffic capacity
- rapid transit
- transit system
- time
- Prior art date
- Legal status (The legal status is an assumption and is not a legal conclusion. Google has not performed a legal analysis and makes no representation as to the accuracy of the status listed.)
- Granted
Links
Images

Landscapes
- Traffic Control Systems (AREA)
Abstract
The invention discloses a forecasting method of the traffic capacity of a bus rapid transit system. The forecasting method comprises the following steps of: (1) calculating the traffic capacity of the bus rapid transit system according to a formula; (2) comparing the calculated value of the traffic capacity of the bus rapid transit system with an expected value to obtain a difference value; (3) adjusting parameters in the formula according to the difference value; (4) calculating the traffic capacity of the bus rapid transit system after the adjustment; and (5) correspondingly formulating a measure for improving the traffic capacity of the bus rapid transit system according to the calculated traffic capacity of the bus rapid transit system and various parameter set values during calculating the traffic capacity of the bus rapid transit system. According to the method disclosed by the invention, the traffic capacity of the bus rapid transit system can be accurately and quickly forecasted, and various factors influencing the traffic capacity of the bus rapid transit system are accurately and quantitatively determined so as to be used as an important reference for perfecting the planning and the design of the bus rapid transit system and optimizing and promoting the operation efficiency of the bus rapid transit system.
Description
Technical Field
The invention relates to the field of bus rapid transit systems, in particular to a method for predicting the traffic capacity of a bus rapid transit system.
Background
Traffic capacity analysis is a basic theory for planning, designing, operating and evaluating a bus rapid transit system. At present, more than ten cities open and operate the bus rapid transit in China, but the traffic capacity has no scientific and accurate analysis and calculation method, so that part of system facilities and traffic capacity configuration are inconsistent with the passenger flow demand, and the system is over-saturated or idle.
In foreign countries, the study of the traffic capacity of the rapid transit system is first started from the study of the traffic capacity of the ground conventional transit system. The relevant research of the North American area started from the last 60 years, and the maximum passing capacity of the bus operation on the urban road was researched on the basis of observation data in a progress report of the public transport division of the HRB highway traffic capacity committee in 1961. Levinson, Hoey, Levinson and the like further research the rapid bus traffic Capacity and propose a formula for calculating the required station traffic Capacity and parking space demand under the given passenger demand, and the research results are summarized and embodied in transport research and personal computer 212, interface Materials on high way Capacity (TRB, 1980). The 1985 version of the road traffic capacity manual (HCM 1985) improves the original method, and considers the influence of factors such as green light time of each signal period, bus arrival station conditions, effective utilization rate of parking positions and the like on the bus traffic capacity. Marshall et al applied the method of calculating the 1985 version of the manual for road traffic capacity to the streets in Manhattan, and found that multiplying the original formula by a reduction coefficient of 0.833 substantially conforms to the conditions of the streets in Manhattan. St. Jacques, etc. based on the formula, the Transit Capacity of the bus lane of the urban trunk road is further studied by using the actual measurement data and the simulation method in the North America region, and the research results are organized into the Transit Capacity and Quality of service Manual and the road Transit Capacity Manual of version 2000. Subsequently, St. Jacques et al take 6 bus lanes in north america as an example, and have conducted analytical research based on the road traffic capacity manual of version 2000, and updated and perfected the calculation method in the public traffic capacity and service level manual of version 2 published by TRB. In the aspect of special bus rapid transit capacity research, a TCRP report 90: bus rapid transit, volume 2: based on previous research results, the implementation guidelines propose a traffic capacity calculation method (hereinafter referred to as north american model) specifically for rapid transit.
Countries such as brazil and columbia in the ramee area are always concentrated areas for the development of rapid public transportation. Based on the queuing theory model and the actual experience of the Bogoji bus rapid transit system, Brazilian experts propose a corresponding bus rapid transit capacity calculation method, and the method is based on a single stop position transit capacity formula and also provides a corresponding transit capacity calculation method (hereinafter referred to as a Brazilian model) aiming at the forms of a combined line, a primary station, a secondary station and a direct line.
In China, the design Specification of urban public transport stations, fields and factories (CJJ 15-87) issued by the Ministry of urban and rural construction environment protection of the people's republic of China in 1988 stipulates the scale of the transit midway stations under the conditions of different line numbers and vehicle types; wangwei et al think that the traffic capacity of a bus traffic line is limited by the traffic capacity of stations along the line, and the traffic capacity of the stations depends on the time of the bus occupying the stations, and therefore a traffic capacity calculation formula based on the bus stop time is established. In the field of bus rapid transit system traffic capacity research, great waves, tax soldiers, fenders and the like all provide a bus rapid transit traffic capacity analysis method, but due to lack of on-site investigation, the bus rapid transit system traffic capacity analysis method is difficult to be applied to practice due to lack of detailed analysis and parameter setting on the bus rapid transit operation condition. Xukangming and Von Dredging analyze the actual operation conditions of the rapid transit in Beijing, Hangzhou and Kunming places by utilizing the opportunity of participating in the rapid transit planning operation practice in Beijing, Hangzhou and other places, provide a transit capacity calculation method by utilizing a queuing theory model, and calibrate related parameters according to survey data in a plurality of cities. Zhang Xue, Xu\32895in Taiwan province, and proposes a public transport vehicle traffic capacity calculation formula (hereinafter referred to as Taibei model) aiming at the operation condition of a central public transport lane in Taibei city.
Comprehensively, the calculation method of the bus rapid transit capacity which is currently and practically applied at home and abroad comprises a North American model, a Brazil model, a Taipei model and a research method proposed by von Dredging and Xukangming. The North American model is mainly based on the operation characteristics of large operation interval, ideal driving time interval control and low passenger flow total amount of buses in North American regions, the Brazilian model is mainly based on the operation characteristics of a plurality of groups of primary and secondary stations of a station overtaking lane set by a Bogoji rapid bus system, and the Taipei model is calibrated according to the operation condition of a central bus lane in Taipei City. However, through field investigation, the calibration of the three models on factors such as the mean value of the stop time, the fluctuation coefficient of the arrival interval, the traffic capacity and the functional relationship between the station queuing delay and the like is not consistent with the current situation in China, and the theoretically calculated traffic capacity is greatly different from the actual situation of the domestic bus rapid transit operation. In addition, although the research methods proposed by von dredged and xukangming can better reflect the operation conditions of beijing, hangzhou, kunming and the like, the analysis of parameters is not detailed and complete enough due to the limitation of less available survey systems at that time, and therefore, the correspondingly established measures for improving the traffic capacity of the rapid transit system have limited effect on improving the efficiency of the rapid transit system.
Therefore, there is a need to provide an improved method for predicting the transit capacity of a bus rapid transit system that overcomes the above-mentioned deficiencies.
Disclosure of Invention
The invention aims to provide a method for predicting the traffic capacity of a rapid public transport system, which can accurately measure and calculate the traffic capacity of the rapid public transport system and accurately and quantitatively determine various factors influencing the traffic capacity of the rapid public transport system, thereby being used as an important basis for perfecting the planning and design of the rapid public transport system and optimizing and improving the operation efficiency of the rapid public transport system.
In order to achieve the aim, the invention provides a method for predicting the traffic capacity of a bus rapid transit system, which comprises the following steps:
(1) calculating the traffic capacity of the rapid public transportation system according to a formula:
wherein,
in the formula (I), C is the traffic capacity of the bus rapid transit system, and the unit is human/hour; n is a radical ofbA number of valid parking bits; w is bus arrival queuing delay time corresponding to a certain saturation, and the unit is second; c. CpThe passenger traffic capacity of a parking position under a certain saturation degree is expressed in units of people/hour; f. oflThe average full load rate of the bus passing through within one hour; t is tcThe unit time is the saturated locomotive time interval between the departure of the front vehicle and the arrival of the rear vehicle; t is t0The unit of second is the time for opening and closing the vehicle door; t is tdThe total time of the most busy car door for ascending and descending is unit second; c. CaThe bus arrival interval fluctuation coefficient is obtained; c. CsThe bus stop time fluctuation coefficient is obtained;
in the formula (II), p is the number of passengers on/off the bus; the ratio of the number of the ith door to the total number of the vehicle is shown, wherein i is a natural number; t is tbGetting on and off the bus for the average person; theta1Forming a proportion correction coefficient for the passenger flow of getting on and off the bus; theta2Correcting the coefficient for the passenger density in the standing area in the vehicle; theta3Passenger behavior characteristic correction coefficients;
(2) comparing the calculated value of the traffic capacity of the bus rapid transit system with an expected value to obtain a difference value, entering the step (3) when the difference value is smaller than zero, entering the step (4) when the difference value is larger than zero, and entering the step (5) when the difference value is zero;
(3) adjusting the total time t for the heaviest door to ascend and descenddTime t for getting on or off on average of peoplebPassenger traffic capacity c of a parking space at a certain saturationpNumber of effective parking positions NbBus stop time fluctuation coefficient csAnd bus arrival interval fluctuation coefficient caThe specific adjustment mode of one or more numerical values is as follows: reducing the total time t for the most busy door to ascend and descenddReducing the time t for getting on and off the bus on the per-capita basisbIncreasing passenger traffic capacity c of a parking space at a certain saturationpIncreasing the number of effective parking bits NbReducing the bus stop time fluctuation coefficient csReducing the fluctuation coefficient c of the arrival interval of the busaThen, returning to the step (1),calculating the traffic capacity of the adjusted bus rapid transit system;
(4) adjusting the total time t for the heaviest door to ascend and descenddTime t for getting on or off on average of peoplebPassenger traffic capacity c of a parking space at a certain saturationpNumber of effective parking positions NbBus stop time fluctuation coefficient csAnd bus arrival interval fluctuation coefficient caThe specific adjustment mode of one or more numerical values is as follows: increasing the total time t for the heaviest door to ascend and descenddIncreasing the time t for getting on or off the bus on the basis of the average number of peoplebReducing passenger traffic capacity c of a parking space at a certain saturationpReducing the number of active parking bits NbIncreasing the bus stop time fluctuation coefficient csIncreasing the bus arrival interval fluctuation coefficient caThen, returning to the step (1), and calculating the traffic capacity of the adjusted bus rapid transit system;
(5) and correspondingly making measures for improving the traffic capacity of the bus rapid transit system according to the calculated traffic capacity of the bus rapid transit system and the set values of the parameters when the traffic capacity of the bus rapid transit system is calculated.
Compared with the prior art, the invention has the following beneficial effects:
1. the parameters considered by the prediction method of the invention comprise vehicle stop time and distribution, vehicle arrival interval distribution, station effective stop number, vehicle arrival average queuing delay, vehicle passenger capacity and the like, and the parameters comprehensively reflect various influence factors of the traffic capacity of the rapid transit system, such as station passenger flow distribution, ticket selling and checking forms, whether to ascend and descend horizontally, station scale and layout, platform forms, vehicle type selection, operation organization forms, traffic organization along the rapid transit corridor and design station delay and the like, so the prediction method of the invention can accurately calculate and predict the traffic capacity of the rapid transit system and play the following roles: (1) the method comprises the steps of guiding the planning, design and operation of the bus rapid transit system, reasonably determining the facility equipment type selection and station scale of the bus rapid transit system, matching the bus rapid transit characteristic form with the actual function, and avoiding the problem of system oversaturation or idling caused by improper traffic capacity measurement and calculation; (2) the traffic capacity of the built rapid public transport system can be accurately calculated, weak links influencing the traffic capacity of the system are found, the weak links are optimized and improved in a targeted manner, the traffic capacity of the system is improved, and long-term overload operation and service level reduction of the system are avoided; (3) the prediction method of the invention relates to the aspects of vehicle type selection, station design, ticket selling and checking mode selection, operation organization planning and the like, and can be used as an important reference for planning, designing, operating and optimizing a conventional public transportation system and a public transportation lane system.
2. The forecasting method also considers the subtle factors closely related to the time of getting on or off the bus by the people, such as whether the density of passengers in the bus is saturated, whether the passengers are mainly getting on or off the bus, whether the passengers generally carry luggage, and the like, wherein the time of getting on or off the bus by the people is closely related to the direct variable influencing the stopping time, and the stopping time of the bus is the variable influencing the most obvious traffic capacity, so that the forecasting method can better distinguish and reflect different operating environments, and the traffic capacity of the rapid transit system is more accurately measured and calculated.
The invention will become more apparent from the following description when taken in conjunction with the accompanying drawings, which illustrate embodiments of the invention.
Drawings
FIG. 1 is a flow chart of a method for predicting the traffic capacity of a bus rapid transit system according to the invention.
Detailed Description
Embodiments of the present invention will now be described with reference to the drawings, wherein like element numerals represent like elements.
As shown in fig. 1, the method for predicting the traffic capacity of the bus rapid transit system in the embodiment includes the following steps:
step S1: calculating the traffic capacity of the rapid public transportation system according to a formula:
wherein,
in the formula (I), C is the traffic capacity of the bus rapid transit system, and the unit is human/hour; n is a radical ofbA number of valid parking bits; w is bus arrival queuing delay time with certain saturation, and the unit is second; c. CpThe passenger traffic capacity of a parking position under a certain saturation degree is expressed in units of people/hour; f. oflThe average full load rate of the bus passing through within one hour; t is tcThe time interval of a saturated locomotive between the departure of a front vehicle and the arrival of a rear vehicle is unit second; t is t0The unit of second is the time for opening and closing the vehicle door; t is tdThe total time of the most busy car door for ascending and descending is unit second; c. CaThe bus arrival interval fluctuation coefficient is obtained; c. CsThe bus stop time fluctuation coefficient is obtained;
in the formula (II), p is the number of passengers on/off the bus; the ratio of the number of the ith door to the total number of the vehicle is shown, wherein i is a natural number; t is tbGetting on and off the bus for the average person; theta1Forming a proportion correction coefficient for the passenger flow of getting on and off the bus; theta2Correcting the coefficient for the passenger density in the standing area in the vehicle; theta3And correcting the passenger behavior characteristic.
In particular, for a rectilinear docking station with docking stations arranged in close proximity, NbThe number of valid parking bits is calibrated with reference to Table 1. For the primary and secondary stations with a plurality of independent parking areas, when the distance between the primary and secondary stations is far enough, the mutual interference between the incoming and outgoing stations of buses in each parking area can not be caused, the number N of effective parking positionsbCan be regarded as the algebraic sum of the number of valid parking bits for each parking area.
TABLE 1Number of valid parking bits NbValue taking
| Number of parking positions | Number of valid parking bits Nb |
| 1 | 1.00 |
| 2 | 1.80 |
| 3 | 2.27 |
| 4 | 2.61 |
| 5 | 2.87 |
The bus arrival queuing delay time W with a certain saturation depends on the service level planned to be reached by the system. The larger the value of W, the more congested the system and the lower the operating speed, but the greater the traffic capacity, and vice versa. According to the investigation of city rapid public transportation systems such as Guangzhou, Changzhou, Zhengzhou, Beijing, Xiamen and the like, the value of W is suggested to be set to be about 10 seconds. Passenger traffic capacity c of a parking space at a certain saturationpAnd calibration, wherein in view of two vehicle types of a 12-meter single vehicle and an 18-meter articulated vehicle, the vehicle type can be calibrated according to 80-100 persons of the 12-meter single vehicle and 140-160 persons of the 18-meter articulated vehicle according to actual investigation. The other vehicle types can be according to the technical parameters provided by manufacturers andand calibrating actual operation survey data.
Average full load rate f of passing bus in periodlThe value of (2) is 0.8-0.9, the operation interval is stable, and the high value is taken when the passenger flow reaches the line with uniform distribution, otherwise, the low value is taken.
Time interval t of saturated locomotive between front vehicle leaving station and rear vehicle entering stationcAnd in the calibration process, the station-entering saturated headway of a single locomotive of 12 meters is 6-8 seconds, and the station-entering saturated headway of an articulated locomotive of 18 meters is 10-12 seconds.
Time t for opening and closing vehicle door0The value of (1) is 4-6 seconds.
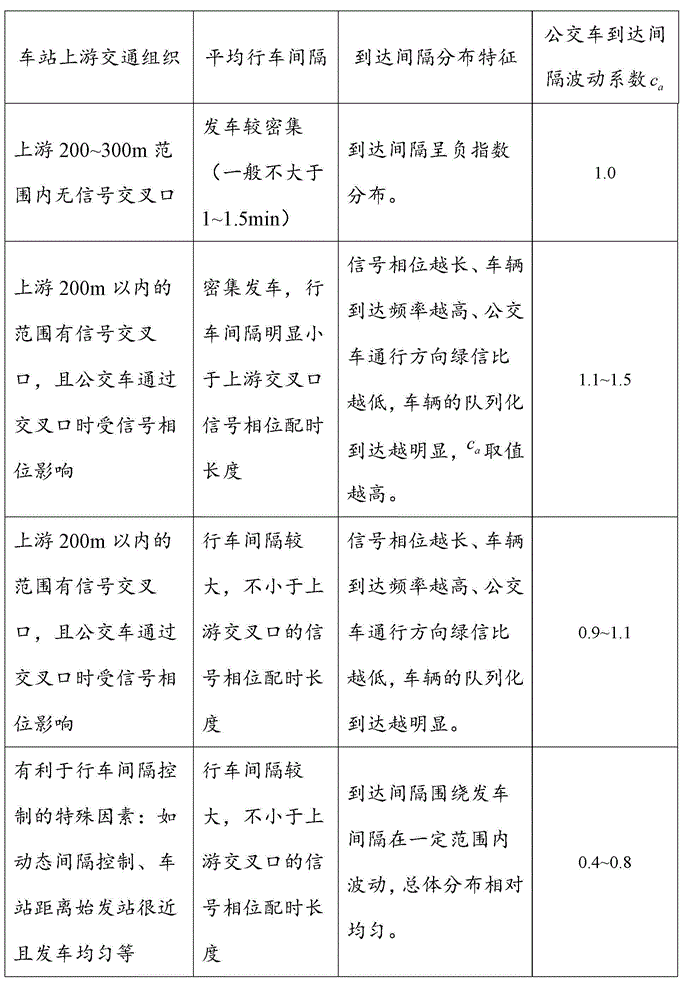
Bus arrival interval fluctuation coefficient caThe calibration can be made with reference to table 2.
TABLE 2 bus arrival interval fluctuation coefficient caValue taking
Bus stop time fluctuation coefficient csAnd (4) calibrating by referring to the following conditions, wherein the larger the parameter value is, the more obvious the fluctuation of the docking time is:
in the first case: the value of a station which has few passing lines and stable landing passenger flow and implements simultaneous landing of a plurality of doors is 0.15-0.25;
in the second case: the value of a system which has a plurality of passing lines, large difference of boarding and alighting passenger flow among the lines, unstable boarding passenger flow and front door card swiping/coin inserting boarding is 0.35-0.40;
in the third case: a typical closed or semi-closed bus rapid transit system may default to 0.30.
The value of the number p of passengers boarding and alighting a bus is determined according to passenger flow prediction or a passenger flow investigation report.
The value of the proportion of the number of the landing people of the ith car door to the number of the landing people of the whole car is calibrated by referring to a table 3:
TABLE 3 vehicle door boarding/alighting passenger ratio Value of (multiple doors simultaneously landing)

Time t for getting on or off on average basisbThe values are calibrated with reference to table 4:
TABLE 4 time t for getting on or off the bus on average basisbValue of (traffic is mainly in the bus)

Correction coefficient theta for forming proportion of passenger flow for getting on or off bus1The values are calibrated with reference to table 5:
TABLE 5 correction factor θ for passenger flow ascending and descending proportion1Value of
| Passenger flow landing distribution characteristics | Mainly for getting on the vehicle | Balance of getting on and off the bus | Get-off is the main |
| Correction of passenger flow ascending and descending proportionCoefficient theta1 | 1.0 | 1.1 | 0.8 |
Note: the number of the passengers getting on the bus is more than 70% of the total number of the passengers getting on and off the bus; the boarding and alighting balance means that the number of boarding people accounts for 30-70% of the total number of boarding and alighting people; the main getting-off means that the number of people getting on the vehicle is less than 30% of the total number of people getting on and off the vehicle.
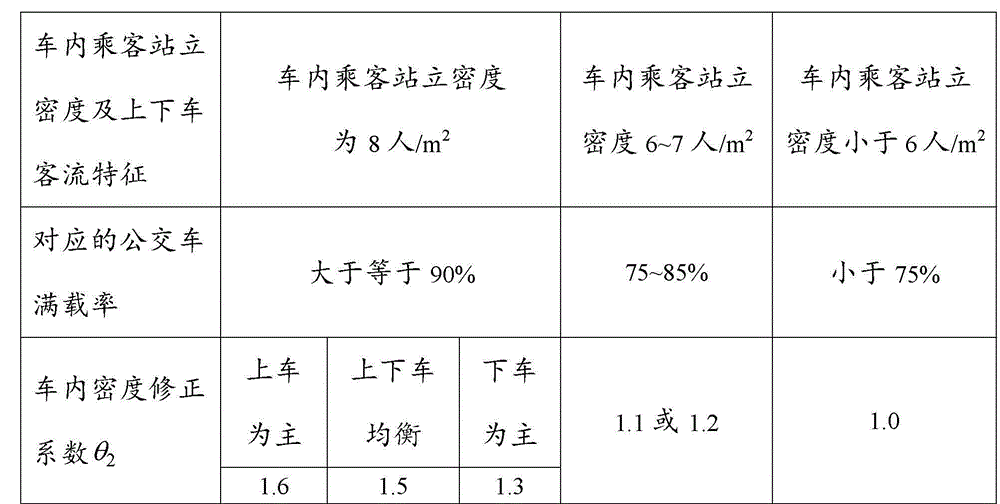
Passenger density correction coefficient theta of in-vehicle standing area2The values are calibrated by referring to the table 6:
TABLE 6 vehicle interior Density correction factor θ2Value of
Passenger behavior characteristic correction coefficient theta3For stations such as railway stations, long-distance bus stations and wholesale markets which carry luggage and passengers in a large proportion, the number of the luggage and the number of the passengers is 1.1-1.2, and the number of the passengers is 1.0 in other cases.
It should be noted that the above parameters are calibrated after investigation and analysis of typical national rapid transit systems (Beijing, Xiamen, Changzhou, Zhengzhou, Kunming, Guangzhou), and meet the reality of Chinese cities, so the calculated traffic capacity of the rapid transit system is relatively accurate.
Step S2: comparing the calculated value of the traffic capacity of the bus rapid transit system with an expected value to obtain a difference value, entering a step S3 when the difference value is smaller than zero, entering a step S4 when the difference value is larger than zero, and entering a step S5 when the difference value is zero;
in this step, the expected value of the traffic capacity calculation is determined according to the passenger flow demand obtained through investigation or prediction, if a certain corridor plans to implement the bus rapid transit, the predicted passenger flow of the bus rapid transit in the planning period in the corridor section peak hour is 2 ten thousand times/hour, and the expected value of the bus rapid transit traffic capacity calculation is 2 ten thousand times/hour. That is, the desired value of the traffic capacity value should be able to meet the traffic demand.
Step S3: adjusting the total time t for the heaviest door to ascend and descenddTime t for getting on or off on average of peoplebPassenger traffic capacity c of a parking space at a certain saturationpNumber of effective parking positions NbBus stop time fluctuation coefficient csAnd bus arrival interval fluctuation coefficient caThe specific adjustment mode of one or more numerical values is as follows: reducing the total time t for the most busy door to ascend and descenddReducing the time t for getting on and off the bus on the per-capita basisbIncreasing passenger traffic capacity c of a parking space at a certain saturationpIncreasing the number of effective parking bits NbReducing the bus stop time fluctuation coefficient csReducing the fluctuation coefficient c of the arrival interval of the busaThen, returning to the step S1, and calculating the adjusted traffic capacity of the bus rapid transit system;
step S4: adjusting the total time t for the heaviest door to ascend and descenddTime t for getting on or off on average of peoplebPassenger traffic capacity c of a parking space at a certain saturationpNumber of effective parking positions NbBus stop time fluctuation coefficient csAnd bus arrival interval fluctuation coefficient caThe specific adjustment mode of one or more numerical values is as follows: increasing the total time t for the heaviest door to ascend and descenddIncreasing the time t for getting on or off the bus on the basis of the average number of peoplebReducing passenger traffic capacity c of a parking space at a certain saturationpReducing the number of active parking bits NbIncreasing the bus stop time fluctuation coefficient csIncreasing the bus arrival interval fluctuation coefficient caThen, returning to the step S1, and calculating the adjusted traffic capacity of the bus rapid transit system;
step S5: and correspondingly making measures for improving the traffic capacity of the bus rapid transit system according to the calculated traffic capacity of the bus rapid transit system and the set values of the parameters when the traffic capacity of the bus rapid transit system is calculated.
In step S5, the measures can be made with reference to the following table:

the present invention has been described in connection with the preferred embodiments, but the present invention is not limited to the embodiments disclosed above, and is intended to cover various modifications, equivalent combinations, which are made in accordance with the spirit of the present invention.
Claims (1)
1. A method for predicting the traffic capacity of a bus rapid transit system comprises the following steps:
(1) calculating the traffic capacity of the rapid public transportation system according to a formula:
wherein,
in the formula (I), C is the traffic capacity of the bus rapid transit system, and the unit is human/hour; n is a radical ofbA number of valid parking bits; w is constantThe bus arrival queuing delay time corresponding to the saturation is in seconds; c. CpThe passenger traffic capacity of a parking position under a certain saturation degree is expressed in units of people/hour; f. oflThe average full load rate of the bus passing through within one hour; t is tcThe unit time is the saturated locomotive time interval between the departure of the front vehicle and the arrival of the rear vehicle; t is t0The unit of second is the time for opening and closing the vehicle door; t is tdThe total time of the most busy car door for ascending and descending is unit second; c. CaThe bus arrival interval fluctuation coefficient is obtained; c. CsThe bus stop time fluctuation coefficient is obtained;
in the formula (II), p is the number of passengers on/off the bus; the ratio of the number of the ith door to the total number of the vehicle is shown, wherein i is a natural number; t is tbGetting on and off the bus for the average person; theta1Forming a proportion correction coefficient for the passenger flow of getting on and off the bus; theta2Correcting the coefficient for the passenger density in the standing area in the vehicle; theta3Passenger behavior characteristic correction coefficients;
(2) comparing the calculated value of the traffic capacity of the bus rapid transit system with an expected value to obtain a difference value, entering the step (3) when the difference value is smaller than zero, entering the step (4) when the difference value is larger than zero, and entering the step (5) when the difference value is zero;
(3) adjusting the total time t for the heaviest door to ascend and descenddTime t for getting on or off on average of peoplebPassenger traffic capacity c of a parking space at a certain saturationpNumber of effective parking positions NbBus stop time fluctuation coefficient csAnd bus arrival interval fluctuation coefficient caThe specific adjustment mode of one or more numerical values is as follows: reducing the total time t for the most busy door to ascend and descenddReducing the time t for getting on and off the bus on the per-capita basisbIncreasing passenger traffic capacity c of a parking space at a certain saturationpIncreasing the number of effective parking bits NbReducing the bus stop time fluctuation coefficient csReducing the fluctuation coefficient c of the arrival interval of the busaThen, returning to step (1) Calculating the traffic capacity of the adjusted bus rapid transit system;
(4) adjusting the total time t for the heaviest door to ascend and descenddTime t for getting on or off on average of peoplebPassenger traffic capacity c of a parking space at a certain saturationpNumber of effective parking positions NbBus stop time fluctuation coefficient csAnd bus arrival interval fluctuation coefficient caThe specific adjustment mode of one or more numerical values is as follows: increasing the total time t for the heaviest door to ascend and descenddIncreasing the time t for getting on or off the bus on the basis of the average number of peoplebReducing passenger traffic capacity c of a parking space at a certain saturationpReducing the number of active parking bits NbIncreasing the bus stop time fluctuation coefficient csIncreasing the bus arrival interval fluctuation coefficient caThen, returning to the step (1), and calculating the traffic capacity of the adjusted bus rapid transit system;
(5) and correspondingly making measures for improving the traffic capacity of the bus rapid transit system according to the calculated traffic capacity of the bus rapid transit system and the set values of the parameters when the traffic capacity of the bus rapid transit system is calculated.
Priority Applications (1)
| Application Number | Priority Date | Filing Date | Title |
|---|---|---|---|
| CN201210281542.1A CN102800192B (en) | 2012-08-09 | 2012-08-09 | Forecasting method of traffic capacity of bus rapid transit system |
Applications Claiming Priority (1)
| Application Number | Priority Date | Filing Date | Title |
|---|---|---|---|
| CN201210281542.1A CN102800192B (en) | 2012-08-09 | 2012-08-09 | Forecasting method of traffic capacity of bus rapid transit system |
Publications (2)
| Publication Number | Publication Date |
|---|---|
| CN102800192A true CN102800192A (en) | 2012-11-28 |
| CN102800192B CN102800192B (en) | 2015-04-08 |
Family
ID=47199285
Family Applications (1)
| Application Number | Title | Priority Date | Filing Date |
|---|---|---|---|
| CN201210281542.1A Active CN102800192B (en) | 2012-08-09 | 2012-08-09 | Forecasting method of traffic capacity of bus rapid transit system |
Country Status (1)
| Country | Link |
|---|---|
| CN (1) | CN102800192B (en) |
Cited By (6)
| Publication number | Priority date | Publication date | Assignee | Title |
|---|---|---|---|---|
| CN104992555A (en) * | 2015-07-22 | 2015-10-21 | 济南市市政工程设计研究院(集团)有限责任公司 | Rail station linkage facility bus stop scale prediction method |
| CN105427605A (en) * | 2015-12-23 | 2016-03-23 | 山东理工大学 | Method for efficiency calculation of setting of bus transit lane with consideration of transportation means transfer |
| CN106997667A (en) * | 2017-04-18 | 2017-08-01 | 北京博研智通科技有限公司 | Utilize the method and system of mobile phone mobile data quantitative assessment bus zone efficiency |
| CN107066723A (en) * | 2017-04-10 | 2017-08-18 | 东南大学 | A kind of bus passenger based on social force model is got on or off the bus behavior simulation method |
| CN109461305A (en) * | 2018-11-16 | 2019-03-12 | 浩鲸云计算科技股份有限公司 | A kind of calculation method of the bus stop traffic capacity |
| CN116580557A (en) * | 2023-05-12 | 2023-08-11 | 杭州图软科技有限公司 | Bus stop traffic capacity prediction method based on video analysis |
Citations (5)
| Publication number | Priority date | Publication date | Assignee | Title |
|---|---|---|---|---|
| US20050140523A1 (en) * | 2003-12-24 | 2005-06-30 | Publicover Mark W. | Traffic management device and system |
| JP2008046998A (en) * | 2006-08-19 | 2008-02-28 | Masahiro Watanabe | Route bus operation management method |
| CN101930670A (en) * | 2010-08-12 | 2010-12-29 | 东南大学 | Prediction method of running time of social vehicles in public transport section |
| CN102157062A (en) * | 2011-04-19 | 2011-08-17 | 东南大学 | Method for acquiring traffic capacity of stop on bus lane |
| CN102184639A (en) * | 2011-05-03 | 2011-09-14 | 东南大学 | Method for illustrating bus-only lane interval operation capacity |
-
2012
- 2012-08-09 CN CN201210281542.1A patent/CN102800192B/en active Active
Patent Citations (5)
| Publication number | Priority date | Publication date | Assignee | Title |
|---|---|---|---|---|
| US20050140523A1 (en) * | 2003-12-24 | 2005-06-30 | Publicover Mark W. | Traffic management device and system |
| JP2008046998A (en) * | 2006-08-19 | 2008-02-28 | Masahiro Watanabe | Route bus operation management method |
| CN101930670A (en) * | 2010-08-12 | 2010-12-29 | 东南大学 | Prediction method of running time of social vehicles in public transport section |
| CN102157062A (en) * | 2011-04-19 | 2011-08-17 | 东南大学 | Method for acquiring traffic capacity of stop on bus lane |
| CN102184639A (en) * | 2011-05-03 | 2011-09-14 | 东南大学 | Method for illustrating bus-only lane interval operation capacity |
Non-Patent Citations (3)
| Title |
|---|
| 冯浚 等: "快速公交系统通行能力计算方法研究", 《城市交通》, vol. 5, no. 5, 31 October 2007 (2007-10-31), pages 81 - 86 * |
| 冯浚: "快速公交通行能力研究", 《中国优秀硕士学位论文全文数据库工程科技Ⅱ辑》, no. 02, 15 February 2010 (2010-02-15), pages 034 - 355 * |
| 高奇修: "BRT通行能力应用研究", 《山西建筑》, vol. 35, no. 21, 31 July 2009 (2009-07-31), pages 259 - 260 * |
Cited By (9)
| Publication number | Priority date | Publication date | Assignee | Title |
|---|---|---|---|---|
| CN104992555A (en) * | 2015-07-22 | 2015-10-21 | 济南市市政工程设计研究院(集团)有限责任公司 | Rail station linkage facility bus stop scale prediction method |
| CN104992555B (en) * | 2015-07-22 | 2018-02-06 | 济南市市政工程设计研究院(集团)有限责任公司 | A kind of urban railway station is connected facility bus stop scale forecast method |
| CN105427605A (en) * | 2015-12-23 | 2016-03-23 | 山东理工大学 | Method for efficiency calculation of setting of bus transit lane with consideration of transportation means transfer |
| CN107066723A (en) * | 2017-04-10 | 2017-08-18 | 东南大学 | A kind of bus passenger based on social force model is got on or off the bus behavior simulation method |
| CN107066723B (en) * | 2017-04-10 | 2020-06-09 | 东南大学 | Bus passenger getting-on and getting-off behavior simulation method based on social force model |
| CN106997667A (en) * | 2017-04-18 | 2017-08-01 | 北京博研智通科技有限公司 | Utilize the method and system of mobile phone mobile data quantitative assessment bus zone efficiency |
| CN109461305A (en) * | 2018-11-16 | 2019-03-12 | 浩鲸云计算科技股份有限公司 | A kind of calculation method of the bus stop traffic capacity |
| CN116580557A (en) * | 2023-05-12 | 2023-08-11 | 杭州图软科技有限公司 | Bus stop traffic capacity prediction method based on video analysis |
| CN116580557B (en) * | 2023-05-12 | 2025-09-23 | 杭州图软科技有限公司 | Bus stop capacity prediction method based on video analysis |
Also Published As
| Publication number | Publication date |
|---|---|
| CN102800192B (en) | 2015-04-08 |
Similar Documents
| Publication | Publication Date | Title |
|---|---|---|
| CN102800192B (en) | Forecasting method of traffic capacity of bus rapid transit system | |
| CN103279669B (en) | A kind of transport capacity of urban rail transit network emulated computation method and system | |
| CN101944288B (en) | Setting method of stops on urban bus lines | |
| CN104320789B (en) | Game theory-based vehicle networking RSU optimal configuration method | |
| CN106781499B (en) | A Traffic Network Efficiency Evaluation System | |
| CN106504528A (en) | A kind of utilization mobile phone signaling big data and the OD scaling methods of Used in Dynamic Traffic Assignment | |
| CN105160449A (en) | Electric automobile charging pile optimization layout method | |
| CN102024206A (en) | Method for predicting suburban rail transit passenger flow | |
| CN102156790A (en) | Method for designing main road multifunctional lane of express way based on delay and traffic capacity | |
| CN103761589A (en) | Distribution method for urban rail transit | |
| CN103778299A (en) | Dynamic traffic flow based forecast method of noise in peripheral zone of long straight road | |
| Ukkusuri et al. | Assessing the impact of urban off-hour delivery program using city scale simulation models | |
| CN106682812A (en) | Comprehensive transport system passenger transport mode sharing rate-distance transfer curve determination method | |
| CN103218668A (en) | County-level road accident forecasting method based on geographic weighting Poisson regression | |
| CN104731853B (en) | A kind of bus passenger flow spatial and temporal distributions emulation mode and analogue system based on individual activity chain | |
| CN109615208B (en) | Method for solving traffic jam problem of urban road | |
| CN106571032A (en) | OD calibration method using mobile phone signaling big data and dynamic traffic assignment | |
| CN105608502A (en) | Prediction method for stopping time in bus stop based on regression fitting | |
| CN103310120B (en) | A kind of method determining section congestion-pricing rate based on level of service | |
| Tan et al. | Improved BPR function to counter road impedance through OD matrix estimation of freight transportation | |
| CN107480330A (en) | A kind of calculating of the lane side traffic capacity, improved method | |
| CN102593901B (en) | Load forecasting system of electromobile charging facility and forecasting method | |
| CN106803227A (en) | A kind of public transport OD analysis methods of the main volume of the flow of passengers based on public transport vehicle-mounted gps data | |
| CN120218298A (en) | A method for optimizing transfer connections between regional hubs and urban rail transit | |
| Noland et al. | Induced travel: A review of recent literature and the implications for transportation and environmental policy |
Legal Events
| Date | Code | Title | Description |
|---|---|---|---|
| C06 | Publication | ||
| PB01 | Publication | ||
| C10 | Entry into substantive examination | ||
| SE01 | Entry into force of request for substantive examination | ||
| C14 | Grant of patent or utility model | ||
| GR01 | Patent grant |