CN102170581B - Human-visual-system (HVS)-based structural similarity (SSIM) and characteristic matching three-dimensional image quality evaluation method - Google Patents
Human-visual-system (HVS)-based structural similarity (SSIM) and characteristic matching three-dimensional image quality evaluation method Download PDFInfo
- Publication number
- CN102170581B CN102170581B CN 201110115808 CN201110115808A CN102170581B CN 102170581 B CN102170581 B CN 102170581B CN 201110115808 CN201110115808 CN 201110115808 CN 201110115808 A CN201110115808 A CN 201110115808A CN 102170581 B CN102170581 B CN 102170581B
- Authority
- CN
- China
- Prior art keywords
- image
- test
- brightness
- index
- view
- Prior art date
- Legal status (The legal status is an assumption and is not a legal conclusion. Google has not performed a legal analysis and makes no representation as to the accuracy of the status listed.)
- Expired - Fee Related
Links
- 238000000034 method Methods 0.000 title claims abstract description 47
- 238000013441 quality evaluation Methods 0.000 title claims abstract description 27
- 238000012360 testing method Methods 0.000 claims abstract description 118
- 238000011156 evaluation Methods 0.000 claims abstract description 74
- 230000000007 visual effect Effects 0.000 claims abstract description 20
- 238000000354 decomposition reaction Methods 0.000 claims abstract description 11
- 230000006870 function Effects 0.000 claims description 22
- 230000014509 gene expression Effects 0.000 claims description 18
- 230000035945 sensitivity Effects 0.000 claims description 13
- 238000004364 calculation method Methods 0.000 claims description 10
- 238000010606 normalization Methods 0.000 claims description 5
- 230000000694 effects Effects 0.000 claims description 4
- 238000005259 measurement Methods 0.000 claims description 4
- NAWXUBYGYWOOIX-SFHVURJKSA-N (2s)-2-[[4-[2-(2,4-diaminoquinazolin-6-yl)ethyl]benzoyl]amino]-4-methylidenepentanedioic acid Chemical compound C1=CC2=NC(N)=NC(N)=C2C=C1CCC1=CC=C(C(=O)N[C@@H](CC(=C)C(O)=O)C(O)=O)C=C1 NAWXUBYGYWOOIX-SFHVURJKSA-N 0.000 claims description 3
- 230000008447 perception Effects 0.000 claims description 3
- 238000012545 processing Methods 0.000 claims description 3
- 230000009466 transformation Effects 0.000 claims description 2
- 238000007781 pre-processing Methods 0.000 claims 1
- 238000004422 calculation algorithm Methods 0.000 abstract description 11
- 230000006835 compression Effects 0.000 abstract description 6
- 238000007906 compression Methods 0.000 abstract description 6
- 230000006378 damage Effects 0.000 abstract description 4
- 230000005540 biological transmission Effects 0.000 abstract description 2
- 239000011159 matrix material Substances 0.000 description 20
- 239000000284 extract Substances 0.000 description 18
- 230000008569 process Effects 0.000 description 11
- 238000013461 design Methods 0.000 description 9
- 238000000605 extraction Methods 0.000 description 7
- 238000006243 chemical reaction Methods 0.000 description 6
- 230000008878 coupling Effects 0.000 description 6
- 238000010168 coupling process Methods 0.000 description 6
- 238000005859 coupling reaction Methods 0.000 description 6
- 230000035807 sensation Effects 0.000 description 6
- 238000004088 simulation Methods 0.000 description 6
- 238000000205 computational method Methods 0.000 description 5
- 239000004744 fabric Substances 0.000 description 5
- 238000005311 autocorrelation function Methods 0.000 description 4
- 238000001914 filtration Methods 0.000 description 4
- 230000000052 comparative effect Effects 0.000 description 3
- 238000013519 translation Methods 0.000 description 3
- YBJHBAHKTGYVGT-ZKWXMUAHSA-N (+)-Biotin Chemical compound N1C(=O)N[C@@H]2[C@H](CCCCC(=O)O)SC[C@@H]21 YBJHBAHKTGYVGT-ZKWXMUAHSA-N 0.000 description 2
- 239000006002 Pepper Substances 0.000 description 2
- 230000000903 blocking effect Effects 0.000 description 2
- 238000010586 diagram Methods 0.000 description 2
- 238000005516 engineering process Methods 0.000 description 2
- 230000010354 integration Effects 0.000 description 2
- 238000001303 quality assessment method Methods 0.000 description 2
- 238000004064 recycling Methods 0.000 description 2
- 230000000638 stimulation Effects 0.000 description 2
- FEPMHVLSLDOMQC-UHFFFAOYSA-N virginiamycin-S1 Natural products CC1OC(=O)C(C=2C=CC=CC=2)NC(=O)C2CC(=O)CCN2C(=O)C(CC=2C=CC=CC=2)N(C)C(=O)C2CCCN2C(=O)C(CC)NC(=O)C1NC(=O)C1=NC=CC=C1O FEPMHVLSLDOMQC-UHFFFAOYSA-N 0.000 description 2
- 208000027418 Wounds and injury Diseases 0.000 description 1
- 230000008859 change Effects 0.000 description 1
- 230000019771 cognition Effects 0.000 description 1
- 238000013527 convolutional neural network Methods 0.000 description 1
- 230000007812 deficiency Effects 0.000 description 1
- 230000002950 deficient Effects 0.000 description 1
- 230000000368 destabilizing effect Effects 0.000 description 1
- 238000001678 elastic recoil detection analysis Methods 0.000 description 1
- 238000002474 experimental method Methods 0.000 description 1
- 238000012812 general test Methods 0.000 description 1
- 208000014674 injury Diseases 0.000 description 1
- 230000003993 interaction Effects 0.000 description 1
- 230000007246 mechanism Effects 0.000 description 1
- 238000005457 optimization Methods 0.000 description 1
- 230000001105 regulatory effect Effects 0.000 description 1
- 238000009877 rendering Methods 0.000 description 1
- 230000004044 response Effects 0.000 description 1
- 238000004335 scaling law Methods 0.000 description 1
- 230000014616 translation Effects 0.000 description 1
Images


Landscapes
- Image Analysis (AREA)
Abstract
The invention relates to image quality evaluation. To show the fidelity and third dimension of a generated three-dimensional image, the degree of damages of a compression algorithm to the three-dimensional image, the degree of interference of noises introduced by a transmission process on the quality of the three-dimensional image, the display naturalness of the three-dimensional image, and the like, the technical scheme adopted by the invention is that: a human-visual-system (HVS)-based structural similarity (SSIM) and characteristic matching three-dimensional image quality evaluation method comprises the following steps of: (1) comparing the luminance, contrast and structural similarity of left and right views of an original image with those of the left and right views of a test image by using a structure distortion method; (2) extracting luminance and contrast indexes; (3) simulating a human eye band-pass property principle according to wavelet decomposition to obtain a human visual signal to noise ratio evaluation index; (4) reflecting the third dimension of the three-dimensional image by using the ratio of number of left and right view matching points of the test image to the number of the left and right view matching points of the original image; and (5) rationally weighting all the indexes to obtain an overall evaluation index. The method is mainly applied to the image quality evaluation.
Description
Technical field
The present invention relates to image quality evaluation, 3D rendering and process, specifically based on SSIM and the characteristic matching stereo image quality evaluation method of HVS.
Background technology
Pieter proposes 3DTV subjective quality assessment method, points out whether exist from picture quality, picture depth, third dimension level of comfort, third dimension, whether whether nature, third dimension meet the aspect such as visual experience and estimate third dimension; Patrizio has proposed a kind of stereo-picture subjective quality assessment method, and the measured wears anaglyph spectacles, uses France Telecom R﹠amp; The SEOVQ of D (France Telecom) (subjective evaluation of video quality and optimization) human-computer interaction interface carries out the subjectivity evaluation and test, and represents evaluation result with mean difference mark (DMOS).Subjective evaluation method is consuming time, consumption power, and has certain destabilizing factor; Patrizio etc. propose again a plurality of two dimensional image evaluation index SSIM (structural similarity index), UQI (quality index that Universal Quality Index is traditional), RRIQA (reducing the quality evaluation of reference picture) are used for the evaluation of stereoscopic image, on the basis of having estimated respectively left and right picture quality, provide evaluation result with the method for weighted sum.This method has reference value, but does not consider corresponding stereoscopic vision mechanism; Alexandre has proposed a kind of three-dimensional image objective quality evaluation method based on parallax, calculate respectively plane picture quality distortion and parallax distortion, and then with the two weighting, the parallax distortion by original image to drawing with the Calculation of correlation factor of test pattern to depth map, the plane picture quality distortion utilizes the plane picture evaluation method to calculate respectively distortion index between left image and right image, obtain again mean value, but, in the method for Alexandre with original image to test pattern the coefficient correlation of depth map being characterized the steric information feature, a general cognition can only be provided from the angle of view picture figure, the impact that local parallax distortion brings to image quality evaluation can not be significantly reflected; University Of Ningbo has proposed a kind of three-dimensional right image quality evaluating method based on similarity, and the method is with the quality evaluation of parallax for right image, and its essence has only been estimated single view picture quality, is not stereo image quality evaluation truly.
Summary of the invention
For overcoming the deficiencies in the prior art, a kind of SSIM based on HVS and characteristic matching stereo image quality evaluation method are provided, be used for illustrating that the degree of the degree of injury of the fidelity of the stereo-picture that generates and third dimension, compression algorithm stereoscopic image, noise stereoscopic image Mass Interference that transmission course is introduced and stereo-picture show naturally feels etc., with means and the standard as measurement stereo-picture treatment effect, the technical scheme that the present invention takes is, SSIM and characteristic matching stereo image quality evaluation method based on HVS comprise the steps:
(1) uses the structure distortion method to compare brightness, contrast, the structural similarity of original image left and right sides view and test pattern left and right sides view, propose structure distortion degree index;
(2) with the ratio of the average perceived brightness of test pattern left and right sides view as a quality evaluation index, weigh the difference of left and right sides view perceived brightness, namely extract the luminance contrast index;
(3) according to wavelet decomposition simulation human eye bandpass characteristics principle, calculate test pattern left and right sides view and original image left and right sides view in the error of each frequency band, and to its linear sums, then carry out the signal to noise ratio assessment, draw human eye vision signal to noise ratio evaluation index;
(4) put the third dimension that each ratio of counting reflects stereo-picture with test pattern left and right sides views registered point number and original image left and right sides views registered;
(5) above-mentioned all indexs are carried out rational weighting, draw a total evaluation index, reflect on the whole the quality of stereo-picture.
Now, said method is done further narration, is specially:
With L presentation video absolute brightness, the relative brightness of Δ L presentation video, Δ S represents the increment size of brightness sensation, then can measure with the increment of relative brightness the increment of brightness sensation, shown in (1):
K is constant, to formula (1) integration, obtains perceived brightness S
S=KlnL+K
0=K′lgL+K
0 (2)
Wherein, K '=Kln10, K
0Be constant, according to formula (2) brightness value of each pixel of gray level image carried out conversion, obtain perceived brightness.
The ratio of described average perceived brightness with test pattern left and right sides view is specially as a quality evaluation index, extract respectively brightness, contrast, the structural similarity of original image left and right sides view and test pattern left and right sides view with structural similarity method SSIM (structural similarity), and compare:
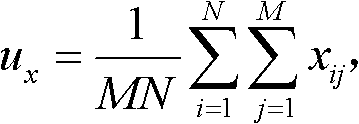
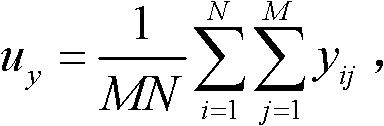
Calculate at first respectively the average perceived brightness u of original image X and test pattern Y
xAnd u
y, M * N is the image size, x
Ij, y
IjPerceived brightness for original image X and each pixel process formula (2) processing of test pattern Y; Next calculates the standard deviation sigma of original image X and test pattern Y
xAnd σ
y, and covariance sigma between the two
XyAgain, calculate respectively brightness comparison function l (x, y), contrast comparison function c (x, y), structural similarity comparison function s (x, y) according to (3)~(5):
C
1, C
2, C
3Respectively the less constant of value, last, according to formula (6) computation structure distortion factor S
l:
S
l=[l(x,y)]
α[c(x,y)
β[s(x,y)]
γ (6)
Make α=β=γ=1,
Each evaluation index value is limited between [0,5], because: l (x, y)≤1, c (x, y)≤1, so s (x, y)≤1 is S
l≤ 1, so formula (5-6) is transformed to:
With the S that newly defines
LadjustAs structure distortion degree evaluation index, left and right view respectively has a structural similarity evaluation index.
The ratio of described average perceived brightness with the left and right view of resolution chart is weighed the difference of left and right sides view perceived brightness as a quality evaluation index, and index is:
Wherein, u
Yl, u
YrBe respectively the average perceived brightness of left resolution chart and right resolution chart,
Similar formula (7) is adjusted the formula of obtaining (9) with (8), and the L after will adjusting
CadjustAs an evaluation index:
L
cadjust=L
c×5 (9)
The described human eye vision signal to noise ratio evaluation index step that draws is, adopt wavelet decomposition simulation human eye bandpass characteristics, and with experience contrast sensitivity function CSF (Contrast Sensitivity Function) curve weighting different frequency bands wavelet coefficient, the contrast sensitivity characteristic of simulation human eye, computational methods provide normal view and the error calculation formula (10) of test view at each weighting frequency band take left view as example:
Wherein, n=1,2 ..., 11; { Cx
(n)(i, j) }, { Cy
(n)(i, j) } be respectively standard image data and the test pattern data of decomposing n spatial frequency band after the weighting; The correspondence image size is: M
n* N
n, in like manner calculate e
Rn, take left view as example, provide the non-linear read group total formula of Minkowski (11):
Wherein, β is sum of parameters, and β ∈ [2,4] in like manner can calculate right view S
r
Similar Y-PSNR definition, definition meets the human eye vision signal to noise ratio HVSNR of human visual system
l, shown in (12):
In like manner can calculate right view HVSNR
r,
With the normalization of human eye vision signal to noise ratio elder generation, according to the Pyatyi scale mark linearity is mapped on [0,5] again; Regulation HVSNR
0=45, as normalized standard, suc as formula (13):
In like manner calculate right view HVS
r
Be mapped on [0,5] interval after formula (13) conversion, suc as formula (14):
HVS
ladjust=HVS
l×5 (14)
In like manner calculate the right view HVS after the conversion
Radjust
Describedly put the third dimension of ratio reflection stereo-picture of each number with test pattern left and right sides views registered point number and original image left and right sides views registered, be specially: extract standard picture match point number D
Standard pictureMatch point number D with test pattern
Test pattern, and with the match point number than P as an evaluation index, formula is such as (15), token image quality and stereo quality,

With formula (15) (16) are adjusted:
P
adjust=P×5(16)
Wherein, D
Test patternBe test pattern left and right sides viewpoint match point number, D
Standard pictureBe standard picture left and right sides viewpoint match point number, P
AdjustBe the evaluation index corresponding with the Pyatyi scale, in the overall merit index of back, still come weighting to represent with P.
Described above-mentioned all indexs are carried out rational weighting, draw a total evaluation index and be specially:
S
ladjust,S
radjust,L
cadjust,HVS
ladjust,HVS
radjust∈(0,5],P∈[0,1](17)
In the formula (17), S
LadjustStructure distortion degree S for left view
lCorresponding Pyatyi scale represents; S
RadjustStructure distortion degree S for right view
rCorresponding Pyatyi scale represents; L
CadjustThe ratio L of the average perceived brightness of the left and right view of resolution chart
cThe Pyatyi scale represent; HVS
LadjustHuman eye left vision signal to noise ratio HVSNR
lPyatyi represent; HVS
RadjustHVSNR
rThe Pyatyi of people's right eye eye vision signal to noise ratio represents; P is the match point number ratio between test pattern and mark image.
Described method is to carry out the following step in computer: read in respectively standard picture to test pattern to 4 width of cloth images, after again it being processed through human visual system model, calculate the structure distortion Measure Indexes of reflection stereo image quality, the brightness Comparative indices, human eye vision signal to noise ratio index, the match point number compares index, the indices values such as comprehensive evaluation value, save as text, quality with objective value reflection test stereo-picture, and the superior in quality situation that can on the interface, intuitively show indices, 6 evaluation indexes are followed successively by: left view structure distortion Measure Indexes StrucL, right view structure distortion Measure Indexes StrucR, about test view luminance contrast index LumaLR, left view human eye vision signal to noise ratio index HVSL, right view human eye vision signal to noise ratio index HVSR, the match point number is than index Match;
In the interface of the evaluation software system that designs, total evaluation index after 6 index weighted sums of " Final Result " expression, it is used for representing test stereo-picture oeverall quality, can be used for carrying out correlation relatively with MOS.With " Excellent ", " Good ", " Fair ", " Poor ", " Bad " expression Pyatyi evaluation of scale credit rating, " ShowResult " corresponding with it is with 5 kinds of display qualities of expressing one's feelings." OpenSL ", " OpenSR ", " OpenTL ", " OpenTR " represent load image, and expression is opened former left view, opens former right view, opens the test left view, opened the test right view respectively." Play " the parameter value that brings into operation, " Save " preserves index to a .txt file, is used for data and processes and analyze." consuming time " shows the time that calculating once consumes, " Succeed " expression is calculated and is finished, the state machine statemachine that " Succeed " is corresponding also has " Testina ... " expression use test function, whether test program can normally move, " Computer ... " representation program calculates.
Employed method focuses on human-eye visual characteristic among the present invention, and the third dimension aspect of stereo-picture, considers that comprehensively, accuracy is high, and the complexity of whole system is lower, and the result who obtains is better.The present invention has put forward the complete stereo image quality evaluation model of a cover simultaneously, such as accompanying drawing 1, and has made simulation software, watches and store data comparatively convenient (accompanying drawing 23).
Description of drawings
Fig. 1 objective evaluation index extraction and method of weighting.
Fig. 2 is based on the evaluation assessment schematic diagram of contrast sensitivity.
Fig. 3 is based on the evaluation assessment schematic diagram of structure distortion.
Fig. 4 carries out the principle of wavelet transformation to image.
Fig. 5 primary standard stereo-picture pair.
Fig. 6 adds Gauss's noise (No. 1).
Fig. 7 adds salt-pepper noise (No. 2).
Fig. 8 brightness increases by 100 (No. 3).
Fig. 9 brightness reduces by 100 (No. 4).
Figure 10 contrast strengthens 100 (No. 5).
Figure 11 contrast strengthens 50 (No. 6)
Figure 12 integral image is to left 5 pixels (No. 7).
Figure 13 image is to left 10 (No. 8).
Figure 14 is compressed to 1% (No. 9) of original map quality with JPEG.
Figure 15 is compressed to 5% (10) of original map quality with JPEG.
Figure 16 is compressed to 10% (No. 11) of original map quality with JPEG.
Figure 17 is compressed to 20% (12) of original map quality with JPEG.
It is 1% that Figure 18 compresses left figure with JPEG, and right figure does not compress (No. 13).
It is 5% that Figure 19 compresses left figure with JPEG, and right figure does not compress (No. 14).
It is 10% that Figure 20 compresses left figure with JPEG, and right figure does not compress (No. 15).
The brightness of Figure 21 left view is reduced to 50% of former figure, right view constant (No. 16).
Figure 22 standard left and right sides view (No. 17).
Figure 23 figure stereo image quality evaluation system interface.
Figure 24 expresses one's feelings and represents Pyatyi scale credit rating.
Embodiment
For existing methodical defective, the present invention has set up the vision mode that embodies human eye brightness amplitude non-linearity characteristic, contrast sensitivity characteristic, bandpass characteristics and cover characteristic; Extract reflection brightness, signal to noise ratio, relief left and right sides view structure distortion metrics index, about test view luminance contrast index, left and right sides view human eye vision signal to noise ratio index, match point number than index totally six evaluation indexes, and these six indexs are fitted to a rational overall merit index.The result shows: evaluation index that the design carries and subjective assessment have higher consistency, can correctly reflect the quality of stereo-picture.
Stereo image quality evaluation algorithms proposed by the invention is as follows:
1. the brightness, contrast, the structural similarity that compare original image left and right sides view and test pattern left and right sides view with the structure distortion method propose structure distortion degree index.
With the ratio of the average perceived brightness of test pattern left and right sides view as a quality evaluation index, weigh the difference of left and right sides view perceived brightness, namely extract the luminance contrast index.
3. according to wavelet decomposition simulation human eye bandpass characteristics principle, calculate test pattern left and right sides view and original image left and right sides view in the error of each frequency band, and to its linear sums, then carry out the signal to noise ratio assessment, draw human eye vision signal to noise ratio evaluation index.
4. put each number and original image left and right sides views registered with test pattern left and right sides views registered and put the third dimension that ratio of each number reflects stereo-picture.
5. above-mentioned all indexs are carried out rational weighting, draw a total evaluation index, reflect on the whole the quality of stereo-picture.
Employed method focuses on human-eye visual characteristic among the present invention, and the third dimension aspect of stereo-picture, considers that comprehensively, accuracy is high, and the complexity of whole system is lower, and the result who obtains is better.The present invention has put forward the complete stereo image quality evaluation model of a cover simultaneously, such as accompanying drawing 1, and has made simulation software, watches and to store data comparatively convenient.
One, at first to the stereo-picture that will test to carrying out preliminary treatment, obtain perceptual image.
The variation of image pixel relative brightness has determined the ability of vision system resolution details, and is irrelevant with the background luminance of entire image.Represent absolute brightness with L, Δ L represents relative brightness, but i.e. proper Recognition Different (Just Noticeable Difference, JND), Δ S represents the increment size of brightness sensation, then can measure with the increment of relative brightness the increment of brightness sensation, shown in (1).
K is constant, and is relevant with whole mean picture brightness.When mean picture brightness is darker or brighter, select less K value, usually, human eye normal brightness scope, but the K value is 1.
To formula (1) integration, obtain perceived brightness S
S=KlnL+K
0=K′lgL+K
0(2)
Wherein, K '=Kln10, K
0Be constant.
By formula (2) as can be known, perceived brightness S becomes the logarithm linear relationship with image intrinsic brilliance L, Here it is brightness amplitude non-linearity characteristic, i.e. weber-Fei Henieer law.The logarithmic function feature of formula (2) shows:
Human eye can not perception goes out the absolute brightness of each pixel, and for gray level image, the speed that perceived brightness increases is along with the increase of brightness value (0~255) tends towards stability.That is: human eye is all insensitive to very black or very bright zone.Therefore, when image is carried out objective evaluation, should be at first according to formula (2) brightness value of each pixel of gray level image be carried out conversion, obtain perceived brightness.
Two, extract brightness, contrast, the structural similarity of original image left and right sides view and test pattern left and right sides view with the SSIM method, and compare
Structural similarity method (SSIM, structural similarity) be by with original image in the comparison aspect brightness, contrast, the structural similarity, reflect preferably test pattern distortion level structurally.Because the structural similarity computational methods of left and right sides view are identical, so with left view S
1Be calculated as example, finish the calculating of structural similarity degree.
Calculate at first respectively the average perceived brightness u of original image X and test pattern Y
xAnd u
y, M * N is the image size, it should be noted that: x herein
Ij, y
IjPerceived brightness for original image X and each pixel process formula (2) processing of test pattern Y; Next calculates the standard deviation sigma of original image X and test pattern Y
xAnd σ
y, and covariance sigma between the two
XyAgain, calculate respectively brightness comparison function l (x, y), contrast comparison function c (x, y), structural similarity comparison function s (x, y) according to (3)~(5).
C
1, C
2, C
3Be respectively the less constant of value, play regulating action.Because the image of general test is all meaningful, can make: C
1=0, C
2=0, C
3=0.
At last, according to formula (6) computation structure distortion factor S
l:
S
l=[l(x,y)]
α[c(x,y)]
β[s(x,y)]
γ(6)
Make α=β=γ=1.
In order to make every objective evaluation index can both be corresponding with the Pyatyi scale, reflect that stereo-picture in the quality degree of this index, is limited to each evaluation index value between [0,5].Because: l (x, y)≤1, c (x, y)≤1, so s (x, y)≤1 is S
l≤ l.So formula (6) is transformed to:
With the S that newly defines
LadjustAs structure distortion degree evaluation index, left and right view respectively has a structural similarity evaluation index.
Three, extract the luminance contrast evaluation index of test left and right sides view
When watching stereo-picture, usually adopt the method that merges left and right sides view to show stereo-picture at display device, when the average perceived luminance difference of left and right sides view when more obvious, people's eyes tire easily has strong discomfort.Therefore with the ratio of the average perceived brightness of the left and right view of resolution chart as a quality evaluation index, weigh the difference of left and right sides view perceived brightness:
Wherein, u
Yl, u
YrBe respectively the average perceived brightness of left resolution chart and right resolution chart.
Similar formula (7) is adjusted the formula of obtaining (9) with (8), and the L after will adjusting
CadjustAs an evaluation index.
L
cadjust=L
c×5 (9)
Four, human eye vision signal to noise ratio evaluation index
At first, CSF (Contrast Sensitivity Function experience contrast sensitivity function) curve reflection human eye vision bandpass characteristics, have linearity or quadrature phase, shift invariant, consistent frequency response between the human eye vision multichannel, stimulation to the horizontal and vertical direction is the most responsive, stimulation sensitiveness to the angular direction is weakened, least responsive at 45 degree and 135 degree directions, this architectural feature just and the 2-d wavelet decomposition good fitness is arranged.Secondly, human eye is responsive for image edge information, we wish to extract the marginal information of image, and three HFSs that wavelet decomposition draws just represented image level, vertical, to the edge details information of angular direction, as shown in table 1.
Table 1 image carries out each layer frequency of wavelet decomposition
| The LH line frequency | HL row frequency | HH45 ° of diagonal frequencies | HH135 ° of diagonal frequencies | |
| The 1st layer | 0.54341 | 0.54409 | 1.28492 | 1.27951 |
| The 2nd layer | 0.94878 | 0.96420 | 2.3731 | 2.3791 |
| The 3rd layer | 1.76941 | 1.93090 | 4.25886 | 4.24791 |
| The 4th layer | 3.50295 | 3.72961 | 6.30172 | 6.26624 |
| The 5th layer | 4.78258 | 4.73584 | 8.57106 | 8.57652 |
Therefore, adopt wavelet decomposition simulation human eye bandpass characteristics, and with CSF (Contrast Sensitivity Function experience contrast sensitivity function) curve weighting different frequency bands wavelet coefficient, the contrast sensitivity characteristic of simulation human eye, the test view that calculates like this and normal view more can reflect human-eye visual characteristic in the error of each frequency band.Computational methods provide normal view and the error calculation formula (10) of test view at each weighting frequency band take left view as example:
Wherein, n=1,2 ..., 11; { Cx
(n)(i, j) }, { Cy
(n)(i, j) } be respectively standard image data and the test pattern data of decomposing n spatial frequency band after the weighting; The correspondence image size is: M
n* N
nIn like manner calculate e
RnTake left view as example, provide the non-linear read group total formula of Minkowski (5-11):
Wherein, β is sum of parameters, generally speaking β ∈ [2,4].Be convenience of calculation, this paper selects β=4.In like manner can calculate S
rSimilar Y-PSNR definition, this paper definition meets the human eye vision signal to noise ratio HVSNR of human visual system
l, shown in (12).
In like manner can calculate HVSNR
rIn order to guarantee each evaluation index value all between [0,5], this paper is mapped to the normalization of human eye vision signal to noise ratio elder generation on [0,5] with the mark linearity according to the Pyatyi scale again.
In the great many of experiments that carries out, the signal to noise ratio maximum of resolution chart is no more than 45dB, so this paper stipulates HVSNR
0=45, as normalized standard, suc as formula (13).
In like manner calculate HVS
r
Be mapped on [0,5] interval, suc as formula (14) after formula (13) conversion.
HVS
ladjust=HVS
l×5 (14)
In like manner calculate the HVS after the conversion
Radjust
Five, the match point number compares evaluation index
If a stereo-picture compression is larger, the angle point number of edge, corner will reduce, and the number of corresponding match point also can reduce, so the number of match point can reflect the quality of stereo-picture; And draw through overtesting, the poor point that does not satisfy [8,100] of horizontal pixel can not produce third dimension or have the sensation of ghost image.Therefore select also can reflect with the ratio of test pattern left and right sides viewpoint match point number and the standard picture left and right sides viewpoint match point number third dimension of stereo-picture.
Extract standard picture match point number D
Standard pictureMatch point number D with test pattern
Test pattern, and with the match point number than P as an evaluation index, formula is such as (15), token image quality and stereo quality.

For corresponding with the Pyatyi scaling law, expression match point number is than the residing fraction levels of evaluation index, and the fine or not degree of reflection third dimension and picture quality is adjusted (16) with formula (15).
P
adjust=P×5 (16)
Wherein, D
Test patternBe test pattern left and right sides viewpoint match point number, D
Standard pictureBe standard picture left and right sides viewpoint match point number.P
AdjustBe the evaluation index corresponding with the Pyatyi scale, in the overall merit index of back, still come weighting to represent with P.
Be to utilize Harris operator extraction characteristic point among the design, the method for recycling normalized covariance is carried out the coupling of characteristic point.The below briefly introduces feature point extraction and coupling:
Harris operator and auto-correlation function are similar, need to obtain the characteristic value of Metzler matrix, the Harris operator mainly utilizes the first derivative of each pixel of image: to each pixel on the image, calculate the derivative of its vertical direction and horizontal direction, and both are multiplied each other, corresponding 3 values of each pixel are equivalent to obtain 3 new width of cloth images.3 values are respectively g
x, g
yAnd g
xg
yAbove-mentioned 3 matrixes are carried out gaussian filtering, then calculate the interest value of each point:
I=det(M)-k×tr(M)
2,k=0.04(18)
Wherein, g
x, g
yBe respectively the gradient of xy direction, G (s) is the gaussian filtering matrix, and det is determinant, and k is the weights coefficient, and being taken as 0.04, tr is mark.The element value of every bit is corresponding to the interest value of former figure respective point among the matrix I.
The characteristic value of M battle array is the single order curvature of auto-correlation function, if two curvature values are all quite high, so just thinks that this point is angle point.The Harris algorithm thinks that characteristic point is pixel corresponding to very big interest value in the subrange.Therefore, after having calculated the interest value of each point, extract the point of all local interest value maximums in the original image.In practical operation, can be successively from 3 * 3 window centered by each pixel, extract maximum, if the interest value of central point pixel is maximum, then this point is exactly characteristic point.
After extracting characteristic point, come the matching characteristic point with normalization cross covariance matching algorithm: at first in the left view that extracts characteristic point, get a characteristic point P
1(i, j), then in right view to be matched centered by pixel (i, j), get the rectangle of a M * N, with each the angle point P that extracts in the rectangle
2With P
1Point carries out measuring similarity, and similarity is possible match point greater than the point of predetermined threshold value 0.8.Order obtains all possible matching double points of left and right sides view centering at last with each characteristic point in the left view and right view coupling.Appoint and get 1 P of left view
1(i, j), 1 P of right view
2(i, j).If their gray value is respectively I
1(i, j), I
2(i, j).This cross covariance of 2 may be defined as:
Self-defined window size:
M=(2k+1) is 2k+1 (2l+1), and 2l+1 is the length of window and wide
σ (I wherein
1), σ (I
2) the interior gray variance of the left and right view of representative characteristic point to be matched place window:
In above-mentioned possible matching double points of trying to achieve, may have one-to-many or many-to-one situation because be with characteristic point in the left view in right view all and its cross covariance greater than 0.8 point as possible matching double points.
Next step need to find out correct matching double points from possible match point, establishing a pair of matching double points is (m
1i, m
2j), m
1iA point of left view, m
2jThe match point in the right view, N (m
1i) be m
1iThe set of the R field point of point, N (m
2j) be m
2jIf the set of the R field point of point is (m
1i, m
2j) be an accurately matching double points, in its field, just can see a lot of accurate matching double points (n
1k, n
2l), n
1kAt m
1iNear, n
2lAt m
2jNear.Definition match strength SM, computational methods as shown in the formula:
C wherein
IjAnd c
KlMatching double points (m
1i, m
2j) and (n
1k, n
2l) cross covariance, dist (m
1i, m
2jn
1k, n
2l) be the average distance of two pairs of match points, be defined as:
δ (m
1i, m
2jn
1k, n
2l) be defined as:
R is that the range difference ratio is:
ε wherein
γThe range difference threshold value is taken as 0.3 among the design.
S
m(m
1i, m
2j) represent match strength SM, for the situation of one-to-many, such as the m of left view
1iTwo match points are arranged in right view, be respectively m
2j, m
2k, utilize the computing formula of match strength, calculate respectively S
m(m
1i, m
2j) and S
m(m
1i, m
2k), two intermediate value maximums be exactly correct matching double points.
The matching double points that still may have mistake in the above-mentioned matching double points that finds, utilize the RANSAC algorithm that matching double points is carried out the right rejecting of error matching points again, its basic thought is: choose at random 8 matching double points in the at first all possible matching double points, utilize them to set up a sample set, then utilize this sample set to obtain one group corresponding to its fundamental matrix parameter, utilize these parameters to set up a fundamental matrix candidate family.Then calculate all matching double points with respect to this model to pole span from (corresponding limit distance), according to predefined threshold value, point less than this threshold value thinks that to us they meet this model, therefore claim these to being the support of model, if this support has arrived greatly to a certain degree, this fundamental matrix is exactly the fundamental matrix that we will find the solution.If the number of this concentrated matching double points is less than given threshold value, then this model is not optimum model.Repeat said process until find the fundamental matrix optimal models.Utilize optimum fundamental matrix, those are rejected from the matching double points greater than setting threshold pole span.The below systematically narrates the RANSAC algorithm:
1. n matching double points arranged in the sample space, and random sample is concentrated need to have 8 points right.
2. obtain candidate family by the random sample collection
S(S1,S2,S3,S4,S5,S6,S7,S8)->F(F1,F2,F3,F4,F5,F6,F7,F8)。
3. by F and to pole span from threshold value L, detect all matching double points, obtain the support of candidate family F: M (m to).
4. detect: whether m is greater than threshold value T.
No, again select 8 pairs of match points, continue above process.
Then to obtain object module F.
5. further, with m among the consistent collection M parameter F of matching double points object module is optimized the model F ' after being optimized.
6. utilize the model F ' that optimizes, will reject from the matching double points greater than threshold value pole span.
7. every random selecting point is once established counter count+1, repeats k time and does not find model parameter, stops.
Six, overall merit index
According to the introduction of top several indexs, comprehensively all indexs propose an overall merit index, reflect on the whole the quality of stereo-picture.
S
ladjust,S
radjust,L
cadjust,HVS
ladjust,HVS
radjust∈(0,5],P∈[0,1](26)
In the formula (26), S
LadjustStructure distortion degree S for left view
lCorresponding Pyatyi scale represents; S
RadjustStructure distortion degree S for right view
rCorresponding Pyatyi scale represents; L
CadjustThe ratio L of the average perceived brightness of the left and right view of resolution chart
cThe Pyatyi scale represent; HVS
LadjustHVSNR
lThe Pyatyi of (human eye vision signal to noise ratio, left eye) represents; HVS
RadjustHVSNR
rThe Pyatyi of (human eye vision signal to noise ratio, right eye) represents, its computational process and HVS
LadjustSimilar; P is the match point number ratio between test pattern and mark image.Therefore, formula (5-20) has considered the factor of the structure distortion factor, brightness and contrast's (recently simulating with noise) three aspects, then in conjunction with test pattern and mark the match point number between image than P (being similar to a weight), calculated a total index T, and T is divided on the Pyatyi index grade of correspondence, be used for describing the total quality of stereo-picture.If structure, signal to noise ratio, contrast mark are all higher, but third dimension very poor (portraying with P), and the T mark is also lower; If image compression damage is larger, obvious blocking effect appears, and structure, the signal to noise ratio mark will be lower, and the mark of T is also thereupon lower.
Seven, the evaluation software system realizes
According to the human vision model of the design's foundation and the stereo image quality objective evaluation index of intending extraction, cover stereo image quality objective evaluation software systems have been developed, read in respectively standard picture to test pattern to 4 width of cloth images, after again it being processed through human visual system model, calculate the structure distortion Measure Indexes of reflection stereo image quality, the brightness Comparative indices, human eye vision signal to noise ratio index, the match point number compares index, the indices values such as comprehensive evaluation value, save as text, test the quality of stereo-picture with the objective value reflection, and on the interface, intuitively show the superior in quality situation of indices.
Further describe the present invention below in conjunction with drawings and Examples.
The present invention is based on technology path that the stereo image quality of human vision model estimates as shown in Figure 1.Concrete methods of realizing may further comprise the steps:
(1) the design is for one group of family image, such as accompanying drawing 5.According to adding of table 1 make an uproar, compression, translation, change the preprocess methods such as brightness, obtain the test pattern group such as accompanying drawing 6-Figure 22.At this moment, image is in the form storage with matrix, and the size of establishing image is M * N, and each element in the matrix is being stored the pixel value of correspondence image.
Table 1 carries out pretreated method table for generation of test pattern to image
| Sequence number | The image preliminary treatment | Sequence number | The image preliminary treatment |
| 1 | Gaussian noise | 10 | Be compressed to 5% |
| 2 | Salt-pepper noise | 11 | Be compressed to 10% |
| 3 | Brightness+100 | 12 | Be compressed to 20% |
| 4 | Brightness-100 | 13 | Left 1% right side 100% |
| 5 | Contrast 100 | 14 | Left 5% right side 100% |
| 6 | Contrast 50 | 15 | Left 10% right side 100% |
| 7 | Translation 5 pixels | 16 | Left brightness 50% right brightness is constant |
| 8 | Translation 10 pixels | 17 | Standard picture |
| 9 | Be compressed to 1% |
(2) in the following steps of this example, make X, Y represents respectively pixel value original and the test stereo-picture, the left and right sides view of the former stereo-picture left and right sides view with the test stereo-picture is compared respectively, here take the left view of former stereo-picture and test stereo-picture as example.
(2-1) utilize relational expression
 (Δ L represents relative brightness) obtains the increment size of brightness sensation, namely the stereo-picture that will test carried out preliminary treatment, obtains testing the right perceptual image of stereo-picture.
(2-2) utilize relational expression
 Calculate original and mean flow rate degree of approximation test pattern, wherein,
 The span of mean flow rate degree of approximation is [0,1], only has the u of working as
x=u
yThe time, its value is 1.
The span of mean flow rate degree of approximation is [0,1], only has the u of working as
x=u
yThe time, its value is 1.
(2-3) utilize relational expression
 Calculate original and contrast comparing difference test pattern.Wherein

 Span is [0,1], only has the σ of working as
x=σ
yThe time obtain optimum value 1.
Span is [0,1], only has the σ of working as
x=σ
yThe time obtain optimum value 1.
(2-4) utilize relational expression
 Calculate original and structural similarity test pattern.Wherein, X, Y represent respectively original image and test pattern,

(2-5) pass through formula
(S
l≤ 1), obtains testing the value that left view is compared, in the same way, obtain the structural similarity index of right view.S
lValue has reflected brightness, the contrast of image, the comparison of structural similarity aspect.In order to make every objective evaluation index can both be corresponding with the Pyatyi scale, reflect that stereo-picture in the quality degree of this index, is limited to each evaluation index value between [0,5], it is expressed as S
Ladjust, and the right view of test pattern can be expressed as S
Ladjust, structural similarity evaluation of estimate such as the table 2 of test pattern family.
Table 2family objective evaluation mark and subjective assessment mark comparison sheet


(2-6) utilize relational expression
 Extract the luminance contrast evaluation index of test left and right sides view, wherein, u
Yl, u
YrBe respectively the average perceived brightness of left resolution chart and the right resolution chart of stereo-picture.By relational expression L
Cadjust=L
c* 5 adjust to [0,5] with its value, and use L
CadjustRepresentative, luminance contrast evaluation of estimate such as the table 2 of test pattern family.
Extract the luminance contrast evaluation index of test left and right sides view, wherein, u
Yl, u
YrBe respectively the average perceived brightness of left resolution chart and the right resolution chart of stereo-picture.By relational expression L
Cadjust=L
c* 5 adjust to [0,5] with its value, and use L
CadjustRepresentative, luminance contrast evaluation of estimate such as the table 2 of test pattern family.
(2-7) utilize error calculation formula
 Draw former left view and test left view in the error of each weighting frequency band, wherein, n=1,2 ..., 11; { Cx
(n)(i, j) }, { Cy
(n)(i, j) } be respectively original digital image data and the test pattern data of decomposing n spatial frequency band after the weighting; Utilize the Minkowski computing formula to carry out the non-linear S of being summed to
lUtilize the Between Signal To Noise Ratio formula
Draw former left view and test left view in the error of each weighting frequency band, wherein, n=1,2 ..., 11; { Cx
(n)(i, j) }, { Cy
(n)(i, j) } be respectively original digital image data and the test pattern data of decomposing n spatial frequency band after the weighting; Utilize the Minkowski computing formula to carry out the non-linear S of being summed to
lUtilize the Between Signal To Noise Ratio formula
 Draw the human eye vision signal to noise ratio of test left view, in like manner can calculate the test right view, and its value is mapped on [0,5], obtain HVS
Ladjust, HVS
Radjust, human eye vision signal to noise ratio evaluation of estimate such as the table 2 of test pattern family.
Draw the human eye vision signal to noise ratio of test left view, in like manner can calculate the test right view, and its value is mapped on [0,5], obtain HVS
Ladjust, HVS
Radjust, human eye vision signal to noise ratio evaluation of estimate such as the table 2 of test pattern family.
(2-8) ratio of usefulness test pattern left and right sides viewpoint match point number and standard picture left and right sides viewpoint match point number is estimated the third dimension of stereo-picture.Utilize the characteristic point of Harris operator extraction left and right sides view, the method for recycling normalized covariance is carried out the coupling of characteristic point; Extract original image match point number D
Standard pictureMatch point number D with test pattern
Test pattern, and with the match point number than P as an evaluation index, value is mapped on [0,5], obtain the match point number than evaluation index P
Adjust, the third dimension of test pattern family (match point number) evaluation of estimate such as table 2.
The below briefly introduces feature point extraction and coupling:
Harris operator and auto-correlation function are similar, need to obtain the characteristic value of Metzler matrix, the Harris operator mainly utilizes the first derivative of each pixel of image: to each pixel on the image, calculate the derivative of its vertical direction and horizontal direction, and both are multiplied each other, corresponding 3 values of each pixel are equivalent to obtain 3 new width of cloth images.3 values are respectively g
x, g
yAnd g
xg
yAbove-mentioned 3 matrixes are carried out gaussian filtering, then calculate the interest value of each point:
I=det(M)-k×tr(M)
2,k=0.04
Wherein, g
x, g
yBe respectively the gradient of xy direction, G (s) is the gaussian filtering matrix, and det is determinant, and k is the weights coefficient, and being taken as 0.04, tr is mark.The element value of every bit is corresponding to the interest value of former figure respective point among the matrix I.
The characteristic value of M battle array is the single order curvature of auto-correlation function, if two curvature values are all quite high, so just thinks that this point is angle point.The Harris algorithm thinks that characteristic point is pixel corresponding to very big interest value in the subrange.Therefore, after having calculated the interest value of each point, extract the point of all local interest value maximums in the original image.In practical operation, can be successively from 3 * 3 window centered by each pixel, extract maximum, if the interest value of central point pixel is maximum, then this point is exactly characteristic point.
After extracting characteristic point, come the matching characteristic point with normalization cross covariance matching algorithm: at first in the left view that extracts characteristic point, get a characteristic point P
1(i, j), then in right view to be matched centered by pixel (i, j), get the rectangle of a M * N, with each the angle point P that extracts in the rectangle
2With P
1Point carries out measuring similarity, and similarity is possible match point greater than the point of predetermined threshold value 0.8.Order obtains all possible matching double points of left and right sides view centering at last with each characteristic point in the left view and right view coupling.Appoint and get 1 P of left view
1(i, j), 1 P of right view
2(i, j).If their gray value is respectively I
1(i, j), I
2(i, j).This cross covariance of 2 may be defined as:
Self-defined window size:
M=(2k+1) is 2k+1 (2l+1), and 2l+1 is the length of window and wide
σ (I wherein
1), σ (I
2) the interior gray variance of the left and right view of representative characteristic point to be matched place window:
With
 Be respectively the average gray in two windows:
In above-mentioned possible matching double points of trying to achieve, may have one-to-many or many-to-one situation because be with characteristic point in the left view in right view all and its cross covariance greater than 0.8 point as possible matching double points.
Next step need to find out correct matching double points from possible match point, establishing a pair of matching double points is (m
1i, m
2j), m
1iA point of left view, m
2jThe match point in the right view, N (m
1i) be m
1iThe set of the R field point of point, N (m
2j) be m
2jIf the set of the R field point of point is (m
1i, m
2j) be an accurately matching double points, in its field, just can see a lot of accurate matching double points (n
1k, n
2l), n
1kAt m
1iNear, n
2lAt m
2jNear.Definition match strength SM, computational methods as shown in the formula:
C wherein
IjAnd c
KlMatching double points (m
1i, m
2j) and (n
1k, n
2l) cross covariance, dist (m
1i, m
2jn
1k, n
2l) be the average distance of two pairs of match points, be defined as:

δ (m
1i, m
2jn
1k, n
2l) be defined as:
R is that the range difference ratio is:
ε wherein
γThe range difference threshold value is taken as 0.3 among the design.
S
m(m
1i, m
2j) represent match strength SM, for the situation of one-to-many, such as the m of left view
1iTwo match points are arranged in right view, be respectively m
2j, m
2k, utilize the computing formula of match strength, calculate respectively S
m(m
1i, m
2j) and S
m(m
1i, m
2k), two intermediate value maximums be exactly correct matching double points.
The matching double points that still may have mistake in the above-mentioned matching double points that finds, utilize the RANSAC algorithm that matching double points is carried out the right rejecting of error matching points again, its basic thought is: choose at random 8 matching double points in the at first all possible matching double points, utilize them to set up a sample set, then utilize this sample set to obtain one group corresponding to its fundamental matrix parameter, utilize these parameters to set up a fundamental matrix candidate family.Then calculate all matching double points with respect to this model to pole span from (corresponding limit distance), according to predefined threshold value, point less than this threshold value thinks that to us they meet this model, therefore claim these to being the support of model, if this support has arrived greatly to a certain degree, this fundamental matrix is exactly the fundamental matrix that we will find the solution.If the number of this concentrated matching double points is less than given threshold value, then this model is not optimum model.Repeat said process until find the fundamental matrix optimal models.Utilize optimum fundamental matrix, those are rejected from the matching double points greater than setting threshold pole span.The below systematically narrates the RANSAC algorithm:
1. n matching double points arranged in the sample space, and random sample is concentrated need to have 8 points right.
2. obtain candidate family by the random sample collection
S(S1,S2,S3,S4,S5,S6,S7,S8)->F(F1,F2,F3,F4,F5,F6,F7,F8)。
3. by F and to pole span from threshold value L, detect all matching double points, obtain the support of candidate family F: M (m to).
4. detect: whether m is greater than threshold value T.
No, again select 8 pairs of match points, continue above process.
Then to obtain object module F.
5. further, with m among the consistent collection M parameter F of matching double points object module is optimized the model F ' after being optimized.
6. utilize the model F ' that optimizes, will reject from the matching double points greater than threshold value pole span.
7. every random selecting point is once established counter count+1, repeats k time and does not find model parameter, stops.
(3) according to the introduction of (2) part, comprehensively all indexs propose an overall merit index, reflect on the whole the quality of stereo-picture.
S
ladjust,S
radjust,L
cadjust,HVS
ladjust,HVS
radjust∈(0,5],P∈[0,1]
Wherein, S
LadjustStructure distortion degree S for left view
lCorresponding Pyatyi scale represents; S
RadjustStructure distortion degree S for right view
rCorresponding Pyatyi scale represents; L
CadjustThe ratio L of the average perceived brightness of the left and right view of resolution chart
cThe Pyatyi scale represent; HVS
LadjustHVSNR
lThe Pyatyi of (human eye vision signal to noise ratio, left eye) represents; HVS
RadjustHVSNR
rThe Pyatyi of (human eye vision signal to noise ratio, right eye) represents, its computational process and HVS
LadjustSimilar; P is the match point number ratio between test pattern and mark image.Therefore, the overall merit index comprehensive has been considered the factor of the structure distortion factor, brightness and contrast's (recently simulating with noise) three aspects, then in conjunction with test pattern and mark the match point number between image than P (being similar to a weight), calculated a total index T, and T is divided on the Pyatyi index grade of correspondence, be used for describing the total quality of stereo-picture.If structure, signal to noise ratio, contrast mark are all higher, but third dimension very poor (portraying with P), and the T mark is also lower; If image compression damage is larger, obvious blocking effect appears, and structure, the signal to noise ratio mark will be lower, and the mark of T is also thereupon lower.
(4) according to the human vision model of the design's foundation and the stereo image quality objective evaluation index of intending extraction, cover stereo image quality objective evaluation software systems have been developed, read in respectively standard picture to test pattern to 4 width of cloth images, after again it being processed through human visual system model, calculate the structure distortion Measure Indexes of reflection stereo image quality, the brightness Comparative indices, human eye vision signal to noise ratio index, the match point number compares index, the indices values such as comprehensive evaluation value, save as text, test the quality of stereo-picture with the objective value reflection, and on the interface, intuitively show the superior in quality situation of indices.
Stereo image quality evaluation system interface such as the accompanying drawing 23 of the design's exploitation.The interface is described below: " StrucL ", " StrucR ", " LumaLR ", " HVSL ", " HVSR ", " Match " represent respectively: left view structure distortion Measure Indexes, right view structure distortion Measure Indexes, about test view luminance contrast index, left view human eye vision signal to noise ratio index, right view human eye vision signal to noise ratio index, match point number compare index.Total evaluation index after 6 index weighted sums of " Final Result " expression, it is used for representing test stereo-picture oeverall quality, can be used for carrying out correlation relatively with MOS.The mark of the corresponding index of viewing area navy blue histogram graph representation standard picture, the mark of the corresponding index of light blue histogram graph representation test pattern.Right side " Excellent ", " Good ", " Fair ", " Poor ", " Bad " expression Pyatyi evaluation of scale credit rating, " the Show Result " corresponding with it is with 5 kinds of display qualities (accompanying drawing 24) of expressing one's feelings." OpenSL ", " OpenSR ", " OpenTL ", " OpenTR " represent load image, and expression is opened former left view, opens former right view, opens the test left view, opened the test right view respectively." Play " the parameter value that brings into operation, " Save " preserves index to a .txt file, is used for data and processes and analyze." consuming time " shows the time that calculating once consumes, " Succeed " expression is calculated and is finished, the state machine (state machine) that " Succeed " is corresponding also has " Testing ... " expression use test function, whether test program can normally move, " Computer ... " representation program calculates.
Claims (3)

Priority Applications (1)
| Application Number | Priority Date | Filing Date | Title |
|---|---|---|---|
| CN 201110115808 CN102170581B (en) | 2011-05-05 | 2011-05-05 | Human-visual-system (HVS)-based structural similarity (SSIM) and characteristic matching three-dimensional image quality evaluation method |
Applications Claiming Priority (1)
| Application Number | Priority Date | Filing Date | Title |
|---|---|---|---|
| CN 201110115808 CN102170581B (en) | 2011-05-05 | 2011-05-05 | Human-visual-system (HVS)-based structural similarity (SSIM) and characteristic matching three-dimensional image quality evaluation method |
Publications (2)
| Publication Number | Publication Date |
|---|---|
| CN102170581A CN102170581A (en) | 2011-08-31 |
| CN102170581B true CN102170581B (en) | 2013-03-20 |
Family
ID=44491534
Family Applications (1)
| Application Number | Title | Priority Date | Filing Date |
|---|---|---|---|
| CN 201110115808 Expired - Fee Related CN102170581B (en) | 2011-05-05 | 2011-05-05 | Human-visual-system (HVS)-based structural similarity (SSIM) and characteristic matching three-dimensional image quality evaluation method |
Country Status (1)
| Country | Link |
|---|---|
| CN (1) | CN102170581B (en) |
Cited By (2)
| Publication number | Priority date | Publication date | Assignee | Title |
|---|---|---|---|---|
| CN103945217A (en) * | 2014-04-17 | 2014-07-23 | 四川九洲电器集团有限责任公司 | Complex wavelet domain semi-blind image quality evaluation method and system based on entropies |
| CN104023226A (en) * | 2014-05-28 | 2014-09-03 | 北京邮电大学 | HVS-based novel video quality evaluation method |
Families Citing this family (32)
| Publication number | Priority date | Publication date | Assignee | Title |
|---|---|---|---|---|
| CN102436646A (en) * | 2011-11-07 | 2012-05-02 | 天津大学 | Compressed sensing based CCD (Charge Coupled Device) noise estimation method |
| CN102523477B (en) * | 2011-12-01 | 2014-02-12 | 上海大学 | A Stereo Video Quality Evaluation Method Based on Binocular Minimum Distortion Model |
| RS67081B1 (en) * | 2011-12-06 | 2025-09-30 | Dolby Laboratories Licensing Corp | Method of improving the perceptual luminance nonlinearity-based image data exchange across different display capabilities |
| CN102567990B (en) * | 2011-12-08 | 2014-07-16 | 宁波大学 | Stereo image objective quality estimation method |
| EP2795908A4 (en) * | 2011-12-22 | 2015-08-05 | Intel Corp | Quantifiable stereoscopic three-dimensional video evaluation methodology |
| CN102722888A (en) * | 2012-05-22 | 2012-10-10 | 天津大学 | Stereoscopic image objective quality evaluation method based on physiological and psychological stereoscopic vision |
| CN102769773A (en) * | 2012-06-27 | 2012-11-07 | 清华大学 | Multi-user stereoscopic video evaluation method and system based on quality factors |
| CN102821301B (en) * | 2012-08-31 | 2014-04-30 | 天津大学 | HVS (Human Visual System)-based objective quality evaluation method for three-dimensional (3D) information |
| CN102903107B (en) * | 2012-09-24 | 2015-07-08 | 宁波大学 | Three-dimensional picture quality objective evaluation method based on feature fusion |
| CN103067741A (en) * | 2013-01-24 | 2013-04-24 | 浙江理工大学 | Shaking detection algorithm based on multi-feature fusion |
| CN103152600B (en) * | 2013-03-08 | 2015-04-08 | 天津大学 | Three-dimensional video quality evaluation method |
| CN103281554B (en) * | 2013-04-23 | 2015-04-29 | 宁波大学 | Video objective quality evaluation method based on human eye visual characteristics |
| CN103780895B (en) * | 2014-01-16 | 2015-11-04 | 天津大学 | A Stereoscopic Video Quality Evaluation Method |
| CN104394403B (en) * | 2014-11-04 | 2016-04-27 | 宁波大学 | A kind of stereoscopic video quality method for objectively evaluating towards compression artefacts |
| CN104680494B (en) * | 2015-03-14 | 2018-11-16 | 西安电子科技大学 | Based on artificial plus mist best mist figure restored method |
| CN104853183A (en) * | 2015-05-22 | 2015-08-19 | 天津大学 | Objective evaluation method for perceiving three-dimensional sense of three-dimensional image |
| CN104897377A (en) * | 2015-06-23 | 2015-09-09 | 深圳市时代华影科技股份有限公司 | Projection quality evaluating system of 3D projection system |
| CN105096335B (en) * | 2015-09-17 | 2018-12-21 | 无锡天脉聚源传媒科技有限公司 | A kind of method and device for transmitting evaluation information |
| CN105976351B (en) * | 2016-03-31 | 2019-04-12 | 天津大学 | Stereo image quality evaluation method based on central offset |
| CN106780452B (en) * | 2016-12-07 | 2019-08-06 | 华侨大学 | A full-reference screen image quality assessment method combining wavelet and corner features |
| CN106886992A (en) * | 2017-01-24 | 2017-06-23 | 北京理工大学 | A kind of quality evaluating method of many exposure fused images of the colour based on saturation degree |
| CN106875389B (en) * | 2017-02-23 | 2020-06-30 | 天津大学 | Stereo video quality evaluation method based on motion significance |
| CN109272479B (en) * | 2017-07-12 | 2021-11-02 | 天津大学 | Stereoscopic image quality evaluation method based on stereo perception characteristics |
| CN107480379B (en) * | 2017-08-17 | 2018-08-10 | 广东工业大学 | A kind of manufacturing method of the evaluation optimization decorative panel based on picture structure similitude |
| CN107438180B (en) * | 2017-08-28 | 2019-02-22 | 中国科学院深圳先进技术研究院 | Depth perception quality evaluation method for 3D video |
| CN108230314B (en) * | 2018-01-03 | 2022-01-28 | 天津师范大学 | Image quality evaluation method based on deep activation pooling |
| CN108550145B (en) * | 2018-04-11 | 2021-01-29 | 北京环境特性研究所 | SAR image quality evaluation method and device |
| CN108550152B (en) * | 2018-04-20 | 2020-05-08 | 浙江科技学院 | Full-reference image quality objective evaluation method based on depth feature perception inference |
| CN109726693B (en) * | 2019-01-02 | 2021-05-07 | 京东方科技集团股份有限公司 | Method, apparatus, medium and electronic equipment for evaluating environmental noise of equipment |
| CN112446879B (en) * | 2021-01-06 | 2022-09-23 | 天津科技大学 | Contrast distortion image quality evaluation method based on image entropy |
| CN114463807A (en) * | 2021-12-30 | 2022-05-10 | 杭州当虹科技股份有限公司 | Method and system for evaluating quality of face sensing compressed video |
| CN116843926A (en) * | 2023-06-15 | 2023-10-03 | 邦邦汽车销售服务(北京)有限公司 | Supply chain traceability method and related equipment for auto parts based on data processing |
Family Cites Families (3)
| Publication number | Priority date | Publication date | Assignee | Title |
|---|---|---|---|---|
| KR20030005409A (en) * | 2001-03-29 | 2003-01-17 | 코닌클리케 필립스 일렉트로닉스 엔.브이. | Scalable expandable system and method for optimizing a random system of algorithms for image quality |
| CN101621709B (en) * | 2009-08-10 | 2011-01-05 | 浙江大学 | A full-reference image objective quality assessment method |
| CN101853504B (en) * | 2010-05-07 | 2012-04-25 | 厦门大学 | Image quality evaluation method based on visual characteristics and structural similarity |
-
2011
- 2011-05-05 CN CN 201110115808 patent/CN102170581B/en not_active Expired - Fee Related
Cited By (3)
| Publication number | Priority date | Publication date | Assignee | Title |
|---|---|---|---|---|
| CN103945217A (en) * | 2014-04-17 | 2014-07-23 | 四川九洲电器集团有限责任公司 | Complex wavelet domain semi-blind image quality evaluation method and system based on entropies |
| CN103945217B (en) * | 2014-04-17 | 2016-01-06 | 四川九洲电器集团有限责任公司 | Based on complex wavelet domain half-blindness image quality evaluating method and the system of entropy |
| CN104023226A (en) * | 2014-05-28 | 2014-09-03 | 北京邮电大学 | HVS-based novel video quality evaluation method |
Also Published As
| Publication number | Publication date |
|---|---|
| CN102170581A (en) | 2011-08-31 |
Similar Documents
| Publication | Publication Date | Title |
|---|---|---|
| CN102170581B (en) | Human-visual-system (HVS)-based structural similarity (SSIM) and characteristic matching three-dimensional image quality evaluation method | |
| CN103581661B (en) | Method for evaluating visual comfort degree of three-dimensional image | |
| CN101562675B (en) | No-reference Image Quality Evaluation Method Based on Contourlet Transform | |
| CN108830823B (en) | Full-reference image quality evaluation method based on spatial domain combined frequency domain analysis | |
| CN116664462B (en) | Infrared and visible light image fusion method based on MS-DSC and I_CBAM | |
| CN106447646A (en) | Quality blind evaluation method for unmanned aerial vehicle image | |
| CN103338380B (en) | Adaptive image quality objective evaluation method | |
| CN104318545B (en) | A kind of quality evaluating method for greasy weather polarization image | |
| CN102945552A (en) | No-reference image quality evaluation method based on sparse representation in natural scene statistics | |
| CN105744256A (en) | Three-dimensional image quality objective evaluation method based on graph-based visual saliency | |
| CN102036098B (en) | Full-reference type image quality evaluation method based on visual information amount difference | |
| CN106920232A (en) | Gradient similarity graph image quality evaluation method and system based on conspicuousness detection | |
| CN103426173B (en) | Objective evaluation method for stereo image quality | |
| CN104751456A (en) | Blind image quality evaluation method based on conditional histogram codebook | |
| CN104851098A (en) | Objective evaluation method for quality of three-dimensional image based on improved structural similarity | |
| CN105407349A (en) | No-reference objective three-dimensional image quality evaluation method based on binocular visual perception | |
| Jiang et al. | No reference stereo video quality assessment based on motion feature in tensor decomposition domain | |
| CN103945217B (en) | Based on complex wavelet domain half-blindness image quality evaluating method and the system of entropy | |
| CN104376565A (en) | Non-reference image quality evaluation method based on discrete cosine transform and sparse representation | |
| CN106651829B (en) | A kind of non-reference picture method for evaluating objective quality based on energy and texture analysis | |
| CN104616294A (en) | Visual saliency-based tone mapping image quality evaluation method | |
| CN106780446A (en) | It is a kind of to mix distorted image quality evaluating method without reference | |
| CN106127234B (en) | A no-reference image quality assessment method based on feature dictionary | |
| CN113222032A (en) | No-reference image quality evaluation method based on self-attention image coding | |
| CN103106660A (en) | Synthetic aperture radar (SAR) image quality evaluation method based on contrast sensitivity characteristics |
Legal Events
| Date | Code | Title | Description |
|---|---|---|---|
| C06 | Publication | ||
| PB01 | Publication | ||
| C10 | Entry into substantive examination | ||
| SE01 | Entry into force of request for substantive examination | ||
| C14 | Grant of patent or utility model | ||
| GR01 | Patent grant | ||
| CF01 | Termination of patent right due to non-payment of annual fee |
Granted publication date: 20130320 |
|
| CF01 | Termination of patent right due to non-payment of annual fee |