CN102137618A - Quantitative multi-spectral opto-acoustic tomography (MSOT) of tissue biomarkers - Google Patents
Quantitative multi-spectral opto-acoustic tomography (MSOT) of tissue biomarkers Download PDFInfo
- Publication number
- CN102137618A CN102137618A CN2008801309424A CN200880130942A CN102137618A CN 102137618 A CN102137618 A CN 102137618A CN 2008801309424 A CN2008801309424 A CN 2008801309424A CN 200880130942 A CN200880130942 A CN 200880130942A CN 102137618 A CN102137618 A CN 102137618A
- Authority
- CN
- China
- Prior art keywords
- target tissue
- illumination
- imaging
- tissue
- biomarker
- Prior art date
- Legal status (The legal status is an assumption and is not a legal conclusion. Google has not performed a legal analysis and makes no representation as to the accuracy of the status listed.)
- Granted
Links
Images


Classifications
-
- A—HUMAN NECESSITIES
- A61—MEDICAL OR VETERINARY SCIENCE; HYGIENE
- A61B—DIAGNOSIS; SURGERY; IDENTIFICATION
- A61B5/00—Measuring for diagnostic purposes; Identification of persons
- A61B5/0059—Measuring for diagnostic purposes; Identification of persons using light, e.g. diagnosis by transillumination, diascopy, fluorescence
- A61B5/0073—Measuring for diagnostic purposes; Identification of persons using light, e.g. diagnosis by transillumination, diascopy, fluorescence by tomography, i.e. reconstruction of 3D images from 2D projections
-
- A—HUMAN NECESSITIES
- A61—MEDICAL OR VETERINARY SCIENCE; HYGIENE
- A61B—DIAGNOSIS; SURGERY; IDENTIFICATION
- A61B5/00—Measuring for diagnostic purposes; Identification of persons
- A61B5/0093—Detecting, measuring or recording by applying one single type of energy and measuring its conversion into another type of energy
- A61B5/0095—Detecting, measuring or recording by applying one single type of energy and measuring its conversion into another type of energy by applying light and detecting acoustic waves, i.e. photoacoustic measurements
Landscapes
- Health & Medical Sciences (AREA)
- Life Sciences & Earth Sciences (AREA)
- Physics & Mathematics (AREA)
- Molecular Biology (AREA)
- Animal Behavior & Ethology (AREA)
- Pathology (AREA)
- Engineering & Computer Science (AREA)
- Biomedical Technology (AREA)
- Heart & Thoracic Surgery (AREA)
- Medical Informatics (AREA)
- Veterinary Medicine (AREA)
- Surgery (AREA)
- Biophysics (AREA)
- General Health & Medical Sciences (AREA)
- Public Health (AREA)
- Acoustics & Sound (AREA)
- Nuclear Medicine, Radiotherapy & Molecular Imaging (AREA)
- Radiology & Medical Imaging (AREA)
- Ultra Sonic Daignosis Equipment (AREA)
- Investigating Or Analysing Materials By Optical Means (AREA)
- Investigating, Analyzing Materials By Fluorescence Or Luminescence (AREA)
Abstract
A method of multi-spectral opto-acoustic tomography (MSOT) imaging of a target tissue including a target tissue biomarker comprises the steps of illuminating the target tissue with an illumination device emitting at least one pulsed illumination pattern at several illumination wavelengths, detecting pressure signals from the target tissue biomarker with a detector device, wherein the pressure signals being produced in the target tissue in response to the said illumination, and reconstructing a quantitative tomographic image of a distribution of the target tissue biomarker in the target tissue, wherein the pressure signals are analyzed using a photon propagation model, which depends on an illuminating light fluence in the target tissue and on the illumination wavelengths, at least one spectral processing scheme, and an inversion scheme providing the tomographic image. Furthermore, an imaging device for multi-spectral opto-acoustic tomography is described.
Description
Technical Field
The present invention relates to methods and apparatus for quantitative three-dimensional sensing and imaging of target tissue markers, particularly for use in clinical, small animal and small biological imaging applications using multi-wavelength illumination.
Background
Non-invasive imaging of functional and molecular markers in vivo is a promising and important capability in biological discovery, drug discovery, and some clinical applications, beyond anatomical imaging and slow disease identification. Another important prospect of visualizing tissue biomarkers is the ability to detect and quantify therapeutic responses in vivo by monitoring specific major molecules or downstream targets. The therapy can then be detected dynamically on a timescale from hours to days. This ability contrasts with today's mainstream healthcare with traditional late-endpoint efficacy, a practice that often compromises timely correction and elimination of ineffective treatment strategies with potentially fatal outcomes.
Similarly, while microscopy gives no prior insight into biology, it is only able to penetrate several hundred microns into tissue. Therefore, biological observation in vivo is limited by the microscope penetration limit. Clearly, methods that can penetrate deeper into tissues and visualize microscopic contrast or utilize new contrast mechanisms are of paramount importance in the dynamic observation of biological phenomena, in development research, and in drug discovery processes.
The optical function of tissues as well as molecular meso-and macroscopic imaging open new avenues for the study of many pathological processes in vivo. In fact, optical wavelengths provide a variety of detection mechanisms from intra-oximetry functional information to molecular sensing that can be used for a variety of interrogations. The use of externally administered fluorescent optical agents further enhances non-invasive photonic imaging by allowing visualization of otherwise invisible cellular and subcellular processes. For example, the use of contrast agents and fluorescent indicators specific for proteins and enzymes shows a high probability of distinguishing several different disease biomarkers, such as inflammation and tumor progression.
U.S. Pat. No. 6,641,798 discloses tumor-targeted optical contrast agents useful for diagnostic imaging and therapy. Bioconjugates (bioconjugates) are described that include cyanine dyes having a plurality of di-and tetra (carboxylic acid) homologs. The compounds may be conjugated to biologically active peptides, carbohydrates, hormones, drugs or other biologically active agents. The small size of the compound makes it easier to deliver to tumor cells than imaging agents of larger molecular weight. These contrast agents are useful for diagnostic imaging and therapy in endoscopic applications for detecting tumors and other abnormal conditions, for local therapy, for photoacoustic tumor imaging, detection and therapy, and for ultrasound fluorescence tumor imaging, detection and therapy. Fluorescence Molecular Tomography (FMT) is also capable of sensing fluorescents at the order of picomoles to femtomoles on a macroscopic scale, i.e., in deep tissues throughout an animal, with millimeter resolution. The technique shares tomographic principles with diffuse optical tomography and utilizes multi-projection illumination that is combined with a mathematical model describing photon propagation in tissue to reconstruct a three-dimensional tomographic image of fluorescent dye concentration.
U.S. Pat. No. 6,615,063 describes a fluorescence-mediated molecular tomography imaging system that is intended to detect near-infrared fluorescence activation in deep tissues. The system can use a fluorescent molecular probe as a target or a highly sensitive activatable fluorescent molecular probe. Such probes add molecular specificity and produce high fluorescence contrast to allow early detection and molecular target assessment of diseased tissue, such as cancer, in vivo.
Recently, tissue tomography using photo-acoustic (photon-acoustic) has also demonstrated the ability to achieve penetration depths ranging from millimeters up to centimeters with ultrasonic resolution. Photoacoustic imaging relies on ultrasonic detection of photoacoustic induction signals after absorption of pulsed light. The amplitude of the generated broadband ultrasound waves reflects the local light absorption properties of the tissue. Since the scattering of ultrasound waves in biological tissue is extremely weak compared to light, biomedical photoacoustic imaging combines high light absorption contrast with good spatial resolution limited only by ultrasound diffraction. Photoacoustic imaging has proven effective for imaging as follows: vascular tree, tumor angiogenesis, blood oxygen monitoring, and sensitivity to tissue chromophores, light-absorbing nanoparticles and dyes, and chromogenic assays.
For example, us patent 5,840,023 teaches a laser photoacoustic imaging system that utilizes time-resolved measurement of the profile of laser-induced transient pressure (acoustic) waves. The pressure waves are emitted by an acoustic source preferably generated in the absorptive tissue of diagnostic interest. This technique allows visualizing the distribution of absorbed light in turbid, stratified and heterogeneous tissues irradiated by laser pulses in vivo. Laser photoacoustic tomography can be used to characterize normal tissue structure and performance, and to detect tissue lesions. Optical heterogeneities that can be imaged using laser photoacoustic imaging systems include abnormal tissue such as tumors, damaged tissue, blood vessels, and other stratified tissue. Furthermore, a three-dimensional image of the organ and organ components can be obtained.
Therefore, multi-spectral detection is often applied as a way to better distinguish the spectral feature maps of the individual objects of interest. For example, U.S. Pat. No. 6,208,749 discloses a system for multispectral imaging of skin tissue that enables automatic characterization of the condition of a skin region of interest based on direct digital imaging of the skin region of interest or digitization of its color photographic pictures when illuminated by appropriately filtered light. Parameters related to texture, asymmetry, blobs, and boundary irregularities are automatically estimated. The region of interest is automatically characterized by the digital processor based on these parameters. The region of interest may include a skin lesion, in which case the lesion characteristics are characterized as malignant or benign.
In us patent 6,760,609, a method for determining the arterial blood oxygen saturation level by measuring the light transmittance through tissue of light having a first wavelength and a second wavelength is suggested. The steady-state component of the measured light transmission is used to select the appropriate calibration curve. The pulsatile component of the measured light transmission is used to determine the arterial blood oxygen saturation level using a calibration curve with selected oxygen-and deoxy-hemoglobin spectral profiles. An oximetry system is also provided wherein a plurality of light transmission measurements are used to determine the blood oxygen saturation.
In photoacoustic spectroscopy, a multi-wavelength approach was previously applied to discriminate blood chromophores (j.laufer et al, "phys.med.biol.", vol.52, p.141-168, 2007, US 7298869).
Us patent 6,498,942 also discloses a photo acoustic device comprising a source of pulsed radiation and a probe having a front face to be placed in close proximity or in contact with a tissue site of an animal body. The probe also includes a plurality of optical fibers terminating on the front face surface of the probe and connected at their other ends to the pulsed laser. A transducer for detecting the acoustic response to the radiation pulses from blood in the tissue site is also mounted in or on the front face of the probe, the transducer being connected to a processing unit that converts the transducer signals into venous blood oxygenation measurements. Another method disclosed in U.S. patent application 2004/0127783 for imaging dye markers is proposed that uses two wavelengths (in and out of the dye fluorescence band) to generate images with and without dye excitation, and combines those images for image enhancement.
A limitation of the above illumination techniques is that when operating on optically complex structures such as tissue, the resulting image is a combined effect of the target chromophore and other native tissue chromophores. This complexity is particularly important in molecular imaging applications, where molecular markers must be resolved in the presence of many other non-specific tissue absorbers. In addition, photoacoustics (or: photon acoustics) observation has hitherto been limited to the use of unidirectional homogeneous illumination, working under the assumption that similar homogeneous illumination will occur when light is propagating in tissue.
For example, WO 2007/084771 describes a method of delivering illumination that establishes a "uniform distribution of energy flux within any given plane or slice inside the body". Such an illumination field is difficult to achieve in practice, since tissue heterogeneity is unknown and can impose significant light intensity variations at any given plane inside the tissue. When considering a cylindrical object such as a mouse torso, the conversion of unidirectional illumination in polar coordinates results in the utilization of a plurality of illumination points arranged such that light is directed towards the center of the object in the longitudinal sense. In this case, in order to simplify the illumination and detection arrangement, it is required that the tissue under investigation is surrounded by water or a similar fluid.
Disclosure of Invention
It is an object of the present invention to provide an improved imaging method, in particular for clinical and preclinical imaging or laboratory research purposes, which avoids the disadvantages of conventional techniques. In particular, it is an object of the present invention to provide an imaging method that enables three-dimensional localization and molecular probe quantification in tissue with increased accuracy. Furthermore, it is an object of the invention to provide an improved imaging apparatus which is particularly suitable for performing the imaging method of the invention. The method and apparatus are provided to produce, particularly in practical implementations, a highly accurate discrimination of in vivo tissue biomarkers.
The above object is solved by an imaging method and/or an imaging apparatus comprising the features of the independent claims. Advantageous embodiments of the invention are defined in the dependent claims.
The present invention is based on the general technical teaching of quantitative three-dimensional sensing and imaging of tissue markers, in particular in clinical, small animal and small organism imaging applications, using multi-wavelength illumination while accounting for photon propagation in tissue to enable accurate understanding of a multi-spectral photon excitation field, which in turn generates sound pressure waves. To achieve three-dimensional biomarker images with unprecedented image quality, fidelity, and overall accuracy, the method combines pressure wave measurements with photon propagation models and multispectral information.
Thus, for a first aspect of the present invention, the above object is solved by a method of multi-spectral photo-acoustic tomography (MSOT) imaging of a target tissue comprising a target tissue biomarker, the method comprising the steps of: illuminating the target tissue in at least one pulsed illumination pattern at a number of illumination wavelengths absorbed by the target tissue biomarker; detecting a pressure signal (in particular an acoustic signal) from the target tissue biomarker, wherein the pressure signal is generated by the target tissue biomarker in the target tissue in response to the illumination; and reconstructing a quantitative tomographic image of the target tissue biomarker distribution in the target tissue, wherein the pressure signal is analyzed using a photon propagation model that depends on the light pattern illuminating the target tissue and on the illumination wavelength, a spectral processing scheme, and an inversion scheme that provides the tomographic image.
Thus, with a second aspect of the invention, the above object is solved by an imaging apparatus adapted for multi-spectral photo acoustic tomography (MSOT) imaging of a target tissue comprising a target tissue biomarker. The image forming apparatus includes: an illumination device configured to illuminate the target tissue with at least one pulsed illumination pattern comprising a number of illumination wavelengths absorbed by the target tissue biomarker; a detector device configured to detect a pressure signal generated from a target tissue biomarker in a target tissue as a response to the illumination; and a reconstruction device that reconstructs a quantitative tomographic image of the target tissue biomarker distribution in the target tissue. The reconstruction apparatus includes a processor that computes a photon propagation model, a processor that executes a spectral processing scheme, and a processor that executes an inversion scheme that provides a tomographic image. The image constructed according to the invention represents the spatial distribution of at least one biomarker in the target tissue.
Preferably, the reconstruction means are adapted to apply an inversion method and spectral processing for constructing an image of the vessel, in particular a vessel like a coronary or a carotid artery, wherein the image represents the spatial distribution of the biomarkers at the vessel wall.
Advantageously, the present invention combines wavelength-tuned mathematical photon modeling in tissue with multispectral processing techniques to improve functional and molecular imaging at different imaging scales. By using the invention, a three-dimensional biomarker image with unprecedented image quality, fidelity and overall accuracy is realized.
In addition, the present invention provides a multispectral illuminated biomarker indicator imaging device that can be constructed using a small form factor to detect tissue biomarkers. Advantageously, the device can be applied for imaging molecular markers in biological samples, and can be applied in clinical applications. Particularly advantageous applications include the breakdown of fluorescent proteins and/or exogenously administered color-bearing or fluorescent dyes in clinical inflammatory and cardiovascular applications, as well as in other living biological samples.
The present invention is based on the following considerations of the inventors. To detect a biomarker in a target tissue using optical methods, light is delivered locally at the region of the biomarker (or biomarker indicator). However, as light propagates in tissue, internal tissue absorption and overall light propagation characteristics change the propagation mode by causing heterogeneous deposition of energy in multiple tissue components, which are also wavelength dependent. Therefore, it becomes a challenge to isolate the contribution of the biomarkers on the detected signal.
As outlined in the background section above, multispectral methods, including photoacoustic methods, have been utilized in functional measurements to resolve tissue attenuation in selected wavelengths and derive the concentrations of oxy-and deoxy-hemoglobin, cytochrome oxidase, and possibly other tissue chromophores and externally administered dyes. However, conventional implementations assume a simple photon propagation mode. The general conventional assumption is that plane wave illumination will result in a uniform photon distribution in the tissue at the plane, which is a very rough assumption, and only surface vessel images have been obtained to date.
Contrary to conventional techniques, the inventors have developed a method of performing photoacoustic imaging of tissue biomarker indicators that provides not only true three-dimensional and quantitative imaging of surfaces, but also true three-dimensional and quantitative imaging of contrast agents located deeper. Compared to the techniques applied to resolve universal chromophores, a particularly advantageous feature of the invention is: the multispectral measurements are combined with a wavelength-dependent photon propagation model in the tissue to provide an accurate estimate of the photon propagation in the tissue. This approach is essential to provide accurate photoacoustic images and is particularly important in clinical imaging, however the general assumptions of conventional photoacoustic imaging (uniform illumination, immersion in a matching fluid) are not practical. It is therefore a feature of the present invention to provide quantitative information on the distribution of photons in target tissue.
According to the present invention, the correction of the light distribution can be applied to the reconstructed image of the biomarker distribution. Alternatively, the correction of the light distribution is applied directly to the detected original photoacoustic signal. In this case, the original photoacoustic recording that has been normalized will be used to reconstruct the final quantized light absorption image (e.g., by back projection).
Imaging the molecular marker distribution in real tissue by photoacoustic means may present additional challenges. First, the contrast in light absorption in vivo can be up to two orders of magnitude at some wavelengths. In particular, some areas with high blood volume are very absorbent, making it difficult to distinguish the marker from a highly absorbent background. Images obtained from real tissue will generally represent an increased absorption contribution not only by the molecular markers of interest, but also by many tissue chromophores such as melanin, erythrocytes, etc., which can change their light absorption considerably with wavelength (especially in the visible). Some of these chromophores may have significant cross-talk with the extinction/absorption spectrum of the biomarker of interest, which may also complicate its detection relative to the background.
Thus, another important feature of the present invention is the application of a multi-wavelength spectral matching process that incorporates previously known or measured marker spectra and most importantly internal tissue components. This is important to achieve quantification of molecular marker accumulation in highly heterogeneous tissues. Advantageously, the spectral matching process may be applied during various stages of image formation, e.g. during photon propagation model calculation, and/or image reconstruction from photoacoustic data by back projection.
Multi-wavelength excitation is considered to be particularly advantageous for molecular imaging applications because it does not require a "baseline" measurement, i.e. a measurement prior to administration of the molecular marker. Thus, modulation of molecular markers with long accumulation or excitation times or intrinsic tissue molecular markers (such as fluorescent proteins) can be accurately detected with high sensitivity. Conversely, since illumination at multiple wavelengths is provided, the method is even applicable in imaging dynamic phenomena, such as hemodynamics or cycling of non-specific dyes with varying concentrations over small time periods (such as ICG), however, it is preferable to apply a correction step based on prior knowledge of the dynamics.
The present invention enables molecular imaging to have powerful potential applications due to its excellent spatial resolution in photoacoustic mode, the use of non-ionizing radiation, and the increased availability of molecular markers that can affect detection sensitivity, such as many targets or activatable fluorochromes, fluorescent proteins, or chromophore species.
Many fluorescent dyes such as Alexa or Cy-based dyes, ICG, compared to most pure chromophores with relatively broadband optical absorption characteristicsFluorescent proteins (GFP, RFP) exhibit sharp resonances near their peak excitation spectrum, making them convenient candidates for high sensitivity multi-wavelength imaging. At the same time, some fluorescent dyes (especially in the near infrared) possess more than 10 combined with low quantum yields5M-1cm-1A relatively high molar extinction coefficient (which acts to facilitate generation of a photoacoustic signal). Thus, although more specific pure chromophoric molecular markers can be developed, readily available fluorescent imaging can be achieved at useful physiological concentrations, even in the presence of highly absorbing tissue chromophores. Acquisition over an even greater number of wavelengths can result in multiple absorbers, markers, and fluorescers being resolved independently at the expense of longer acquisition times.
Preferably, the pressure signal is detected using an acoustic detector device. Alternatively, the pressure signal can be obtained using optical measurements to sense changes in the target tissue surface. Operating with optical detection, the inventive method can be used for whole body small animal imaging in free space mode and in full projection mode (g.zacharakis et al, PNAS 102 (51): pp.18252-18257, 2005) or mesoscopic imaging with variable resolution depending on the dimensions of the imaged object (c.vinegoni, c.pitsouli, d.razansky et al, nare METHODS 5(1), 2008).
Embodiments with tomographic reflection or transmission illumination can further be used for clinical imaging in detection through breast tissue several centimeters, for example in detection of cardiovascular or neurological diseases, such as in transmission illumination mode or in reflection mode at a depth of 4cm to 5 cm. Operating with acoustic detection (like ultrasound), the method can be applied with increased (like ultrasound) resolution in similar applications and geometrical transplantation, however, acoustic detection is typically performed by matching media, such as matching fluids or colloids.
According to a preferred embodiment of the invention, the illumination pattern comprises different wavelength ranges over at least two spectra in a time-shared manner. Preferably, the illuminating step comprises illuminating the target tissue with at least two shaped pulsed illumination patterns, which are sequentially directed to the target tissue. It is particularly preferred to provide the illumination pattern with a time interval of less than 1s, preferably less than 1ms, and as low as 10 mus, depending on the size of the imaged object and its distance from the point where the pressure measurement is recorded. The smallest possible time interval has to be chosen such that the pressure signals originating from all points in the imaged area have to be measured before the next illumination pulse is emitted. In this way, distortions of the pressure signal acquired with different wavelength ranges can be avoided.
According to another preferred embodiment of the invention, the at least two spectrally distinct wavelength ranges of the illumination pattern comprise at least two wavelengths, which have a different absorption by the target biomarker, respectively. The different wavelength ranges cover at least two spectral absorption regions where the target tissue biomarker has different absorption values. Preferably, the absorption spectrum of the biomarker molecule varies in the range below 100 nm, in particular preferably below 70nm, for example in the range of 20 nm to 50 nm.
The photon propagation model under consideration accounts not only for absorption heterogeneity in the target tissue, but also for diffusion heterogeneity, if necessary. According to a further preferred feature of the invention the photon propagation model is preferably calculated on the basis of at least one of the following methods.
First, a photon propagation model suitable for illumination geometry and pressure signal detection in the target tissue can be calculated (constructed) using the solution of the photon transport equation. Second, an empirical model of photon transmission in the target tissue can be used to calculate the photon propagation model.
With the first and second methods, the distribution of the illumination light flux can be calculated according to the specific geometric condition of the target tissue. The photon propagation model relies on changes in the illuminating wavefront due to structures in the target tissue, which provides improved analysis of the pressure signal. For example, as previously given by the present inventors (d. razansky and v. nzniachristos, MEDICAL PHYSICS 34 (11): pp.4293-4301, 2007), the luminous flux through the sample can be calculated by solving a diffusion equation based on the absorption map and boundary conditions derived from the photoacoustic image in the previous step. As another example, a diffusion model may be appropriate for most clinical applications where photons will penetrate several millimeters to several centimeters in tissue. Accordingly, for small animals and in particular for mesoscopic imaging, mesoscopic meaning tissue of size 0cm to 1cm, a more accurate solution of the photon propagation model, including numerical or analytical solutions of the transmission equation, will generally be preferred.
Third, models incorporating the incident photon distribution and/or illumination pattern can be used to calculate photon propagation models. This variant is preferred if the illumination pattern is provided with a predetermined geometrical distribution of photon densities. As an example, if the illumination mode is provided at the fiber output, a photon propagation model is calculated based on the spot-shaped incident photon distribution and the illumination light spherical propagation. For another example with a rectangular illumination array, the incident photon distribution and/or illumination pattern introduced into the photon propagation model is used accordingly.
Fourth, a photon propagation model can be calculated using the detected pressure signals and/or photoacoustic images generated at any reconstruction stage. In this advantageous example, no assumptions about the illumination field are required, so that the method can work in any illumination setting, from operating a handheld scanner with multiple illumination areas to intravascular imaging. This is one of the particularly preferred features of the present invention. While most conventional systems follow guidelines that aim to utilize matching fluids and certain optical arrangements that allow uniform illumination of tissue, this embodiment does not rely on the details of the source and detector geometry. In addition, the use of multispectral imaging methods allows for the resolution of important tissue biomarkers in the functional and molecular imaging sense on a non-specific absorption background.
In other words, in a preferred embodiment, rather than indirect photon propagation modeling, the light flux in the tissue can be extracted directly from the photoacoustic data. Photoacoustic as outlined in more detail belowThe signal represents the product of the local luminous flux and the local absorption coefficient. In most practical examples, it can be assumed that the flux exhibits a slower spatial correlation than a more rapid change in absorption coefficient. To effectively resolve these two contributions using a blind source separation method, one may do so, such as by combining the photoacoustic responses Ψk(λ)=Uk(λ)μk(λ) fitting into a sparse representation library (sparse representation dictionary) comprising two or more bases with different spatial characteristics takes advantage of the above fact. A particular advantage of the present method is that it is independent of the particular experimental geometry and measurement conditions.
According to the invention, the above-described method for calculating a photon propagation model can be combined in order to further improve the image reconstruction of the invention.
The inversion step of the inventive method is provided for reconstructing a three-dimensional distribution of biomarkers (for example) from a series of measured pressure signals. In each case, the specific inversion scheme will vary based on the particular geometric and physical characteristics and spatial distribution of the detection elements used. Typically, this inversion can be done by back-projecting the raw or spectrally processed signal recorded by each point detector into the virtually imaged volume, and summing all detector positions (projections).
The inversion may also include normalization of the original photoacoustic signal or image by a photon propagation model (light distribution model). Thus, for a preferred embodiment of the present invention, the inversion scheme combines a photon propagation model and an acoustic propagation model in tomographic reconstruction to produce quantitative tomographic images.
According to the above described embodiments of the invention, the inversion scheme preferably incorporates the photon propagation model and/or the acoustic propagation model in an iterative fashion. In many practical embodiments, especially in small animals and clinical applications, the optical absorption map of the photoacoustic reconstruction can be iteratively fed into the photon propagation model to further improve the prediction of photon propagation and the resulting photoacoustic reconstruction.
As another advantage of the present invention, a spectral processing scheme can be performed during various stages of image reconstruction. In particular, according to a preferred embodiment of the invention, the spectral processing scheme comprises an integration into the inversion scheme, a processing step of the acquired pressure signal data, and/or a processing step of the reconstructed image data.
Due to the improved pressure signal data processing, in particular based on photon propagation models and spectral models, the present invention provides a new option for designing an imaging apparatus, which is suitable for implementing the inventive imaging method. According to a first advantageous variant of the invention, the illumination device and the detector device, in particular the illumination light output element and its sensor, can be integrated into an integrated component (referred to as a measurement head unit). The use of a measuring head unit provides important advantages in performing the imaging and detection steps. The illumination and detector arrangement is easy to place, since the measuring head unit can be simply placed in contact with the target tissue component to be investigated. In particular, the measurement head unit can be placed on the inner surface of the target tissue, for example in a hollow organ or vessel like a blood vessel, or on the outer surface of the target tissue, for example on the epidermis. Thus, for a particularly advantageous variant of the invention, at least one of the illumination means and the detector means of the imaging means is comprised in an endoscopic, laparoscopic or interstitial device.
As a particular advantage, the measurement head unit can be provided as a handheld device for non-invasive or endoscopic and laparoscopic applications. Furthermore, according to the present invention, the measurement head unit can be used without a matching fluid between the measurement head unit and the target tissue. Advantageously, the contact of the measurement head unit with the target tissue is sufficient for introducing the illumination mode and for acquiring the pressure signal.
Advantageously, the measuring head unit can be designed according to the specific requirements of the application. According to a preferred embodiment of the invention, the measurement head unit comprises an array of illumination elements and sensor elements. The array of illumination and sensor elements comprises an arrangement of illumination and sensor elements on the measuring head unit contact surface at a distance from each other, depending on whether the application of the invention is a planar contact surface or a curved contact surface.
The array of illumination and sensor elements provides an illumination pattern (a geometric pattern of illumination light to be introduced into the target tissue) and a geometric pattern of sensor elements that acquire pressure signals for tomographic image reconstruction. For a particularly preferred embodiment of the invention, the array of illumination and sensor elements comprises a linear arrangement of at least one illumination element and a linear arrangement of at least one sensor element and/or comprises a matrix-shaped arrangement of illumination and sensor elements, wherein both are alternately distributed.
According to a second variant of the imaging device, the illumination device and the detector device, in particular the illumination element and the sensor element therein, can be provided as separate elements. In this case, advantages in adjusting the geometry and position of the illumination and detector arrangement relative to the target tissue can be obtained. As a first example, the illumination and detector devices are co-disposed on the outer or inner surface of the target tissue as described above. Preferably, one of the illumination and detector means is arranged within the target tissue, in particular in contact with an inner surface thereof; while the other of the illumination and detector means is arranged outside the target tissue, in particular in contact with an outer surface thereof. The illumination of the target tissue can be improved if the illumination device is arranged in the target tissue, for example in a vessel or directly in the subcutaneous environment in the tissue, while the acquisition of the pressure signal can be facilitated by using a detector device arranged on the outer surface of the target tissue.
In the opposite case, the illumination means can be arranged on the outer surface of the target tissue, so that the positioning of the illumination element with respect to the tissue to be investigated can be improved. In this case, it is possible to arrange the detector device, such as being part of an endoscopic device, in the target tissue, for example like a hollow organ or a vessel of the target tissue, or even in a subcutaneous environment if necessary.
Another advantage of the array of illumination elements is obtained if the illumination elements are configured to provide illumination light having different projection directions relative to the target tissue. The lighting elements are preferably arranged such that at least two different diffuse projection directions are obtained. Illuminating the target tissue with at least two different projection directions has the particular advantage of providing a complex illumination field, which facilitates the inversion of the acquired pressure signals into a reconstructed image of the target tissue.
According to the present invention, detection of tissue biomarkers can be achieved by distinguishing between internal tissue chromophores and fluorescers, or by using biomarker indicators, i.e. at least one endogenous indicator such as a fluorescent protein, or externally administered probes specific for certain tissue biomarkers. Light absorbing indicators are preferred, such as fluorochromes and fluorescent dyes or fluorescent conjugates, color-bearing reagents and substrates, or noble metal (gold, silver, etc.) or other metal-based nanoparticle reagents. Advantageously, the inventive method can be used to resolve existing molecular markers, including fluorescent probes, absorbing targets or encapsulated nanoparticles, and fluorescent proteins. Thus, with another preferred embodiment of the present invention, the target tissue comprises a light absorption indicator targeting the biomarker. This allows application in basic biological imaging as well as in preclinical imaging and clinical applications.
As a preferred embodiment, the light-absorbing indicator comprises at least one of: fluorescent or chromophoric molecules such as AlexaFluor, fluorescent proteins such as GFP, particles including noble metals such as gold nanoparticles, superparamagnetic particles such as iron oxide nanoparticles (SPIO), carbon particles, and activatable substrates such as X-gal.
Thus, the inventive method works with multiple light-absorbing substrates. By selecting predetermined biomarker indicators having a characteristic pattern of e.g. steep absorption changes in their absorption spectra, the imaging performance is improved. The term "steep change in the absorption spectrum" refers to an absorption property such that at least 80% of the indicator peak extinction (or absorption) is lost within a spectral window of less than 100 nm, particularly preferably less than 50nm, for example 20 nm in a window of 750 nm to 770 nm (in the case of AlexaFluor750, a fluorescent molecule).
Imaging near infrared fluorescent markers is of particular general interest because of the steep decline in the extinction/absorption spectrum of the near infrared fluorescent markers in the spectral window above 630nm compared to the smooth absorption change of the ordinary tissue chromophore spectrum in this region. In this way, internal tissue contrast can be easily suppressed using a multi-wavelength approach, resulting in high-sensitivity cancer (cancerve) imaging of the distribution of fluorescence in tissue obtained by spectral matching of photoacoustic images acquired at several different adjacent wavelengths. In addition, multispectral imaging can be used to resolve multiple absorbers/fluorophores in the tissue, and as described above, the overall method can be further improved by more accurately accounting for the relative background absorption attenuation of the tissue at each wavelength used.
The invention is preferably used for imaging tissues of small animals, tissues of mesoscopic size, i.e. tissues having a typical size in the range of 100 μm to 5cm, in particular in the range of from 0.5mm to 1cm, or tissues or tissue components of the human body (or of an animal body of comparable size to the human body). The imaging preferably allows to obtain information on which a subsequent diagnosis can be prepared. The inventive target tissue biomarker imaging provides information for diagnosing, inter alia, cancer diseases, cardiovascular diseases (which include, inter alia, atherosclerotic plaques), inflammatory diseases. Alternatively, the imaging allows information to be obtained about the disease state and/or the progress of the disease treatment.
Specific preferred implementations are described herein that enable non-invasive imaging of fluorescent proteins in biological samples such as insects, worms, fish and rodents, rabbits, pigs. In another embodiment, specific implementations of detecting atherosclerosis biomarkers in cardiovascular disease are described. However, different approaches in cancer, immunology, neurodegenerative diseases, etc. can be envisioned.
Quantitative tomographic images are provided as a result of the inventive method. In addition, the image can be processed by at least one of: display by a display device, storage in a computer storage device, recording using a recording device such as a printer or other image output device, and provision to an image processing method as input data.
Drawings
Further details and advantages of the invention are described below with reference to the accompanying drawings, in which:
FIG. 1: a schematic representation of an embodiment of target tissue biomarker imaging according to the present invention;
FIG. 2: a schematic flow chart illustrating features of a preferred embodiment of an imaging method;
fig. 3 to 5: a schematic illustration of a measuring head unit of an imaging device according to the invention;
FIG. 6: illustration of an array of illumination and sensor elements of an imaging device according to the invention;
fig. 7 to 9: schematic illustration of an alternative embodiment of the inventive imaging method and apparatus; and
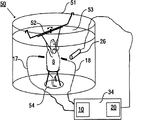
FIG. 10: an experimental setup for imaging small animals in laboratory experiments.
Detailed Description
With specific reference now to the drawings in detail, it is stressed that the particulars shown are by way of example and for purposes of illustrative discussion of the preferred embodiments of the present invention only, and are presented in the cause of providing what is believed to be the most useful and readily understood description of the principles and conceptual aspects of the invention. In this regard, no attempt is made to show structural details of the invention in more detail than is necessary for a fundamental understanding of the invention, the description taken with the drawings making apparent to those skilled in the art how the several forms of the invention may be embodied in practice. As used herein, an element or step recited in the singular and proceeded with the word "a" or "an" should be understood as not excluding plural elements or steps, unless such exclusion is explicitly recited. In the description of the drawings, like numbers represent like parts. The figures are generally not drawn to scale. For clarity, unnecessary elements have been omitted from some of the figures. Some optional elements may be drawn in dashed lines.
1、Features of the preferred embodiments
An imaging method and an imaging apparatus of the present invention are illustrated in fig. 1 as essential parts. The imaging apparatus 100 comprises an illumination apparatus 10, a detector apparatus 20 and a reconstruction apparatus 30. The illumination device 10 is arranged for introducing illumination light in a predetermined illumination pattern into the target tissue 1 comprising the distribution of the biomarkers 2 to be imaged.
The lighting device 10 can be embodied by various light sources as listed below. The particular light source used is selected according to the requirements of the application of the invention. Typically, the illumination device 10 includes a light source, such as a laser source or light emitting diode (LD), and a light guide, such as an optical fiber that transmits illumination light from the light source to an output or contact surface of the illumination device 10. Furthermore, the lighting device 10 is preferably adapted to emit in at least one pulsed illumination mode at several illumination wavelengths in the far-red or near-infrared wavelength range, i.e. preferably with wavelengths larger than 630 nm.
The detector device 20 is adapted to sense a pressure signal from the target tissue 1, which pressure signal is generated by the biomarker 2 in the target tissue 1 as a response to the illumination. Typically, the detector device 20 is an acoustic detector device comprising at least one movable detector element and/or a plurality (array) of detector elements. The latter is known from techniques such as ultrasound imaging. Alternatively, the pressure signal can be collected with an optical detector immersed in the matching liquid, or the surface changes of the target tissue can be non-contact sensed, such as by an optical module of an optical interferometer setup.
The reconstruction means 30 are generally adapted to reconstruct quantitative tomographic images of the biomarkers 2 in the target tissue 1. The reconstruction means 30 comprises at least one processor 31 adapted to calculate a photon propagation model, to execute a spectral processing scheme and to execute an inversion scheme for providing tomographic images. In addition, a processor 32 suitable for raw data processing can be provided. The processors 31 and 32 can be implemented in common circuitry. Alternatively, the above-described functions of the processor 31 can be realized by a plurality of discrete processor elements included in the reconstruction apparatus 30. Each processor may be implemented using a programmed microprocessor to perform its specific functions.
The reconstruction means 30 are connected to output means 33 which are adapted to provide a reconstructed tomographic image for further processing or application. In particular, the output device 33 includes at least one display device such as a computer monitor, a storage device such as a storage medium in a computer, and a recording device such as a printer.
The inventive imaging method is carried out using the imaging apparatus 100 of fig. 1 listed below. Illumination light is irradiated on an imaging region of interest in the tissue 1 using the illumination device 10. In a preferred embodiment, pulsed illumination of multiple wavelengths is emitted into the tissue 1 at one or more locations or angles in the visible and/or near infrared spectral range. This ability to form multiple projections (positions or angles) with light helps provide the imaging device as a handheld scanner, or intravascular scanner (see below). The duration of the individual pulses is preferably in the nanosecond range (i.e. below 100ns, particularly preferably below 10ns) with a spacing of at least 10 to 100 mus in between.
After the transient temperature increase caused by the above-mentioned pulse absorption in the tissue 1, broadband acoustic radiation is induced in the tissue 1. The amplitude of the induced acoustic wave is proportional to the local luminous flux, the optical absorption coefficient and the thermoelastic properties of the object.
The pressure signal (acoustic wave, in particular sound) generated as a response to the illumination is subsequently detected by the detector device 20. The induced response is acquired by translating the acoustic detector elements around the tissue 1, or alternatively by placing a fixed array of detector elements near the tissue 1.
The optical absorption can then be reconstructed by back-projecting the detected pressure signals into a virtual imaging volume or by various Radon transforms. By solving the complex problem of photon propagation in the tissue 1, when it is assumed that the thermoelastic properties are constant, it is possible to quantitatively reconstruct selected tissue biomarkers 2 based on different absorption spectra, which are wavelength-dependent or operate on the basis of a simplification of all wavelengths considered propagating in the medium with the same or similar optical properties.
The pre-processing of the raw data by the processor 32 may include basic filtering and noise reduction. The image forming processor 31 applies an inversion scheme appropriate for the particular illumination and detection configuration. It also applies a spectral processing step responsible for distinguishing the biomarker from the background absorption in the tissue 1, and a photon propagation modeling step aimed at quantifying the biomarker image. In the image formation stage, the order of inversion, photon propagation modeling, and spectral processing steps can be varied based on the particular implementation and application requirements. As a result, an image 3 of the tissue biomarker of interest 2 is generated.
In each case, the particular inversion scheme will be different based on the particular geometric and physical characteristics and spatial distribution of the detection elements used. For example, in the case of using a phased array of acoustic detection elements, the image can be formed in real time by incorporating a simple ultrasound beamforming algorithm into the inversion process.
The basic result of the inversion can be presented in the form of an image(s) 3 representing the local optical absorption coefficient of the tissue 1.
2. Theoretical considerations
In fact, the detected photoacoustic response does not directly provide the local absorption coefficient μ (λ), but rather provides the absorption energy density Ψk(λ) a reconstructed image representing the absorption coefficient μ (λ) and the light flux U in the samplekCombinations of (λ), i.e. Ψk(λ)=Uk(λ)μk(lambda). Due to the strong light attenuation and heterogeneity of biological tissues, the flux cannot generally be assumed to be constant throughout the region of interest. However, only the absorption coefficient itself can provide relevant quantitative information about the biomarker distribution. The ability to quantify the actual distribution of markers within a sample therefore depends on the accuracy of the initial reconstruction of the light absorption map at each wavelength to be deconvolved from the light flux distribution.
Photoacoustic inversion
Broadband acoustic radiation is induced in the tissue after a transient temperature rise caused by short-pulse absorption of optical energy in the substance. The amplitude of the induced acoustic wave is proportional to the local energy density, the optical absorption coefficient, and the thermoelastic properties of the object. Their spectra, in turn, depend mainly on the spatial frequency of the energy deposition variations and the duration of the emitted pulses. For pulse durations in the ns range, bio-related photoacoustic spectroscopy will have ultra-wideband properties with useful information contained between tens of kHz and tens of MHz depending on the size and spatial distribution of the light absorption variations within the imaged object.
Preserving the correct shape of the detected response is important for the correct quantification of the resulting image. Since such wideband detection can be difficult to achieve effectively, the preferred way to recover the initial tissue response is to deconvolute the recorded signal from the frequency response of the detector. Alternatively, an ultra-wideband detection method such as an optical interference method may be used based on detection of surface motion or mechanical oscillation in an optical resonance element such as a Fabry-Perot film, a ring resonator, or an etalon.
Providing inversion for the recovery of acquired ultrasound pressure from backprojected raw or spectrally processed signals A three-dimensional distribution (for example) of the biomarkers is reconstructed. In each case, the inversion scheme will be different depending on the particular geometry and physical properties and spatial distribution of the detection elements used. For example, in the case of using a phased array detector, an image can be formed in real time by using a simple ultrasound beamforming algorithm.
In general, the photo-acoustic induced pressure is under heat-sealed (heat confining) conditions, i.e. when the light energy pulse is short enough that the heat diffusion during the pulse is not significant Density of absorbed energy
 (in J/m)3In units), and local temperature increases
 The spatial-temporal correlation between can be expressed as:
wherein, vS、ρmβ and C are the corresponding sound velocity, mass density, isobaric volume expansion, and specific heat of the medium, all of which are generally space and frequency dependent.
In practice, an excitation pulse duration of less than 1 μ s achieves a heat-seal condition. When, for example, a point-shaped detector element of small diameter (e.g. below 1 mm) is placed in positionIn the middle, to a first approximation, it will sense an integrated pressure wave, i.e. the solution of (1), i.e. (1)
The basic results of the inversion step can be given in the form of image(s) representing the local deposition of tissue biomarkers.
Photon propagation modeling
Tissue biomarker imaging is based on local optical absorption reconstruction. However, as already mentioned, the raw photoacoustic data does not directly represent the absorption coefficient, but represents the combination of the absorption coefficient and the light flux in the sample. In one of the preferred embodiments of the current invention, a quantitative description of photon propagation in tissue (flux rate) based on a known light propagation model in tissue is utilized in order to resolve optical absorption from flux.
The flux of the entire region of interest can be calculated using the equation of transmission of light in the diffusion medium. A preferred approximation of the diffusion equation takes the form:
wherein D ═ 1/[3(μ)s′+μa)]Is the diffusion coefficient (μ) of the mediumaAnd mus' absorption and simplified scattering coefficient, respectively) and is the source distribution. To solve this diffusion equation, the medium μmust be knownaAnd muS' spatially varying optical properties and the spatial distribution and intensity of the source elements on the right. In complex geometry, the light diffusion can be calculated using equation (3) by using a finite element method.
It must be noted that the light diffusion approximation is only effective in macroscopic objects whose size is many times larger than the Mean Free Path (MFP) in tissue, which generally corresponds to objects larger than 10 mm. For smaller objects, a mesoscopic approximation of the optical transmission equation is applied. In this case, one of the most accurate but computationally intensive methods is to apply Monte-Carlo simulations of optical transmission. However, as we have demonstrated in NATURE METHODS 5(1), 2008 of c.vinegoni, c.pitsouli, d.razansky et al, some simple analytical approximations like the fermi function can be effectively applied.
Spectral processing
The current invention provides an efficient method for imaging molecular markers of interest by suppressing internal tissue contrast using a multi-wavelength approach. This results in highly sensitive imaging of the distribution of molecular markers in tissue obtained by spectral matching of images acquired at several different wavelengths. Although the simplest version of this operation can be achieved by image subtraction imaging at two wavelengths, three and all multiple wavelengths, this will further suppress the background signal. This processing can occur in several stages, the effective one being a synchronous inversion of the spectral data so that all information is accurately taken into account.
A preferred embodiment, which simplifies the calculation, however, the following is utilized on a per pixel basis for the molecular marker of interest CkGeneral quantification formula of the reconstruction amount (concentration):
wherein, CkIs the reconstructed quantity (concentration) of the molecular marker of interest on a per pixel/voxel basis, N is the total number of illumination wavelengths, Ψk(λ) is the reconstructed absorption in pixel/voxel k, ckAnd ε (λ) is the concentration of marker and the wavelength dependent molar absorption, respectively. We note that the wavelength dependent absorption coefficient μ (λ) in each pixel/voxel will be written in conventional form as:
wherein M isIs the total number of wavelength-dependent markers and tissue chromophores considered in the reconstruction process. Then, the process in equation (4) will be included in a series of concentrations Minimization on (M ═ 1.., M).
Alternatively, it can be assumed that each pixel k in the photoacoustic image can represent the combined contribution of the molecule and other background tissue chromophores. For each imaged wavelength λ, this can be written in the form of a linear equation:
wherein, is a wavelength dependent absorption, alpha, in the reconstructed pixel kMM(lambda) and alpha1(λ),α2Is the molar extinction spectrum of the molecular marker and the background chromophore, and
 and
and are the corresponding concentrations. Using the measured absorbance and 7 wavelengthsCan be subsequently reconstructed from the above linear equations on a per pixel basis using a linear regression method to reconstruct the concentrations of the molecular marker(s) and the background chromophore
A preferred method for achieving molecular marker discrimination is to include the spectral information in the inversion mode using a single-step or two-step approach.
The single step method involves inverting the tomographic equations for the different wavelengths employed simultaneously, thus simultaneously taking into account 1) the photon attenuation as a function of depth (distance from the source), 2) the detection process, and 3) the wavelength dependent measurements.
The two-step method preprocesses the raw data using spectral matching or decomposition algorithms and then utilizes one processed measurement as input to the inversion code, which only considers 1) photon attenuation as a function of depth (distance from source) and 2) the detection process. An alternative two-step approach can be implemented by reconstructing images at different wavelengths, and then processing the resulting images on a pixel-by-pixel basis.
Image formation
An example of an image forming process is shown in fig. 2. First the raw photoacoustic recordings (step S1) are filtered (step S2) and sent into the inversion scheme (step S3). Subsequently, the resulting initially reconstructed image is processed (step S4) to extract the geometry (boundary, interior or exterior surface) of the imaged target tissue. This is provided for modeling the subsequent light distribution in the tissue (step S5), which is calculated using a previously known light pattern incident on the tissue (step S6). This process is repeated in an iterative manner, wherein at each step the inversion scheme normalizes the reconstructed image by the calculated light distribution, which is also iteratively improved. To visualize the biomarkers (step S8), the image is subjected to spectral processing for background absorption elimination (step S7).
3. More applications
There are numerous applications for the inventive process. Although not limited to the biomedical field, the application of this technology to medical and biological imaging is an important direction.
3.1 biological imaging
Fig. 3 schematically illustrates an embodiment in which the present invention is used to image a portion of a human proband 4, such as a patient, for example, to image a target tissue 1 including an organ 5. The imaging device 100 comprises an illumination device 10, a detector device 20 and a reconstruction device 30, which are integrated in a common box 34, and the measurement head 40 is connected to the illumination and detector devices 10, 20 via optical fibers and cables.
As illustrated in fig. 4 below, the measurement head 40 can include discrete components with illumination and sensor elements. Alternatively, the measuring head comprises an integrated measuring head unit, as given in further detail below (fig. 5, 6), which contains the illumination elements and the sensor elements in a common box.
In a preferred embodiment, the agent is injected intravenously or locally to proband 4, as well as to the target area or process of interest. The measurement head unit 40 is brought into contact with the tissue, so that the illumination light is coupled into the tissue and the pressure signal can be sensed. The acquired pressure data is processed and presented on a monitor in the form of a two-dimensional or three-dimensional image.
Examples of applications include the administration of fluorescent emitting agents that are preferably taken up by macrophages. When imaging atherosclerotic plaques in the carotid artery or other vessels, their absorption images produce areas of increased inflammation. Similarly, the targeted absorbing particles can show information on target molecules such as peptides, nerve endings, and the like.
Fig. 4 schematically illustrates the adjustment of the imaging apparatus 100 with respect to the target tissue 1 to be investigated. The lighting device comprises at least two lighting elements 11, 12, which are placed at a distance, such as 15 mm, with respect to each other. The distance of the illumination elements 11, 12 from the outer surface 6 (e.g. skin) of the target tissue 1 is e.g. 20 mm. Alternatively, the lighting elements 11, 12 can be arranged in contact with the outer surface 6. The illumination elements 11, 12 comprise, for example, LEDs having a predetermined emission characteristic defining a projection direction towards the target tissue 1. Alternatively, the illumination elements 11, 12 comprise fiber optic outputs connected to a laser source, such as the imaging device 100 in the box 34.
The detector arrangement 20 comprises an array of detector elements 21 embedded in a surface (contact surface) of the detector arrangement 20. The contact surface is adapted to be in contact with an outer surface 6 of the target tissue 1. The detector device 20 comprises a sound sensor as known from conventional ultrasound imaging devices.
An alternative embodiment is illustrated in fig. 5 and 6, in which the illumination and sensor elements 11, 12, 21 are integrated into a common measuring head unit 40. The measuring head unit 40 includes a case body 41, and the illumination elements 11, 12 and the sensor elements 21, 22 are embedded in the case body 41. The illumination and sensor elements 11, 12, 21, 22 are integrated into the contact surface 42 of the measuring head unit 40. The elements 11, 12, 21, 22 are associated with the relevant parts of the illumination and detector devices 10, 20 integrated into a box 34 via optical fibers 13, 14 and electrical wires 23, 24, respectively (see, for example, fig. 3).
Fig. 6A, 6B and 6C illustrate embodiments of the invention featuring different distributions of the illumination and sensor elements 11, 12, 21, 22 on the contact surface 42 of the measuring head unit 40. According to fig. 6A, a linear arrangement is provided with two rows of outer lighting elements 11, 12 (e.g. LEDs or output ends of optical fibers) and one row of middle sensor elements 21 (acoustic sound sensors). Fig. 6B illustrates the inverse geometry with one row of middle illumination elements 11 and two rows of outer sensor elements 21, 22. Fig. 6C shows a matrix arrangement of the elements 11, 12, 21, 22.
The illumination elements 11, 12 are configured for illuminating the target tissue in at least one pulsed illumination pattern at several illumination wavelengths. As an example, in order to provide two different wavelength ranges, a first group of lighting elements 11 (e.g. indicated with "a") is adapted to emit illumination light having a wavelength in the range of 610nm to 650nm, while a second group (e.g. indicated with "b") is adapted to emit a wavelength in the range of 670nm to 730 nm. In order to emit a larger number of wavelength ranges, a third or more sets are provided.
It is emphasized that the number of illumination and detector elements shown in fig. 6 is chosen for illustrative purposes only. In practice, the number of elements can be chosen according to the requirements of lighting and sound detection.
Fig. 7 to 9 illustrate further embodiments of the invention, wherein illumination and detector elements are used which are separate from each other. As an example, imaging of a target tissue 1 comprising a blood vessel 7 is illustrated.
According to fig. 7, the illumination device 10 comprises a light source 15 and an optical fiber 16, the optical fiber 16 being introduced into the blood vessel 7 to a position of the target tissue 1 to be imaged. The detector arrangement 20 comprises an array of detector elements adapted to be brought into contact with an outer surface 6 of a target tissue 1, such as the skin of a human body. In operation, a pattern of illumination light having different wavelength ranges is emitted through the optical fiber 16 onto the inner surface of the blood vessel 1. The pressure signal created by the absorption biomarkers within the tissue 1 is sensed with the detector device 20.
For example, if a Cy5.5 dye is used as a biomarker, targeting a peak absorption at 670nm, the multispectral illumination device may include a laser diode-based illumination device that emits light at 7 different wavelengths, i.e., 610, 630, 650, 670, 690, 710, and 730nm, covering the high and low absorption regions of the dye, thereby facilitating subsequent multispectral processing and background absorption signal suppression.
According to fig. 8, the optical fiber 16 of the illumination device 10 and the sensor element 25 of the detector device 20 are arranged within a vessel in the target tissue 1. Both components can be integrated in an endoscopic device (not shown).
According to fig. 9, the illumination elements 11, 12 of the illumination device 10 are arranged outside the target tissue, whereas the detector elements 25 of the detector device 20 are provided in blood vessels within the target tissue 1.
FIG. 10 illustrates a preferred application of the inventive technique in biomedical imaging of mesoscopic sized objects and small animals like rodents or other rodents, flies, fish, worms, animal embryos. A container device 50 comprising a magazine 51 and holding elements 52, 54 is provided, which is suitable for placing components of the imaging device 100. The cartridge 51 contains a matching fluid 53 such as water or oil. The object to be studied (live mouse 8) is placed on the lower part 54 of the rod or disc-shaped holding element.
The illumination means 10 and the detector means 20 are partly integrated in the box 34 (see above, fig. 3), i.e. arranged outside the container means 50. The illumination device 10 comprises a pulsed laser source, the light of which is directed towards the mouse 8 from two opposite directions 17, 18, for example by using mirrors or optical fibers. The detector arrangement 20 includes an array 26 of acoustic detector elements. The detector device 20 is arranged in the vicinity of the holding element 52 of the mouse 8. Advantageously, there are no specific limitations regarding the location of the detector device 20. However, it is preferred that the position will be as close to the object as possible, so that measurements with a high signal-to-noise ratio are obtained. In order to achieve the above image reconstruction, it is only necessary to have information about the position of the array of detector elements relative to the object (mouse 8).
The embodiment schematically illustrated in fig. 10 is not limited to a study of small animals. Alternatively, other biological targets such as humans or larger animals or parts thereof may be imaged. As an example, the cartridge 51 can be adapted to accommodate a portion of a human patient other than a mouse 8.
3.2 clinical imaging
Preferred fields of clinical application include imaging of cardiovascular diseases, cancer, inflammation and neurodegenerative diseases, to name a few. Imaging of natural states such as growth and aging is also contemplated. As a particular advantage, the inventive near field imaging can be carried out without the use of matching liquids between the near field source arrangement and the object to be investigated, which is inherently conducive to clinical applications.
Another example of an application includes imaging the therapeutic effect of drugs, radiation or chemotherapy by similarly administering absorbing particles into the body and monitoring or targeting their relative update over time.
In other embodiments, the same detection may be achieved by a portable device, or an endoscopic device inserted into a body cavity, or by an invasive procedure operably inserted into tissue via a device.
It is appreciated that certain features of the invention, which are, for clarity, described in the context of separate embodiments, may also be provided in combination in a single embodiment. Conversely, various features of the invention which are, for brevity, described in the context of a single embodiment, may also be provided separately or in any suitable subcombination. While the invention has been described in conjunction with specific embodiments thereof, it is evident that many alternatives, modifications and variations will be apparent to those skilled in the art. Accordingly, it is intended to embrace all such alternatives, modifications and variations that fall within the spirit and broad scope of the appended claims.
All publications, patents and patent applications mentioned in this specification are herein incorporated in their entirety by reference into the specification, to the same extent as if each individual publication, patent or patent application was specifically and individually indicated to be incorporated herein by reference. In addition, citation or identification of any reference in this application shall not be construed as an admission that such reference is available as prior art to the present invention.
Claims (22)
1. A method of multi-spectral photoacoustic tomography (MSOT) imaging of a target tissue including a target tissue biomarker, comprising the steps of:
-illuminating the target tissue with an illumination device emitting at least one pulsed illumination pattern at several illumination wavelengths;
-detecting a pressure signal from the target tissue biomarker with a detector device, wherein the pressure signal is generated in the target tissue in response to the illumination; and
-reconstructing a quantitative tomographic image of the distribution of the target tissue biomarkers in the target tissue, wherein:
a photon propagation model that depends on the illumination light flux in the target tissue and on the illumination wavelength;
at least one spectral processing scheme; and
providing an inversion scheme of the tomographic image,
the pressure signal is analyzed.
2. The imaging method as claimed in claim 1,
-the illumination pattern comprises different wavelength ranges over at least two spectra in a time-shared manner.
3. Imaging method according to one of the preceding claims, wherein the photon propagation model is calculated using at least one of the following:
-a solution of a photon transport equation adapted to the geometry of the illumination of the target tissue;
-an empirical model of photon transport in the target tissue;
-incorporating a model of the incident photon distribution and/or the illumination pattern; and/or
-the detected pressure signals and/or photoacoustic images generated at any reconstruction stage.
4. The imaging method according to one of the preceding claims,
-the inversion scheme combining the photon propagation model and acoustic propagation model in a tomographic reconstruction to produce the quantitative tomographic image.
5. The imaging method according to one of the preceding claims,
-the inversion scheme combining the photon propagation model and/or the acoustic propagation model in an iterative manner.
6. The imaging method of one of the preceding claims, wherein the spectral processing scheme comprises at least one of:
-integrating the spectral processing scheme in the inversion scheme;
-a processing step of the acquired data; and
-a processing step of the reconstructed data.
7. Imaging method according to one of the preceding claims, wherein one or more of the following is performed:
-integrating the illumination means and the detector means into a common measurement head unit, and the illuminating and detecting steps comprise positioning the measurement head unit in contact with a target tissue component or a matching fluid;
-arranging the illumination means in the target tissue and the detector means in contact with an external surface of the target tissue or matching fluid;
-arranging the detector means in the target tissue and the illumination means outside or in contact with an outer surface of the target tissue;
-arranging the illumination means and the detector means in close proximity to or in contact with an outer surface of the target tissue; or
The detection means measures the photo-acoustically induced pressure signal in a non-contact manner by light detection, such as surface motion.
8. The imaging method according to one of the preceding claims,
-arranging the illumination means and the acoustic detector means inside a blood vessel using an intravascular catheter; or
-the measuring head unit of the illumination and detector device is a hand-held device.
9. The imaging method of one of the preceding claims, wherein:
-the target tissue comprises a light absorption indicator targeting the biomarker.
10. The imaging method of claim 9, wherein the light absorption indicator comprises at least one of:
-fluorescent or chromophoric molecules;
-a fluorescent protein, wherein the fluorescent protein is,
-particles comprising a noble metal;
-superparamagnetic particles;
-carbon particles; and
-an activatable substrate.
11. The imaging method of claim 9 or 10, wherein:
-the light absorption indicator has a steep change in its absorption spectrum.
12. The imaging method of claim 11, wherein:
-said illumination wavelengths comprise at least two wavelengths differentially absorbed by said target biomarker.
13. The imaging method of one of the preceding claims, wherein the target tissue biomarkers target at least one of:
-a cancer disease;
-cardiovascular diseases, including in particular atherosclerotic plaques;
-inflammatory diseases;
-an aspect of the disease for diagnostic purposes;
-one aspect of a disease state; and
an aspect of the treatment of diseases.
14. The imaging method as claimed in one of the preceding claims, wherein the target tissue comprises at least one of:
-tissue of a small animal;
-mesoscopic sized tissue, i.e. tissue ranging from sub-millimeter to centimetre;
-tissue of at least one human organ.
15. An imaging apparatus adapted for multi-spectral photo-acoustic tomography (MSOT) imaging of a target tissue including a target tissue biomarker, the imaging apparatus comprising:
-an illumination device adapted to illuminate the target tissue with at least one pulsed illumination pattern at a number of illumination wavelengths absorbed by the target tissue biomarker;
-a detector arrangement adapted to detect a pressure signal generated from the target tissue biomarker in the target tissue as a response to the illumination; and
-a reconstruction device adapted for reconstructing a quantitative tomographic image of the distribution of the target tissue biomarker in the target tissue, wherein the reconstruction device comprises:
a processor adapted to calculate a photon propagation model from the light pattern illuminating the target tissue and from the illumination wavelength,
a processor adapted to implement a spectral processing scheme, and
a processor adapted to implement an inversion scheme providing the tomographic image.
16. The imaging apparatus of claim 15, wherein:
-integrating the illumination means and the detector means in a common measurement head unit.
17. The imaging device of claim 16, wherein the measurement head unit comprises an array of illumination elements and sensor elements.
18. The imaging apparatus of claim 17, wherein the array comprises at least one of:
-a linear arrangement of the illumination elements and the sensor elements; and
-a matrix-shaped arrangement of alternating illumination elements and sensor elements.
19. The imaging apparatus of one of claims 15 to 18, wherein:
-the illumination device is adapted to illuminate the target tissue along at least two different directions of spread projection.
20. The imaging device of one of claims 15 to 19, wherein the illumination device and the acoustic detector device are configured for at least one of:
-being arranged in a blood vessel, in particular the illumination device comprising an optical fiber or an optical waveguide; and
-for providing contact with an outer surface of the target tissue.
21. The imaging apparatus of one of claims 15 to 20, wherein:
-including at least one of the illumination means and the detector means in an endoscopic, laparoscopic or interstitial device.
22. The imaging apparatus of one of claims 15 to 21, wherein the reconstruction apparatus is adapted to apply inversion methods and spectral processing in order to construct an image of a blood vessel, in particular a coronary or carotid artery, wherein the image represents a spatial distribution of the biomarkers in the target tissue.
Applications Claiming Priority (1)
| Application Number | Priority Date | Filing Date | Title |
|---|---|---|---|
| PCT/EP2008/006142 WO2010009747A1 (en) | 2008-07-25 | 2008-07-25 | Quantitative multi-spectral opto-acoustic tomography (msot) of tissue biomarkers |
Publications (2)
| Publication Number | Publication Date |
|---|---|
| CN102137618A true CN102137618A (en) | 2011-07-27 |
| CN102137618B CN102137618B (en) | 2015-06-17 |
Family
ID=40568503
Family Applications (1)
| Application Number | Title | Priority Date | Filing Date |
|---|---|---|---|
| CN200880130942.4A Active CN102137618B (en) | 2008-07-25 | 2008-07-25 | Quantitative multi-spectral opto-acoustic tomography (MSOT) of tissue biomarkers |
Country Status (6)
| Country | Link |
|---|---|
| US (1) | US9572497B2 (en) |
| EP (1) | EP2344019B1 (en) |
| JP (1) | JP5749164B2 (en) |
| CN (1) | CN102137618B (en) |
| CA (1) | CA2731409C (en) |
| WO (1) | WO2010009747A1 (en) |
Cited By (33)
| Publication number | Priority date | Publication date | Assignee | Title |
|---|---|---|---|---|
| CN103476327A (en) * | 2011-02-10 | 2013-12-25 | 佳能株式会社 | Acoustic wave acquisition apparatus |
| CN104023620A (en) * | 2011-12-26 | 2014-09-03 | 佳能株式会社 | Subject information accumulating apparatus |
| CN104220007A (en) * | 2012-04-10 | 2014-12-17 | 株式会社国际电气通信基础技术研究所 | Object observation device, object observation method, and recording medium |
| CN104334088A (en) * | 2012-05-03 | 2015-02-04 | 三星电子株式会社 | Laser-induced ultrasonic wave apparatus and method |
| CN105011909A (en) * | 2011-04-12 | 2015-11-04 | 佳能株式会社 | Object information acquiring apparatus and object information acquiring method |
| CN107645938A (en) * | 2015-03-06 | 2018-01-30 | 英国质谱公司 | The open type MALDI-MS measure of imaging guiding |
| CN108107013A (en) * | 2016-11-25 | 2018-06-01 | 三星电子株式会社 | A compact spectrometer system for non-invasive measurements of biological tissue samples |
| CN108375547A (en) * | 2018-01-12 | 2018-08-07 | 华南师范大学 | Multispectral optoacoustic and optical coherence tomography bimodal imaging device and method |
| CN109063541A (en) * | 2017-06-08 | 2018-12-21 | 墨奇公司 | System and method for fingerprint recognition |
| CN109716104A (en) * | 2016-07-25 | 2019-05-03 | 光声技术股份有限公司 | The instrument of the orthogonal fluorescence optoacoustic volume projection of total registration for obtaining tissue and its method used |
| CN111587365A (en) * | 2018-01-11 | 2020-08-25 | 澳大利亚眼科研究中心有限公司 | Methods and systems for quantifying tissue biomarkers |
| US10777397B2 (en) | 2015-03-06 | 2020-09-15 | Micromass Uk Limited | Inlet instrumentation for ion analyser coupled to rapid evaporative ionisation mass spectrometry (“REIMS”) device |
| US10777398B2 (en) | 2015-03-06 | 2020-09-15 | Micromass Uk Limited | Spectrometric analysis |
| CN112200883A (en) * | 2020-11-03 | 2021-01-08 | 华北电力大学(保定) | A quantitative intravascular optical coherence tomography method and system |
| CN112272540A (en) * | 2018-04-04 | 2021-01-26 | 托莫维实验室有限公司 | Quantitative imaging system and use thereof |
| US10916415B2 (en) | 2015-03-06 | 2021-02-09 | Micromass Uk Limited | Liquid trap or separator for electrosurgical applications |
| US11031223B2 (en) | 2015-09-29 | 2021-06-08 | Micromass Uk Limited | Capacitively coupled REIMS technique and optically transparent counter electrode |
| US11031222B2 (en) | 2015-03-06 | 2021-06-08 | Micromass Uk Limited | Chemically guided ambient ionisation mass spectrometry |
| US11037774B2 (en) | 2015-03-06 | 2021-06-15 | Micromass Uk Limited | Physically guided rapid evaporative ionisation mass spectrometry (“REIMS”) |
| US11139156B2 (en) | 2015-03-06 | 2021-10-05 | Micromass Uk Limited | In vivo endoscopic tissue identification tool |
| US11239066B2 (en) | 2015-03-06 | 2022-02-01 | Micromass Uk Limited | Cell population analysis |
| CN114027802A (en) * | 2022-01-10 | 2022-02-11 | 杭州纬壹医疗科技有限公司 | Diffusion optical tomography system |
| US11264223B2 (en) | 2015-03-06 | 2022-03-01 | Micromass Uk Limited | Rapid evaporative ionisation mass spectrometry (“REIMS”) and desorption electrospray ionisation mass spectrometry (“DESI-MS”) analysis of swabs and biopsy samples |
| US11270876B2 (en) | 2015-03-06 | 2022-03-08 | Micromass Uk Limited | Ionisation of gaseous samples |
| US11282688B2 (en) | 2015-03-06 | 2022-03-22 | Micromass Uk Limited | Spectrometric analysis of microbes |
| US11289320B2 (en) | 2015-03-06 | 2022-03-29 | Micromass Uk Limited | Tissue analysis by mass spectrometry or ion mobility spectrometry |
| US11342170B2 (en) | 2015-03-06 | 2022-05-24 | Micromass Uk Limited | Collision surface for improved ionisation |
| US11367605B2 (en) | 2015-03-06 | 2022-06-21 | Micromass Uk Limited | Ambient ionization mass spectrometry imaging platform for direct mapping from bulk tissue |
| US11454611B2 (en) | 2016-04-14 | 2022-09-27 | Micromass Uk Limited | Spectrometric analysis of plants |
| CN115128010A (en) * | 2022-07-21 | 2022-09-30 | 清华大学 | Method and device for determining material component proportion |
| CN115479927A (en) * | 2022-08-24 | 2022-12-16 | 中国科学院宁波材料技术与工程研究所 | A fluorescent color calibration card for endoscope and its preparation method and application |
| CN115607108A (en) * | 2022-09-30 | 2023-01-17 | 西北大学 | A Multi-target Reconstruction Method Based on Blind Source Separation of Surface Measurement Signals |
| CN115917369A (en) * | 2020-04-23 | 2023-04-04 | 加利福尼亚大学董事会 | Ultrafast Light Field Tomography |
Families Citing this family (71)
| Publication number | Priority date | Publication date | Assignee | Title |
|---|---|---|---|---|
| US7520860B2 (en) | 2005-04-13 | 2009-04-21 | Marie G. Johnson | Detection of coronary artery disease using an electronic stethoscope |
| CA2731409C (en) | 2008-07-25 | 2016-01-05 | Daniel Razansky | Quantitative multi-spectral opto-acoustic tomography (msot) of tissue biomarkers |
| EP2527815B1 (en) | 2008-07-25 | 2014-05-14 | Helmholtz Zentrum München Deutsches Forschungszentrum für Gesundheit und Umwelt (GmbH) | Thermoacoustic imaging with quantitative extraction of an absorption image |
| US20110306865A1 (en) * | 2008-09-10 | 2011-12-15 | Endra, Inc. | photoacoustic imaging device |
| US9271654B2 (en) | 2009-06-29 | 2016-03-01 | Helmholtz Zentrum Munchen Deutsches Forschungszentrum Fur Gesundheit Und Umwelt (Gmbh) | Thermoacoustic imaging with quantitative extraction of absorption map |
| JP5808741B2 (en) * | 2009-07-27 | 2015-11-10 | ヘルムホルツ・ツェントルム・ミュンヒェン・ドイチェス・フォルシュンクスツェントルム・フューア・ゲズントハイト・ウント・ウムベルト(ゲーエムベーハー)Helmholtz Zentrum MuenchenDeutsches Forschungszentrum fuer Gesundheit und Umwelt (GmbH) | Imaging apparatus and method for photoacoustic imaging of small animals |
| EP2359745A1 (en) | 2010-02-12 | 2011-08-24 | Helmholtz Zentrum München Deutsches Forschungszentrum für Gesundheit und Umwelt (GmbH) | Method and device for multi-spectral photonic imaging |
| JP5693043B2 (en) * | 2010-04-28 | 2015-04-01 | キヤノン株式会社 | Subject information acquisition apparatus and subject information acquisition method |
| WO2011137247A2 (en) * | 2010-04-30 | 2011-11-03 | The Trustees Of Columbia University In The City Of New York | System, method and computer-accessible medium for performing attenuation-corrected multispectral luminescence tomography of cerenkov and bioluminescent light sources |
| JP6116477B2 (en) * | 2010-05-28 | 2017-04-19 | ザ ジェネラル ホスピタル コーポレイション | Device for analyzing information on cardiovascular disease and cardiac function |
| JP5627360B2 (en) * | 2010-09-14 | 2014-11-19 | キヤノン株式会社 | Photoacoustic imaging apparatus and control method thereof |
| US20130109950A1 (en) * | 2011-11-02 | 2013-05-02 | Seno Medical Instruments, Inc. | Handheld optoacoustic probe |
| US9289191B2 (en) | 2011-10-12 | 2016-03-22 | Seno Medical Instruments, Inc. | System and method for acquiring optoacoustic data and producing parametric maps thereof |
| US8686335B2 (en) | 2011-12-31 | 2014-04-01 | Seno Medical Instruments, Inc. | System and method for adjusting the light output of an optoacoustic imaging system |
| JP5875242B2 (en) * | 2010-10-05 | 2016-03-02 | キヤノン株式会社 | Contrast agent for photoacoustic imaging and photoacoustic imaging method using the same |
| CN102175617A (en) * | 2011-01-28 | 2011-09-07 | 华南理工大学 | Optical fiber coupling photoaccoustic detection probe with controllable light intensity |
| JP2016209725A (en) * | 2011-05-12 | 2016-12-15 | キヤノン株式会社 | Subject information acquisition apparatus and subject information acquisition method |
| JP5743957B2 (en) * | 2011-06-07 | 2015-07-01 | 富士フイルム株式会社 | Photoacoustic image generation apparatus and method |
| MX2014005408A (en) * | 2011-11-02 | 2015-02-12 | Seno Medical Instr Inc | Dual modality imaging system for coregistered functional and anatomical mapping. |
| US20130116538A1 (en) | 2011-11-02 | 2013-05-09 | Seno Medical Instruments, Inc. | Optoacoustic imaging systems and methods with enhanced safety |
| US9730587B2 (en) | 2011-11-02 | 2017-08-15 | Seno Medical Instruments, Inc. | Diagnostic simulator |
| US20140005544A1 (en) | 2011-11-02 | 2014-01-02 | Seno Medical Instruments, Inc. | System and method for providing selective channel sensitivity in an optoacoustic imaging system |
| US10433732B2 (en) | 2011-11-02 | 2019-10-08 | Seno Medical Instruments, Inc. | Optoacoustic imaging system having handheld probe utilizing optically reflective material |
| US9733119B2 (en) | 2011-11-02 | 2017-08-15 | Seno Medical Instruments, Inc. | Optoacoustic component utilization tracking |
| US9814394B2 (en) | 2011-11-02 | 2017-11-14 | Seno Medical Instruments, Inc. | Noise suppression in an optoacoustic system |
| US20130338475A1 (en) | 2012-06-13 | 2013-12-19 | Seno Medical Instruments, Inc. | Optoacoustic imaging system with fiber optic cable |
| US9445786B2 (en) | 2011-11-02 | 2016-09-20 | Seno Medical Instruments, Inc. | Interframe energy normalization in an optoacoustic imaging system |
| US11191435B2 (en) | 2013-01-22 | 2021-12-07 | Seno Medical Instruments, Inc. | Probe with optoacoustic isolator |
| US20130289381A1 (en) | 2011-11-02 | 2013-10-31 | Seno Medical Instruments, Inc. | Dual modality imaging system for coregistered functional and anatomical mapping |
| US9743839B2 (en) | 2011-11-02 | 2017-08-29 | Seno Medical Instruments, Inc. | Playback mode in an optoacoustic imaging system |
| US11287309B2 (en) | 2011-11-02 | 2022-03-29 | Seno Medical Instruments, Inc. | Optoacoustic component utilization tracking |
| TWI435712B (en) * | 2011-12-14 | 2014-05-01 | Univ Nat Chiao Tung | A diffusion optical tomography device and a diffusion optical tomography method |
| WO2013134772A2 (en) | 2012-03-09 | 2013-09-12 | Seno Medical Instruments, Inc. | Statistical mapping in an optoacoustic imaging system |
| WO2013167147A1 (en) | 2012-05-07 | 2013-11-14 | Helmholtz Zentrum München Deutsches Forschungszentrum Für Gesundheit Und Umwelt (Gmbh) | Apparatus and method for frequency-domain thermo-acoustic tomographic imaging |
| EP2742854B1 (en) | 2012-12-11 | 2021-03-10 | iThera Medical GmbH | Handheld device and method for tomographic optoacoustic imaging of an object |
| EP2754388B1 (en) | 2013-01-15 | 2020-09-09 | Helmholtz Zentrum München Deutsches Forschungszentrum für Gesundheit und Umwelt GmbH | System and method for quality-enhanced high-rate optoacoustic imaging of an object |
| BR112015021807A2 (en) | 2013-03-15 | 2017-07-18 | Seno Medical Instr Inc | support system and method for diagnostic vector classification |
| JP2015000288A (en) * | 2013-06-18 | 2015-01-05 | キヤノン株式会社 | Subject information acquisition apparatus and control method thereof, and acoustic signal acquisition apparatus and control method thereof |
| JP2015029550A (en) * | 2013-07-31 | 2015-02-16 | 船井電機株式会社 | Photoacoustic imaging apparatus |
| CN103393408B (en) * | 2013-08-20 | 2015-12-02 | 中国科学院自动化研究所 | A kind of optoacoustic and fluorescent circulation mutual promotion formation method |
| US9953417B2 (en) | 2013-10-04 | 2018-04-24 | The University Of Manchester | Biomarker method |
| US9519823B2 (en) * | 2013-10-04 | 2016-12-13 | The University Of Manchester | Biomarker method |
| US10309936B2 (en) | 2013-10-11 | 2019-06-04 | Seno Medical Instruments, Inc. | Systems and methods for component separation in medical imaging |
| JP2015092914A (en) * | 2013-11-08 | 2015-05-18 | キヤノン株式会社 | Subject information acquiring apparatus and acoustic wave receiving apparatus |
| SG10201804772UA (en) | 2013-12-06 | 2018-07-30 | Agency Science Tech & Res | Method of imaging living tissue |
| US9670522B2 (en) * | 2014-01-08 | 2017-06-06 | University Of South Carolina | Quantitative acoustic contrast tomography for studying fungal growth and toxicity |
| EP3110319A1 (en) | 2014-02-27 | 2017-01-04 | Seno Medical Instruments, Inc. | Probe adapted to control blood flow through vessels during imaging and method of use of same |
| US9959477B2 (en) | 2014-03-03 | 2018-05-01 | The Board Of Trustees Of The Leland Stanford Junior University | Mapping of blood vessels for biometric authentication |
| EP3143391B1 (en) * | 2014-05-14 | 2020-07-08 | Canon Kabushiki Kaisha | Photoacoustic apparatus |
| JP6587410B2 (en) * | 2014-05-19 | 2019-10-09 | キヤノン株式会社 | Subject information acquisition apparatus and signal processing method |
| US9092691B1 (en) * | 2014-07-18 | 2015-07-28 | Median Technologies | System for computing quantitative biomarkers of texture features in tomographic images |
| JP6152079B2 (en) * | 2014-08-29 | 2017-06-21 | プレキシオン株式会社 | Probe for photoacoustic imaging device |
| JP6621819B2 (en) | 2014-10-30 | 2019-12-18 | セノ メディカル インストルメンツ,インク. | Photoacoustic imaging system with detection of relative orientation of light source and acoustic receiver using acoustic waves |
| EP3056137B1 (en) * | 2015-02-13 | 2017-11-01 | Helmholtz Zentrum München Deutsches Forschungszentrum für Gesundheit und Umwelt GmbH | Device and method for multispectral optoacoustic imaging |
| JP6404451B2 (en) | 2015-03-13 | 2018-10-10 | 富士フイルム株式会社 | Photoacoustic measuring device and probe |
| JP2017012485A (en) * | 2015-07-01 | 2017-01-19 | キヤノン株式会社 | Biomarker and subject information acquisition apparatus |
| WO2017014167A1 (en) * | 2015-07-21 | 2017-01-26 | Canon Kabushiki Kaisha | Object information acquiring apparatus and object information acquiring method |
| JP6824636B2 (en) * | 2015-07-21 | 2021-02-03 | キヤノン株式会社 | Subject information acquisition device and subject information acquisition method |
| JP2017055838A (en) * | 2015-09-14 | 2017-03-23 | プレキシオン株式会社 | Photoacoustic imaging device |
| US20200297313A1 (en) * | 2016-03-30 | 2020-09-24 | Koninklijke Philips N.V. | Tissue and vascular pathway mapping utilizing photoacoustic and ultrasound techniques |
| WO2017205626A1 (en) * | 2016-05-27 | 2017-11-30 | The Regents Of The University Of Michigan | Photoacoustics imaging system |
| US9976997B2 (en) * | 2016-10-17 | 2018-05-22 | Shimadzu Corporation | Data processing device for quantitation |
| EP3375353A1 (en) | 2017-03-16 | 2018-09-19 | Universität Zürich | Photoacoustic imaging of inflamed tissue |
| US11666225B2 (en) | 2018-01-25 | 2023-06-06 | Muhannad N. Fadhel | Method and system for fluence matching in photoacoustic imaging |
| WO2020041685A1 (en) * | 2018-08-24 | 2020-02-27 | Paul Reed Smith | System and method for measuring vibrational spectra in living cells and tissue over time |
| EP3932295A1 (en) * | 2020-06-30 | 2022-01-05 | Universität Zürich | Optoacoustic tomography method of a living organism, 2d- or 3d opotacoustic images, 2d- or 3d blood flow and light fluence images and a photoabsorbing agent for the use in an optoacoustic method |
| CA3192117A1 (en) * | 2020-09-14 | 2022-03-17 | Thomas E. Milner | Systems and methods for ultrasound and photoacoustic guidance of coronary procedures |
| CN115137358B (en) * | 2021-03-29 | 2024-05-14 | 上海近观科技有限责任公司 | Subcutaneous noninvasive detection device, signal collection system and method |
| CN116269203A (en) * | 2021-12-09 | 2023-06-23 | 深圳迈瑞生物医疗电子股份有限公司 | Laser energy correction method and prompting method in photoacoustic imaging system, photoacoustic imaging system |
| CN117017280B (en) * | 2023-07-24 | 2024-03-19 | 西南交通大学 | Wearable flexible near-infrared photoacoustic/ultrasonic dual-mode imaging system and method |
| CN121213550A (en) * | 2025-11-26 | 2025-12-26 | 上海太易检测技术股份有限公司 | Walnut sorting method, apparatus and medium based on dual narrowband infrared images |
Citations (3)
| Publication number | Priority date | Publication date | Assignee | Title |
|---|---|---|---|---|
| WO2004068405A2 (en) * | 2003-01-25 | 2004-08-12 | Oraevsky Alexander A | High contrast optoacoustical imaging using nanoparticles |
| CN1650794A (en) * | 2004-02-06 | 2005-08-10 | 株式会社东芝 | Non-invasive subject information imaging method and apparatus |
| WO2006061829A1 (en) * | 2004-12-06 | 2006-06-15 | Glucon Inc. | Photoacoustic intravascular probe |
Family Cites Families (121)
| Publication number | Priority date | Publication date | Assignee | Title |
|---|---|---|---|---|
| US4255971A (en) | 1978-11-01 | 1981-03-17 | Allan Rosencwaig | Thermoacoustic microscopy |
| CH643397A5 (en) | 1979-09-20 | 1984-05-30 | Ibm | GRID TUNNEL MICROSCOPE. |
| US4385634A (en) | 1981-04-24 | 1983-05-31 | University Of Arizona Foundation | Radiation-induced thermoacoustic imaging |
| DE3374522D1 (en) | 1982-10-26 | 1987-12-23 | University Of Aberdeen | |
| FR2550678B1 (en) | 1983-08-11 | 1989-02-17 | Cit Alcatel | DIGITAL SATELLITE CENTER FOR CONNECTING SUBSCRIBERS |
| US4770183A (en) | 1986-07-03 | 1988-09-13 | Advanced Magnetics Incorporated | Biologically degradable superparamagnetic particles for use as nuclear magnetic resonance imaging agents |
| DE3826709C2 (en) | 1987-08-05 | 1994-12-22 | Toshiba Kawasaki Kk | Ultrasound therapy device |
| EP0459392B1 (en) | 1990-05-30 | 1999-08-18 | Hitachi, Ltd. | Method and apparatus for processing a minute portion of a specimen |
| US6263221B1 (en) | 1991-01-24 | 2001-07-17 | Non-Invasive Technology | Quantitative analyses of biological tissue using phase modulation spectroscopy |
| US5411730A (en) | 1993-07-20 | 1995-05-02 | Research Corporation Technologies, Inc. | Magnetic microparticles |
| US5840023A (en) * | 1996-01-31 | 1998-11-24 | Oraevsky; Alexander A. | Optoacoustic imaging for medical diagnosis |
| JPH09219563A (en) * | 1996-02-09 | 1997-08-19 | Hitachi Ltd | Semiconductor optical device and application system using the same |
| US6173604B1 (en) | 1996-09-20 | 2001-01-16 | The Regents Of The University Of California | Scanning evanescent electro-magnetic microscope |
| US5713356A (en) | 1996-10-04 | 1998-02-03 | Optosonics, Inc. | Photoacoustic breast scanner |
| EP1011446A1 (en) | 1997-02-28 | 2000-06-28 | Electro-Optical Sciences, Inc. | Systems and methods for the multispectral imaging and characterization of skin tissue |
| WO1998051993A1 (en) * | 1997-05-16 | 1998-11-19 | Olympus Optical Co., Ltd. | Height-measuring device |
| GB9712524D0 (en) | 1997-06-16 | 1997-08-20 | Nycomed Imaging As | Method |
| US5928151A (en) | 1997-08-22 | 1999-07-27 | Acuson Corporation | Ultrasonic system and method for harmonic imaging in three dimensions |
| US6477398B1 (en) | 1997-11-13 | 2002-11-05 | Randell L. Mills | Resonant magnetic susceptibility imaging (ReMSI) |
| US6070093A (en) * | 1997-12-02 | 2000-05-30 | Abbott Laboratories | Multiplex sensor and method of use |
| US6526298B1 (en) * | 1998-05-18 | 2003-02-25 | Abbott Laboratories | Method for the non-invasive determination of analytes in a selected volume of tissue |
| US6662030B2 (en) * | 1998-05-18 | 2003-12-09 | Abbott Laboratories | Non-invasive sensor having controllable temperature feature |
| US6216025B1 (en) | 1999-02-02 | 2001-04-10 | Optosonics, Inc. | Thermoacoustic computed tomography scanner |
| US6760609B2 (en) | 1999-07-14 | 2004-07-06 | Providence Health System - Oregon | Adaptive calibration pulsed oximetry method and device |
| EP1203257B1 (en) | 1999-08-02 | 2004-12-15 | Zetetic Institute | Scanning interferometric near-field confocal microscopy |
| US6567688B1 (en) | 1999-08-19 | 2003-05-20 | The Texas A&M University System | Methods and apparatus for scanning electromagnetically-induced thermoacoustic tomography |
| US6424410B1 (en) * | 1999-08-27 | 2002-07-23 | Maui Innovative Peripherals, Inc. | 3D navigation system using complementary head-mounted and stationary infrared beam detection units |
| US6834063B2 (en) | 2000-01-06 | 2004-12-21 | Raytheon Company | Efficient angle tunable output from a monolithic serial KTA optical parametric oscillator |
| US20020163735A1 (en) | 2000-01-11 | 2002-11-07 | Gunther Detlef | Radially homogeneous high energy density UV sample ablating laser radiation in "pure" solid to gas sample preparation , for analysis by ICP-MS and ICP-OES |
| US6180087B1 (en) | 2000-01-18 | 2001-01-30 | Mallinckrodt Inc. | Tunable indocyanine dyes for biomedical applications |
| US6751490B2 (en) * | 2000-03-01 | 2004-06-15 | The Board Of Regents Of The University Of Texas System | Continuous optoacoustic monitoring of hemoglobin concentration and hematocrit |
| US6847168B1 (en) | 2000-08-01 | 2005-01-25 | Calabazas Creek Research, Inc. | Electron gun for a multiple beam klystron using magnetic focusing with a magnetic field corrector |
| US6754519B1 (en) | 2000-11-24 | 2004-06-22 | Elgems Ltd. | Multimodality imaging system |
| US6615063B1 (en) | 2000-11-27 | 2003-09-02 | The General Hospital Corporation | Fluorescence-mediated molecular tomography |
| US20020073717A1 (en) | 2000-12-19 | 2002-06-20 | Dean David E. | MR scanner including liquid cooled RF coil and method |
| US7498564B2 (en) | 2001-02-06 | 2009-03-03 | University Of Bristol Of Senate House | Resonant scanning near-field optical microscope |
| DE10113661A1 (en) | 2001-03-21 | 2002-09-26 | Philips Corp Intellectual Pty | Catheter for magnetic resonance imaging has an excitation transmitter at its distal end which excites vibration within the area surrounding it that is readily imaged by the MR imaging device |
| US6498492B1 (en) | 2001-03-23 | 2002-12-24 | Rosemount Analytical Inc. | Process of measuring conductivity using a pH analyzer |
| US6574490B2 (en) * | 2001-04-11 | 2003-06-03 | Rio Grande Medical Technologies, Inc. | System for non-invasive measurement of glucose in humans |
| US6490470B1 (en) | 2001-06-19 | 2002-12-03 | Optosonics, Inc. | Thermoacoustic tissue scanner |
| GB0126804D0 (en) | 2001-11-07 | 2002-01-02 | Univ London | Flow velocity measurement |
| US6700459B2 (en) | 2002-05-29 | 2004-03-02 | Superconductor Technologies, Inc. | Dual-mode bandpass filter with direct capacitive couplings and far-field suppression structures |
| EP1514093B1 (en) | 2002-06-04 | 2021-04-28 | Visen Medical, Inc. | Imaging volumes with arbitrary geometries in non-contact tomography |
| US7005653B1 (en) | 2002-06-18 | 2006-02-28 | Nanopoint, Inc. | Near-field intra-cellular apertureless tomographic imaging |
| US20040059265A1 (en) * | 2002-09-12 | 2004-03-25 | The Regents Of The University Of California | Dynamic acoustic focusing utilizing time reversal |
| US7774042B2 (en) | 2002-09-26 | 2010-08-10 | Senco Brands, Inc. | Tissue scanner |
| US7245789B2 (en) | 2002-10-07 | 2007-07-17 | Vascular Imaging Corporation | Systems and methods for minimally-invasive optical-acoustic imaging |
| WO2004062491A1 (en) | 2003-01-13 | 2004-07-29 | Glucon Inc. | Photoacoustic assay method and apparatus |
| WO2004072906A1 (en) | 2003-02-05 | 2004-08-26 | The General Hospital Corporation | Method and system for free space optical tomography of diffuse media |
| US7551957B2 (en) | 2003-03-06 | 2009-06-23 | Bioelectronics Corp. | Electromagnetic therapy device and methods |
| US7720525B2 (en) * | 2003-03-12 | 2010-05-18 | New Art Advanced Research Technologies Inc. | Method and apparatus for combining continuous wave and time domain optical imaging |
| IES20030396A2 (en) | 2003-05-23 | 2004-11-17 | Univ Dublin City | A method and apparatus for analysis of semiconductor materials using photoacoustic spectroscopy techniques |
| JP2004351023A (en) | 2003-05-30 | 2004-12-16 | Olympus Corp | Photoacoustic probe |
| US7725151B2 (en) | 2003-06-02 | 2010-05-25 | Van Der Weide Daniel Warren | Apparatus and method for near-field imaging of tissue |
| US7298869B1 (en) | 2003-07-21 | 2007-11-20 | Abernathy Donald A | Multispectral data acquisition system and method |
| IL164030A0 (en) | 2003-09-12 | 2005-12-18 | Revital Pery Shechter | Photoacoustic analyzer of a region of interest in a human body |
| US20050107694A1 (en) * | 2003-11-17 | 2005-05-19 | Jansen Floribertus H. | Method and system for ultrasonic tagging of fluorescence |
| US20050154308A1 (en) | 2003-12-30 | 2005-07-14 | Liposonix, Inc. | Disposable transducer seal |
| US7525661B2 (en) | 2004-02-17 | 2009-04-28 | Andreas Mandelis | Laser photo-thermo-acoustic (PTA) frequency swept heterodyned lock-in depth profilometry imaging system |
| WO2005089637A2 (en) | 2004-03-11 | 2005-09-29 | The General Hospital Corporation | Method and system for tomographic imaging using fluorescent proteins |
| EP1743576B1 (en) | 2004-05-06 | 2018-01-24 | Nippon Telegraph And Telephone Corporation | Component concentration measuring device and method of controlling component concentration measuring device |
| US7510555B2 (en) | 2004-05-07 | 2009-03-31 | Therm Med, Llc | Enhanced systems and methods for RF-induced hyperthermia |
| US7471975B2 (en) * | 2004-09-22 | 2008-12-30 | The Research Foundation Of State University Of New York | Optical tensor imaging |
| US20060084861A1 (en) | 2004-10-18 | 2006-04-20 | Topspin Medical (Isreal) Ltd. | Magnet and coil configurations for MRI probes |
| US20080312540A1 (en) * | 2004-12-08 | 2008-12-18 | Vasilis Ntziachristos | System and Method for Normalized Flourescence or Bioluminescence Imaging |
| IL166408A0 (en) | 2005-01-20 | 2006-01-15 | Ultraview Ltd | Combined 2d pulse-echo ultrasound and optoacousticsignal for glaucoma treatment |
| US20060184042A1 (en) | 2005-01-22 | 2006-08-17 | The Texas A&M University System | Method, system and apparatus for dark-field reflection-mode photoacoustic tomography |
| EP1883425A1 (en) | 2005-05-23 | 2008-02-06 | Universite De Geneve | Injectable superparamagnetic nanoparticles for treatment by hyperthermia and use for forming an hyperthermic implant |
| DE102005030151B3 (en) | 2005-06-28 | 2006-11-02 | Fraunhofer-Gesellschaft zur Förderung der angewandten Forschung e.V. | Photo-acoustic free-field detector for measuring air, gas and liquid flows has optical and acoustic mirrors arranged in position where local maximum sound pressure is present for generating acoustic energy based on output of acoustic sensor |
| US20070015992A1 (en) | 2005-06-30 | 2007-01-18 | General Electric Company | System and method for optoacoustic imaging |
| US7247842B1 (en) | 2005-07-12 | 2007-07-24 | California Institute Of Technology | Method and system for scanning apertureless fluorescence mircroscope |
| US8660631B2 (en) | 2005-09-08 | 2014-02-25 | Bruker Biospin Corporation | Torsional support apparatus and method for craniocaudal rotation of animals |
| US8041409B2 (en) | 2005-09-08 | 2011-10-18 | Carestream Health, Inc. | Method and apparatus for multi-modal imaging |
| WO2007058895A2 (en) | 2005-11-11 | 2007-05-24 | Visualsonics Inc. | Overlay image contrast enhancement |
| ATE500778T1 (en) | 2005-12-22 | 2011-03-15 | Visen Medical Inc | COMBINED X-RAY AND OPTICAL TOMOGRAPHY IMAGING SYSTEM |
| US20090054763A1 (en) | 2006-01-19 | 2009-02-26 | The Regents Of The University Of Michigan | System and method for spectroscopic photoacoustic tomography |
| US7740585B2 (en) * | 2006-01-20 | 2010-06-22 | Seno Medical Instruments, Inc. | Quantitative optoacoustic tomography with enhanced contrast |
| JP2007307007A (en) | 2006-05-17 | 2007-11-29 | Hamamatsu Kagaku Gijutsu Kenkyu Shinkokai | Catheter system using photoacoustic effect |
| WO2008018082A2 (en) | 2006-08-10 | 2008-02-14 | Technion - Research & Development Foundation Ltd | Plasmon resonance bolometer for radiation detection |
| US7741045B2 (en) | 2006-11-16 | 2010-06-22 | General Electric Company | Sequential analysis of biological samples |
| US20080123083A1 (en) | 2006-11-29 | 2008-05-29 | The Regents Of The University Of Michigan | System and Method for Photoacoustic Guided Diffuse Optical Imaging |
| US20080173093A1 (en) | 2007-01-18 | 2008-07-24 | The Regents Of The University Of Michigan | System and method for photoacoustic tomography of joints |
| WO2008101019A2 (en) | 2007-02-13 | 2008-08-21 | Board Of Regents, The University Of Texas System | Molecular specific photoacoustic imaging |
| WO2008103982A2 (en) * | 2007-02-23 | 2008-08-28 | The Regents Of The University Of Michigan | System and method for monitoring photodynamic therapy |
| US20080228073A1 (en) | 2007-03-12 | 2008-09-18 | Silverman Ronald H | System and method for optoacoustic imaging of peripheral tissues |
| WO2009009178A2 (en) | 2007-04-06 | 2009-01-15 | The General Hospital Corporation | Systems and methods for optical imaging using early arriving photons |
| US7894885B2 (en) | 2007-05-02 | 2011-02-22 | Biosense Webster, Inc. | Coherent signal rejection in ECG |
| US8251909B2 (en) | 2007-07-16 | 2012-08-28 | Arnold Stephen C | Acoustic imaging probe incorporating photoacoustic excitation |
| US20090058746A1 (en) | 2007-08-31 | 2009-03-05 | Harris Corporation | Evanescent wave-coupled frequency selective surface |
| US8492734B2 (en) | 2007-10-19 | 2013-07-23 | Visen Medical, Inc. | Imaging systems featuring waveguiding compensation |
| WO2010048258A1 (en) | 2008-10-23 | 2010-04-29 | Washington University In St. Louis | Reflection-mode photoacoustic tomography using a flexibly-supported cantilever beam |
| CA2708675C (en) | 2007-12-12 | 2016-07-19 | Jeffrey J. L. Carson | Three-dimensional photoacoustic imager and methods for calibrating an imager |
| US9332942B2 (en) | 2008-01-28 | 2016-05-10 | The General Hospital Corporation | Systems, processes and computer-accessible medium for providing hybrid flourescence and optical coherence tomography imaging |
| EP2110076A1 (en) | 2008-02-19 | 2009-10-21 | Helmholtz Zentrum München Deutsches Forschungszentrum für Gesundheit und Umwelt (GmbH) | Method and device for near-field dual-wave modality imaging |
| CA2731409C (en) | 2008-07-25 | 2016-01-05 | Daniel Razansky | Quantitative multi-spectral opto-acoustic tomography (msot) of tissue biomarkers |
| US20110306865A1 (en) | 2008-09-10 | 2011-12-15 | Endra, Inc. | photoacoustic imaging device |
| JP2010125260A (en) | 2008-12-01 | 2010-06-10 | Canon Inc | Biological testing apparatus |
| US20110282192A1 (en) | 2009-01-29 | 2011-11-17 | Noel Axelrod | Multimodal depth-resolving endoscope |
| US9271654B2 (en) | 2009-06-29 | 2016-03-01 | Helmholtz Zentrum Munchen Deutsches Forschungszentrum Fur Gesundheit Und Umwelt (Gmbh) | Thermoacoustic imaging with quantitative extraction of absorption map |
| JP5574674B2 (en) | 2009-11-12 | 2014-08-20 | キヤノン株式会社 | Acoustic wave measuring device |
| WO2011072198A2 (en) | 2009-12-10 | 2011-06-16 | The Board Of Regents Of The University Of Texas System | Optoacoustic / photoacoustic / acoustic imaging system using probe beam deflection |
| EP2332614A1 (en) | 2009-12-10 | 2011-06-15 | Theraclion SAS | Ultrasound treatment device |
| EP2359745A1 (en) | 2010-02-12 | 2011-08-24 | Helmholtz Zentrum München Deutsches Forschungszentrum für Gesundheit und Umwelt (GmbH) | Method and device for multi-spectral photonic imaging |
| JP5448918B2 (en) | 2010-02-24 | 2014-03-19 | キヤノン株式会社 | Biological information processing device |
| JP5479173B2 (en) | 2010-03-17 | 2014-04-23 | キヤノン株式会社 | Information processing apparatus and information processing method |
| CA2797784A1 (en) | 2010-04-30 | 2011-11-03 | Visualsonics Inc. | Photoacoustic transducer and imaging system |
| US8930145B2 (en) | 2010-07-28 | 2015-01-06 | Covidien Lp | Light focusing continuous wave photoacoustic spectroscopy and its applications to patient monitoring |
| EP2671057B1 (en) | 2011-02-04 | 2014-07-30 | Helmholtz Zentrum München Deutsches Forschungszentrum für Gesundheit und Umwelt (GmbH) | Ultrasound detector for optoacoustic or thermoacoustic imaging |
| JP5939786B2 (en) | 2011-02-10 | 2016-06-22 | キヤノン株式会社 | Acoustic wave acquisition device |
| JP5744557B2 (en) | 2011-02-10 | 2015-07-08 | キヤノン株式会社 | Acoustic wave acquisition device |
| JP5469113B2 (en) | 2011-02-24 | 2014-04-09 | 富士フイルム株式会社 | Probe unit for photoacoustic analysis and photoacoustic analyzer |
| JP5704998B2 (en) | 2011-04-06 | 2015-04-22 | キヤノン株式会社 | Photoacoustic apparatus and control method thereof |
| JP5762118B2 (en) | 2011-05-02 | 2015-08-12 | キヤノン株式会社 | Light irradiation apparatus, control method therefor, and object information acquisition apparatus |
| US9390522B2 (en) | 2011-11-18 | 2016-07-12 | Helmholtz Zentrum Muenchen Deutsches Forschungszentrum Fuer Gesundheit Und Umwelt (Gmbh) | System for creating a tomographic object image based on multiple imaging modalities |
| WO2013167147A1 (en) | 2012-05-07 | 2013-11-14 | Helmholtz Zentrum München Deutsches Forschungszentrum Für Gesundheit Und Umwelt (Gmbh) | Apparatus and method for frequency-domain thermo-acoustic tomographic imaging |
| JP5969701B2 (en) | 2012-06-11 | 2016-08-17 | ヘルムホルツ ツェントルム ミュンヘン ドイチェス フォルシュンクスツェントルム フュア ゲスントハイト ウント ウンベルト ゲゼルシャフト ミット ベシュレンクテル ハフツング | Imaging system and method for imaging an object |
| EP2695893A1 (en) | 2012-08-09 | 2014-02-12 | Helmholtz Zentrum München Deutsches Forschungszentrum für Gesundheit und Umwelt GmbH | Novel far red fluorescent protein |
| US10076248B2 (en) | 2012-10-22 | 2018-09-18 | The General Hospital Corporation | Hybrid catheter system |
| EP2742854B1 (en) | 2012-12-11 | 2021-03-10 | iThera Medical GmbH | Handheld device and method for tomographic optoacoustic imaging of an object |
| EP2742853B1 (en) | 2012-12-11 | 2022-03-23 | Helmholtz Zentrum München Deutsches Forschungszentrum für Gesundheit und Umwelt GmbH | Handheld device and method for volumetric real-time optoacoustic imaging of an object |
| EP2754388B1 (en) | 2013-01-15 | 2020-09-09 | Helmholtz Zentrum München Deutsches Forschungszentrum für Gesundheit und Umwelt GmbH | System and method for quality-enhanced high-rate optoacoustic imaging of an object |
-
2008
- 2008-07-25 CA CA2731409A patent/CA2731409C/en active Active
- 2008-07-25 EP EP08785095.4A patent/EP2344019B1/en active Active
- 2008-07-25 WO PCT/EP2008/006142 patent/WO2010009747A1/en not_active Ceased
- 2008-07-25 JP JP2011519044A patent/JP5749164B2/en active Active
- 2008-07-25 CN CN200880130942.4A patent/CN102137618B/en active Active
- 2008-07-25 US US13/055,552 patent/US9572497B2/en active Active
Patent Citations (3)
| Publication number | Priority date | Publication date | Assignee | Title |
|---|---|---|---|---|
| WO2004068405A2 (en) * | 2003-01-25 | 2004-08-12 | Oraevsky Alexander A | High contrast optoacoustical imaging using nanoparticles |
| CN1650794A (en) * | 2004-02-06 | 2005-08-10 | 株式会社东芝 | Non-invasive subject information imaging method and apparatus |
| WO2006061829A1 (en) * | 2004-12-06 | 2006-06-15 | Glucon Inc. | Photoacoustic intravascular probe |
Non-Patent Citations (1)
| Title |
|---|
| JAN LAUFER ET AL: "Quantitative spatially resolved measurement of tissue chromophore concentrations using photoacoustic spectroscopy: application to the measurement of blood oxygenation and haemoglobin concentration", 《PHYSICS IN MEDICINE AND BIOLOGY》 * |
Cited By (48)
| Publication number | Priority date | Publication date | Assignee | Title |
|---|---|---|---|---|
| CN103476327A (en) * | 2011-02-10 | 2013-12-25 | 佳能株式会社 | Acoustic wave acquisition apparatus |
| US9417179B2 (en) | 2011-02-10 | 2016-08-16 | Canon Kabushiki Kaisha | Acoustic wave acquisition apparatus |
| CN105011909A (en) * | 2011-04-12 | 2015-11-04 | 佳能株式会社 | Object information acquiring apparatus and object information acquiring method |
| US10638934B2 (en) | 2011-12-26 | 2020-05-05 | Canon Kabushiki Kaisha | Subject information accumulating apparatus |
| CN104023620A (en) * | 2011-12-26 | 2014-09-03 | 佳能株式会社 | Subject information accumulating apparatus |
| CN104220007B (en) * | 2012-04-10 | 2016-03-16 | 株式会社国际电气通信基础技术研究所 | Object observation device and object observation method |
| US9297752B2 (en) | 2012-04-10 | 2016-03-29 | Advanced Telecommunications Research Institute International | Object observing apparatus, object observing method, and storage medium |
| CN104220007A (en) * | 2012-04-10 | 2014-12-17 | 株式会社国际电气通信基础技术研究所 | Object observation device, object observation method, and recording medium |
| CN104334088B (en) * | 2012-05-03 | 2017-05-03 | 三星电子株式会社 | Laser-induced ultrasonic wave apparatus and method |
| CN104334088A (en) * | 2012-05-03 | 2015-02-04 | 三星电子株式会社 | Laser-induced ultrasonic wave apparatus and method |
| US10978284B2 (en) | 2015-03-06 | 2021-04-13 | Micromass Uk Limited | Imaging guided ambient ionisation mass spectrometry |
| US10916415B2 (en) | 2015-03-06 | 2021-02-09 | Micromass Uk Limited | Liquid trap or separator for electrosurgical applications |
| US11367605B2 (en) | 2015-03-06 | 2022-06-21 | Micromass Uk Limited | Ambient ionization mass spectrometry imaging platform for direct mapping from bulk tissue |
| US11270876B2 (en) | 2015-03-06 | 2022-03-08 | Micromass Uk Limited | Ionisation of gaseous samples |
| US11264223B2 (en) | 2015-03-06 | 2022-03-01 | Micromass Uk Limited | Rapid evaporative ionisation mass spectrometry (“REIMS”) and desorption electrospray ionisation mass spectrometry (“DESI-MS”) analysis of swabs and biopsy samples |
| US11239066B2 (en) | 2015-03-06 | 2022-02-01 | Micromass Uk Limited | Cell population analysis |
| US10777397B2 (en) | 2015-03-06 | 2020-09-15 | Micromass Uk Limited | Inlet instrumentation for ion analyser coupled to rapid evaporative ionisation mass spectrometry (“REIMS”) device |
| US10777398B2 (en) | 2015-03-06 | 2020-09-15 | Micromass Uk Limited | Spectrometric analysis |
| CN107645938B (en) * | 2015-03-06 | 2020-11-20 | 英国质谱公司 | Image-guided open ionization mass spectrometry |
| US11342170B2 (en) | 2015-03-06 | 2022-05-24 | Micromass Uk Limited | Collision surface for improved ionisation |
| US11289320B2 (en) | 2015-03-06 | 2022-03-29 | Micromass Uk Limited | Tissue analysis by mass spectrometry or ion mobility spectrometry |
| US11367606B2 (en) | 2015-03-06 | 2022-06-21 | Micromass Uk Limited | Rapid evaporative ionisation mass spectrometry (“REIMS”) and desorption electrospray ionisation mass spectrometry (“DESI-MS”) analysis of swabs and biopsy samples |
| CN107645938A (en) * | 2015-03-06 | 2018-01-30 | 英国质谱公司 | The open type MALDI-MS measure of imaging guiding |
| US11282688B2 (en) | 2015-03-06 | 2022-03-22 | Micromass Uk Limited | Spectrometric analysis of microbes |
| US11031222B2 (en) | 2015-03-06 | 2021-06-08 | Micromass Uk Limited | Chemically guided ambient ionisation mass spectrometry |
| US11037774B2 (en) | 2015-03-06 | 2021-06-15 | Micromass Uk Limited | Physically guided rapid evaporative ionisation mass spectrometry (“REIMS”) |
| US11139156B2 (en) | 2015-03-06 | 2021-10-05 | Micromass Uk Limited | In vivo endoscopic tissue identification tool |
| US11133164B2 (en) | 2015-09-29 | 2021-09-28 | Micromass Uk Limited | Capacitively coupled REIMS technique and optically transparent counter electrode |
| US11031223B2 (en) | 2015-09-29 | 2021-06-08 | Micromass Uk Limited | Capacitively coupled REIMS technique and optically transparent counter electrode |
| US11454611B2 (en) | 2016-04-14 | 2022-09-27 | Micromass Uk Limited | Spectrometric analysis of plants |
| CN109716104A (en) * | 2016-07-25 | 2019-05-03 | 光声技术股份有限公司 | The instrument of the orthogonal fluorescence optoacoustic volume projection of total registration for obtaining tissue and its method used |
| CN108107013B (en) * | 2016-11-25 | 2022-06-21 | 三星电子株式会社 | Compact spectrometer system for non-invasive measurement of biological tissue samples |
| CN108107013A (en) * | 2016-11-25 | 2018-06-01 | 三星电子株式会社 | A compact spectrometer system for non-invasive measurements of biological tissue samples |
| CN109063541B (en) * | 2017-06-08 | 2021-11-12 | 墨奇公司 | System and method for fingerprint identification |
| CN109063541A (en) * | 2017-06-08 | 2018-12-21 | 墨奇公司 | System and method for fingerprint recognition |
| CN111587365B (en) * | 2018-01-11 | 2023-11-03 | 澳大利亚眼科研究中心有限公司 | Methods and systems for quantifying tissue biomarkers |
| CN111587365A (en) * | 2018-01-11 | 2020-08-25 | 澳大利亚眼科研究中心有限公司 | Methods and systems for quantifying tissue biomarkers |
| CN108375547A (en) * | 2018-01-12 | 2018-08-07 | 华南师范大学 | Multispectral optoacoustic and optical coherence tomography bimodal imaging device and method |
| CN112272540A (en) * | 2018-04-04 | 2021-01-26 | 托莫维实验室有限公司 | Quantitative imaging system and use thereof |
| CN115917369A (en) * | 2020-04-23 | 2023-04-04 | 加利福尼亚大学董事会 | Ultrafast Light Field Tomography |
| CN112200883B (en) * | 2020-11-03 | 2023-03-24 | 华北电力大学(保定) | Quantitative intravascular optical coherence tomography method and system |
| CN112200883A (en) * | 2020-11-03 | 2021-01-08 | 华北电力大学(保定) | A quantitative intravascular optical coherence tomography method and system |
| CN114027802A (en) * | 2022-01-10 | 2022-02-11 | 杭州纬壹医疗科技有限公司 | Diffusion optical tomography system |
| CN115128010A (en) * | 2022-07-21 | 2022-09-30 | 清华大学 | Method and device for determining material component proportion |
| CN115128010B (en) * | 2022-07-21 | 2025-04-29 | 清华大学 | A method and device for determining material composition ratio |
| CN115479927A (en) * | 2022-08-24 | 2022-12-16 | 中国科学院宁波材料技术与工程研究所 | A fluorescent color calibration card for endoscope and its preparation method and application |
| CN115607108A (en) * | 2022-09-30 | 2023-01-17 | 西北大学 | A Multi-target Reconstruction Method Based on Blind Source Separation of Surface Measurement Signals |
| CN115607108B (en) * | 2022-09-30 | 2024-10-29 | 西北大学 | Multi-target reconstruction method based on surface measurement signal blind source separation |
Also Published As
| Publication number | Publication date |
|---|---|
| WO2010009747A1 (en) | 2010-01-28 |
| JP5749164B2 (en) | 2015-07-15 |
| US9572497B2 (en) | 2017-02-21 |
| CA2731409A1 (en) | 2010-01-28 |
| EP2344019A1 (en) | 2011-07-20 |
| JP2011528923A (en) | 2011-12-01 |
| US20110306857A1 (en) | 2011-12-15 |
| CA2731409C (en) | 2016-01-05 |
| EP2344019B1 (en) | 2013-11-27 |
| CN102137618B (en) | 2015-06-17 |
Similar Documents
| Publication | Publication Date | Title |
|---|---|---|
| CN102137618B (en) | Quantitative multi-spectral opto-acoustic tomography (MSOT) of tissue biomarkers | |
| JP2011528923A5 (en) | ||
| Yao et al. | Recent progress in photoacoustic molecular imaging | |
| US20220054017A1 (en) | Laser Optoacoustic Ultrasonic Imaging System (LOUIS) and Methods of Use | |
| Deán-Ben et al. | Functional optoacoustic human angiography with handheld video rate three dimensional scanner | |
| Pogue et al. | Quantitative hemoglobin tomography with diffuse near-infrared spectroscopy: pilot results in the breast | |
| US7729750B2 (en) | Method and apparatus for high resolution spatially modulated fluorescence imaging and tomography | |
| Luke et al. | Optical wavelength selection for improved spectroscopic photoacoustic imaging | |
| Wang et al. | Photoacoustic microscopy and computed tomography: from bench to bedside | |
| EP2470887B1 (en) | Systems for tomographic imaging in diffuse media using a hybrid inversion technique | |
| Lin et al. | Photoacoustic imaging | |
| US20080123083A1 (en) | System and Method for Photoacoustic Guided Diffuse Optical Imaging | |
| US20040092824A1 (en) | Method and an arrangement for the determination of the optical properties of a multi-layered tissue | |
| Deán-Ben et al. | Optoacoustic image formation approaches—a clinical perspective | |
| EP2527815B1 (en) | Thermoacoustic imaging with quantitative extraction of an absorption image | |
| Turchin | Methods of biomedical optical imaging: from subcellular structures to tissues and organs | |
| Nogueira et al. | Diffuse reflectance spectroscopy for determination of optical properties and chromophore concentrations of mice internal organs in the range of 350 nm to 1860 nm | |
| Fouladi et al. | Fundamentals of Photoacoustic Imaging | |
| Attia et al. | Photoacoustic Imaging and Sensing for Biomedical Applications | |
| Yin et al. | Listen to the chemical and histological information in biological tissue | |
| Omar et al. | Multimodal optoacoustic imaging | |
| Razansky et al. | Multi-spectral photo-acoustic molecular tomography resolves fluorochrome distribution with high resolution and sensitivity in small animals | |
| RU169745U1 (en) | Optoacoustic Bioimaging Microscope | |
| Su | Laser Optoacoustic Imaging System for Molecular and Functional Imaging Research in Small Animal Models | |
| Ntziachristos et al. | Revolutionizing Biopharmaceutical Development with Quantitative Multispectral Optoacoustic Tomography (MSOT) |
Legal Events
| Date | Code | Title | Description |
|---|---|---|---|
| C06 | Publication | ||
| PB01 | Publication | ||
| C10 | Entry into substantive examination | ||
| SE01 | Entry into force of request for substantive examination | ||
| C14 | Grant of patent or utility model | ||
| GR01 | Patent grant |