CN101663597A - Performing 3-D scatterer imaging from 2-D seismic data - Google Patents
Performing 3-D scatterer imaging from 2-D seismic data Download PDFInfo
- Publication number
- CN101663597A CN101663597A CN200880008621A CN200880008621A CN101663597A CN 101663597 A CN101663597 A CN 101663597A CN 200880008621 A CN200880008621 A CN 200880008621A CN 200880008621 A CN200880008621 A CN 200880008621A CN 101663597 A CN101663597 A CN 101663597A
- Authority
- CN
- China
- Prior art keywords
- seismic
- seismic line
- respective hypothetical
- location
- search
- Prior art date
- Legal status (The legal status is an assumption and is not a legal conclusion. Google has not performed a legal analysis and makes no representation as to the accuracy of the status listed.)
- Granted
Links
Images


Classifications
-
- G—PHYSICS
- G01—MEASURING; TESTING
- G01V—GEOPHYSICS; GRAVITATIONAL MEASUREMENTS; DETECTING MASSES OR OBJECTS; TAGS
- G01V1/00—Seismology; Seismic or acoustic prospecting or detecting
- G01V1/28—Processing seismic data, e.g. for interpretation or for event detection
- G01V1/288—Event detection in seismic signals, e.g. microseismics
Landscapes
- Engineering & Computer Science (AREA)
- Life Sciences & Earth Sciences (AREA)
- Environmental & Geological Engineering (AREA)
- Remote Sensing (AREA)
- Physics & Mathematics (AREA)
- Emergency Management (AREA)
- Business, Economics & Management (AREA)
- Acoustics & Sound (AREA)
- Geology (AREA)
- General Life Sciences & Earth Sciences (AREA)
- General Physics & Mathematics (AREA)
- Geophysics (AREA)
- Geophysics And Detection Of Objects (AREA)
Abstract
一种用于分析来自地层的地震数据的方法。该方法可首先接收地层的二维(2D)地震数据,其中所述二维地震数据包括在勘探区域上获得的并具有大的测线间间距的多个单独的地震测线。然后,可预处理所述2D地震数据以增强衍射能量。对于每个相应的假定衍射体位置,该方法可接着在与所述相应假定衍射体位置相符的附近2D地震测线上搜索相干衍射波达。该方法可接着存储关于所识别的衍射体位置的信息。接着,该方法可基于所识别的衍射体位置来创建地图,其中,所述地图示出高衍射的区域。接着,所述地图可被显示在显示器上,其中所述地图可用来评估地层。
A method for analyzing seismic data from strata. The method first receives two-dimensional (2D) seismic data of the strata, wherein the 2D seismic data comprises multiple individual seismic lines obtained over an exploration area and having large inter-line spacing. The 2D seismic data can then be preprocessed to enhance diffraction energy. For each corresponding hypothetical diffractor location, the method then searches for coherent diffraction arrivals on nearby 2D seismic lines corresponding to the corresponding hypothetical diffractor location. The method then stores information about the identified diffractor locations. Next, the method creates a map based on the identified diffractor locations, wherein the map shows areas of high diffraction. The map is then displayed on a display, wherein the map can be used to evaluate the strata.
Description
技术领域 technical field
本发明一般涉及地震勘探,更具体地涉及进行3-D迁移以在粗略地间隔的2-D地震数据测线之间成像。The present invention relates generally to seismic surveys, and more particularly to performing 3-D migrations to image between roughly spaced lines of 2-D seismic data.
背景技术 Background technique
地震勘探涉及地下地层(formation)和构造的研究。在地震勘探中,一个或多个地震能量源将波发射到某个关注区域,诸如地层中。这些波进入地层并且可能例如通过反射或折射而被散射。一个或多个接收机对反射的波进行采样或测量,所得到的数据被记录。所记录的样本可被称为地震数据或“地震轨迹(seismic trace)”。地震数据包含关于被勘探区域的地质构造和地质特征的信息。可分析地震数据以提取被勘探地球区域的构造和特征的详细资料。Seismic exploration involves the study of subsurface formations and structures. In seismic exploration, one or more seismic energy sources launch waves into a region of interest, such as a formation. These waves enter the formation and may be scattered, for example by reflection or refraction. One or more receivers sample or measure the reflected waves, and the resulting data is recorded. The recorded samples may be referred to as seismic data or "seismic traces." Seismic data contain information about the geological formations and geological features of the area being surveyed. Seismic data can be analyzed to extract details of the structure and characteristics of the region of the earth being explored.
一般地,地震勘探的目的是通过将能量向下发射到地下并记录从下面的岩层返回的“反射波”或“回波”来对地球地面下(subsurface)(地层)的部分进行绘图或者成像。被发射到地层中的能量通常是声能。向下传播的声能可源自各种源,诸如陆地上的爆炸或地震振动器,或海洋环境中的空气枪。地震勘探通常使用一个或多个源,并且通常使用大量的传感器或探测器。可用于检测返回的地震能量的传感器通常是地震检波器(geophone,用于陆地测量)或水听器(hydrophone,用于海洋测量)。In general, the purpose of seismic exploration is to map or image portions of the Earth's subsurface (formation) by sending energy down into the ground and recording "reflected waves" or "echoes" that return from the underlying rock formations . The energy transmitted into the formation is typically acoustic energy. The downward propagating acoustic energy can originate from various sources, such as explosive or seismic vibrators on land, or air guns in marine environments. Seismic surveys typically use one or more sources, and often a large number of sensors or detectors. Sensors that can be used to detect the returning seismic energy are typically geophones (for land surveys) or hydrophones (for oceanographic surveys).
在地震勘探(也称为地震测量)中,能量源可被设置在所关注的地质构造或地层上方的地表附近的一个或多个位置。每当源被激活,该源产生向下穿过地面并且至少部分被反射的地震信号。地震信号从地面下各种类型的不连续面(discontinuity)被部分地反射,包括来自“岩层”边界的反射波。一般地,地震信号的部分反射可能出现在地面下物质的弹性性质发生了改变的每个地方。被反射的地震信号向着地表往上传输。通常在地表或地表附近的多个位置记录到达地表的反射地震信号。根据时间来数字化和记录所记录的返回信号(每个数据点包括信号振幅和相应的信号获取时间)。In seismic surveying (also known as seismic surveying), energy sources may be placed at one or more locations near the earth's surface above a geological formation or formation of interest. Whenever a source is activated, the source generates a seismic signal that passes down the ground and is at least partially reflected. Seismic signals are partially reflected from various types of discontinuities in the subsurface, including reflections from "rock formation" boundaries. In general, partial reflections of seismic signals may occur everywhere the elastic properties of the subsurface material are altered. The reflected seismic signal travels upward toward the surface. Reflected seismic signals arriving at the surface are typically recorded at multiple locations on or near the surface. The recorded return signal is digitized and recorded as a function of time (each data point includes signal amplitude and corresponding signal acquisition time).
地震数据是记录被从地面下的不连续面反射的声能的结果。组成记录的数字样本通常是以相等的时间间隔获得的。此外,传统数字地震轨迹中的每个样本与传播时间相关联。在源和接收机都位于地表的情况下,反射能量的样本具有从源到反射体以及再返回地表的往返传播时间。Seismic data is the result of recording acoustic energy that is reflected from subsurface discontinuities. The digital samples that make up the record are usually taken at equal time intervals. Furthermore, each sample in a traditional digital seismic trace is associated with a travel time. With both the source and receiver at the surface, a sample of reflected energy has a round-trip travel time from the source to the reflector and back to the surface.
一般地,地震测量中的每个轨迹的地表位置被追踪,并且被作为该轨迹自身的一部分(作为该轨迹标题信息的一部分)。这允许各轨迹内包含的地震信息在此后与特定地表和地面下位置相关,从而提供一种用于在地图上张贴和勾画地震数据-(以及从其中提取的属性)的手段(即,“绘图”)。Typically, the surface position of each trace in a seismic survey is tracked and included as part of the trace itself (as part of the trace header information). This allows the seismic information contained within each trace to thereafter be correlated to a specific surface and subsurface location, thereby providing a means for posting and delineating seismic data - (and attributes extracted therefrom) on a map (i.e., "mapping ").
可组合多个源激活/记录组合以创建该地面下可在大面积上延伸的近似连续的剖面(profile)。在二维(2-D)地震测量中,一般沿单测线或径迹,“2-D地震测线或剖面”布置记录位置。在三维(3-D)测量中,记录位置通常以特定图案分布在表面上。将以“原始”或“预处理”的形式针对每对源和接收机位置存在“叠前”(pre-stack)地震轨迹。地震处理的一般目的是将获得的地震数据变换为对于地震解释的一些方面,诸如(但不限于)地面下地质的构造和/或地层学(stratigraphic)推论、潜在的地面下油气油藏(hydrocarbon reservoir)的岩性(lithology)和/或流体估算等,有用的形式。地震处理技术和地震数据组织通常取决于最终解释目标、地震数据的质量、地面下的复杂性以及许多其他因素。Multiple source activation/record combinations can be combined to create a nearly continuous profile of the subsurface that can extend over a large area. In two-dimensional (2-D) seismic surveys, recording locations are generally arranged along a single line or track, a "2-D seismic line or profile". In three-dimensional (3-D) measurements, the recording locations are usually distributed over the surface in a specific pattern. There will be a "pre-stack" seismic trace for each pair of source and receiver locations in "raw" or "preprocessed" form. The general purpose of seismic processing is to transform acquired seismic data into aspects useful for seismic interpretation, such as (but not limited to) structural and/or stratigraphic inferences of subsurface geology, potential subsurface hydrocarbon reservoirs, useful forms for lithology and/or fluid estimation of reservoir). Seismic processing techniques and seismic data organization often depend on the ultimate interpretation goals, the quality of the seismic data, the complexity of the subsurface, and many other factors.
已被恰当地获取和处理的地震数据可向勘探人员(其工作是识别潜在的钻探地点的石油公司人员)提供大量的信息。例如,地震剖面向勘探人员提供对于岩层的地面下构造的广阔视角,并经常从其它一些特征中显露出与油气的捕集(entrapment)和贮藏相关联的重要特征,诸如断层、褶皱、背斜、不整合面和地面下盐丘和矿脉等等。在对地震测量数据进行计算机处理期间,定期地产生对于地面下岩石不连续面的估计,并检测和显示近地表不均匀性。在一些情况下,可以使用地震数据来直接估计岩石孔隙度、水饱和度和油气含量。不那么明显地,通常可以经验性地使诸如相位、峰值振幅、峰谷比等等的地震波形属性与已知的油气分布(occurrence)相关,并且将这种相关应用于针对新的勘探目标而收集的地震数据。Seismic data that has been properly acquired and processed can provide a wealth of information to surveyors (oil company personnel whose job it is to identify potential drilling sites). For example, seismic sections provide surveyors with a broad view of the subsurface structure of rock formations and often reveal important features associated with hydrocarbon entrapment and storage, such as faults, folds, anticlines, among other features , unconformity surfaces and subsurface salt domes and veins, etc. During computer processing of seismic survey data, estimates of subsurface rock discontinuities are periodically produced and near-surface inhomogeneities are detected and displayed. In some cases, seismic data can be used to directly estimate rock porosity, water saturation, and hydrocarbon content. Less obviously, it is often possible to empirically correlate seismic waveform attributes such as phase, peak amplitude, peak-to-valley ratio, etc. Collected seismic data.
在20世纪80年代中期之前,大多数的地震数据获取是二维(2-D)的,包括在勘探区域上的某个(些)粗略图案中获得的多个单独的地震测线。基于对这些数据的解释,生成三维(3-D)的构造地图来帮助评估前景。随后,广泛接受精细采样的3-D地震获取方法使得2-D项目退化为新数据获取中的一小部分,其中大部分的2-D工作包括对先前已有的2-D数据网格进行再处理。Prior to the mid-1980s, most seismic data acquisitions were two-dimensional (2-D), comprising multiple individual seismic lines acquired in some coarse pattern(s) over the survey area. Based on the interpretation of these data, three-dimensional (3-D) structural maps are generated to aid in the assessment of prospects. Subsequently, the widespread acceptance of fine-sampled 3-D seismic acquisition methods has degraded 2-D projects to a small fraction of new data acquisitions, with most of the 2-D work consisting of gridding of previously existing 2-D data. reprocessing.
近年来,2-D数据获取以大地域2-D地震网格(诸如覆盖了北墨西哥湾的很多地方的GulfSpan项目)的形式重新兴起。这样的获取被设计用于提供地域性的框架。然而,这种获取方式得到的测线间间隔是用公里来测量的,因此一般不适合于3-D地震迁移(migration)成像。3-D迁移失败的原因是其沿近似为圆形的弧向侧面和向上扫过每个给定的2-D测线而进入测线之间的间隔内。这在间隙内产生了高度混淆的幻象结构。(理论上,沿该弧的某些位置或所有位置可以是地震测线能量的真实图像。实际上,经常以不充分的理由被直接假设为在测线本身以下。)In recent years there has been a resurgence of 2-D data acquisition in the form of large-area 2-D seismic grids such as the GulfSpan project covering much of the northern Gulf of Mexico. Such acquisitions are designed to provide a regional framework. However, the inter-line spacing obtained by this acquisition method is measured in kilometers, so it is generally not suitable for 3-D seismic migration imaging. The 3-D migration fails because it sweeps each given 2-D line laterally and upwardly along an approximately circular arc into the space between the lines. This creates a highly confusing phantom structure within the gap. (Theoretically, some or all locations along this arc could be a true picture of the seismic line energy. In practice, it is often assumed, for poor reason, to be directly below the line itself.)
3-D迁移无法在粗略地间隔的2-D测线之间可靠成像的结果是对测线间间隙的解释必须基于可以在相邻(或相交)的2-D测线之间相互关联的那些。实质上,可绘出一个平滑的表面来连接在测线之间相互关联的反射体,或者在无法进行这种相互关联的情况下,可仅推断在间隙内具有某种未知的结构,该结构破坏或终止了反射体。这没有提供关于测线之间的不可预测结构的可靠知识,准确地讲,没有提供稠密的(dense)3-D获取和成像所提供的信息。实际上,这就是为什么尽管费用较高,3-D还是已经被反复证明是一种有价值的投资。通常,这种不可预测的结构形成了将油气密封到油藏中的流动屏障。A consequence of the inability of 3-D migration to be reliably imaged between roughly spaced 2-D lines is that interpretation of interline gaps must be based on Those ones. Essentially, a smooth surface can be drawn to connect reflectors that correlate between survey lines, or, where such correlation is not possible, one can simply infer that there is some unknown structure within the gap that Destroys or terminates a reflector. This does not provide reliable knowledge of the unpredictable structure between the lines, precisely the information provided by dense 3-D acquisition and imaging. In fact, that's why 3-D has proven time and again to be a worthwhile investment, despite its higher cost. Often, this unpredictable structure forms a flow barrier that seals oil and gas into the reservoir.
因此,希望提供一种直接根据2-D地震数据网格来检测和定位这种“不可预测的”结构的手段。这种能力将提供多种好处。可在已确定了其结构复杂性的区域处更智能地把用于获得稠密3-D覆盖的填充获取作为目标。可重新处理生产中(producing)的油藏的最佳(vintage)2-D网格来更好地了解流动屏障的几何形状和产生历史。此外,当测线之间不存在或几乎不存在不可预测的结构时,2-D测线相关性和相关联的油藏储量估计是比较可信的。Accordingly, it would be desirable to provide a means of detecting and locating such "unpredictable" structures directly from a grid of 2-D seismic data. This capability will provide several benefits. Fill acquisition for dense 3-D coverage can be targeted more intelligently at regions whose structural complexity has been determined. An optimal vintage 2-D mesh of a producing reservoir can be reprocessed to better understand the geometry and production history of the flow barrier. Furthermore, 2-D line correlations and associated reservoir reserve estimates are more reliable when there is little or no unpredictable structure between lines.
发明内容 Contents of the invention
本发明描述了一种用于分析来自地层的地震数据的系统和方法的各种实施例。Various embodiments of a system and method for analyzing seismic data from formations are described herein.
所述方法可首先接收地层的二维(2-D)地震数据,其中地震数据包括多个2-D地震测线。2-D地震能量可包括在勘探区域获得的多个单独的地震测线,并且可具有大的测线间间距。The method may first receive two-dimensional (2-D) seismic data of a formation, where the seismic data includes a plurality of 2-D seismic lines. 2-D seismic energy may include multiple individual seismic lines acquired over a survey area, and may have large interline spacings.
接着,可预处理2-D地震数据以增强衍射能量。这可涉及执行倾角/速度滤波以增强衍射波达(arrival)的陡峭线性波达(波尾(tail))特性。Next, the 2-D seismic data can be preprocessed to enhance the diffraction energy. This may involve performing dip/velocity filtering to enhance the steep linear arrival (tail) characteristic of the diffracted arrival.
对于多个假定衍射体位置中的每个相应位置,所述方法可接着在与所述相应假定衍射体位置的3-D地震反应相符的附近2-D地震测线上搜索相干衍射波达。该搜索可包括在与假定衍射体位置相符的地震测线的至少预定子集上或者与假定衍射体位置相符的全部地震测线上搜索相干衍射波达。For each respective one of the plurality of putative diffraction volume locations, the method may then search for coherent diffraction arrivals on nearby 2-D seismic lines consistent with the 3-D seismic response of the respective putative diffraction volume location. The search may include searching for coherent diffraction arrivals on at least a predetermined subset of the seismic lines coincident with the assumed diffractive body locations, or all of the seismic lines coincident with the assumed diffractive body locations.
在一个实施例中,搜索相干衍射波达可包括计算沿与相应假定衍射体位置相关联的预测轨道的相干性(coherence)的量度。在另一个实施例中,搜索可包括首先针对2-D地震数据计算在假设曲线上的总和,之后再针对在所述2-D地震数据中的随机数据计算在该假设曲线上的总和,然后对这两次计算结果的相对幅值进行比较,以自动选择相干衍射波达。在又一个实施例中,搜索可包括计算沿2-D地震测线上的可能衍射表面的简单加权总和,从而得到相对强度估计值。In one embodiment, searching for coherent diffractive wave arrivals may include computing a measure of coherence along predicted trajectories associated with respective putative diffractive body positions. In another embodiment, searching may include first summing over a hypothetical curve for the 2-D seismic data, then summing over the hypothetical curve for random data in the 2-D seismic data, and then The relative magnitudes of the two calculations are compared for automatic selection of coherent diffracted wave arrivals. In yet another embodiment, the search may include computing a simple weighted sum of possible diffractive surfaces along the 2-D seismic line, resulting in a relative intensity estimate.
然后,所述方法可存储关于在与相应假定衍射体位置相符的附近2-D地震测线上已被识别为具有相干衍射波达的第一一个或多个相应的假定衍射体位置的信息。接着,所述方法可基于所识别的衍射体位置,创建与地下体(underground volume)相关的地图,其中可突出表示高衍射的区域。接着,该地图可在诸如计算机屏幕或绘图仪(paperplot)的显示器上被显示,并且可被勘探人员用来评估散射地层的几何形状和地质特征。The method may then store information regarding the first one or more corresponding putative diffractome locations that have been identified as having coherent diffraction arrivals on nearby 2-D seismic lines that coincide with the respective putative diffractogram locations . The method can then create a map associated with the underground volume based on the identified diffracting volume locations, where areas of high diffracting can be highlighted. This map can then be displayed on a display, such as a computer screen or a paperplot, and can be used by surveyors to assess the geometry and geological characteristics of the scattering formation.
附图说明 Description of drawings
当结合附图阅读时,通过参照下面的详细描述,可以更全面地理解本发明前述的以及其他的目的、特征和优点,在附图中:The foregoing and other objects, features and advantages of the present invention can be more fully understood by reference to the following detailed description when read in conjunction with the accompanying drawings, in which:
图1示例了用于分析地震数据的系统100的一个实施例;Figure 1 illustrates one embodiment of a
图2是示例用于根据本发明的一个实施例分析地震数据的方法的流程图;Figure 2 is a flowchart illustrating a method for analyzing seismic data according to one embodiment of the present invention;
图3A示出了在长岛海湾(Long Island Sound)拍摄的六个重叠的地震测量的图;Figure 3A shows a graph of six overlapping seismic measurements taken at Long Island Sound (Long Island Sound);
图3B示出了图3A的放大部分,该部分包含来自地震测量1、2、3、4的多个交叉形地震测线;Figure 3B shows a magnified portion of Figure 3A containing multiple cross-shaped seismic lines from
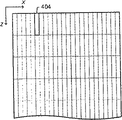
图4A示出了单元的例证3-D阵列402的顶视图,该例证3-D阵列402包含地震测线408和相交的地震测线406、410;Figure 4A shows a top view of an exemplary 3-
图4B示出了该例证3-D阵列402的地下侧视图;FIG. 4B shows a subsurface side view of the exemplary 3-
图4C示出了例证单元的透视图;Figure 4C shows a perspective view of an example unit;
图5示出了合成地震图截面,该合成地震图截面示出了来自位于该地震图截面附近的衍射体的双曲线衍射504、506和线性衍射波尾502、508;以及Figure 5 shows a synthetic seismogram section showing
图6提供了所识别的衍射体位置的例证3-D图像。Figure 6 provides an exemplary 3-D image of the identified diffractome locations.
尽管可对本发明进行各种修改和作出替换形式,但还是在附图中举例示出了本发明的具体实施例,并且将在这里对其进行详细描述。然而,应当理解,附图及其详细描述并不意图将本发明限制为所公开的特定形式,而是相反,目的是为了覆盖落入由所附权利要求书限定的本发明的精神和范围内的所有修改、等同物和变形。请注意,各个标题仅为了组织目的,而不是想要用来限制或解释说明书或权利要求。此外,请注意本申请中通篇使用的词语“可以/可”表示允许的意思(即,具有潜力,能够),而不是强制的意思(即,必须)。术语“包括/包含”及其派生词是指“包括/包含,但不限于”。While the invention is susceptible to various modifications and alternative forms, specific embodiments of the invention are illustrated in the drawings and will be described in detail herein. It should be understood, however, that the drawings and detailed description thereof are not intended to limit the invention to the particular forms disclosed, but on the contrary, the intention is to cover within the spirit and scope of the invention as defined by the appended claims All modifications, equivalents and variations of . Please note that each heading is for organizational purposes only and is not intended to limit or interpret the specification or claims. In addition, please note that the word "may/may" as used throughout this application means a permissive sense (ie, has the potential to be able to), rather than a mandatory meaning (ie, must). The term "including/comprising" and its derivatives mean "including/comprising, but not limited to".
具体实施方式 Detailed ways
图1-基于计算机的分析系统Figure 1 - Computer-based analysis system
图1示例了用于根据本发明的一组实施例分析地震数据的系统100(诸如计算机系统)。系统100可包括处理单元110、一组存储器装置115、通信总线120、一组输入装置125和一个或多个显示装置130。该组存储器装置115可包括各种形式的存储介质和存储器访问装置中的任何一种。例如,存储器装置115可包括半导体RAM和ROM装置以及诸如CD-ROM驱动器、磁盘驱动器、磁带驱动器、存储区域网(SAN)等大容量存储器装置。Figure 1 illustrates a system 100 (such as a computer system) for analyzing seismic data according to one set of embodiments of the present invention.
处理单元110被配置为读取和执行程序指令,例如在存储介质(诸如一个或多个CD-ROM)上提供的并且在执行时被载入半导体存储器中的程序指令。处理单元110可通过通信总线120(或通过一组总线)耦接至存储器装置115。响应于程序指令,处理单元110可对存储在一个或多个存储装置115中的地震数据进行操作。处理单元110可包括一个或多个可编程处理器(例如,微处理器)。The
一个或多个用户可通过一组输入装置125向系统100提供输入。输入装置125可包括诸如键盘、鼠标装置、数字化小键盘、跟踪球、光笔、数据手套、眼睛方位传感器、头部方位传感器等装置。所述一组显示装置130可包括诸如监视器、投影仪、头戴显示器、打印机、绘图仪等装置。One or more users may provide input to the
在一个实施例中,系统100可包括一个或多个通信装置135,例如用于与计算机网络接口的网络接口卡。例如,可将在远程地点收集的地震数据通过计算机网络传送给系统100。系统100可使用网络接口卡接收来自计算机网络的地震数据。在其他实施例中,系统100可包括通过计算机网络来耦接的多台计算机和/或其他组件,其中,可视需要将用于实现本发明实施例的存储和/或计算分布在各计算机(和/或各组件)上。In one embodiment,
在本发明的一个实施例中,系统100存储用于基于2-D地震网格来确定地震信息的软件(程序指令和/或数据结构)。更具体地,可执行该软件来检测和定位与2-D地震网格的地震数据相关的地下构造。In one embodiment of the invention, the
图2-流程图Figure 2 - Flowchart
图2是示例本发明的一个实施例的流程图。该流程图可用由计算机系统执行的软件程序来实现,例如,该软件程序可被存储在系统100的存储器115中,并且可被处理器110执行。Figure 2 is a flow diagram illustrating one embodiment of the present invention. The flowchart can be implemented with a software program executed by a computer system, for example, the software program can be stored in the memory 115 of the
在202中,地震数据(优选地,2-D地震数据)被存储在存储器中和/或被获取。例如,地震数据可被存储在系统100的存储器115中。地震数据可以是2-D地震数据,并且可包括在勘探区域上获得的多个单独的地震测线,例如在勘探区域的粗略图案中获得的多个单独的地震测线。在一个实施例中,2-D地震数据具有足够大的测线间间距,从而使得地震数据对于3-D地震迁移成像来说不易处理。术语“大的测线间间距”是指大约两百米或更大的测线间间距。在第一个例子中,2-D地震数据可具有在一公里或更多公里的数量级上的测线间间距(测线之间的间距)。在第二个例子中,2-D地震数据可包括不同次地沿形成不规则交叉形图案的轨迹的不同方位获得的多个地震测线。在这第二例子中,测线间距可在零(此处两个地震测线具有相交点)至在与相交点完全分离的点处的一公里或更多公里之间变化。图3A示出了在长岛海湾拍摄的六个重叠的地震测量的图。图3B示出了图3A的放大部分,该放大部分示例了来自地震测量1、2、3、4的多个交叉形地震测线。In 202, seismic data, preferably 2-D seismic data, is stored in memory and/or acquired. For example, seismic data may be stored in memory 115 of
在204中,所述方法预处理地震数据以增强衍射能量。在204中,可使用各种预处理方法或技术中的任何一个来增强衍射能量。在一个实施例中,204中的方法可包括简单的倾角/速度滤波以增强衍射波达的陡峭波尾特性。在Moser,Landa和Peterson的“基于速度模型的衍射滤波(Velocity model based diffraction filtering)”(SEG ExtendedAbstracts,1999)中描述了204中所执行的方法的一个实施例,在此通过引用将其并入本文,如同在本文中充分、全面地陈述了一样。204中所执行的方法的另一个实施例可包括更复杂的聚焦/散焦变换。在Harlan,Claerbout和Rocca的“信/噪分离和速度估计(Signal/noiseseparation and velocity estimation)”(Geophysics,49(11),1984)或Khaidukov,Landa和Moser的“利用聚焦-散焦方法的衍射成像(Diffraction imaging by a focusing-defocusing approach)”(SEGExtended Abstracts,2003)中描述了该技术的一个例子,在此通过引用而将它们并入本文,如同在本文中充分和全面地陈述了一样。At 204, the method preprocesses the seismic data to enhance diffraction energy. At 204, any of a variety of preprocessing methods or techniques may be used to enhance the diffracted energy. In one embodiment, the method at 204 may include simple dip/velocity filtering to enhance the steep tail characteristics of diffracted waves. One embodiment of the method performed in 204 is described in "Velocity model based diffraction filtering (Velocity model based diffraction filtering)" (SEG Extended Abstracts, 1999) by Moser, Landa and Peterson, which is hereby incorporated by reference herein, as if fully and fully set forth herein. Another embodiment of the method performed at 204 may include more complex focus/defocus transformations. In Harlan, Claerbout and Rocca's "Signal/noise separation and velocity estimation" (Geophysics, 49(11), 1984) or Khaidukov, Landa and Moser's "Diffraction using the focus-defocus method An example of this technique is described in "Diffraction imaging by a focusing-defocusing approach" (SEG Extended Abstracts, 2003), which are hereby incorporated by reference as if fully and fully set forth herein.
在206中,该方法可确定在2-D地震测线之间或之上的假定衍射位置。可通过将紧密排列单元(例如,大小为25m×25m×25m)的3-D阵列放置成跨越该地下体并包含一个或多个2-D地震测线,并选择每个单元内的一个或多个点作为备选衍射体位置,来初始地确定假定衍射体位置。图4A示出了单元的例证3-D阵列402的顶视图,该例证3-D阵列402包含地震测线408和相交地震线406、410。图4B示出了例证3-D阵列402的地下侧视图。可视需要使用各种单元尺寸和/或形状。图4C将例证单元404的透视图示为尺寸为a、b、c的长方体。在其他实施例中,可在该地下体内随机选择N个假定衍射体位置(其中,N是被选择用来提供假定衍射体位置之间的所需平均间隔的正整数)。在另外一些实施例中,单元的形状和/或大小在该地下体内可以是变化的或者不规则的,以便在该地下体中地质工作者可能期望发现衍射体位置的各部分上提供较大密度的假定衍射体位置,而在该地下体的其他部分上提供较小密度的假定衍射体位置。At 206, the method may determine putative diffraction locations between or on the 2-D seismic lines. This can be achieved by placing a 3-D array of closely spaced cells (e.g., 25m x 25m x 25m in size) spanning the subsurface body and containing one or more 2-D seismic lines, and selecting one or more A plurality of points are used as candidate diffractome positions to initially determine a hypothetical diffractoid position. FIG. 4A shows a top view of an exemplary 3-
对于每个假定衍射体位置,该方法可执行208、210和212。在208中,对于相应假定衍射体位置,该方法可在与该假定衍射体位置(所提议位置)相符的附近2-D地震测线上搜索相干衍射波达的可用地震数据。在一个实施例中,208中的方法在与该假定衍射体位置相符的所有附近2-D地震测线上搜索相干衍射波达。在另一个实施例中,208中的方法在附近2-D地震测线中至少预定百分比的地震测线上搜索相干衍射波达,所述预定百分比例如大于75%、80%、85%、90%或95%,或其他适当的准则。The method may perform 208, 210, and 212 for each hypothetical diffractome location. At 208, for a corresponding putative diffractome location, the method may search for available seismic data of coherent diffraction arrivals on nearby 2-D seismic lines that coincide with the putative diffractogram location (the proposed location). In one embodiment, the method at 208 searches for coherent diffraction arrivals on all nearby 2-D seismic lines that coincide with the putative diffraction volume location. In another embodiment, the method at 208 searches for coherent diffraction arrivals on at least a predetermined percentage of the nearby 2-D seismic lines, e.g., greater than 75%, 80%, 85%, 90%. % or 95%, or other appropriate guidelines.
208中的方法可包括使多个2-D测线中的衍射波达自动地相关。可以按照各种方式实施208中的技术。在一个实施例中,可沿与潜在衍射点相关联的预测轨道计算相干性的相似性(semblance)(经常被用于传统的速度分析)或其他量度。可使用关于相干性和相似性的标准的勘探地球物理学定义和公式来进行该计算。例如,该方法可使用由勘探地球物理学家协会(Society of Exploration Geophysics)发表的R.E.Sheriff的“地球勘探物理学大辞典(Encylopedic Dictionary ofExploration Geophysics)”中的关于相干体和相似性的标准勘探地球物理学定义和公式,在此通过引用而将该文献并入本文,如同其在本文中充分和全面地陈述了一样。这提供了对衍射体在该位置出现的可能性的度量。The method at 208 may include automatically correlating diffracted arrivals in the plurality of 2-D lines. The technique in 208 may be implemented in various ways. In one embodiment, semblance (often used in traditional velocity analysis) or other measures of coherence may be calculated along predicted trajectories associated with potential diffraction points. This calculation can be done using standard exploration geophysical definitions and formulas for coherence and similarity. For example, the method can use the standard Exploration Earth on coherence and similarity from R.E. Sheriff's "Encylopedic Dictionary of Exploration Geophysics" published by the Society of Exploration Geophysics. Physical definitions and formulas, this document is hereby incorporated by reference as if fully and fully set forth herein. This provides a measure of the likelihood of a diffractome occurring at that location.
在另一个实施例中,在208中,该方法可按照Harlan、Claerbout和Rocca的上述方法,首先针对实际2-D数据计算假设衍射波达路径上的总和,然后可再针对所述实际2-D数据中的随机数据计算同一条假设路径上的总和。接着,该方法可对这两次计算结果的相对幅值进行比较,从而自动地选择可能的衍射体位置。In another embodiment, at 208, the method may follow the above-mentioned method of Harlan, Claerbout, and Rocca, first calculating the sum over the hypothetical diffraction path-of-arrival for the actual 2-D data, and then for the actual 2-D Random data in the D data calculates the sum over the same hypothetical path. Then, the method can compare the relative magnitudes of the two calculation results, so as to automatically select the possible diffraction body positions.
在另一个实施例中,在208中,该方法可沿每个提出的衍射表面计算简单的加权总和以直接聚焦到衍射,同时得出相对强度估计值。可选择权重值以强调2-D地震数据中几乎线性的波尾(通常是衍射表面的特征)。或者,可根据迁移成像理论选择权重,以便得到与真实的地面下衍射强度线性相关的衍射强度估计值。In another embodiment, at 208 the method may compute a simple weighted sum along each proposed diffractive surface to focus directly on the diffractive while yielding a relative intensity estimate. Weight values can be chosen to emphasize nearly linear wave tails (typically characteristic of diffractive surfaces) in 2-D seismic data. Alternatively, the weights can be chosen according to migration imaging theory in order to obtain an estimate of the diffraction intensity that is linearly related to the true subsurface diffraction intensity.
可以认为在208中执行的操作与地震震中定位相反,地震震中定位涉及首先识别多个位置处的相关波达,然后再求解以确定震中。而本文描述的方法实质上检查可能的震中(例如,全部或部分的可能震中),接着确定在每个传感器站点(或者传感器站点中的基本上大部分的传感器站点)处是否存在恰当相关的波达。The operations performed at 208 may be considered as the inverse of seismic epicenter location, which involves first identifying relevant arrivals at multiple locations and then solving to determine the epicenter. Whereas the method described herein essentially examines possible epicenters (e.g., all or some of them) and then determines whether there is a properly correlated wave at each sensor site (or substantially a majority of the sensor sites). Da.
图5示出了合成的地震图截面,该地震图截面示出了来自位于该地震图截面附近的衍射体的双曲线衍射504、506和线性衍射波尾502、508。Figure 5 shows a composite seismogram section showing
在210中,该方法确定是否关于相应假定衍射体位置发现了相符的波达。如果是,则在212中可标记假定衍射体位置或者可存储信息以指示该相应假定衍射体位置实际上是衍射体位置。At 210, the method determines whether a matching wavearth is found for the corresponding putative diffractogram location. If so, then in 212 the putative diffractome position may be flagged or information may be stored to indicate that the corresponding putative diffractive body position is actually a diffractive body position.
对于已在206中识别出的各假定衍射体位置中的每一个,执行步骤208、210和212。从而,可针对每个关注的位置执行衍射体存在或不存在的估计。在所有的假定衍射体位置已在208中被检查,并且具有相干衍射波达的那些位置已在212中被标记之后,在214中,该方法可产生并存储衍射的地图及其关联的结构配置。该方法可基于稠密的网格位置(a dense grid of locations)自动地迭代,从而生成衍射体的地图,并由此得到衍射体的关联结构配置。在一些实施例中,该方法可产生和存储衍射体的3-D图像。图6提供了所识别的衍射体位置的例证3-D图像。For each of the putative diffractome positions that have been identified in 206,
还可在每次迭代中,通过使用不同的网格(或单元阵列)从而使用不同的假定衍射位置组,来多次执行本文描述的方法。在一个实施例中,该方法可利用“由粗到细”的方法,即,可使用粗略的网格(例如,50m×50m×50m)来确定假定衍射位置,然后在粗略迭代中所识别出的可能衍射位置处进行精细网格(例如,25m×25m×25m或10m×10m×10m)的一次或多次迭代。The method described herein may also be performed multiple times by using a different grid (or cell array) and thus a different set of assumed diffraction positions in each iteration. In one embodiment, the method may utilize a "coarse-to-fine" approach, i.e., a coarse grid (e.g., 50m x 50m x 50m) may be used to determine putative diffraction locations, and then the identified One or more iterations of a fine grid (eg, 25m x 25m x 25m or 10m x 10m x 10m) are performed at all possible diffraction locations.
在216中,由该方法产生的衍射的地图(或衍射体位置的3-D图像)和/或其他有关数据可被存储在存储器中,可被显示在显示器上,和/或可被分析以评估地层。识别出的衍射体的集合可被载入到3-D可视化系统中,从而使得人们随后可识别出高衍射区域,并且(理想地)能够根据地质学模板(诸如断层曲线、地堑和地垒特征、或者盐岩或页岩的侵入底辟)来解释它们的校准。可基于对214中得到的信息的分析,作出关于在地层中的何处勘探(例如,通过获取3-D地震填充数据或钻探探井)油气的决定。At 216, the map of diffraction (or 3-D image of the position of the diffracting body) and/or other relevant data produced by the method can be stored in memory, can be displayed on a display, and/or can be analyzed to Assess strata. The set of identified diffractive volumes can be loaded into a 3-D visualization system, allowing one to subsequently identify areas of high diffraction and (ideally) be able to features, or intrusive diapirs of salt rocks or shales) to explain their calibration. Based on the analysis of the information obtained in 214, a decision may be made as to where to explore for hydrocarbons in the formation (eg, by acquiring 3-D seismic fill data or drilling exploratory wells).
因此,本发明的各个实施例用来执行在2-D测线之间的衍射体(例如地震能量的点散射体)的成像。衍射的能量实际上是全方位的,并且在所有附近地震测线上相干地到达,通常表现为大致为双曲线的“擦边”(side-swipe)。这种散射体由被阻断的地层(stratum)的边缘提供,诸如在结构运转中出现,诸如生长断层、地堑和地垒构造、盐岩、页岩或火山侵入、和/或被埋藏的侵蚀河道。Accordingly, various embodiments of the present invention are used to perform imaging of diffracting volumes (eg, point scatterers of seismic energy) between 2-D survey lines. The diffracted energy is virtually omnidirectional and arrives coherently on all nearby seismic lines, often appearing as a roughly hyperbolic "side-swipe". Such scatterers are provided by interrupted stratum edges, such as occur during structural operations, such as growth faults, graben and horst formations, salt, shale, or volcanic intrusions, and/or buried Erosion of the river course.
尽管已结合优选实施例描述了本发明的系统和方法,但是并不意图将其限制为本文所述的特定形式,而是相反,是要覆盖能够合理地包含在由所附权利要求书限定的本发明的精神和范围内的各种变形、修改和等同物。Although the systems and methods of the present invention have been described in connection with preferred embodiments, it is not intended to be limited to the specific forms described herein, but on the contrary, it is intended to cover all aspects that can reasonably be included in the appended claims. Variations, modifications and equivalents within the spirit and scope of the invention.
Claims (20)
Applications Claiming Priority (3)
| Application Number | Priority Date | Filing Date | Title |
|---|---|---|---|
| US11/674,526 | 2007-02-13 | ||
| US11/674,526 US7545704B2 (en) | 2007-02-13 | 2007-02-13 | Performing 3-D scatterer imaging from 2-D seismic data |
| PCT/US2008/053808 WO2008100990A2 (en) | 2007-02-13 | 2008-02-13 | Performing 3-d scatterer imaging from 2-d seismic data |
Publications (2)
| Publication Number | Publication Date |
|---|---|
| CN101663597A true CN101663597A (en) | 2010-03-03 |
| CN101663597B CN101663597B (en) | 2012-08-08 |
Family
ID=39686582
Family Applications (1)
| Application Number | Title | Priority Date | Filing Date |
|---|---|---|---|
| CN2008800086217A Expired - Fee Related CN101663597B (en) | 2007-02-13 | 2008-02-13 | Performing 3-D scatterer imaging from 2-D seismic data |
Country Status (9)
| Country | Link |
|---|---|
| US (1) | US7545704B2 (en) |
| EP (1) | EP2115493A2 (en) |
| CN (1) | CN101663597B (en) |
| AR (1) | AR065332A1 (en) |
| AU (1) | AU2008216238B2 (en) |
| BR (1) | BRPI0807960A2 (en) |
| CA (1) | CA2677810A1 (en) |
| MX (1) | MX2009008689A (en) |
| WO (1) | WO2008100990A2 (en) |
Cited By (5)
| Publication number | Priority date | Publication date | Assignee | Title |
|---|---|---|---|---|
| CN101900830A (en) * | 2010-06-02 | 2010-12-01 | 西安石油大学 | A Seismic Scattering P-P Wave Imaging Method |
| CN101937098A (en) * | 2010-06-04 | 2011-01-05 | 西安石油大学 | A Seismic Scattering P-S Converted Wave Imaging Method |
| CN105164729A (en) * | 2013-03-29 | 2015-12-16 | 普拉德研究及开发股份有限公司 | Image symmetry for dip determination |
| CN112305585A (en) * | 2019-07-26 | 2021-02-02 | 中国石油天然气集团有限公司 | Three-dimensional data volume acquisition method and device |
| CN116736369A (en) * | 2022-03-03 | 2023-09-12 | 中国石油天然气股份有限公司 | True amplitude migration imaging method, device, equipment and storage medium |
Families Citing this family (7)
| Publication number | Priority date | Publication date | Assignee | Title |
|---|---|---|---|---|
| EP2153249A1 (en) * | 2007-05-24 | 2010-02-17 | Geco Technology B.V. | Near surface layer modeling |
| US8615362B2 (en) * | 2008-10-10 | 2013-12-24 | Westerngeco L.L.C. | Near-surface geomorphological characterization based on remote sensing data |
| US8760966B2 (en) * | 2009-10-08 | 2014-06-24 | Westerngeco L.L.C. | Joint interpretation of Rayleigh waves and remote sensing for near-surface geology |
| CN112394414B (en) * | 2020-12-14 | 2022-12-06 | 中国海洋石油集团有限公司 | Two-step seismic diffraction wave field prestack separation method |
| KR102757898B1 (en) * | 2021-11-16 | 2025-01-21 | 연세대학교 산학협력단 | Analyzing System and Analyzing Method of subsurface faults in large cities |
| CN116520428B (en) * | 2022-01-21 | 2025-09-30 | 中国石油化工股份有限公司 | Prestack energy consistency processing method for full-node seismic data |
| CN116047598B (en) * | 2022-11-07 | 2023-09-19 | 北京派特杰奥科技有限公司 | An artificial intelligence-based oil exploration method and system |
Family Cites Families (14)
| Publication number | Priority date | Publication date | Assignee | Title |
|---|---|---|---|---|
| US4866659A (en) * | 1984-04-06 | 1989-09-12 | Pennzoil Company | Method for selection of mining and drilling sites using synthesized three dimensional seismic data |
| WO1991015783A1 (en) * | 1990-04-03 | 1991-10-17 | Thomas Edwin Owen | Enhanced detection of seismic diffractor targets |
| GB9011836D0 (en) * | 1990-05-25 | 1990-07-18 | Mason Iain M | Seismic surveying |
| US5394151A (en) * | 1993-09-30 | 1995-02-28 | The United States Of America As Represented By The Secretary Of The Navy | Apparatus and method for producing three-dimensional images |
| US6049507A (en) * | 1997-09-30 | 2000-04-11 | Mobil Oil Corporation | Method and apparatus for correcting effects of ship motion in marine seismology measurements |
| US6553315B2 (en) * | 1997-10-15 | 2003-04-22 | Albin K. Kerekes | Seismic imaging using omni-azimuth seismic energy sources and directional sensing |
| US6088295A (en) * | 1998-12-29 | 2000-07-11 | The United States Of America As Represented By The Secretary Of The Navy | Feature imaging and adaptive focusing for synthetic aperture processor |
| US6151556A (en) * | 1999-06-18 | 2000-11-21 | Mobil Oil Corporation | Method and apparatus for doppler smear correction in marine seismology measurements |
| US6490528B2 (en) * | 2000-04-17 | 2002-12-03 | Exxonmobil Upstream Research Company | Method for imaging discontinuites in seismic data |
| US6584409B2 (en) * | 2001-03-13 | 2003-06-24 | Westerngeco L.L.C. | Seismic processing method to improve spatial resolution |
| US6865489B2 (en) * | 2002-10-02 | 2005-03-08 | Exxonmobil Upstream Research Company | Method for compensating mild lateral velocity variations in pre-stack time migration in the frequency-wave number domain |
| NO322089B1 (en) * | 2003-04-09 | 2006-08-14 | Norsar V Daglig Leder | Procedure for simulating local preamp deep-migrated seismic images |
| US7085195B2 (en) * | 2004-03-30 | 2006-08-01 | Rdsp I, L.P. | Method for detecting earth formation fractures by seismic imaging of diffractors |
| US7739051B2 (en) * | 2004-07-14 | 2010-06-15 | Compagnie Generale De Geophysique | Method for determination of diffractor locations at sea bottom for the purpose of attenuating such energy |
-
2007
- 2007-02-13 US US11/674,526 patent/US7545704B2/en not_active Expired - Fee Related
-
2008
- 2008-02-13 CA CA002677810A patent/CA2677810A1/en not_active Abandoned
- 2008-02-13 AU AU2008216238A patent/AU2008216238B2/en not_active Ceased
- 2008-02-13 BR BRPI0807960-9A2A patent/BRPI0807960A2/en not_active IP Right Cessation
- 2008-02-13 CN CN2008800086217A patent/CN101663597B/en not_active Expired - Fee Related
- 2008-02-13 EP EP08729729A patent/EP2115493A2/en not_active Withdrawn
- 2008-02-13 MX MX2009008689A patent/MX2009008689A/en active IP Right Grant
- 2008-02-13 WO PCT/US2008/053808 patent/WO2008100990A2/en not_active Ceased
- 2008-02-13 AR ARP080100615A patent/AR065332A1/en active IP Right Grant
Cited By (8)
| Publication number | Priority date | Publication date | Assignee | Title |
|---|---|---|---|---|
| CN101900830A (en) * | 2010-06-02 | 2010-12-01 | 西安石油大学 | A Seismic Scattering P-P Wave Imaging Method |
| CN101900830B (en) * | 2010-06-02 | 2012-01-11 | 西安石油大学 | Seismic scattering P-P wave imaging method |
| CN101937098A (en) * | 2010-06-04 | 2011-01-05 | 西安石油大学 | A Seismic Scattering P-S Converted Wave Imaging Method |
| CN101937098B (en) * | 2010-06-04 | 2013-06-19 | 西安石油大学 | Seismic scattering P-S converted wave imaging method |
| CN105164729A (en) * | 2013-03-29 | 2015-12-16 | 普拉德研究及开发股份有限公司 | Image symmetry for dip determination |
| CN112305585A (en) * | 2019-07-26 | 2021-02-02 | 中国石油天然气集团有限公司 | Three-dimensional data volume acquisition method and device |
| CN116736369A (en) * | 2022-03-03 | 2023-09-12 | 中国石油天然气股份有限公司 | True amplitude migration imaging method, device, equipment and storage medium |
| CN116736369B (en) * | 2022-03-03 | 2025-11-28 | 中国石油天然气股份有限公司 | True amplitude offset imaging method, device, equipment and storage medium |
Also Published As
| Publication number | Publication date |
|---|---|
| AU2008216238A1 (en) | 2008-08-21 |
| AU2008216238B2 (en) | 2013-06-06 |
| BRPI0807960A2 (en) | 2014-06-10 |
| AR065332A1 (en) | 2009-06-03 |
| CN101663597B (en) | 2012-08-08 |
| CA2677810A1 (en) | 2008-08-21 |
| US20080195321A1 (en) | 2008-08-14 |
| MX2009008689A (en) | 2009-12-08 |
| EP2115493A2 (en) | 2009-11-11 |
| WO2008100990A3 (en) | 2009-02-05 |
| WO2008100990A2 (en) | 2008-08-21 |
| US7545704B2 (en) | 2009-06-09 |
Similar Documents
| Publication | Publication Date | Title |
|---|---|---|
| US8233351B2 (en) | Analyzing borehole seismic data to locate subsurface diffractors | |
| US5671136A (en) | Process for seismic imaging measurement and evaluation of three-dimensional subterranean common-impedance objects | |
| US7952960B2 (en) | Seismic imaging with natural Green's functions derived from VSP data | |
| AU2008216238B2 (en) | Performing 3-D scatterer imaging from 2-D seismic data | |
| EP2846175B1 (en) | Seismic survey analysis | |
| CN101999086B (en) | Method for determining seismic data quality | |
| US9869783B2 (en) | Structure tensor constrained tomographic velocity analysis | |
| CA2940406C (en) | Characterizing a physical structure using a multidimensional noise model to attenuate noise data | |
| CN102939546A (en) | System and method for local attribute matching in seismic processing | |
| EP2548052B1 (en) | System and method of 3d salt flank vsp imaging with transmitted waves | |
| CA2349840A1 (en) | Hydrocarbon edge detection using seismic amplitude | |
| Aminzadeh et al. | Fundamentals of petroleum geophysics | |
| Dando et al. | Complexity in microseismic phase identification: full waveform modelling, traveltime computations and implications for event locations within the Groningen gas field | |
| WO2024191795A1 (en) | Seismic imaging framework | |
| US20250306226A1 (en) | Integrated modeling for seismic survey acquisition parameterization | |
| McNab | Velocity structure of the Whataroa Valley using ambient noise tomography | |
| Ata et al. | Exploiting PS converted waves: Part 2, application to a fractured reservoir | |
| Eide | Influence of frozen ground on seismic data | |
| von Huene et al. | Potential of 3‐D vertical seismic profiles to characterize seismogenic fault zones | |
| Kroenke | A study of the Herald-Phillipstown fault in the Wabash Valley using drillhole and 3-D seismic reflection data | |
| Tarleton et al. | Processing and interpretation of data |
Legal Events
| Date | Code | Title | Description |
|---|---|---|---|
| C06 | Publication | ||
| PB01 | Publication | ||
| C10 | Entry into substantive examination | ||
| SE01 | Entry into force of request for substantive examination | ||
| C14 | Grant of patent or utility model | ||
| GR01 | Patent grant | ||
| C17 | Cessation of patent right | ||
| CF01 | Termination of patent right due to non-payment of annual fee |
Granted publication date: 20120808 Termination date: 20140213 |