[go: up one dir, main page]

Skip to content

A Grafana dashboard compatible with all the cosmos-sdk and tendermint based blockchains.

License

Notifications You must be signed in to change notification settings

zhangyelong/cosmos-dashboard

Folders and files

NameName
Last commit message
Last commit date

Latest commit


History

8 Commits


Repository files navigation

Cosmos Chains Dashboard

A Grafana dashboard compatible with all the cosmos-sdk and tendermint based blockchains.

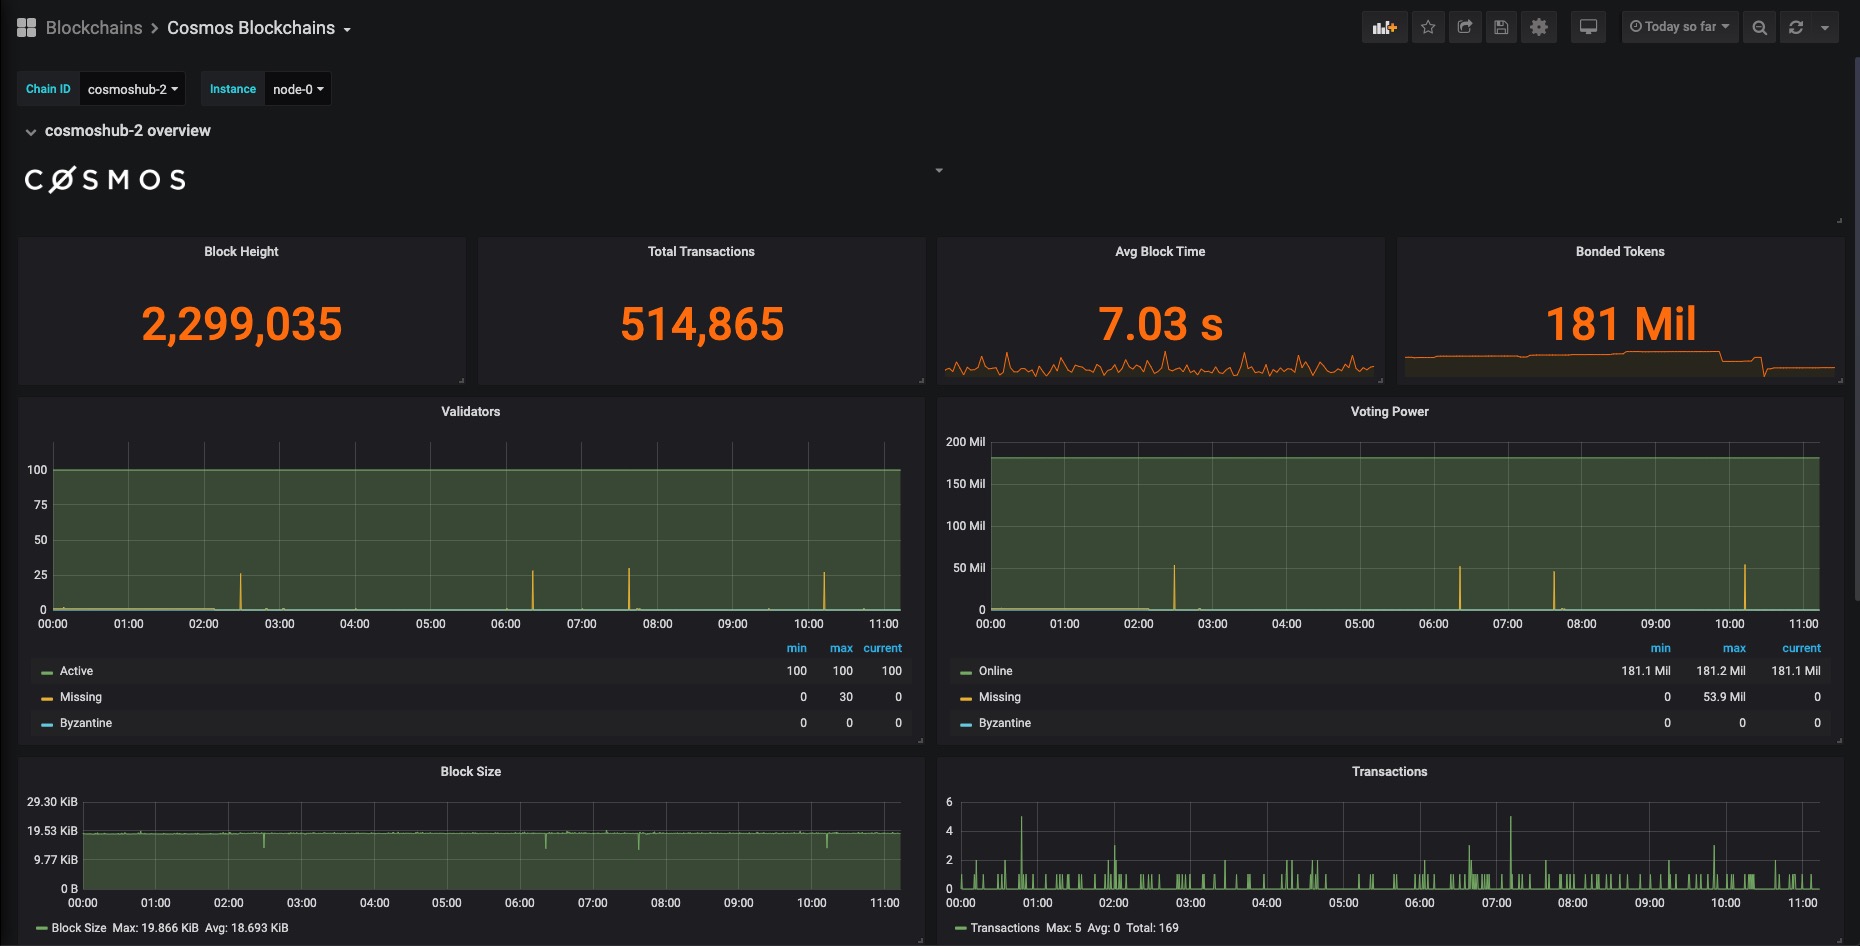
Preview

1 2 3

How To

We assume that you already have Grafana and Prometheus installed.

Enable Tendermint Metrics

sed -i 's/prometheus = false/prometheus = true/g' <YOUR-NODE-HOMEDIR>/config/config.toml

After restarting your node, you should be able to access the tendermint metrics(default port is 26660): http://localhost:26660

Configure Prometheus Targets

Append a job under the scrape_configs of your prometheus.yml

      - job_name: irishub
        static_configs:
        - targets: ['<Validator-IP>:26660']
          labels:
            instance: validator
        - targets: ['<Sentry-0-IP>:26660']
          labels:
            instance: sentry-0
        - targets: ['<Sentry-1-IP>:26660']
          labels:
            instance: sentry-1

Reload prometheus config

curl -X POST http://<PROMETHEUS-IP>:9090/-/reload

Import Grafana Dashboard

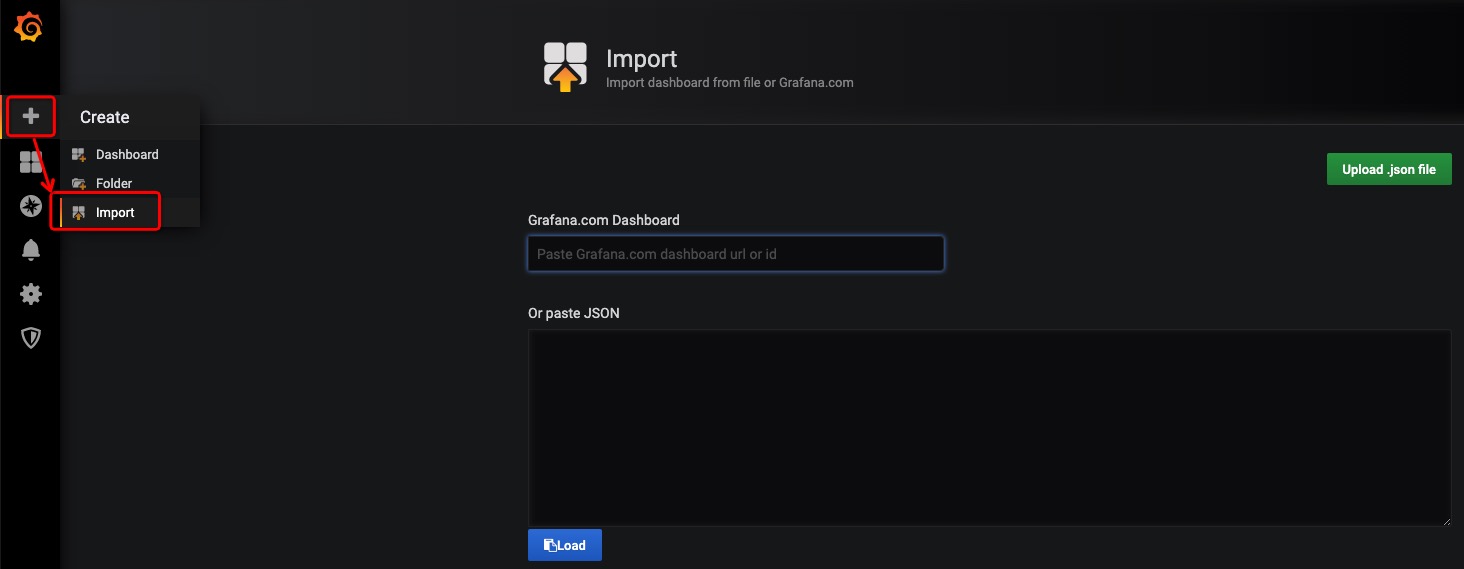
Copy and paste the Grafana Dashboard ID 11036 OR content of cosmos-dashboard.json, click on Load to complete importing.
import

About

A Grafana dashboard compatible with all the cosmos-sdk and tendermint based blockchains.

Resources

License

Stars

Watchers

Forks

Releases

No releases published

Packages

No packages published