Warning
This gem has been deprecated in favor of ruby/tracer
As the name states, ObjectTracer allows you to secretly listen to different events of an object:
Method Calls- what does the object doTraces- how is the object used by the applicationState Mutations- what happens inside the object
After collecting the events, ObjectTracer will output them in a nice, readable format to either stdout or a file.
Ultimately, its goal is to let you know all the information you need for debugging with just 1 line of code.
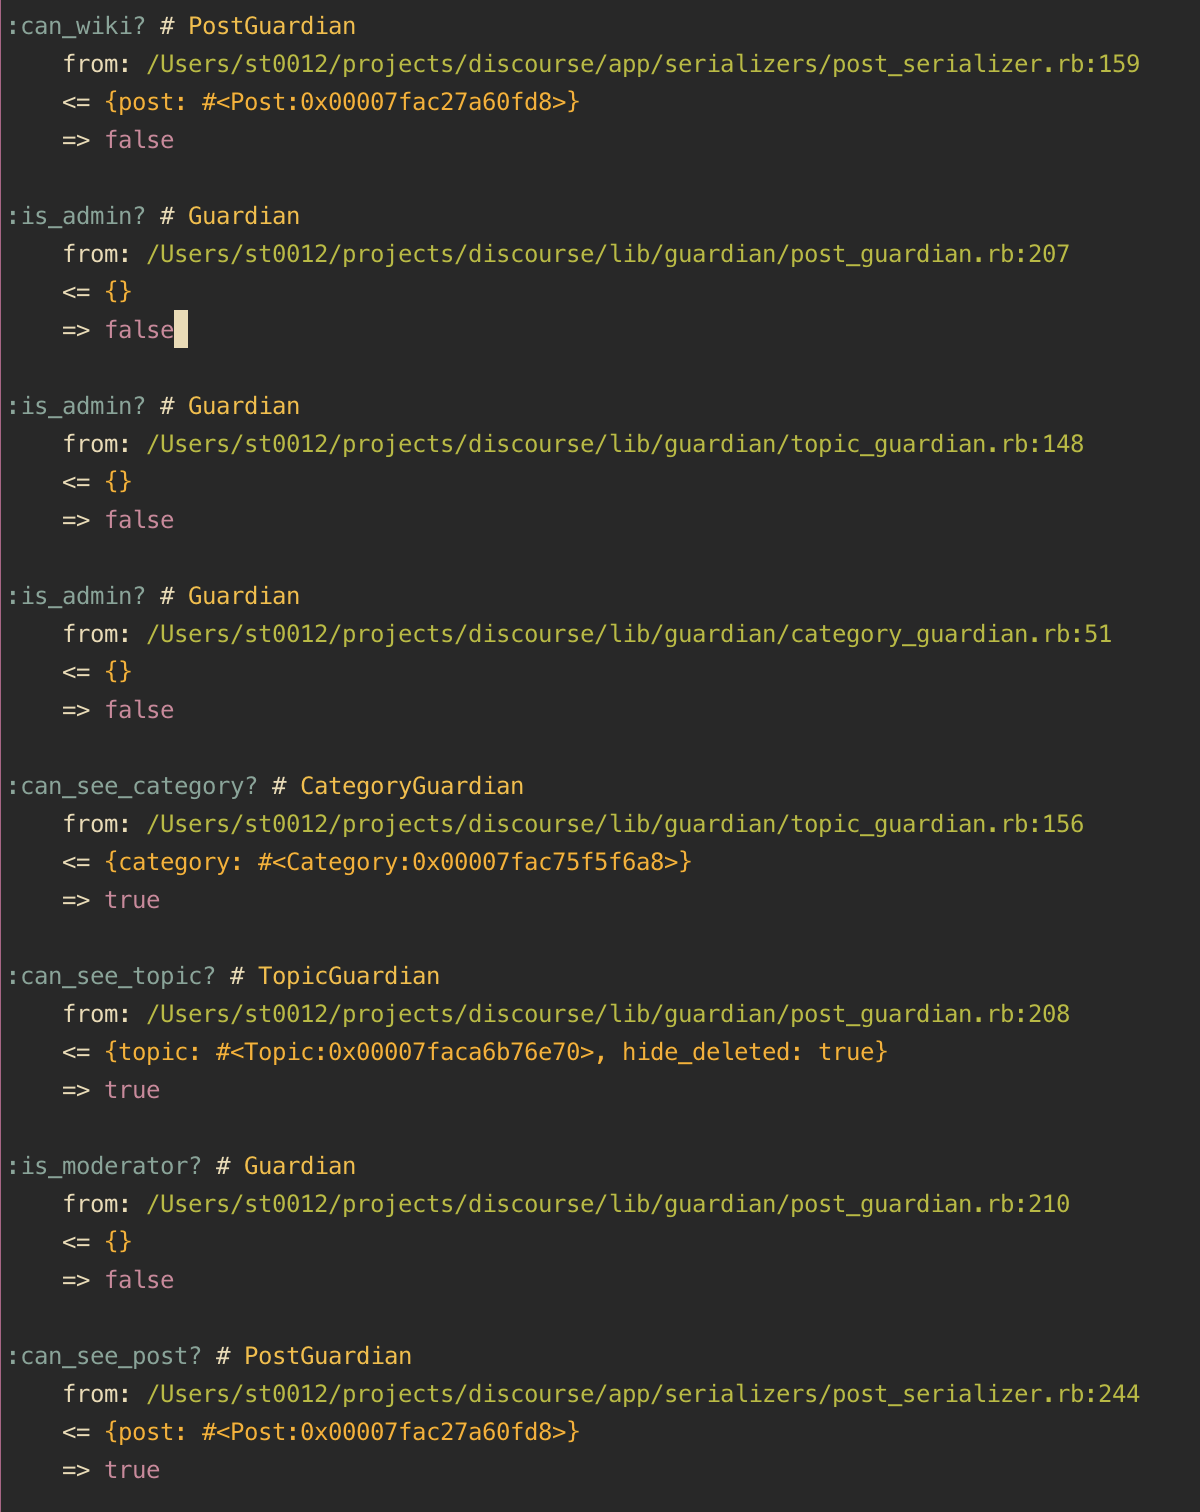
By tracking an object's method calls, you'll be able to observe the object's behavior very easily
Each entry consists of 5 pieces of information:
- method name
- source of the method
- call site
- arguments
- return value
print_calls(object)- prints the result to stdoutwrite_calls(object, log_file: "file_name")- writes the result to a file- the default file is
/tmp/object_tracer.log, but you can change it withlog_file: "new_path"option
- the default file is
- Understand a service object/form object's behavior
- Debug a messy controller
By tracking an object's traces, you'll be able to observe the object's journey in your application
print_traces(object)- prints the result to stdoutwrite_traces(object, log_file: "file_name")- writes the result to a file- the default file is
/tmp/object_tracer.log, but you can change it withlog_file: "new_path"option
- the default file is
- Debug argument related issues
- Understand how a library uses your objects
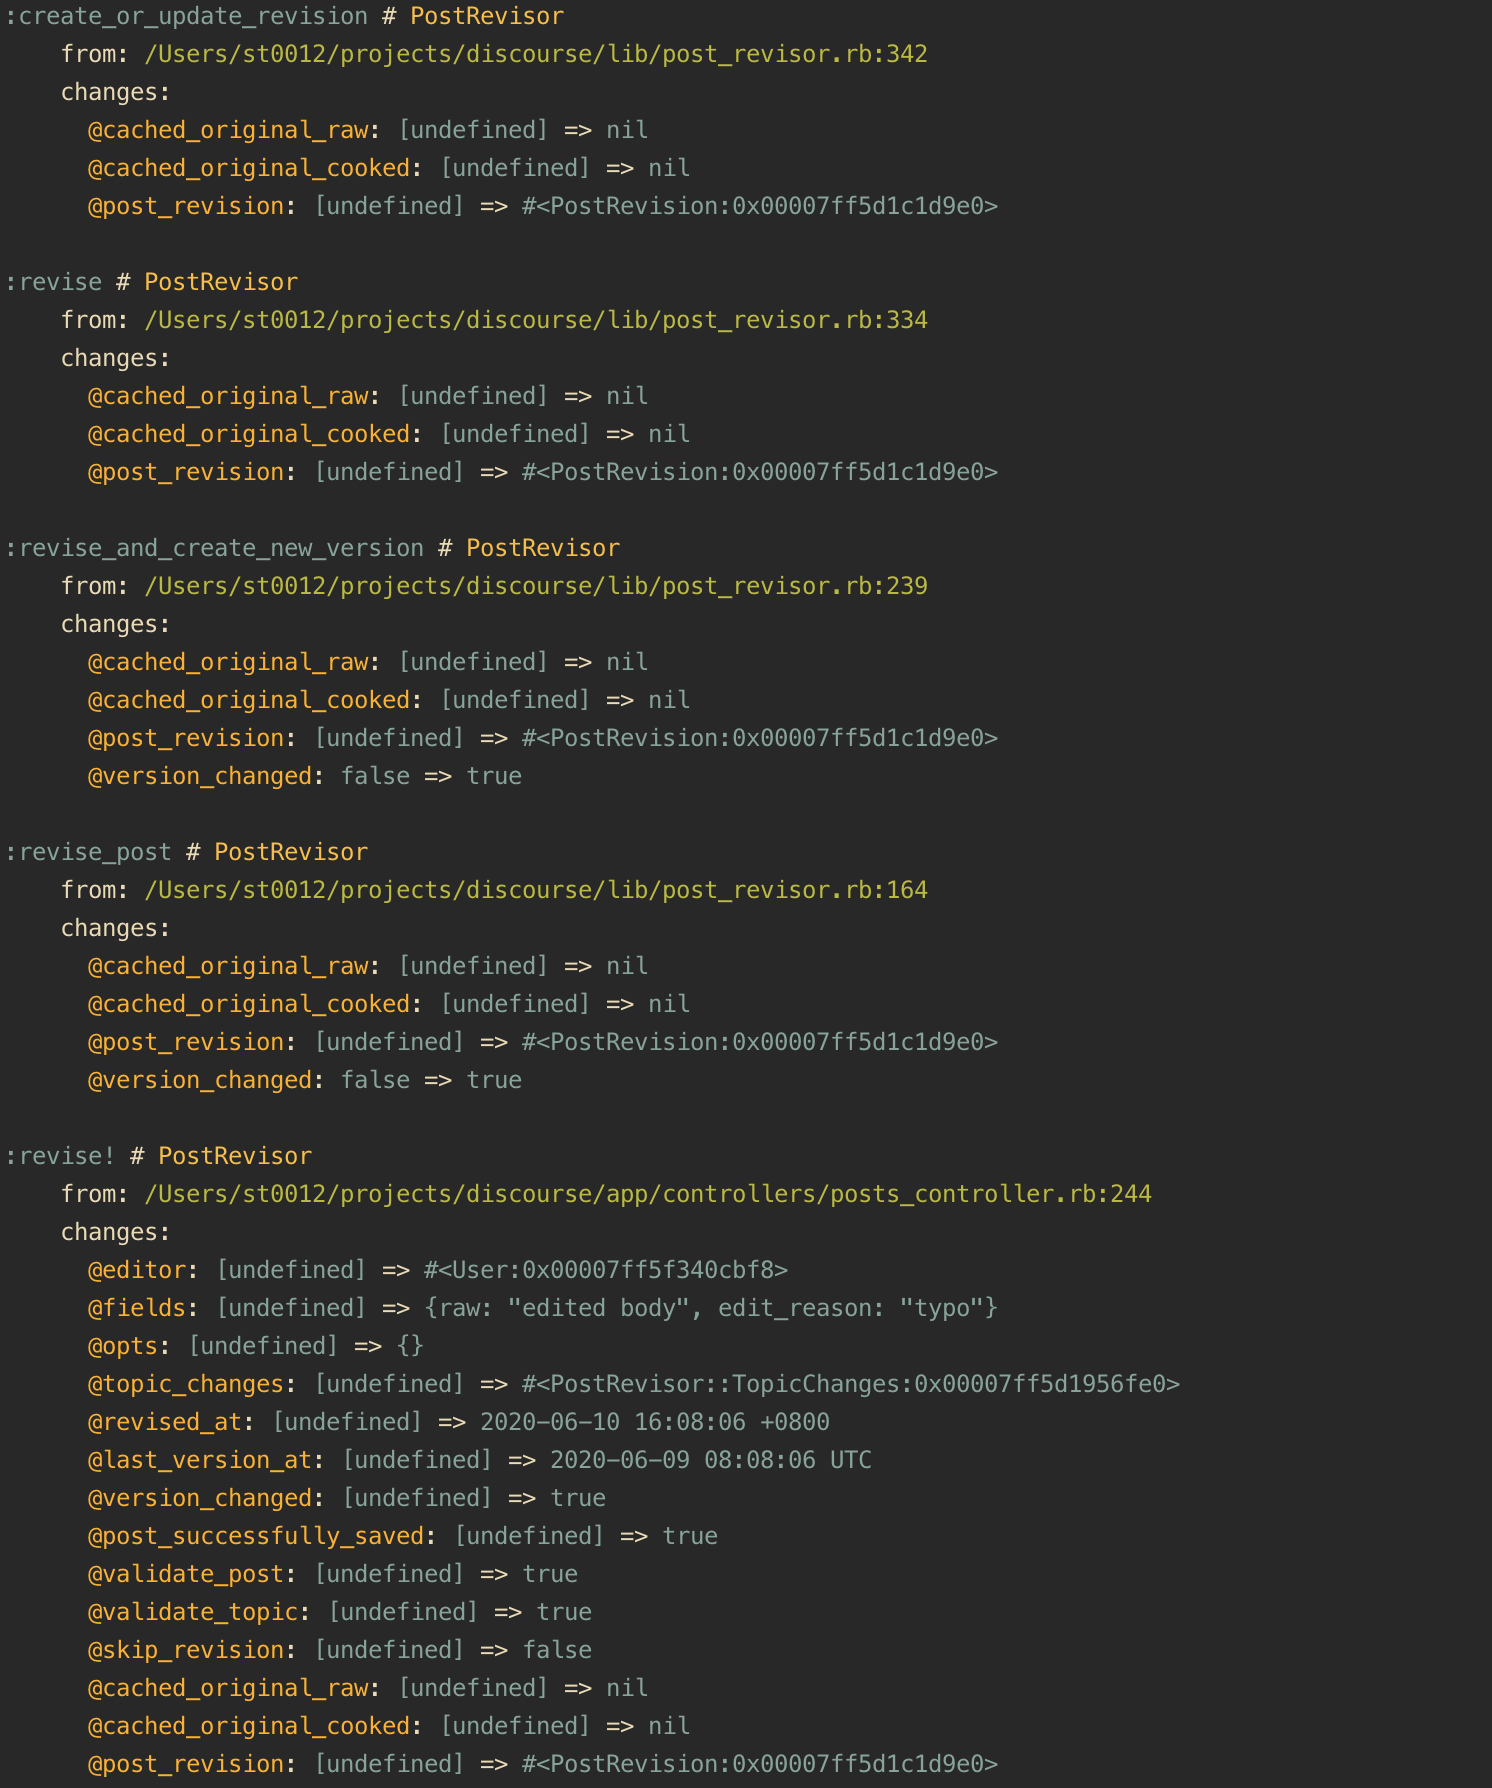
By tracking an object's traces, you'll be able to observe the state changes happen inside the object between each method call
print_mutations(object)- prints the result to stdoutwrite_mutations(object, log_file: "file_name")- writes the result to a file- the default file is
/tmp/object_tracer.log, but you can change it withlog_file: "new_path"option
- the default file is
- Debug state related issues
- Debug memoization issues
It's not always easy to directly access the objects we want to track, especially when they're managed by a library (e.g. ActiveRecord::Relation). In such cases, you can use these helpers to track the class's instances:
print_instance_calls(ObjectKlass)print_instance_traces(ObjectKlass)print_instance_mutations(ObjectKlass)write_instance_calls(ObjectKlass)write_instance_traces(ObjectKlass)write_instance_mutations(ObjectKlass)
In Ruby programs, we often chain multiple methods together like this:
SomeService.new(params).performAnd to debug it, we'll need to break the method chain into
service = SomeService.new(params)
print_calls(service, options)
service.perform
This kind of code changes are usually annoying, and that's one of the problems I want to solve with ObjectTracer.
So here's another option, just insert a with_HELPER_NAME call in between:
SomeService.new(params).with_print_calls(options).performAnd it'll behave exactly like
service = SomeService.new(params)
print_calls(service, options)
service.performAdd this line to your application's Gemfile:
gem 'object_tracer', group: :developmentAnd then execute:
$ bundle
Or install it directly:
$ gem install object_tracer
Depending on the size of your application, ObjectTracer could harm the performance significantly. So make sure you don't put it inside the production group
Sometimes we don't need to know all the calls or traces of an object; we just want some of them. In those cases, we can chain the helpers with .with to filter the calls/traces.
# only prints calls with name matches /foo/
print_calls(object).with do |payload|
  payload.method_name.to_s.match?(/foo/)
endThere are many options you can pass when using a helper method. You can list all available options and their default value with
ObjectTracer::Configurable::DEFAULTS #=> {
  :filter_by_paths=>[],
  :exclude_by_paths=>[],
  :with_trace_to=>50,
  :event_type=>:return,
  :hijack_attr_methods=>false,
  :track_as_records=>false,
  :inspect=>false,
  :colorize=>true,
  :log_file=>"/tmp/object_tracer.log"
}
Here are some commonly used options:
- default:
true
By default print_calls and print_traces colorize their output. If you don't want the colors, you can use colorize: false to disable it.
print_calls(object, colorize: false)- default:
false
As you might have noticed, all the objects are converted into strings with #to_s instead of #inspect. This is because when used on some Rails objects, #inspect can generate a significantly larger string than #to_s. For example:
post.to_s #=> #<Post:0x00007f89a55201d0>
post.inspect #=> #<Post id: 649, user_id: 3, topic_id: 600, post_number: 1, raw: "Hello world", cooked: "<p>Hello world</p>", created_at: "2020-05-24 08:07:29", updated_at: "2020-05-24 08:07:29", reply_to_post_number: nil, reply_count: 0, quote_count: 0, deleted_at: nil, off_topic_count: 0, like_count: 0, incoming_link_count: 0, bookmark_count: 0, score: nil, reads: 0, post_type: 1, sort_order: 1, last_editor_id: 3, hidden: false, hidden_reason_id: nil, notify_moderators_count: 0, spam_count: 0, illegal_count: 0, inappropriate_count: 0, last_version_at: "2020-05-24 08:07:29", user_deleted: false, reply_to_user_id: nil, percent_rank: 1.0, notify_user_count: 0, like_score: 0, deleted_by_id: nil, edit_reason: nil, word_count: 2, version: 1, cook_method: 1, wiki: false, baked_at: "2020-05-24 08:07:29", baked_version: 2, hidden_at: nil, self_edits: 0, reply_quoted: false, via_email: false, raw_email: nil, public_version: 1, action_code: nil, image_url: nil, locked_by_id: nil, image_upload_id: nil>- default:
false- except for
tap_mutation!andprint_mutations
- except for
Because TracePoint doesn't track methods generated by attr_* helpers (see this issue for more info), we need to redefine those methods with the normal method definition.
For example, it generates
def name=(val)
  @name = val
end
for
attr_writer :nameThis hack will only be applied to the target instance with instance_eval. So other instances of the class remain untouched.
The default is false because
- Checking what methods are generated by
attr_*helpers isn't free. It's anO(n)operation, wherenis the number of methods the target object has. - It's still unclear if this hack safe enough for most applications.
Sometimes we use many private methods to perform trivial operations, like
class Operation
  def extras
    dig_attribute("extras")
  end

  private

  def data
    @data
  end

  def dig_attribute(attr)
    data.dig("attributes", attr)
  end
end
And we may not be interested in those method calls. If that's the case, you can use the ignore_private option
operation = Operation.new(params)
print_calls(operation, ignore_private: true) #=> only prints the `extras` callThis option does the opposite of the ignore_private option does.
If you don't want to pass options every time you use a helper, you can use global configuration to change the default values:
ObjectTracer.config[:colorize] = false
ObjectTracer.config[:hijack_attr_methods] = true
And if you're using Rails, you can put the configs under config/initializers/object_tracer.rb like this:
if defined?(ObjectTracer)
  ObjectTracer.config[:colorize] = false
  ObjectTracer.config[:hijack_attr_methods] = true
endprint_calls and print_traces aren't the only helpers you can get from ObjectTracer. They are actually built on top of other helpers, which you can use as well. To know more about them, please check this page
- Optimize Your Debugging Process With Object-Oriented Tracing and object_tracer
- Debug Rails issues effectively with object_tracer
- Want to know more about your Rails app? Tap on your objects!
After checking out the repo, run bin/setup to install dependencies. Then, run rake spec to run the tests. You can also run bin/console for an interactive prompt that will allow you to experiment.
To install this gem onto your local machine, run bundle exec rake install. To release a new version, update the version number in version.rb, and then run bundle exec rake release, which will create a git tag for the version, push git commits and tags, and push the .gem file to rubygems.org.
Bug reports and pull requests are welcome on GitHub at https://github.com/st0012/object_tracer. This project is intended to be a safe, welcoming space for collaboration, and contributors are expected to adhere to the Contributor Covenant code of conduct.
The gem is available as open-source under the terms of the MIT License.
Everyone interacting in the ObjectTracer project's codebases, issue trackers, chat rooms, and mailing lists is expected to follow the code of conduct.


