[MRG+1] Matplotlib v2update #8514
Conversation
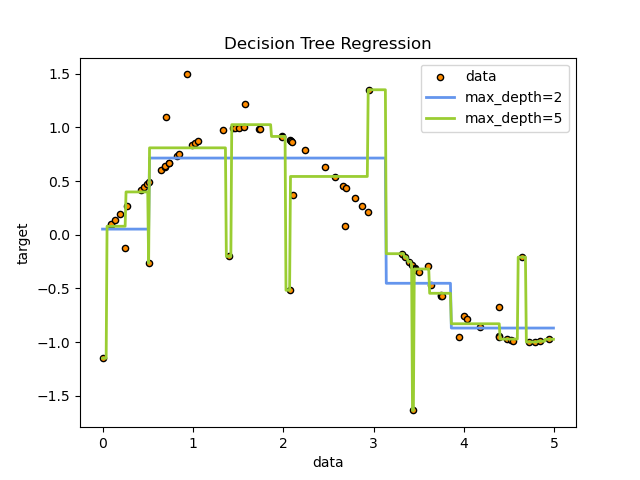
| plt.plot(X_test, y_1, color="cornflowerblue", label="max_depth=2", linewidth=2) | ||
| plt.plot(X_test, y_2, color="yellowgreen", label="max_depth=5", linewidth=2) | ||
| plt.scatter(X, y, c="darkorange", edgecolor='k', label="data") | ||
| plt.plot(X_test, y_1, color="cornflowerblue", edgecolor='k', |
There was a problem hiding this comment.
Does plt.plot have an argument edgecolor?
| plt.scatter(X, y, c="darkorange", edgecolor='k', label="data") | ||
| plt.plot(X_test, y_1, color="cornflowerblue", edgecolor='k', | ||
| label="max_depth=2", linewidth=2) | ||
| plt.plot(X_test, y_2, color="yellowgreen", edgecolor='k', |
|
Thanks for the contributions! Please see my comment |
Codecov Report
@@           Coverage Diff           @@
##           master    #8514   +/-   ##
=======================================
  Coverage   95.48%   95.48%
=======================================
  Files         342      342
  Lines       60913    60913
=======================================
  Hits        58160    58160
  Misses       2753     2753
Continue to review full report at Codecov.
|
Codecov Report
@@            Coverage Diff             @@
##           master    #8514      +/-   ##
==========================================
+ Coverage   95.48%   95.48%   +<.01%
==========================================
  Files         342      342
  Lines       60913    61013     +100
==========================================
+ Hits        58160    58259      +99
- Misses       2753     2754       +1
Continue to review full report at Codecov.
|
|
You can post a link to the generated HTML by linking to the output of circle. I keep forgetting how to easily get the link though :-/ |
|
|
|
@katelie indeed, and so that the reviewers can check it without building the documentation themselves. |
|
Thanks for the links @katelie. I'm not seeing too much of a difference in the first two figures, and just darker grid lines in the last example. Is that intentional? |
|
Hm I'm not we need the edges in these ones, they look fine to me without them. Sorry if the explanation of the issue was unclear @katelie |
|
@katelie it just needs to look decent. Many of the examples were completely meaningless because the points were the same color as the background. So we mostly want the example to show the same point and look decent. It doesn't need to look the same way. |
|
This PR is functional and adds in a minor improvement in the grid lines even if the other figures seem mostly unchanged. @amueller should we merge or close this? |
|
I am +0 for merge. |
😕 are you comparing against the dev doc? master: this PR: Without edgecolor it is rather hard to see the light grey points. Personally I prefer having edgecolors for scatter plots with overlapping data points so I am +1 on this. |

|
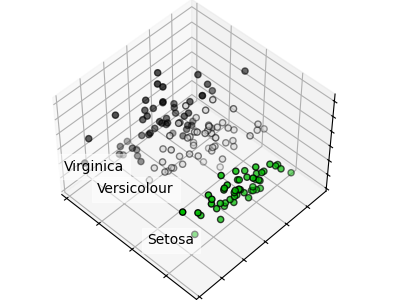
I think there is a major difference there. If I google the example, I see the following: stable (http://scikit-learn.org/stable/auto_examples/decomposition/plot_pca_iris.html): new: |


|
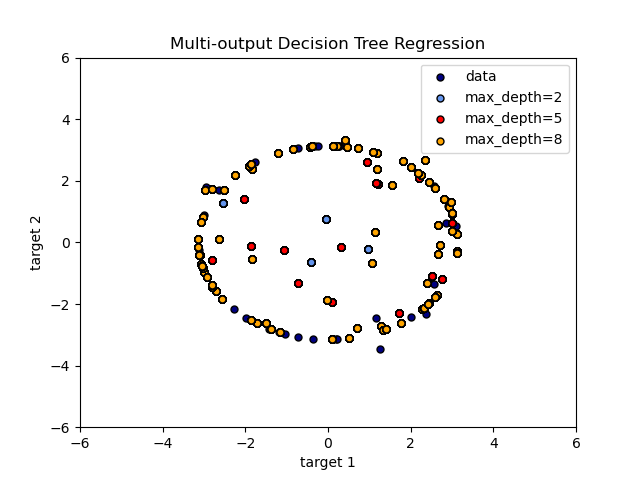
I don't think the change helps for the decision trees example nor the multi-output decision tree output. |
|
@jmschrei you should compare the PR rendering against the dev doc not the stable one. The stable doc does not use matplotlib 2. In the case you mention you should be looking at http://scikit-learn.org/dev/auto_examples/decomposition/plot_pca_iris.html. |
|
@NelleV maybe it is a matter of habit but as I said above, scatter plots with overlapping data points without edgecolor looks a bit weird (maybe smudgy if I had to pick another word) to me. I just put the other images here for easier comparison. plot_tree_regression_multioutputdev doc: this PR: plot_tree_regressiondev doc: this PR: |


I don't think we should spent too much time on this though and I am more than fine merging only the change to plot-pca-iris. |
|
OK let's not let this one die. I just left the changes for plot_pca_iris and I am going to merge this one. |
|
Thanks @katelie ! |
for better rendering with matplotlib 2
for better rendering with matplotlib 2
for better rendering with matplotlib 2
for better rendering with matplotlib 2
for better rendering with matplotlib 2
for better rendering with matplotlib 2
for better rendering with matplotlib 2
Reference Issue
Fixing plot appearance for matplotlib v2 compatibility in #8364
What does this implement/fix? Explain your changes.
Added 'edgecolor' option to scatterplots to make dots easier to see
Any other comments?