[MRG] Accelerate example plot_kernel_ridge_regression.py #21794
Conversation
|
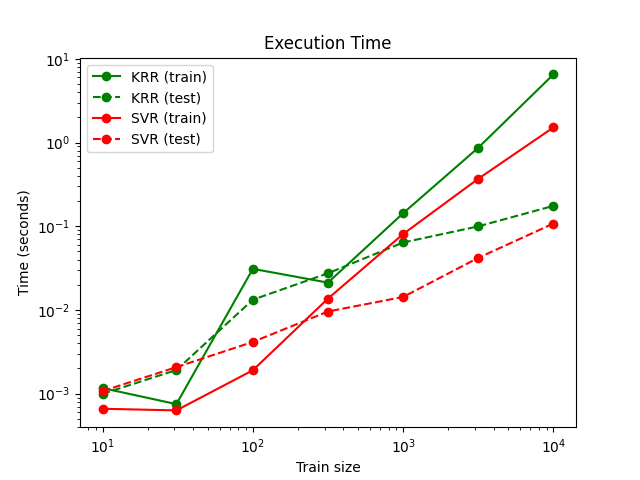
The text of the analysis of the prediction time is wrong. Currently it reads:
But both on the
and reduce the prediction set to 10k samples instead (large enough to measure a timing that is not too noisy but small enough to make this example run significantly faster). |
15f3d96 to
e863ce1
Compare
|
Thank you for your comments. If we reduce the prediction set to 10k samples we now have this outputs: 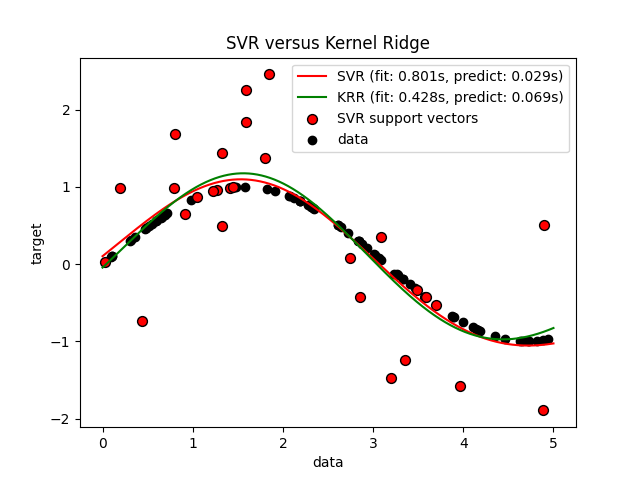
|
|
|
||
| # Generate sample data | ||
| X = 5 * rng.rand(10000, 1) | ||
| X = 5 * rng.rand(7000, 1) |
There was a problem hiding this comment.
The final point on the graph is 10**4 because of:
sizes = np.logspace(1, 4, 7).astype(int)below. If we want the final point to end with 10**4, then I think we need to keep this at 10000.
|
|
Reference Issues/PRs
References #21598
What does this implement/fix? Explain your changes.
Speed up
../examples/miscellaneous/plot_kernel_ridge_regression.pyby reducing the number of samples from 10000 to 7000 forX, and 100000 to 70000 forX_plot.Output before the changes:
And after:
Any other comments?
/