
This is an e-commerce project still in development, where users can add books to a cart and buy those books.
Applications are being developed using Java, Spring and React.
This application is made distributed using Spring Cloud Microservices and Spring Boot Framework extensively.

All the Microservices are developed using Spring Boot. These Spring Boot applications will be registered with eureka discovery server.
The Frontend React App makes requests to the NGINX server, which acts as a reverse proxy. NGINX server redirects the requests to Zuul API Gateway.
Zuul will route the requests to microservices based on the URL route. Zuul registers with Eureka and gets the IP/domain from Eureka for microservices when routing the request.
Frontend App
Navigate to bookstore-frontend-react-app folder
Run below commnads to start Frontend React Application
yarn install
yarn start
Backend Services
To Start Backend Services, follow the below steps:
Using Intellij/Eclipse or Command Line
Import this project into IDE and run all Spring boot projects or
build all the jars running mvn clean install command in root parent pom, which builds all jars.
All services will be up in the below-mentioned ports.
But running this way we wont get monitoring of microservices. So if monitoring needed to see metrics like jvm memory, tomcat error count and other metrics.
Use below method to deploy all the services and monitoring setup in docker.
Using Docker(Recommended)
Start Docker Engine in your machine.
Run mvn clean install at root of project to build all the microservices jars.
Run docker-compose up --build to start all the containers.
Use the Postman Api collection in the Postman directory. To make request to various services.
Services will be exposed in this ports
Api Gateway Service       : 8765
Eureka Discovery Service  : 8761
Consul Discovery          : 8500
Account Service           : 4001
Billing Service           : 5001
Catalog Service           : 6001
Order Service             : 7001
Payment Service           : 8001
This project uses Eureka or Consul as a discovery service. While running services locally, Eureka is used as a service discovery. While running using Docker, Consul is used as the service discovery.
The reason for using Consul is that it has better features and support than Eureka. Running services individually locally uses Eureka as a service discovery because running a Consul agent and setting it up becomes an extra overhead to manage. Since Docker compose manages all Consul stuff, Consul is used while running services in Docker.
If you encounter any issues while starting up the services or if any APIs are failing, it may be because of new columns or new tables in the database. At this point in time, I am not worried about database migrations.
So for any issue, clear/drop bookstore_db, things may start working again, if not raise an Issue in Github i will help.
AWS will be the cloud provider used to deploy this project. The project will be deployed in multiple regions and multiple availability zones. The React App, Zuul, and Eureka will be the public-facing services, which will be in the public subnet.
All the microservices will be packaged into Docker containers and deployed in AWS Elastic Container Service (ECS) in the private subnet. Private subnets use a NAT gateway to make requests to the external internet. Bastian host can be used to ssh into private subnet microservices.
Below is the AWS architecture diagram for better understanding:

There are 2 setups for monitoring:
- Prometheus and Graphana.
- TICK stack monitoring.
Both setups are very powerful. Prometheus works on a pull model, meaning that it pulls metrics from target hosts. If we specify target hosts using individual hostnames or IP addresses, this is not feasible in the long run because it would be like hardcoding hostnames or IP addresses. Instead, we use Consul discovery to provide target hosts dynamically. This way, when more instances of the same service are added, we don't need to worry about adding them to Prometheus's list of target hosts. Consul will dynamically add these targets to Prometheus.
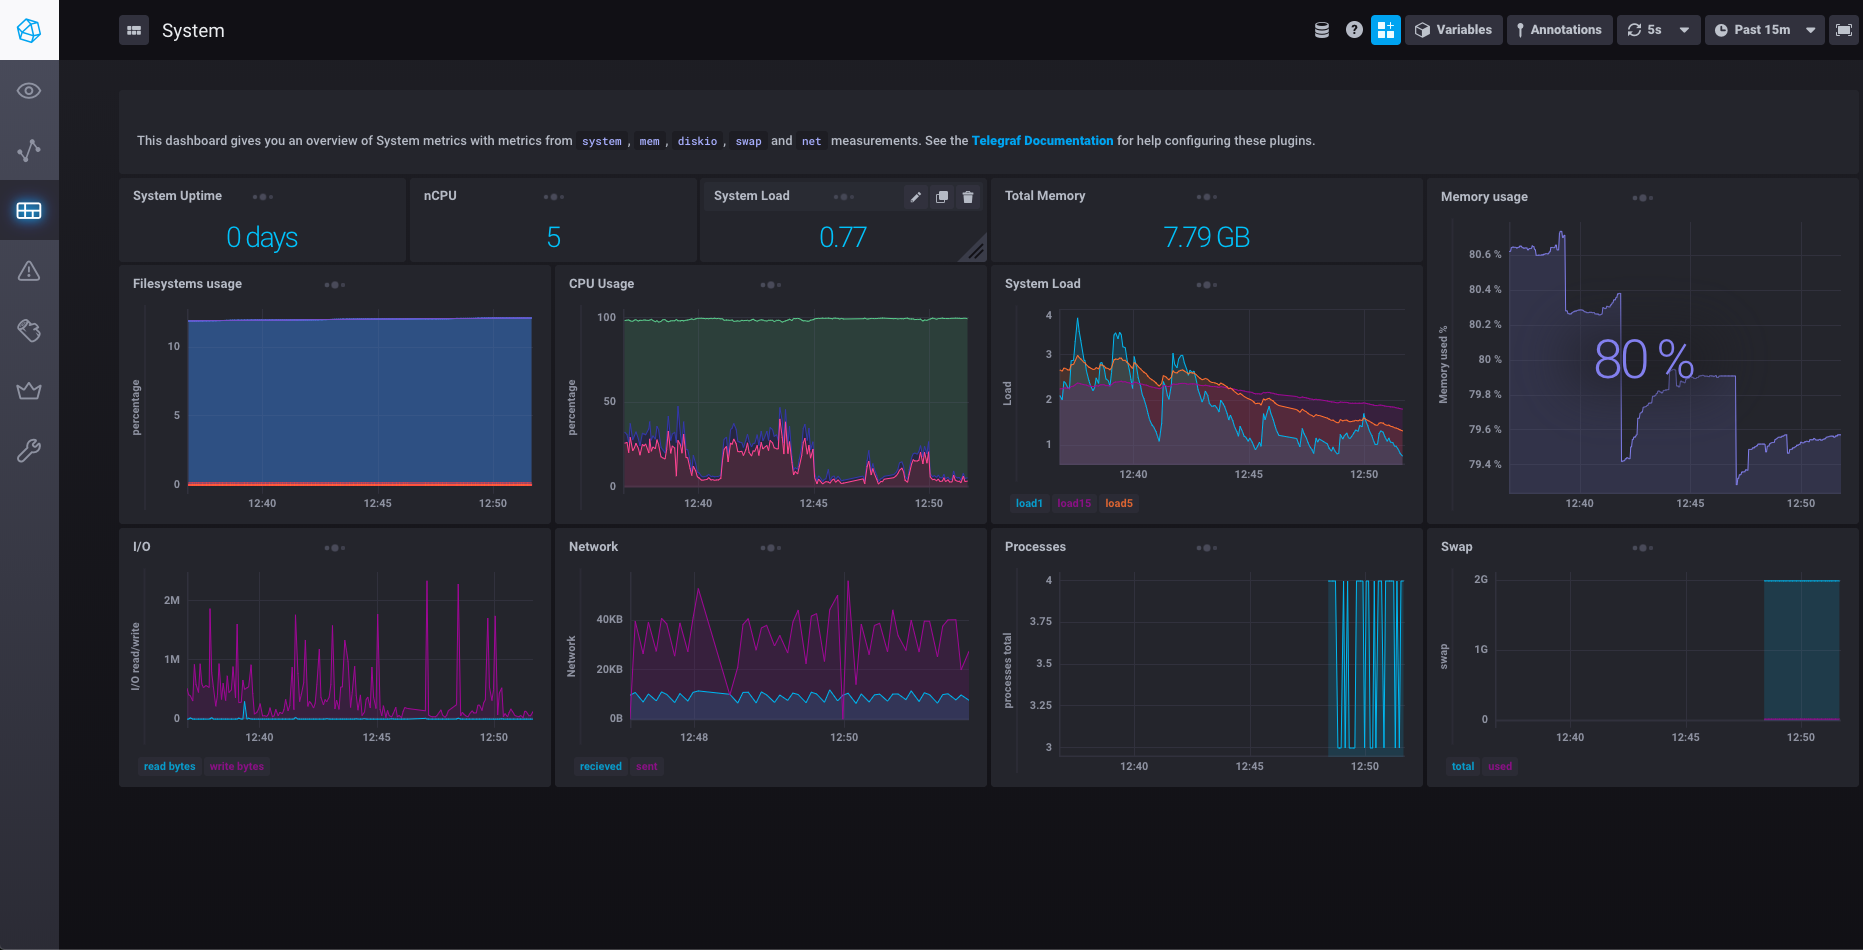
TICK (Telegraf, InfluxDB, Chronograf, Kapacitor) is a setup that is gaining more attention because it uses both a push and pull model. InfluxDB is a time series database. Bookstore services push metrics to InfluxDB (push model). In Telegraf, we specify the targets from which we want to pull metrics (pull model). Chronograf/Grafana can be used to view graphs and charts. Kapacitor is used to configure rules for alarms.
docker-compose will take care of bringing all this monitoring containers up.
Dashboards are available at below ports:
Graphana   : 3030
Zipkin     : 9411
Prometheus : 9090
Telegraf   : 8125
InfluxDb   : 8086
Chronograf : 8888
Kapacitor  : 9092
First time login to Graphana use below credentials

Username : admin
Password : admin
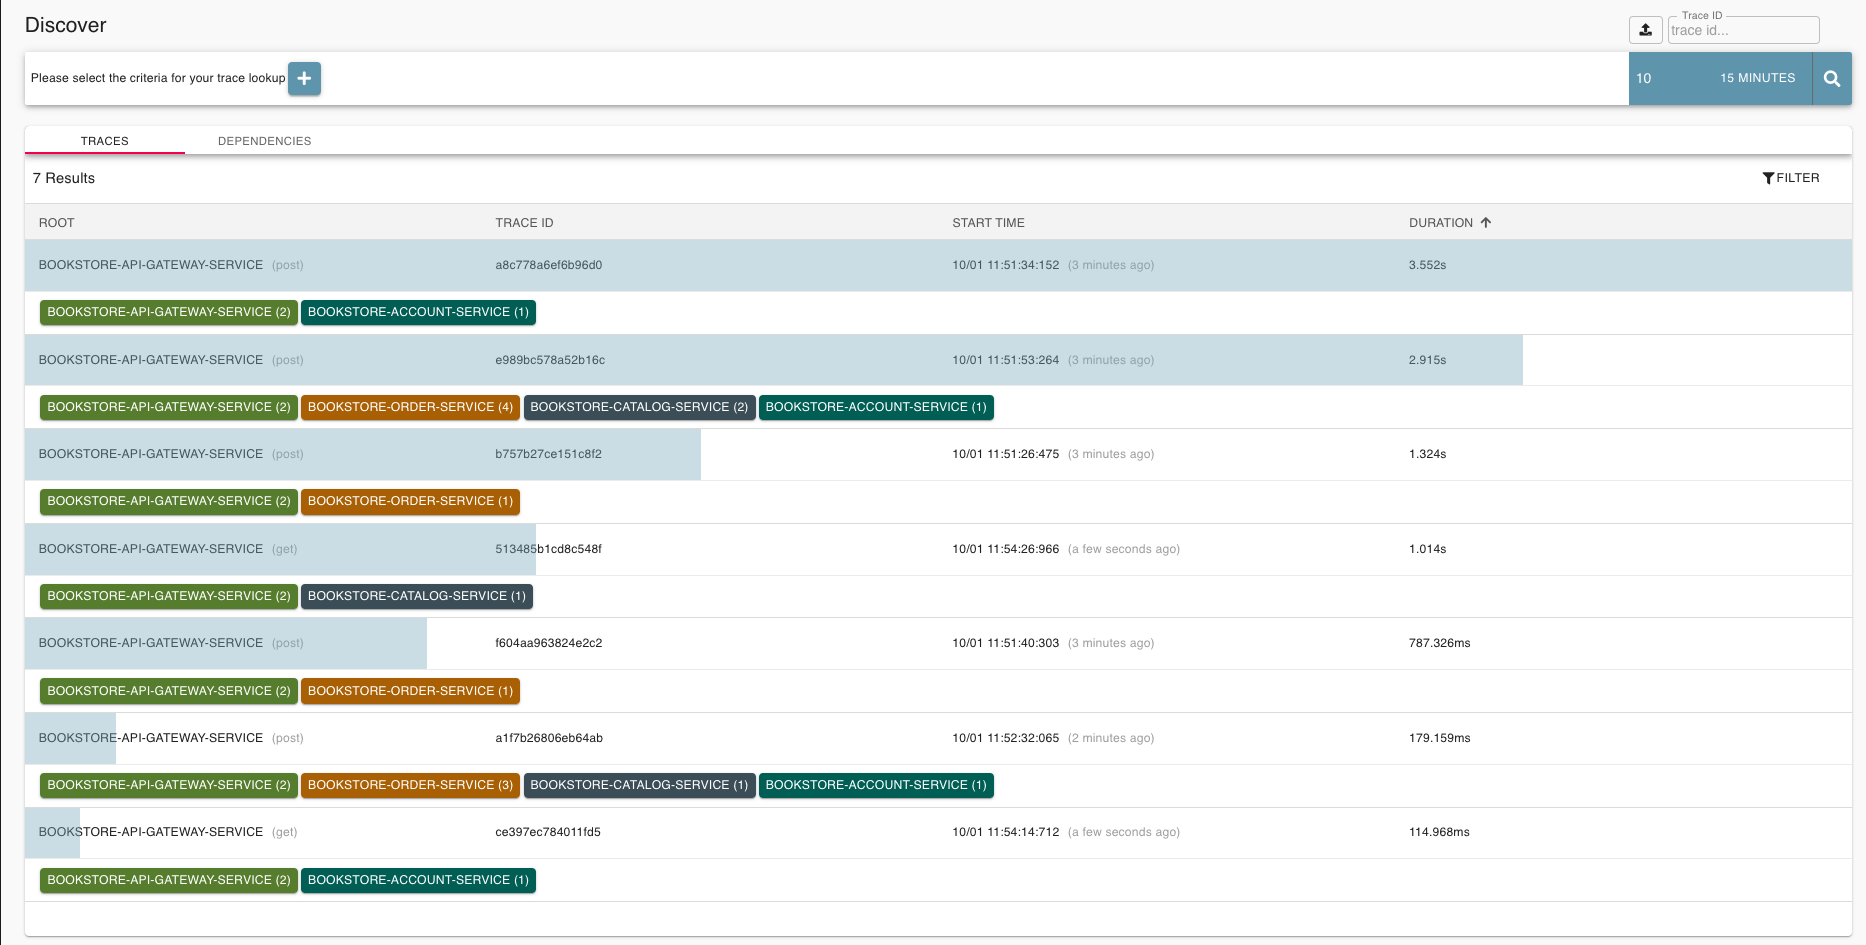
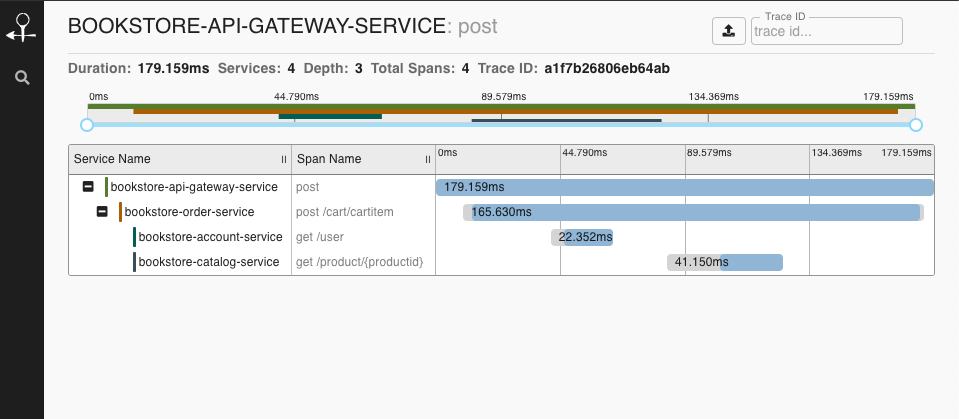
Screenshots of Tracing in Zipkin.
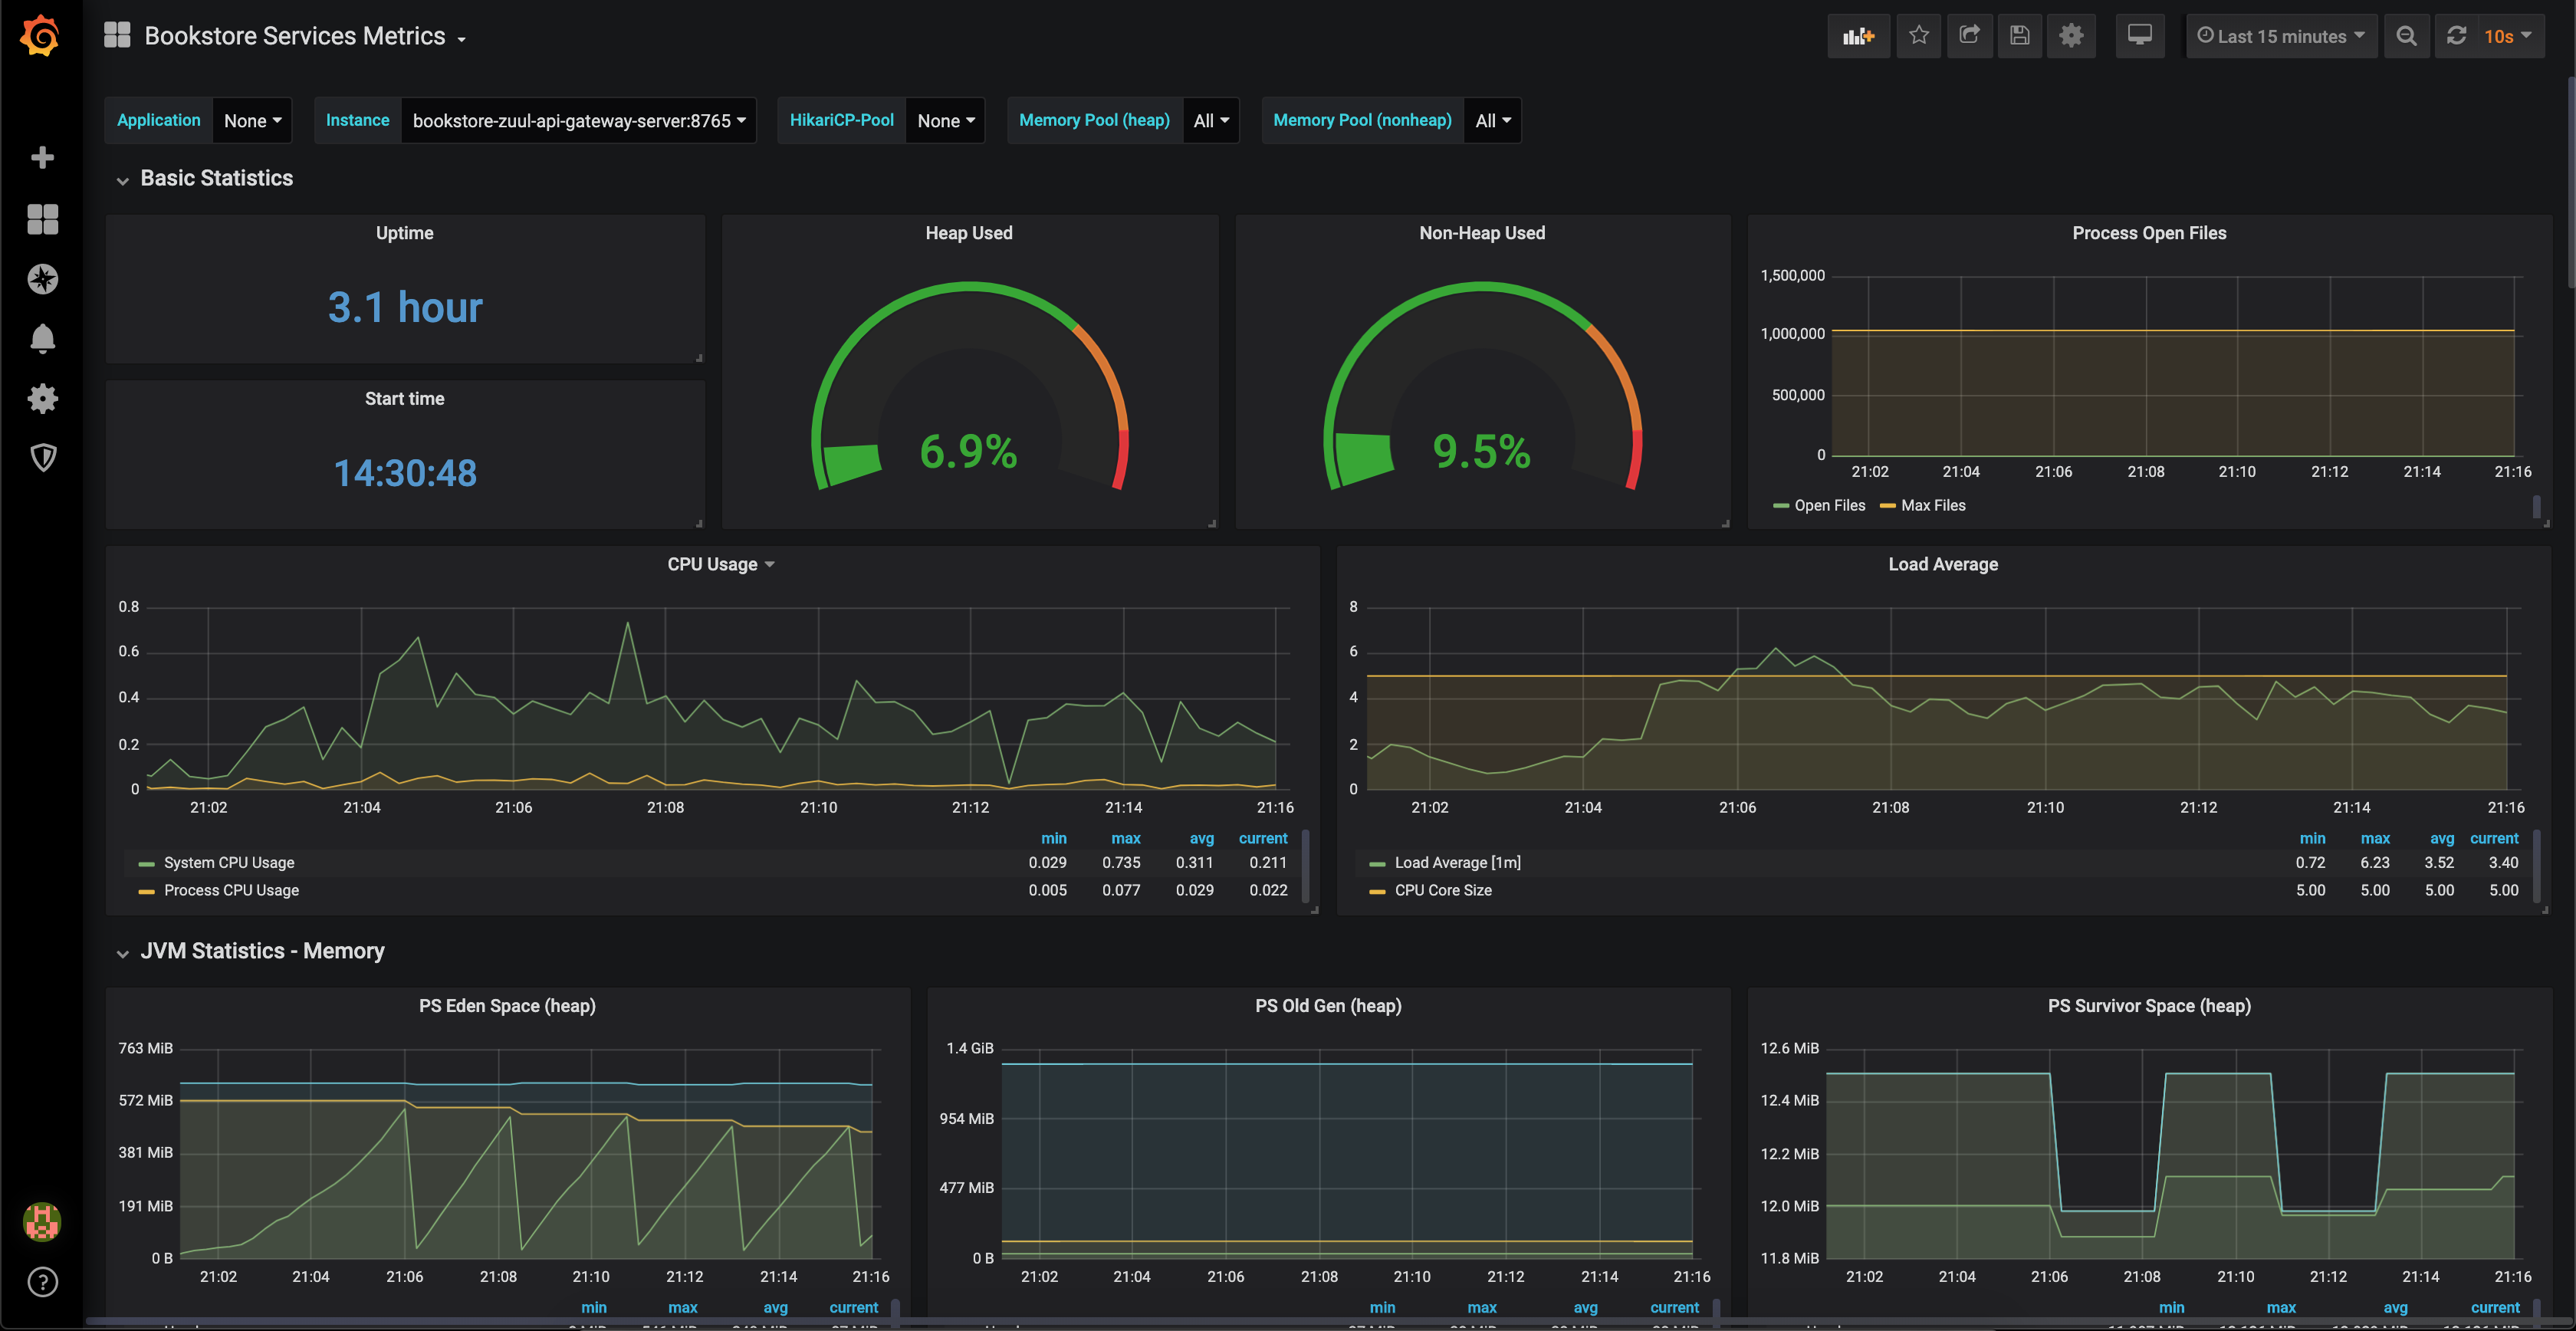
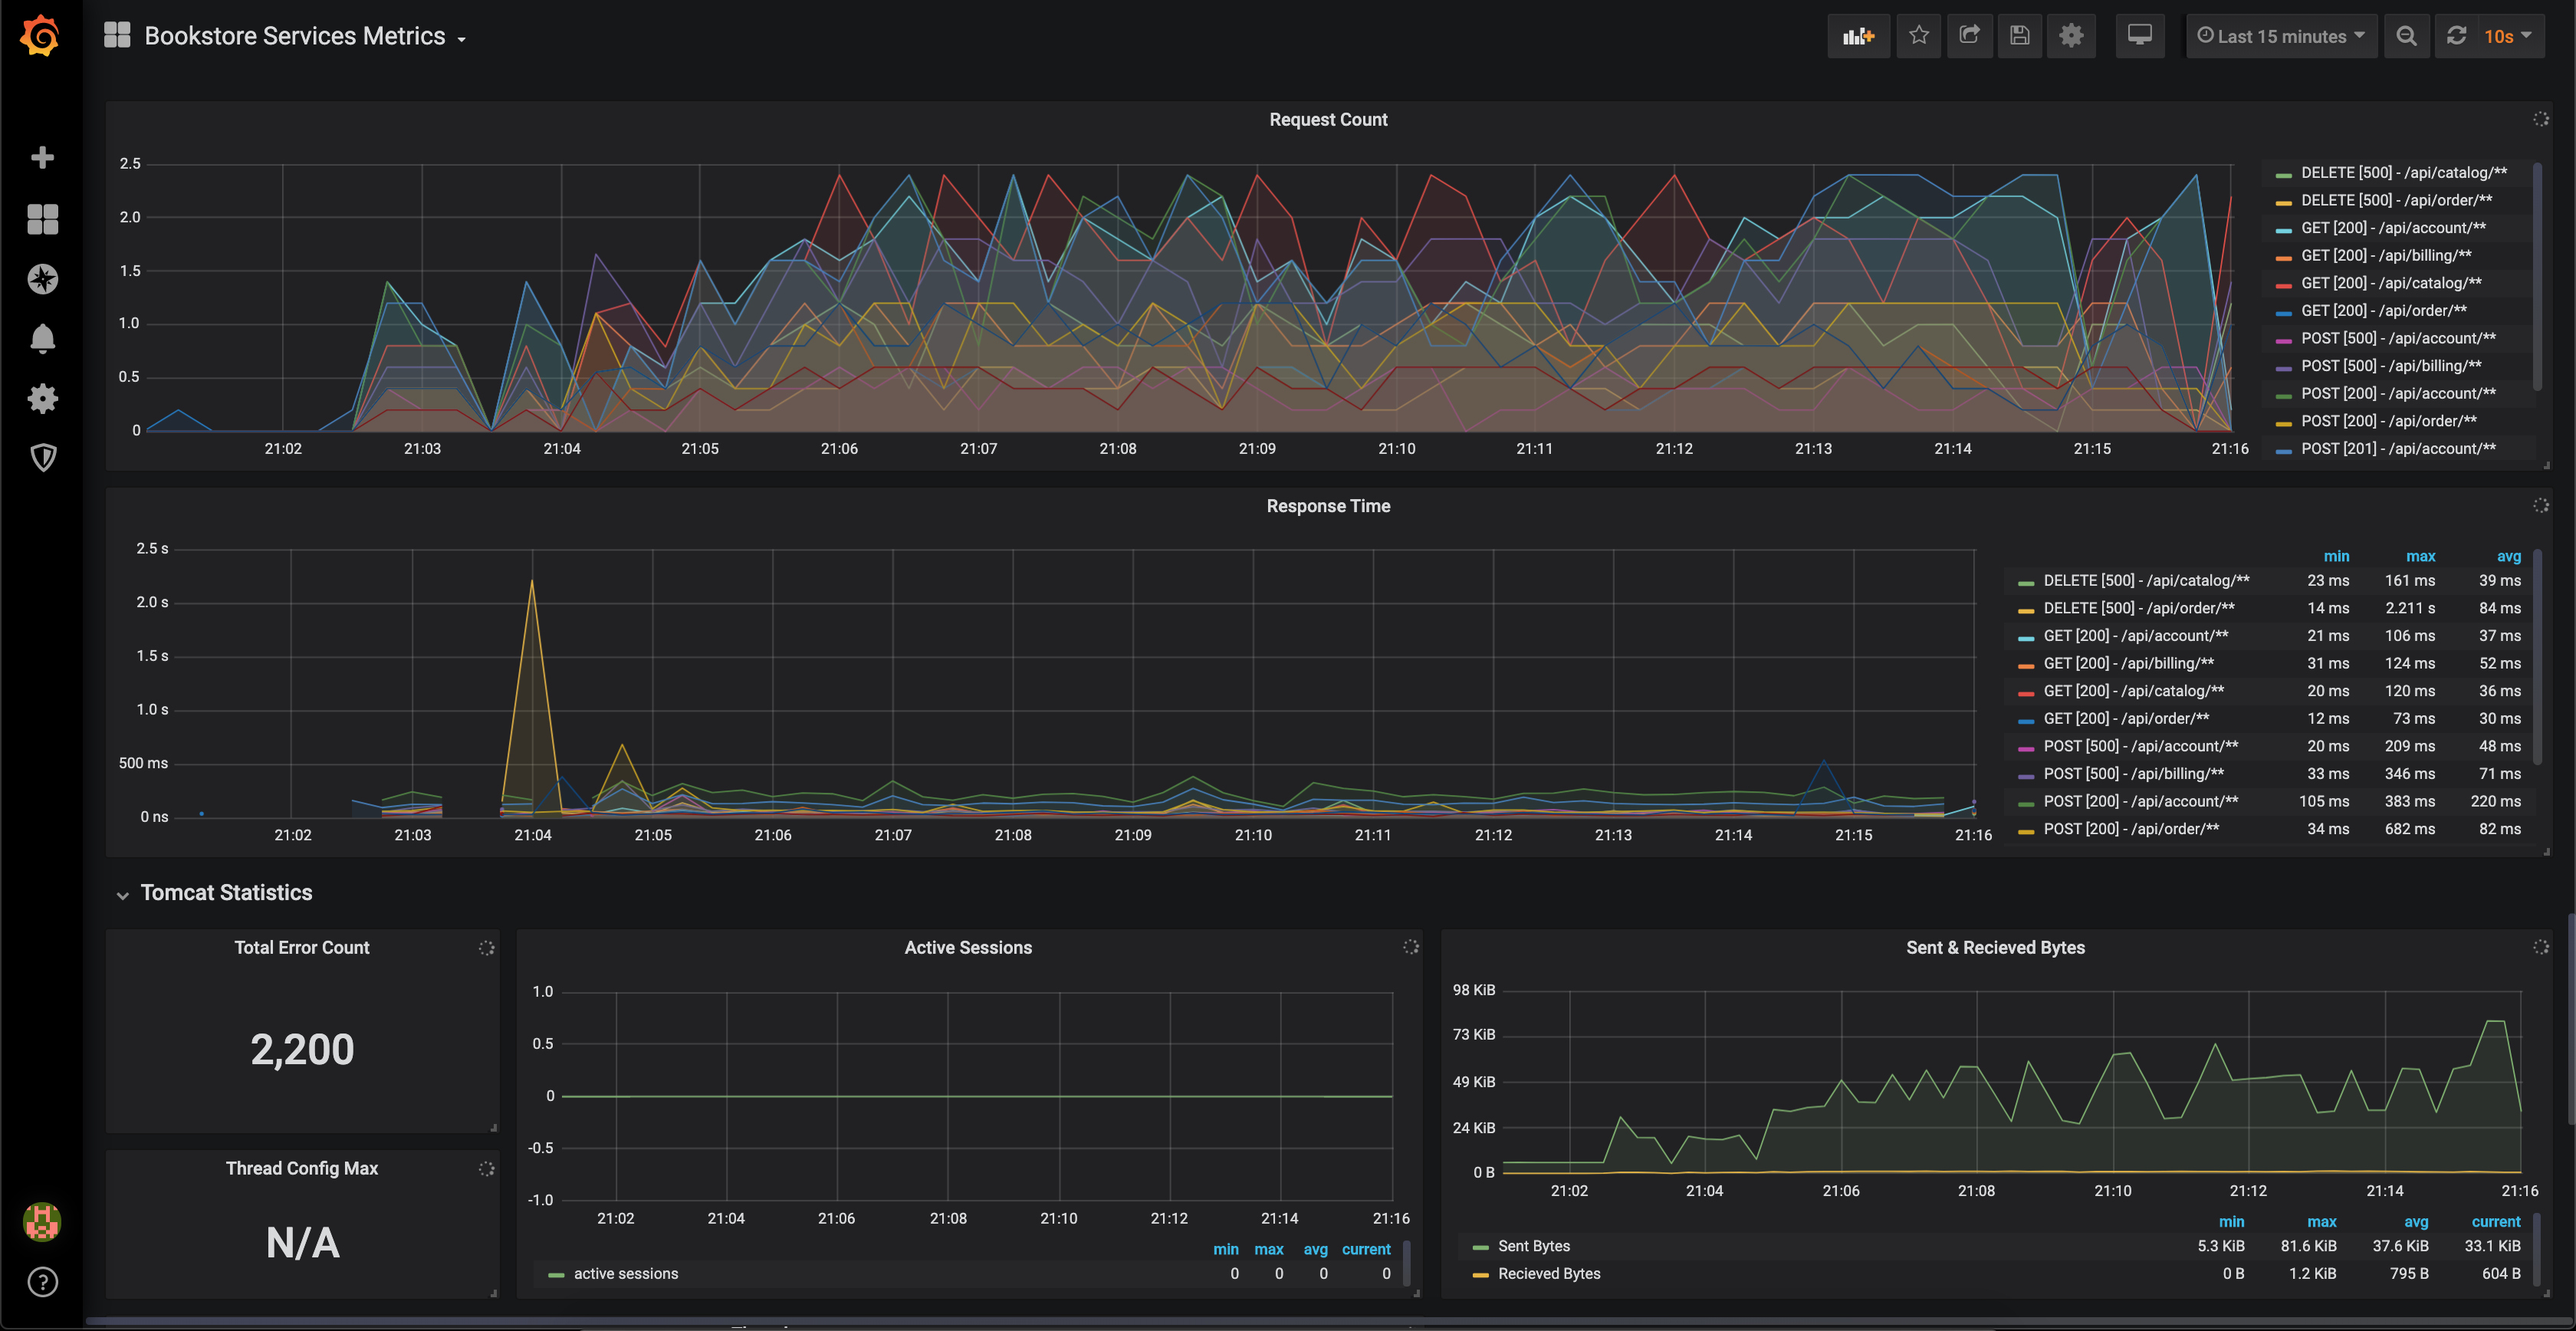
Screenshots of Monitoring in Graphana.
Screenshots of Monitoring in Chronograf(TICK).


Account Service
To Get access_token for the user, you need clientId and clientSecret
clientId : '93ed453e-b7ac-4192-a6d4-c45fae0d99ac'
clientSecret : 'client.devd123'
There are 2 users in the system currently. ADMIN, NORMAL USER
Admin
userName: 'admin.admin'
password: 'admin.devd123'
Normal User
userName: 'devd.cores'
password: 'cores.devd123'
To get the accessToken (Admin User)
curl 93ed453e-b7ac-4192-a6d4-c45fae0d99ac:client.devd123@localhost:4001/oauth/token -d grant_type=password -d username=admin.admin -d password=admin.devd123