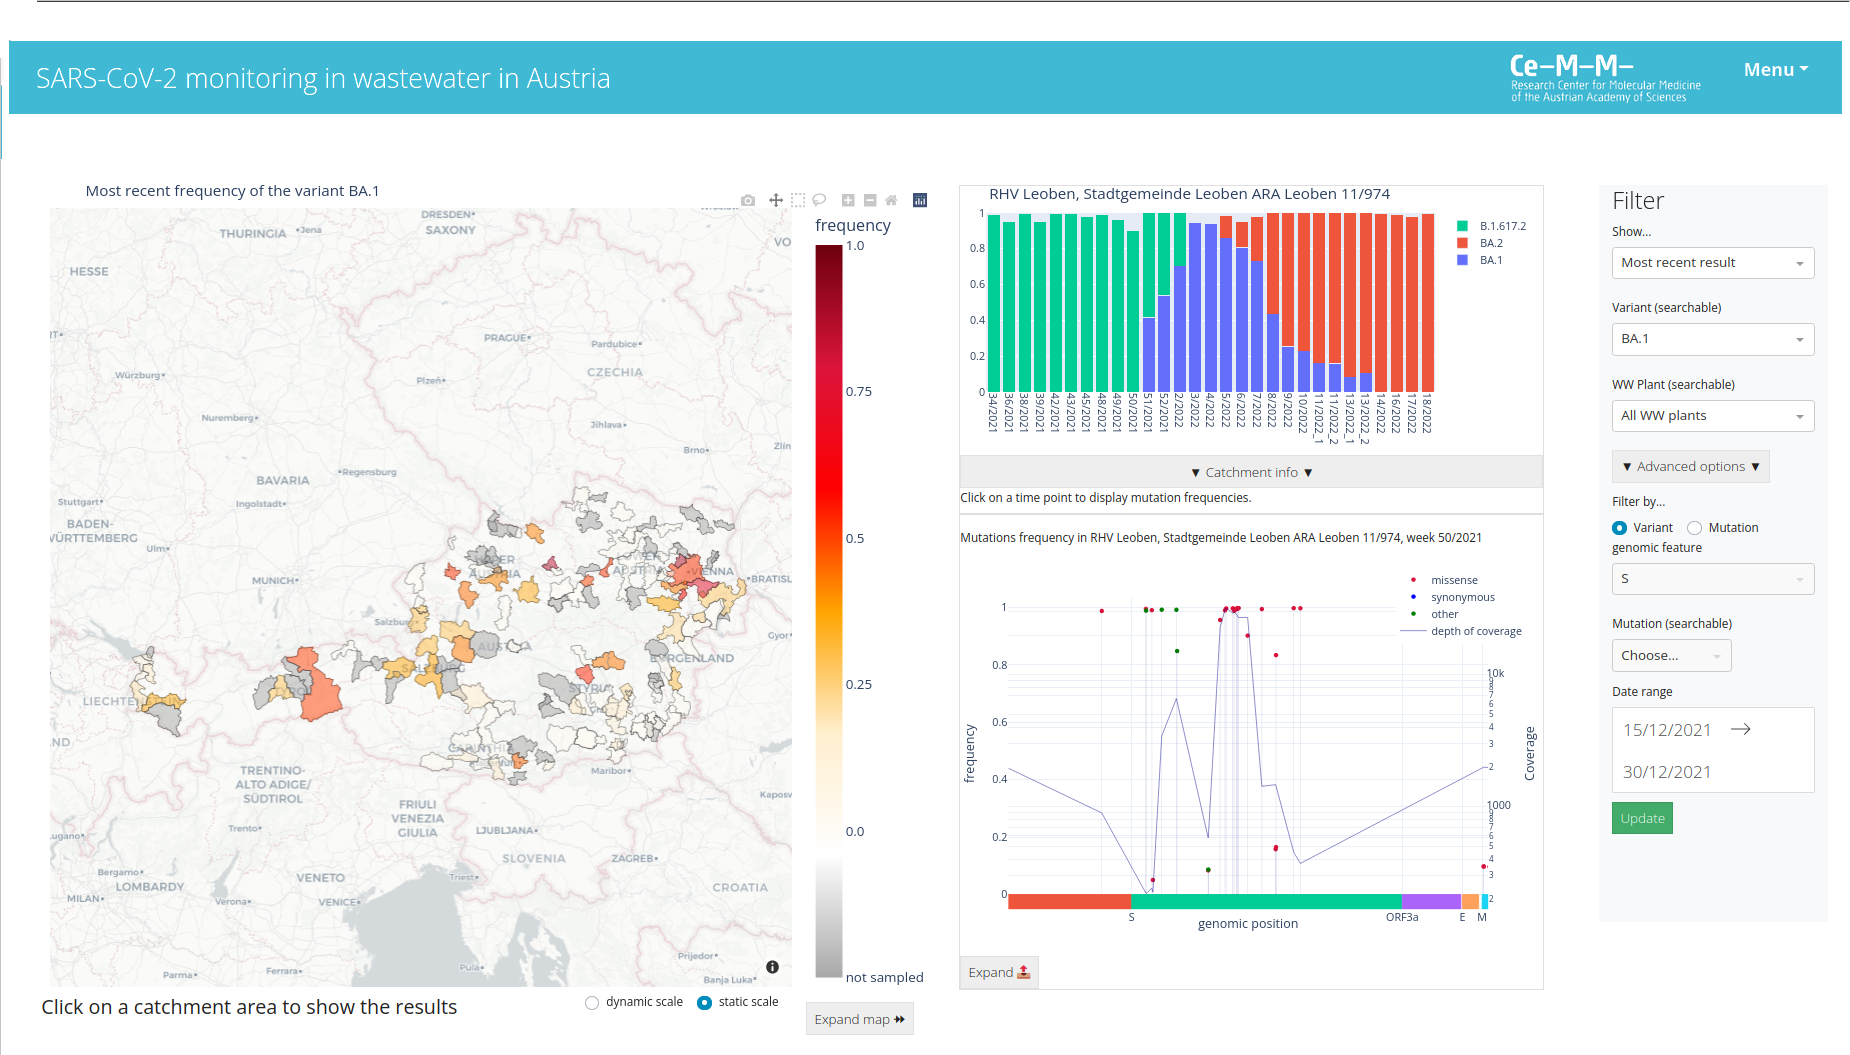
This web-based application enables interactive visualization and analysis of SARS-CoV-2 sequencing data from wastewater treatment plants. The application can be easily customized through the configuration file. For customization of the configuration file you will need a geojson file containing shape of your catchment areas, a csv file containing basic information about catchment areas and sequencing data in the csv table. The software is written in python 3.8 and the web server runs on Plotly Dash.
- git clone https://github.com/ptriska/WavesDash
- cd WavesDash
- pip install -r requirements
- python app.py
- open browser at localhost:8050
- docker pull wasa000/waves
- docker run -p [your port]:8050 wasa000/waves
- docker run -p [your port]:8050 --mount type=bind,source=/[path to your config file at local machine]/config.py,target=/home/WavesDash/config.py -v [path to the data folder]/data/:/home/WavesDash/data/ wasa000/waves
Demo verison of the application:
https://wavesdashboard.azurewebsites.net/

- customize the config.py
- supply own data files (example data files are in data/)
- input data file format is described in file_format.txt
- supply own geojson file with sampling areas
- supply own description of sampling locations (sampling_locations.tsv)
columns:
- variant (string) name of the variant (e.g. BA.1)
- LocationID (string) ID of the sampling area
- LocationName (string) plain text name of the sampling area
- sample_id (string) ID of the sample
- sample_date (string, YYYY-MM-DD) sampling date
- value (float between 0 and 1) frequency of detected variant in the sample
columns:
- sample_id (string) must correspond to the Sample_ID in the variant frequency file
- position (integer) position in the genome
- chrom (string) genomic feature ID (reference seq ID)
- ref (string) reference allele
- alt (string) alternative allele
- ann_effect (["missense_variant","synonymous variant"]) effect of the mutation
- ann_aa (string) amino acid change caused by the mutation
- allele_freq (float between 0 and 1) frequency of the allele in the sample
- depth (integer) optional; depth of sequencing at the position of the allele