Submitted By:
| Name | Pranav Goyanka |
|---|---|
| Email ID | pgoyanka@bu.edu |
| BU ID | U18853014 |
Table of Contents
For the common task for this class, we were asked to build a model to predict daily maximum temperatures for the following 4 locations:
-
(Belvedere Castle) Central Park, New York
-
Midway International Airport, Chicago, Illinois
-
Bergstrom International Airport, Austin, Texas
-
Miami, Florida
A variety of data sources were used to train the model and make daily predictions. Fetching data from these sources was performed via API calls.
| Source | Features Used |
|---|---|
| https://open-meteo.com/ | Maximum Temperature, Precipitation |
| https://www.visualcrossing.com/ | Maximum Temperature, Humidity |
| https://meteostat.net/en/ | Maximum Temperature, Minimum Temperature |
| https://www.ncei.noaa.gov/ | Maximum Temperature, Minimum Temperature |
These can also be found in Kalshi-Recent-Activity-Pranav.csv and kalshi-screenshot.pdf .
Screenshots of all trades from Kalshi are also attached at the end of this document.
| Date | City | Total Trades | Total Profit |
|---|---|---|---|
| @April 1, 2024 | Austin | 1 | 0 |
| @March 31, 2024 | Austin | 1 | 0 |
| @March 30, 2024 | Austin | 1 | 0 |
| @March 29, 2024 | Austin | 1 | 0 |
| @March 28, 2024 | Austin | 1 | 10 |
| @March 27, 2024 | Austin | 1 | 0 |
| @March 23, 2024 | Austin | 1 | 0 |
| @March 22, 2024 | Austin | 1 | 0 |
| @March 20, 2024 | Austin | 1 | 0 |
| @March 16, 2024 | Austin | 1 | 0 |
| @March 15, 2024 | Austin | 1 | 110 |
| @March 14, 2024 | Austin | 1 | 109 |
| @March 7, 2024 | Austin | 1 | 10 |
| @March 3, 2024 | Austin | 1 | 0 |
| @March 2, 2024 | Austin | 1 | 0 |
| @March 1, 2024 | Austin | 1 | 0 |
| @February 29, 2024 | Austin | 1 | 0 |
| @February 28, 2024 | Austin | 1 | 10 |
| Date | City | Total Trades | Total Profit |
|---|---|---|---|
| @April 1, 2024 | Chicago | 1 | 0 |
| @March 31, 2024 | Chicago | 1 | 0 |
| @March 30, 2024 | Chicago | 1 | 0 |
| @March 29, 2024 | Chicago | 1 | 10 |
| @March 28, 2024 | Chicago | 1 | 0 |
| @March 27, 2024 | Chicago | 1 | 0 |
| @March 23, 2024 | Chicago | 2 | 289 |
| @March 22, 2024 | Chicago | 1 | 0 |
| @March 20, 2024 | Chicago | 1 | 82 |
| @March 16, 2024 | Chicago | 1 | 0 |
| @March 15, 2024 | Chicago | 1 | 100 |
| @March 14, 2024 | Chicago | 1 | 195 |
| @March 7, 2024 | Chicago | 1 | 0 |
| @March 3, 2024 | Chicago | 1 | 14 |
| @March 2, 2024 | Chicago | 1 | 31 |
| @March 1, 2024 | Chicago | 1 | 10 |
| @February 29, 2024 | Chicago | 1 | 0 |
| @February 28, 2024 | Chicago | 1 | 19 |
| Date | City | Total Trades | Total Profit |
|---|---|---|---|
| @April 1, 2024 | Miami | 1 | 0 |
| @March 31, 2024 | Miami | 1 | 0 |
| @March 30, 2024 | Miami | 1 | 0 |
| @March 29, 2024 | Miami | 1 | 0 |
| @March 28, 2024 | Miami | 1 | 0 |
| @March 27, 2024 | Miami | 3 | 0 |
| @March 23, 2024 | Miami | 1 | 66 |
| @March 22, 2024 | Miami | 1 | 0 |
| @March 20, 2024 | Miami | 1 | 194 |
| @March 16, 2024 | Miami | 1 | 10 |
| @March 15, 2024 | Miami | 1 | 132 |
| @March 14, 2024 | Miami | 1 | 111 |
| @March 8, 2024 | Miami | 1 | 1 |
| @March 7, 2024 | Miami | 1 | 55 |
| @March 3, 2024 | Miami | 1 | 5 |
| @March 2, 2024 | Miami | 1 | 0 |
| @March 1, 2024 | Miami | 1 | 10 |
| @February 29, 2024 | Miami | 1 | 0 |
| @February 28, 2024 | Miami | 1 | 0 |
| Date | City | Total Trades | Total Profit |
|---|---|---|---|
| @April 1, 2024 | NYC | 1 | 0 |
| @March 31, 2024 | NYC | 1 | 0 |
| @March 30, 2024 | NYC | 1 | 0 |
| @March 29, 2024 | NYC | 1 | 0 |
| @March 28, 2024 | NYC | 1 | 0 |
| @March 27, 2024 | NYC | 2 | 0 |
| @March 23, 2024 | NYC | 1 | 0 |
| @March 22, 2024 | NYC | 1 | 0 |
| @March 20, 2024 | NYC | 1 | 1 |
| @March 16, 2024 | NYC | 1 | 10 |
| @March 15, 2024 | NYC | 1 | 88 |
| @March 14, 2024 | NYC | 1 | 110 |
| @March 7, 2024 | NYC | 1 | 55 |
| @March 3, 2024 | NYC | 1 | 0 |
| @March 2, 2024 | NYC | 1 | 35 |
| @March 1, 2024 | NYC | 1 | 0 |
| @February 29, 2024 | NYC | 1 | 5 |
| @February 28, 2024 | NYC | 1 | 0 |
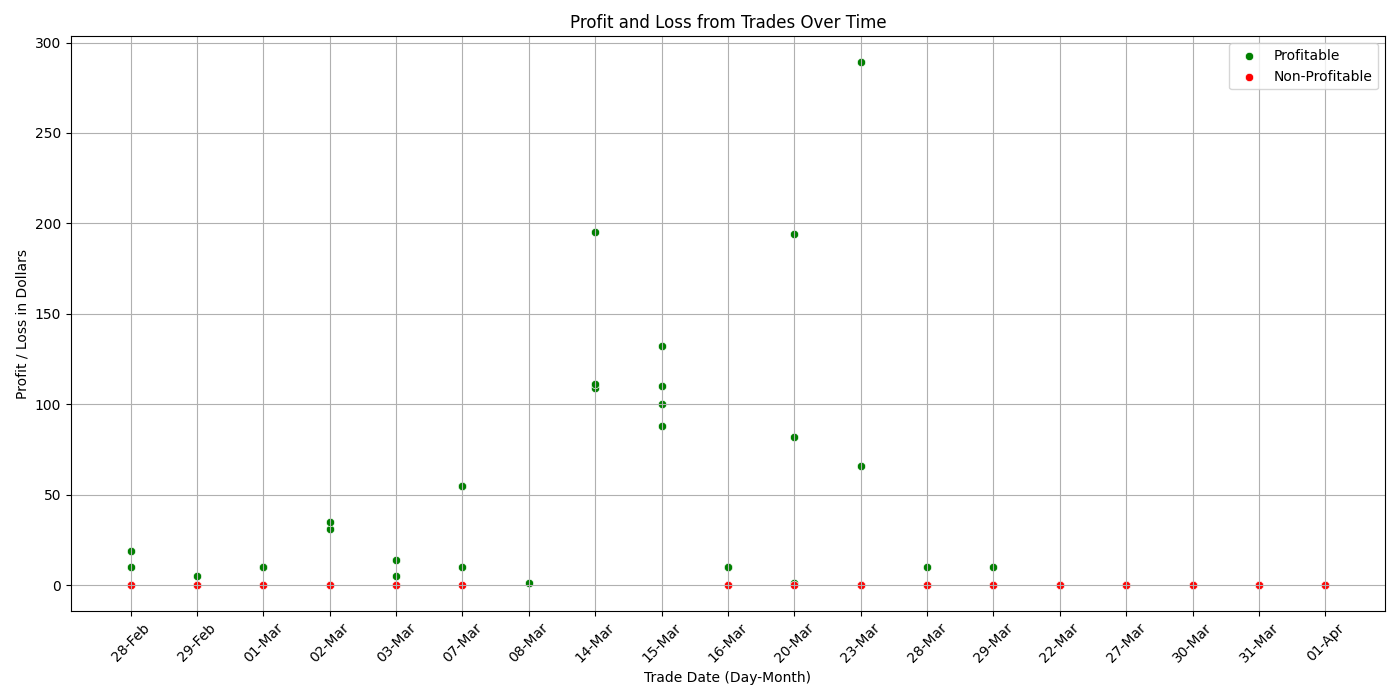
Based on the above data, it can be noted that a total profit for $1887 was made over the duration of the common task.
The final portfolio value and balance after the end date of the common task was as shown.
Daily predictions of maximum temperature were performed manually, and AccuWeather was used as a reference point for the prediction.
Trades were then made to Kalshi manually, which can be seen in Daily Trade summary above.
Gathering the data
- Data was collected via the four sources using API calls. Relevant code can be found in
data_fetcher_new.ipynb. - Data ranging from
2016-01-01to2024-03-24was used to train the model. - The data from all sources was merged into a single DataFrame (per city - so 4 DataFrames total) and pickled and stored in the
Datafolder.
Cleaning the data and creating final feature set
- Some important steps that were performed were
- Making sure all temperatures are in the same unit (Fahrenheit)
- Create the following features from the available features
tmax_avg,tmin_avgandday(day of the year 1-365)
- Fill null values with
ffill, which propagates the last valid observation to next valid.- This is a better choice than something like mean, because it allows maintaining some similarity from the previous day’s data.
Model Training
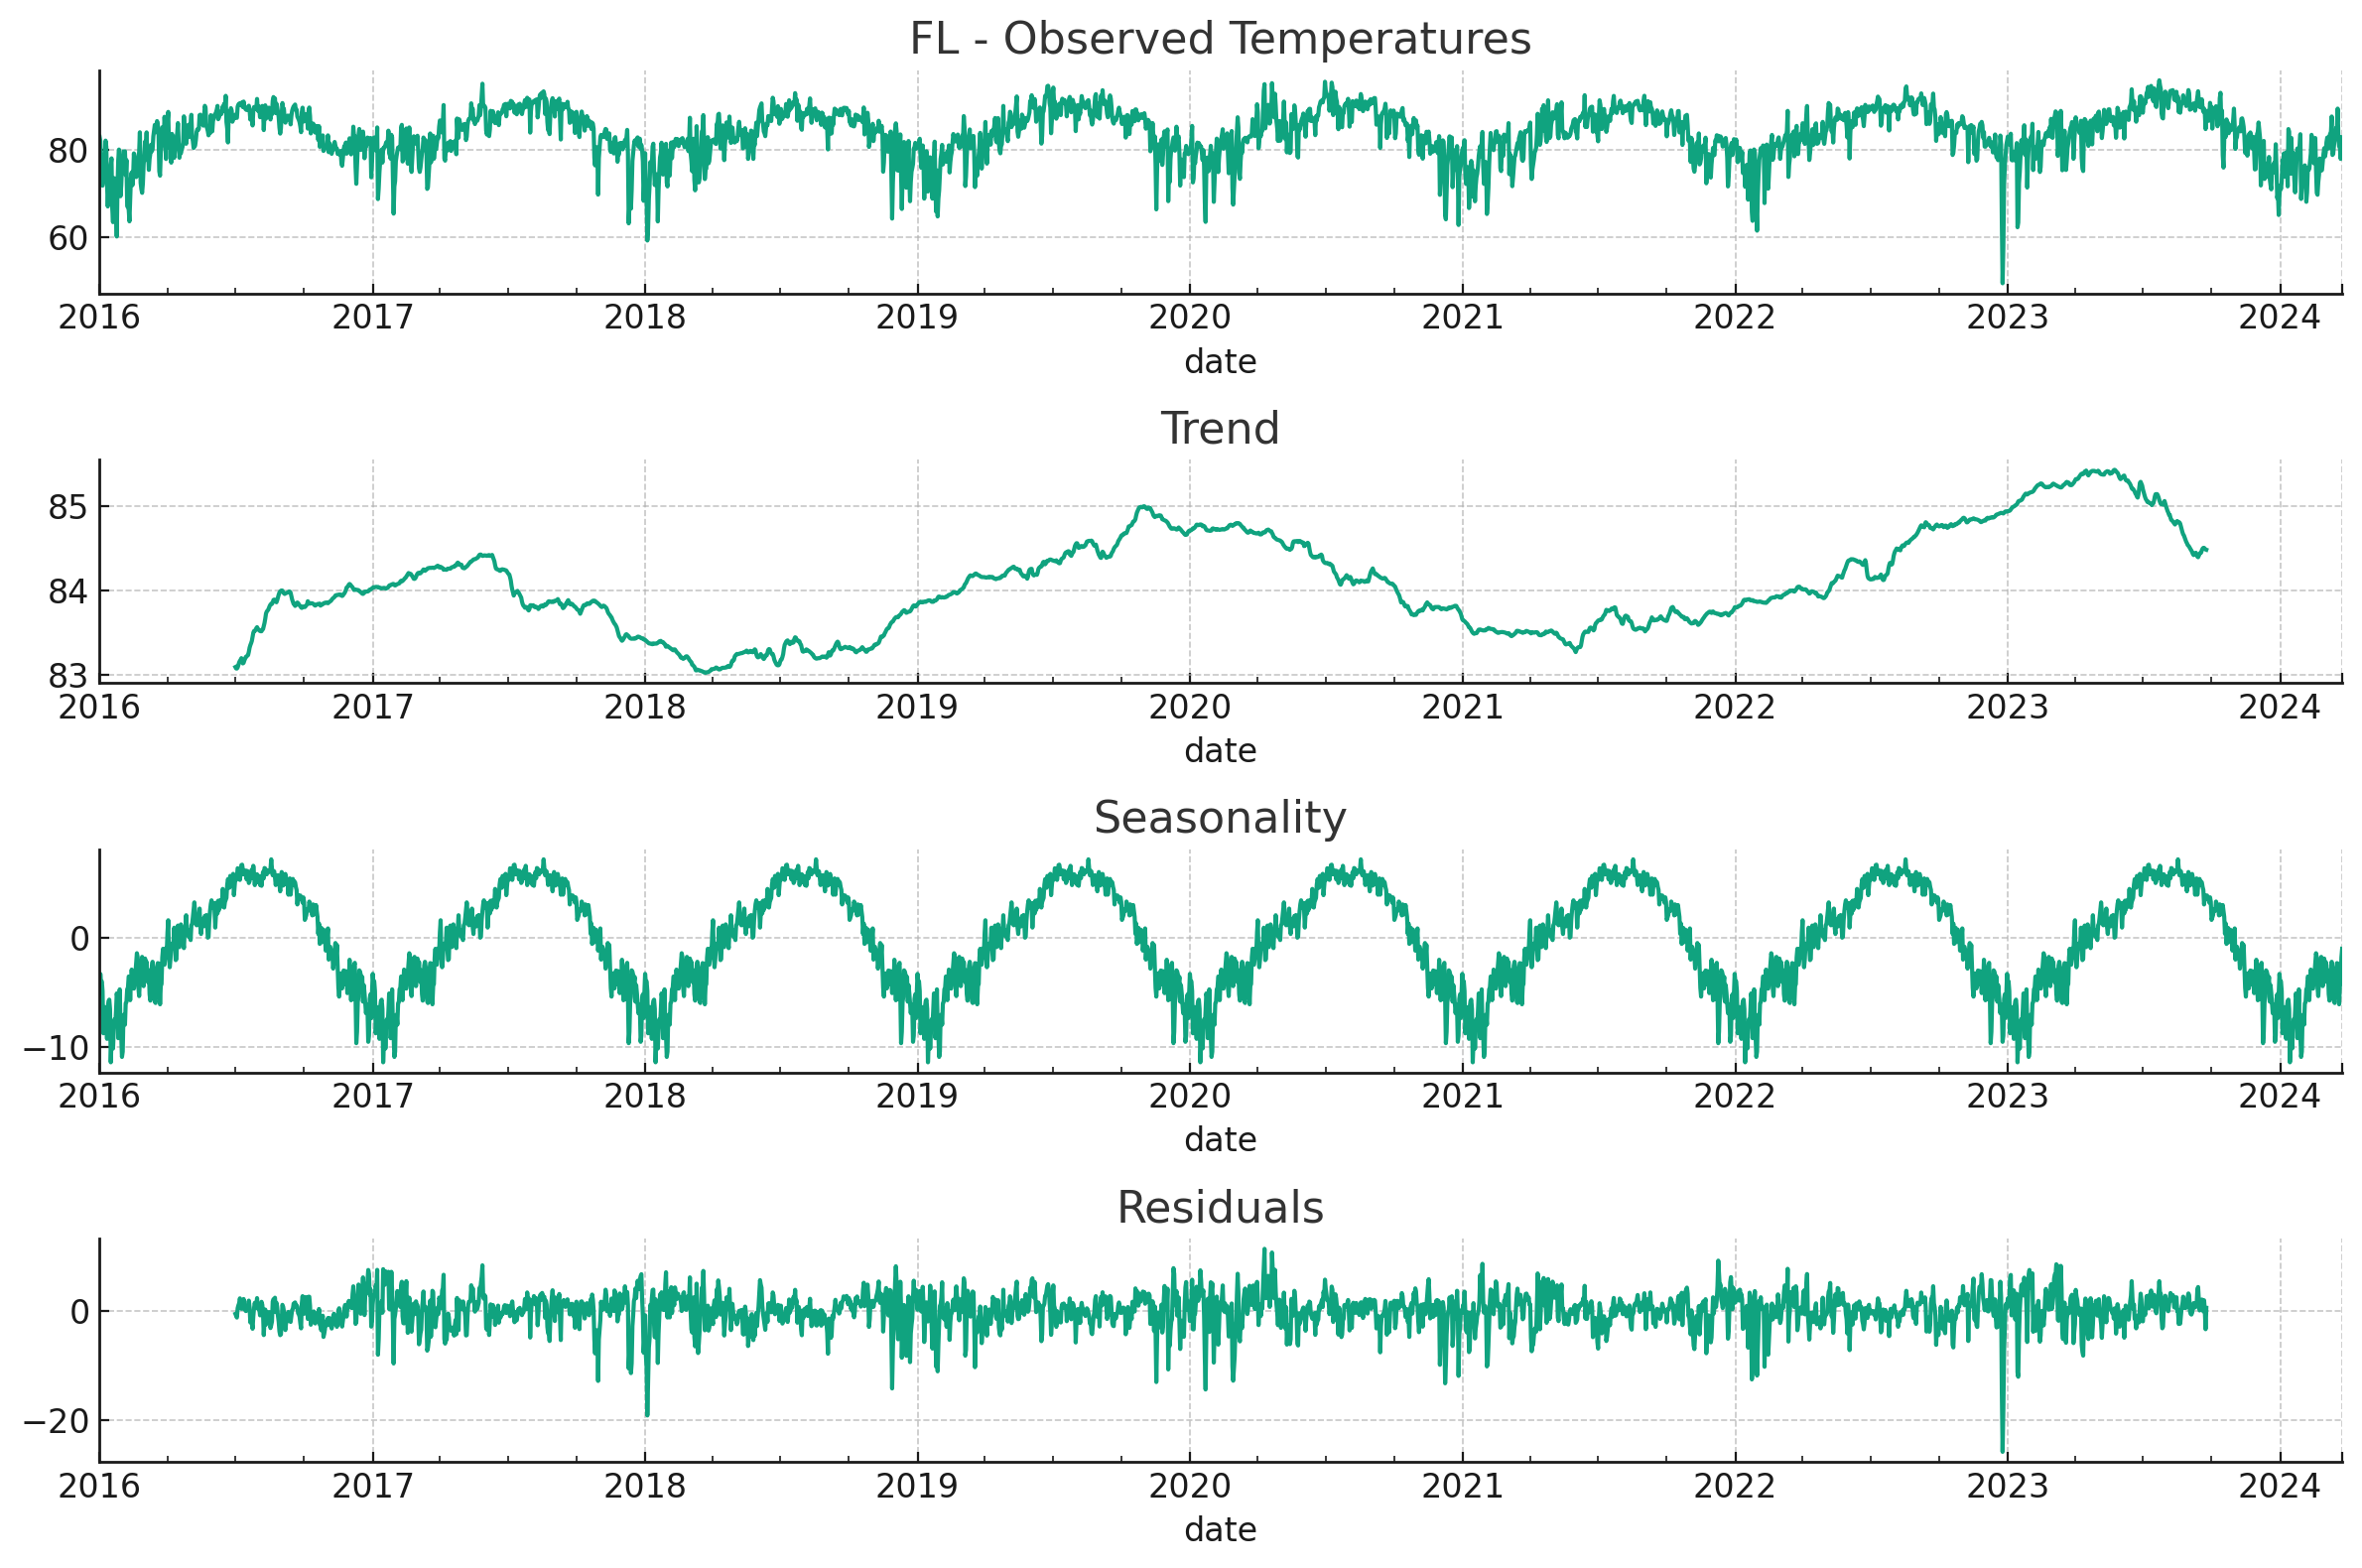
Weather data consists of many components that influence the data for a future date. This includes factors such as seasonality and the data for the last few days.
When looking at the seasonal factors, we primarily observe 3 seasonal decomposition factors:
- Trend: This shows the general direction the data is moving towards.
- Seasonality: This captures a patterns and it’s repeated-ness over a period of time.
- Residual: This captures a remainder of noise that leads to irregularities in the data.
Here is the plot of the same for the four locations based on the dataset that was gathered:
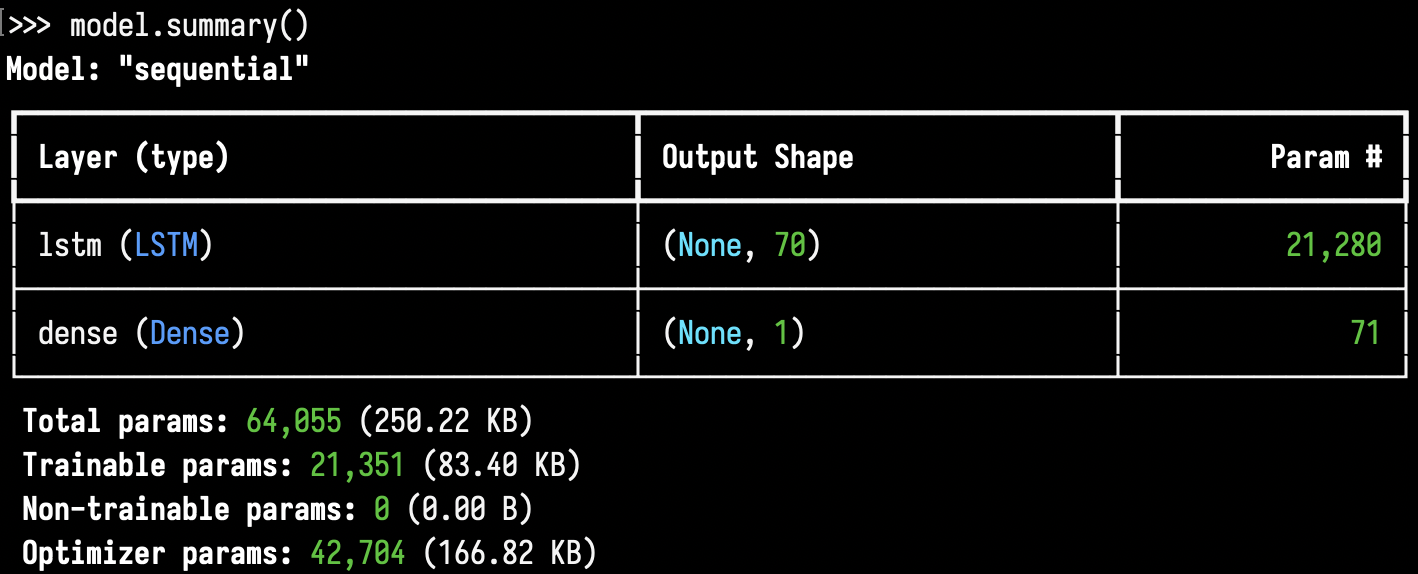
An LSTM Model was used to for predict the maximum temperature. LSTMs are particularly suited for this task because they can remember information for long periods, which is essential for capturing patterns in temperature changes over time. Additionally, their ability to handle sequential data makes them ideal for weather forecasting, where past conditions are often indicative of future weather.
Here is a summary of the model that was built:
Four identical models were trained, one for each location. Each was trained on the dataset relating to just that city’s data. These are available in the following keras files:
model_fl.kerasmodel_il.kerasmodel_ny.kerasmodel_tx.keras
The model was trained using a timestep of 10 days.
The Adam Optimiser was using and the model was trained for 80 epochs.
In this week, the Kalshi Python API was utilised to develop an automated system that can make trades on the platform automatically based on the daily trades.
The relevant code for this can be found in daily_prediction.py and kalshi_trader.py , which is a python script downloads the data for the current day, and make a prediction based on the last 10 days’ data for the upcoming day.
Getting API Keys:
Visual Crossing requires you to have an API key. Once you have one setup using your account, open .env and update it’s value.
Setting Up Kalshi Credentials:
Please update the email id and password for your Kalshi account in kalshi_trader.py at lines 17 and 18.
Follow these steps to run the project:
- Fetching all data and cleaning it
- Run all of the cells in
data_fetcher_new.ipynb
- Run all of the cells in
- Building and training the model
- Run all of the cells in
data_lstm.ipynb
- Run all of the cells in
- For predicting daily data and making automated trades, run the following two commands
python daily_predictions.pypython kalshi_trader.py
The trained model is present in the Data folder under the names:
model_fl.kerasmodel_il.kerasmodel_ny.kerasmodel_tx.keras
The current dataset, post data cleaning, has been pickled and is stored in the following files in the Data folder:
prediction_data_cleaned_fl.pklprediction_data_cleaned_il.pklprediction_data_cleaned_ny.pklprediction_data_cleaned_tx.pkl
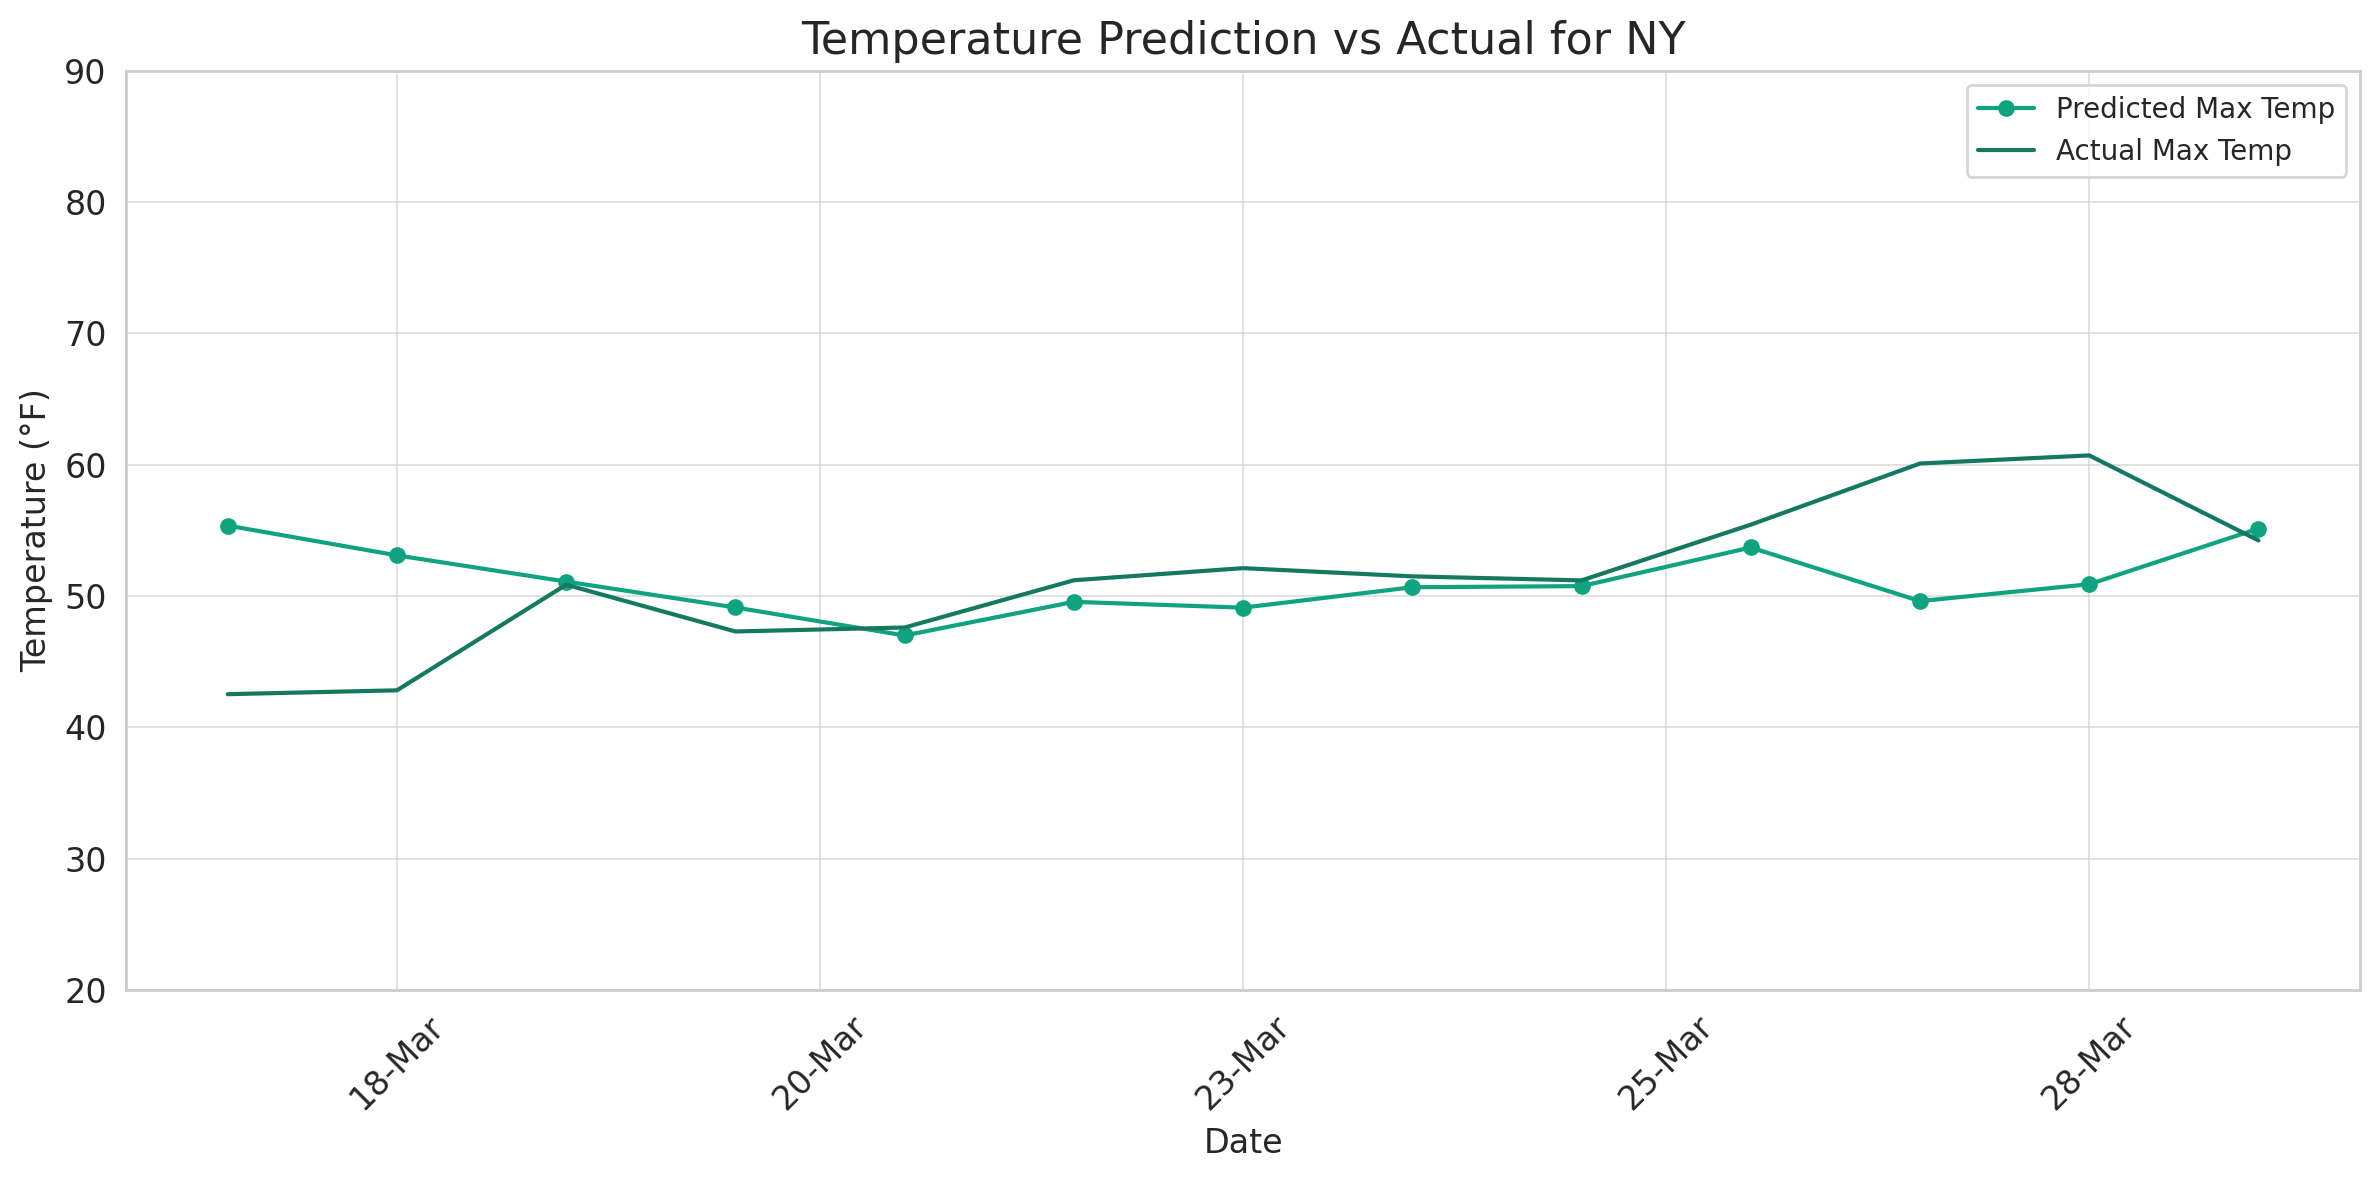
The following predictions were observed using the model described above.
As described earlier in the report, ****total profit for $1887 was made,
- Keras Documentation [https://keras.io/guides/]
- Predicting Temperature of Major Cities Using Machine Learning and Deep Learning [https://arxiv.org/abs/2309.13330]
- Time Series Forecasting using SARIMA (https://medium.com/@ozdogar/time-series-forecasting-using-sarima-python-8db28f1d8cfc)


