Aboveground carbon (AGC) maps are needed for monitoring of thicket restoration in South Africa. This project developed a method for mapping AGC using multi-spectral satellite imagery. The work was undertaken as part of the GEF5-SLM (sustainable land management) project.
Generic modules for allometry, image feature extraction, feature selection and applying models to large rasters may be useful for other projects.
More details can be found in the paper, and report.
Using the conda package manager, for resolving binary dependencies is the recommended way. The Minconda installation includes a minimal conda.
- Create a conda environment and install dependencies:
conda create -n <environment name> python=3.8 -c conda-forge
conda activate <environment name>
conda install -c conda-forge matplotlib numpy scipy scikit-learn openpyxl rasterio geopandas dcor- Clone the git repository and link into the conda environment:
git clone https://github.com/leftfield-geospatial/map-thicket-agc.git
pip install -e map-thicket-agc- Create the
data/inputs/imagery/worldview3directory and download the satellite imagery into it. - Create the
data/inputs/imagery/ngidirectory; download and extract the corrected aerial imagery into it.
The following dependencies are installed in the process above. The geopandas and rasterio packages have binary dependencies that are not directly available through pip, hence the recommendation for using conda.
- python >= 3.6
- geopandas >= 0.8
- rasterio >= 1.1
- numpy >= 1.19
- scipy >= 1.5
- scikit-learn >= 0.23
- matplotlib >= 3.3
- openpyxl >= 3.0
- dcor >= 0.5
Allometric and plot location data for generating AGC ground truth are included in the repository (refer to the carbon baselines report for detail on how this data was gathered). Satellite and aerial imagery is too large for git and can be downloaded separately. See the data licensing here.
| Path | Description |
|---|---|
| data/inputs/allometry | Woody and litter allometric measurements from 85 sampling plots in the Baviaanskloof, South Africa, and allometric models for common thicket species. |
| data/inputs/geospatial/sampling_plot_locations/corrected | Polygons of sampling plot boundaries with differential correction to < 30cm accuracy. |
| data/inputs/geospatial/sampling_plot_locations/uncorrected | Reference and sampling plot corner points with no differential correction. |
| data/inputs/imagery/worldview3 | Satellite imagery (see Installation). |
| data/inputs/imagery/ngi | Aerial imagery (see Installation). |
The scripts directory contains python scripts for generating results. To run the scripts in the required order, execute:
python map-thicket-agc/scripts/run_all.py| Script | Description |
|---|---|
| scripts/run_all.py | Executes the scripts in sequence |
| scripts/generate_agc_ground_truth.py | Applies allometric models to plant and litter measurements to generate AGC for the 85 sampling plots |
| scripts/generate_agc_shapefile.py | Combines the above ground truth with plot locations to generate a shapefile of plot polygons with fields for AGC etc |
| scripts/fit_agc_model.py | Extracts features from the satellite image, selects a set of informative features, and fits and evaluates models for predicting AGC from these features |
| scripts/generate_agc_map.py | Applies fitted model(s) to the satellite image to generate a coarse resolution AGC map |
| scripts/evaluate_calibration.py | Evaluates a method for calibrating AGC models to new images (using an additional two satellite images and a mosaic of aerial imagery) |
| scripts/generate_extend_ground_truth.py | Generates AGC and feature ground truth for extending the model spatially |
See the paper, and full report for more detail.
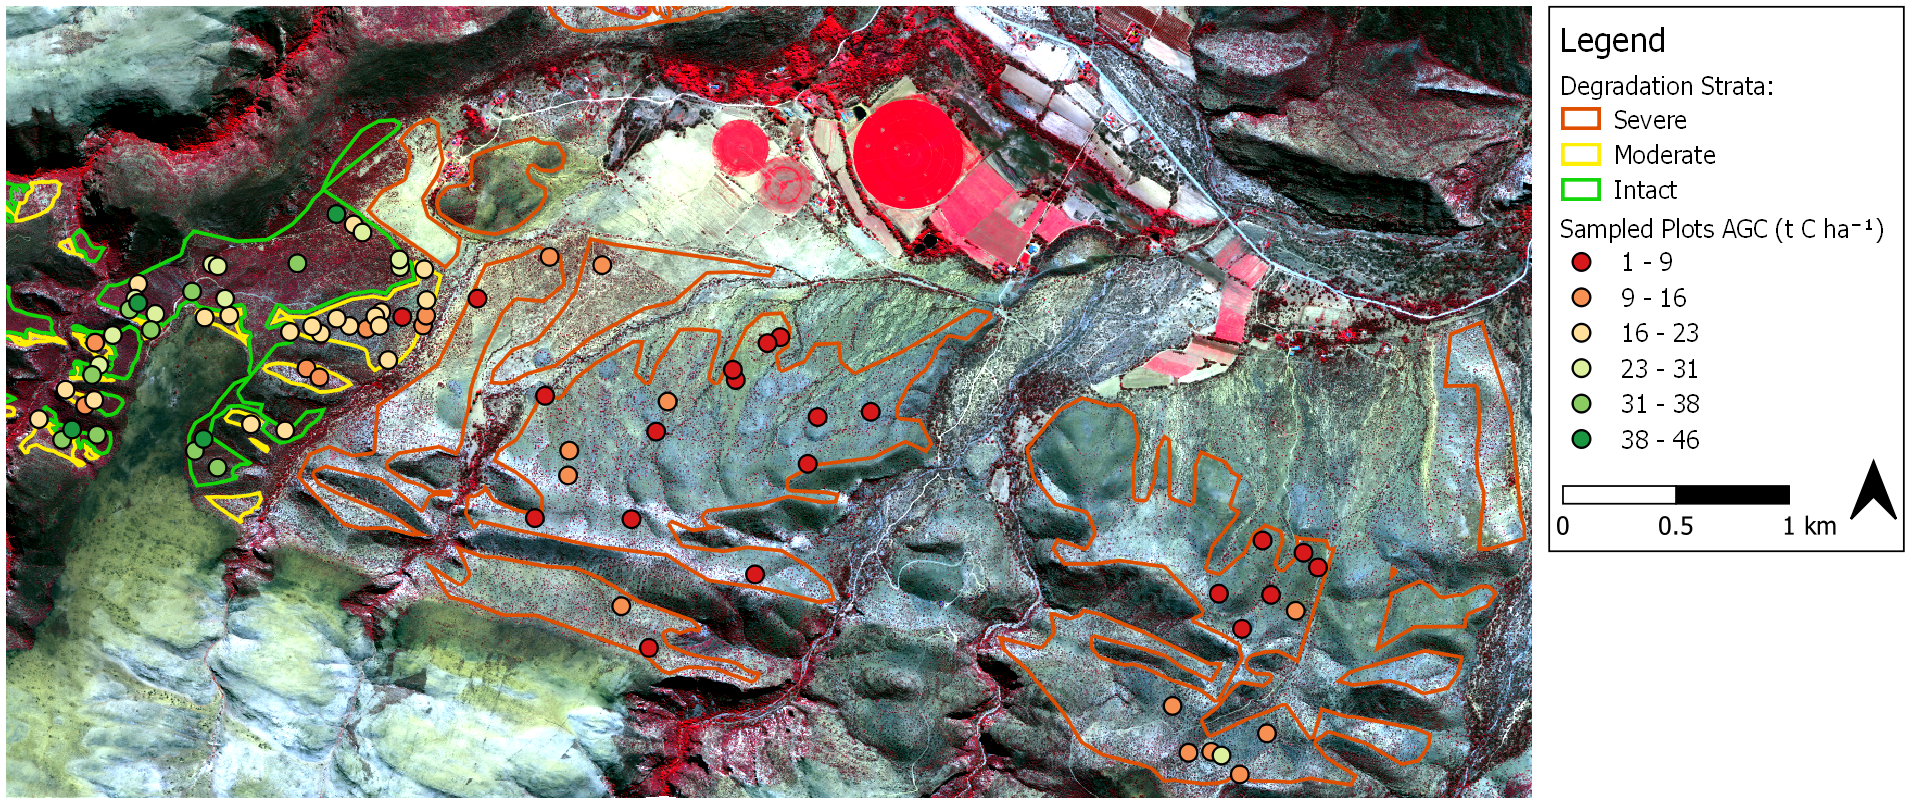
Ground truth AGC data were generated by applying existing allometric models to plant measurements gathered in the Baviaanskloof, South Africa. 85 sampling plots were spread over three degradation strata (WorldView-3 Aug 2017 image in colour-infrared rendering).
Satellite image courtesy of the DigitalGlobe Foundation
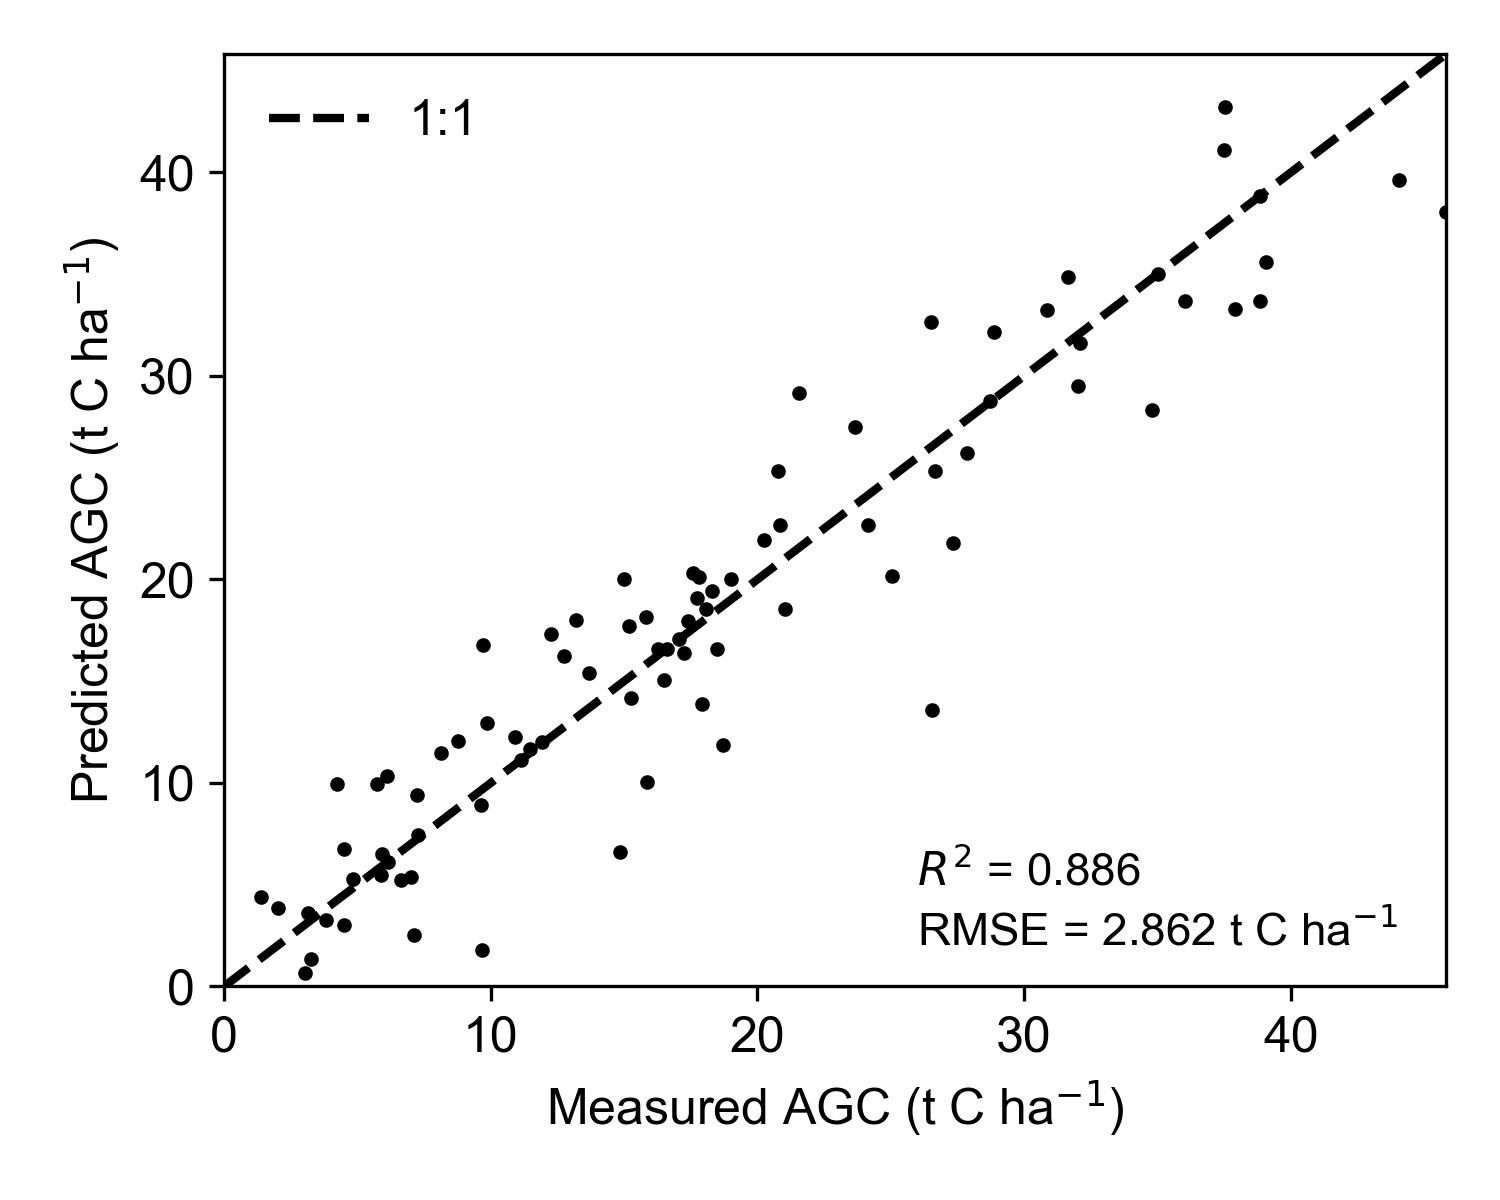
Regression models were fitted to informative subsets of image features.
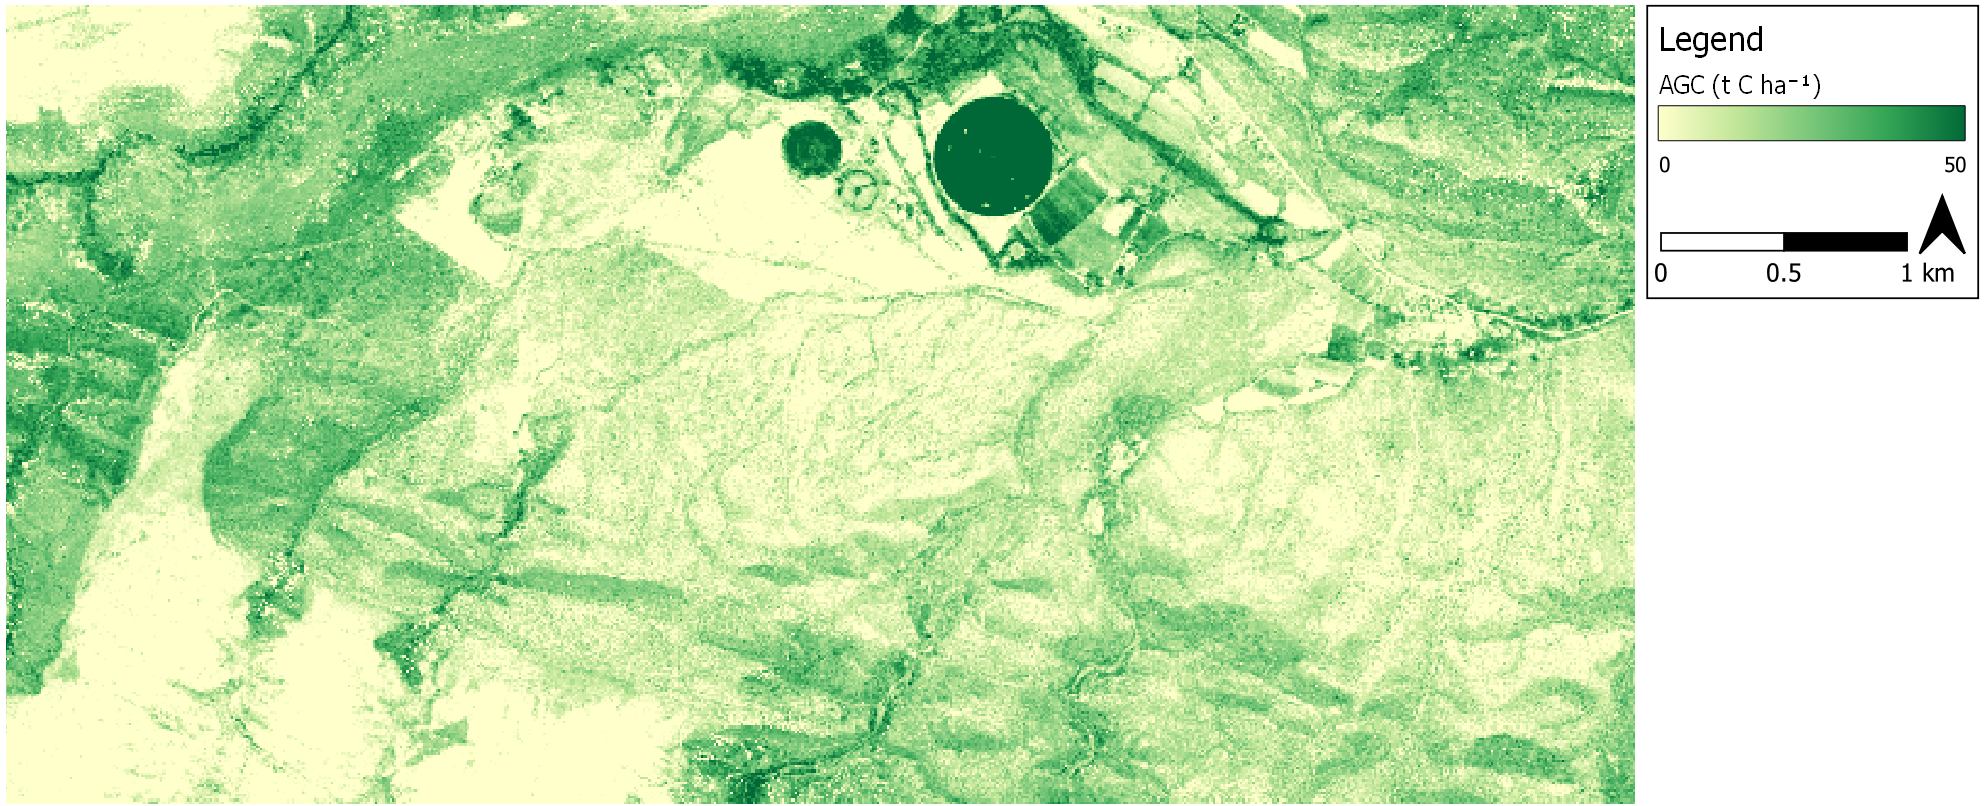
Application of the AGC model to the WorldView-3 image.
A method for calibrating AGC models to new images gave encouraging results. Tests were conducted on the original WorldView-3 image ("WV3 Aug 2017"), two additional WorldView-3 images("WV3 Oct 2017" and "WV3 Nov 2018"), and a mosaic of aerial imagery ("NGI April 2015"). The table shows R2 between actual and predicted AGC for calibrated models. Calibration images are along the columns and model fit images down the rows.
| R2 | WV3 Oct 2017 | WV3 Nov 2018 | WV3 Aug 2017 | NGI April 2015 |
|---|---|---|---|---|
| WV3 Oct 2017 | - | 0.826 | 0.803 | 0.802 |
| WV3 Nov 2018 | 0.847 | - | 0.798 | 0.813 |
| WV3 Aug 2017 | 0.845 | 0.818 | - | 0.801 |
| NGI April 2015 | 0.835 | 0.830 | 0.798 | - |
- Code is licensed under the AGPLv3.
- All data, used and produced by the software (excluding WorldView-3 imagery), is licensed under the CC BY-NC-SA.
- WorldView-3 imagery is licensed under the DigitalGlobe Foundation's terms.
For use of the code or output data, please cite:
- Dugal Harris, Cosman Bolus, James Reeler, "Very high resolution aboveground carbon mapping in subtropical thicket," Journal of Applied Remote Sensing. 15(3), 038502 (2021), doi: 10.1117/1.JRS.15.038502
For use of the input allometric or plot location data, please cite:
- Bolus, C., Harris, D., Reeler, J., Powell, M., Powell, R., Ngwenya, M. 2020. Above Ground Carbon (AGC) baseline assessment, using species specific allometric models, across three degradation classes in Baviaanskloof Spekboom Thicket, GEF-5 SLM, Rhodes University. Internal report.
- Cosman Bolus - Field work and allometry
- James Reeler - Policy advice and oversight
- Marius van der Vyver - Allometric models
- Rebecca Powell - GEF-5 SLM project coordination, E. Cape
- Center for Geographical Analysis - Assistance with imagery and DGPS device - www.sun.ac.za/cga
- National Geo-spatial Information - Aerial imagery - www.ngi.gov.za
- Satellite images courtesy of the DigitalGlobe Foundation


