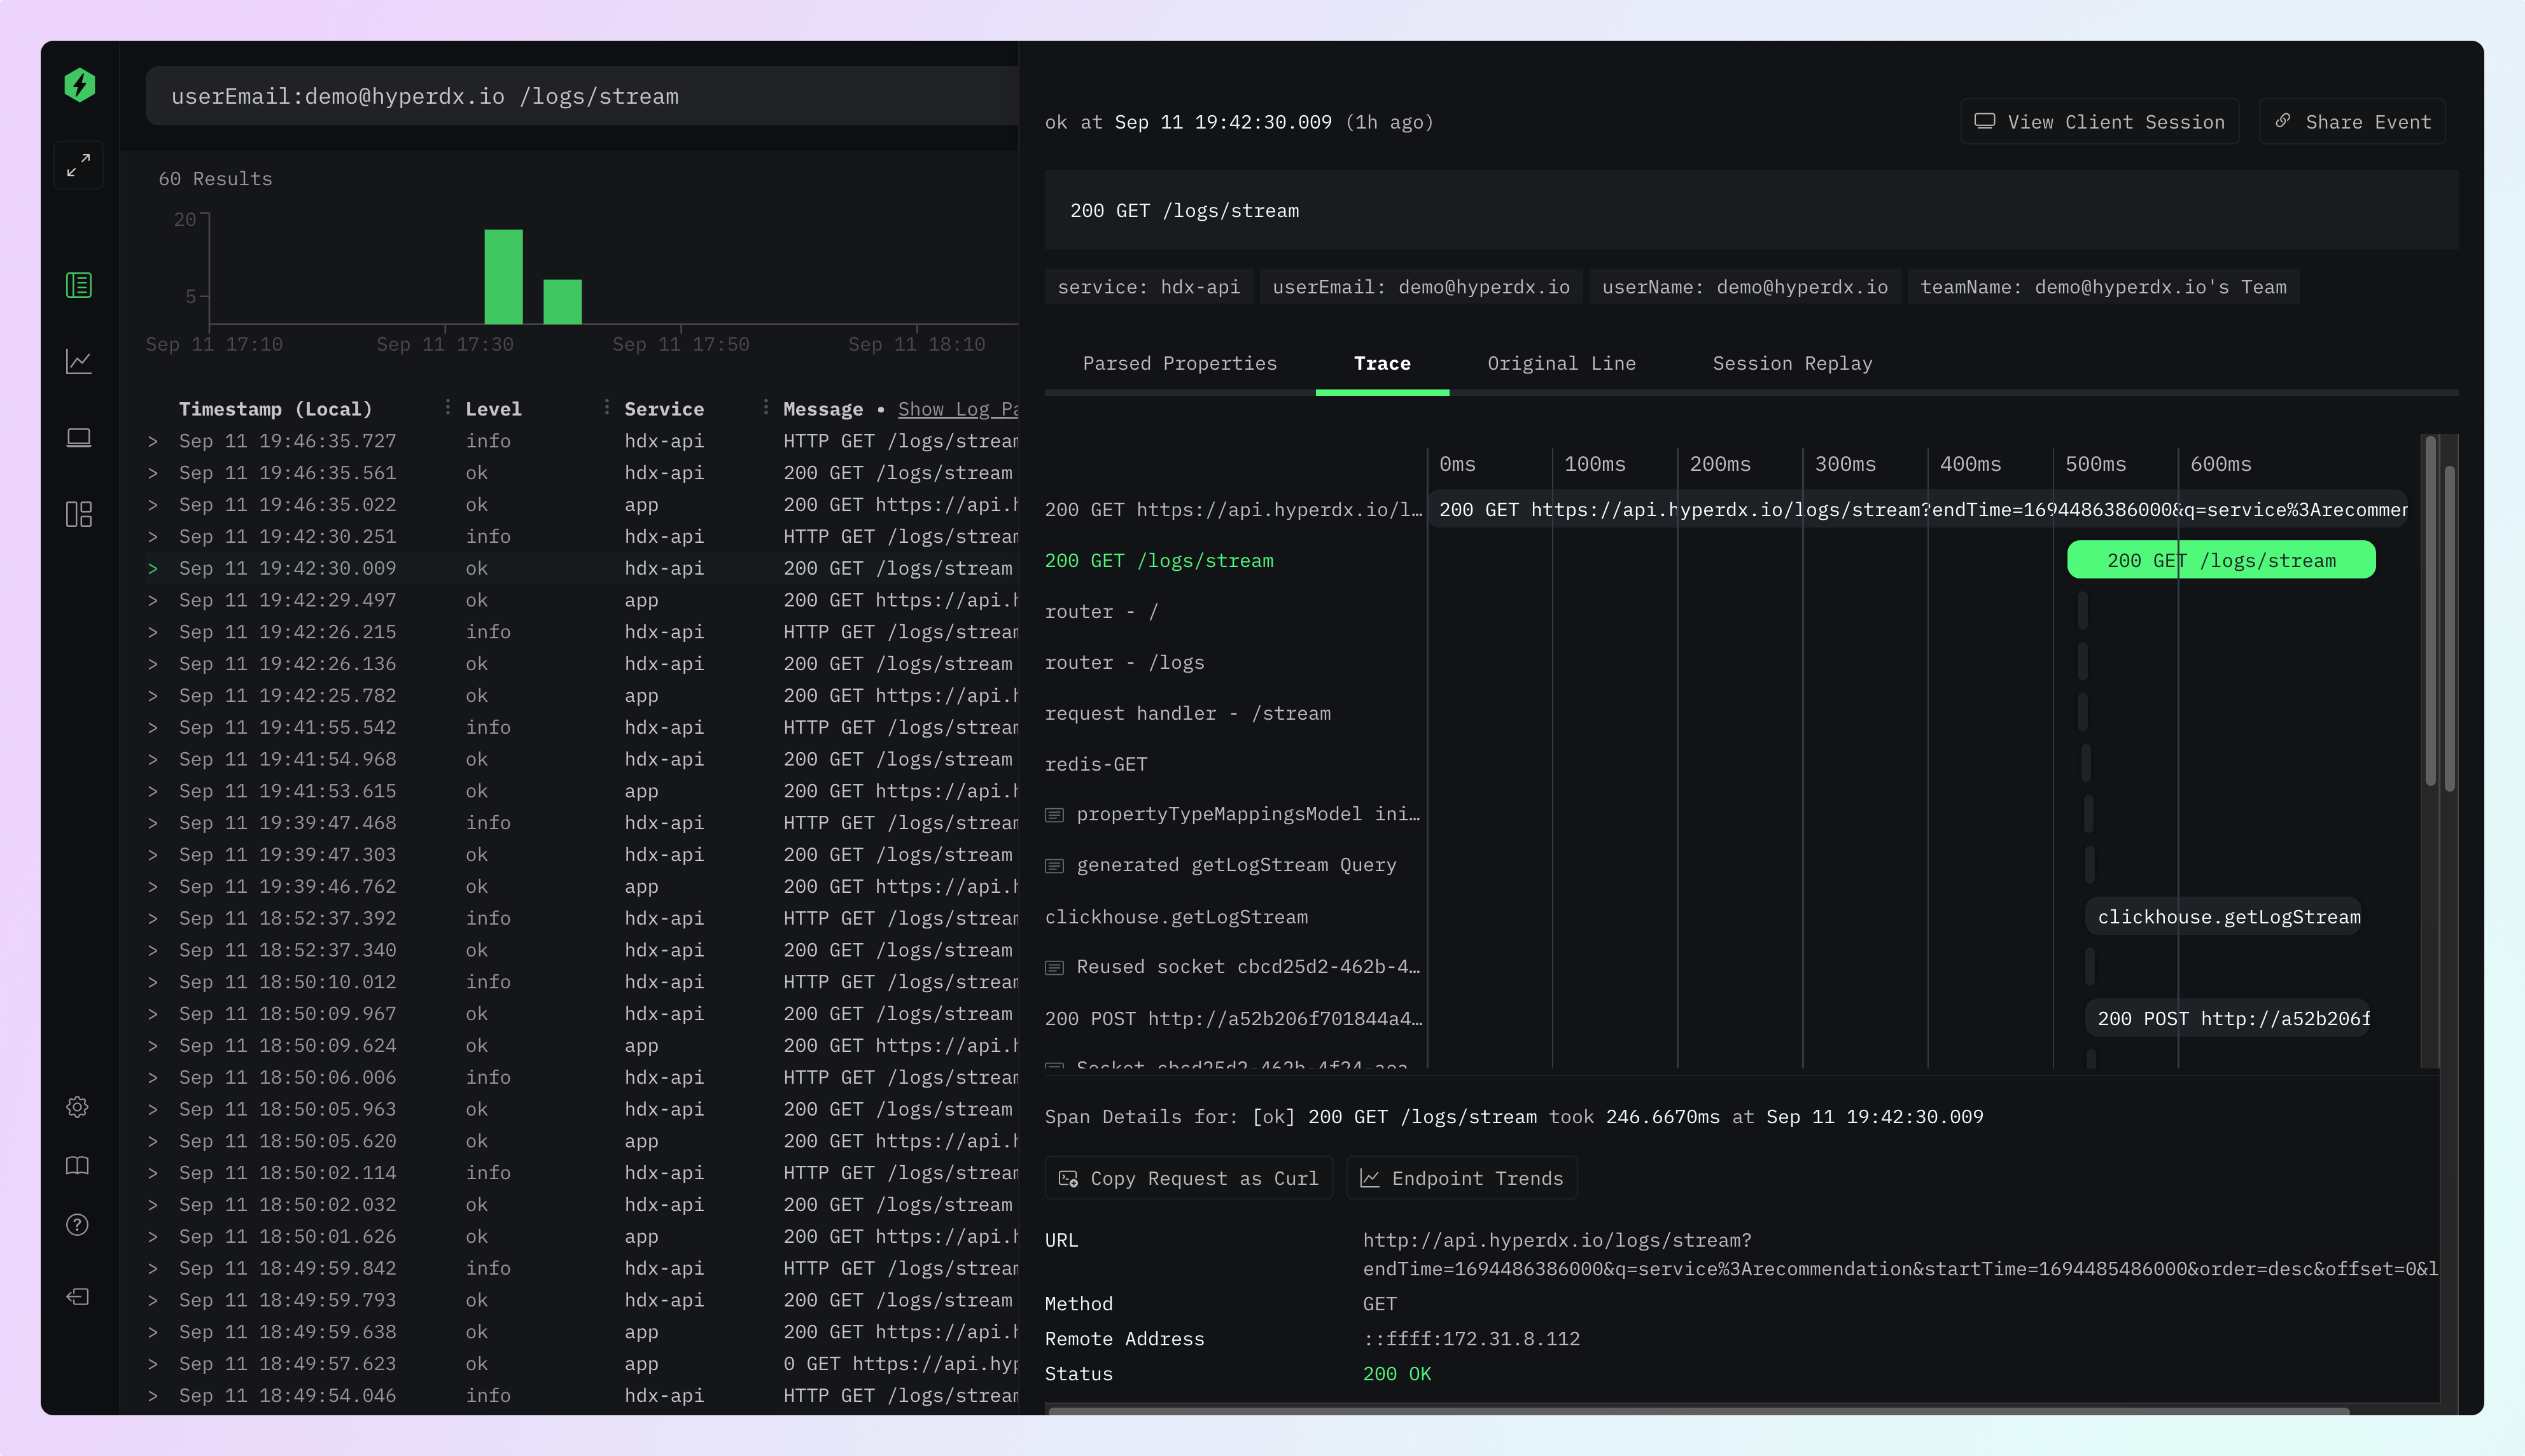
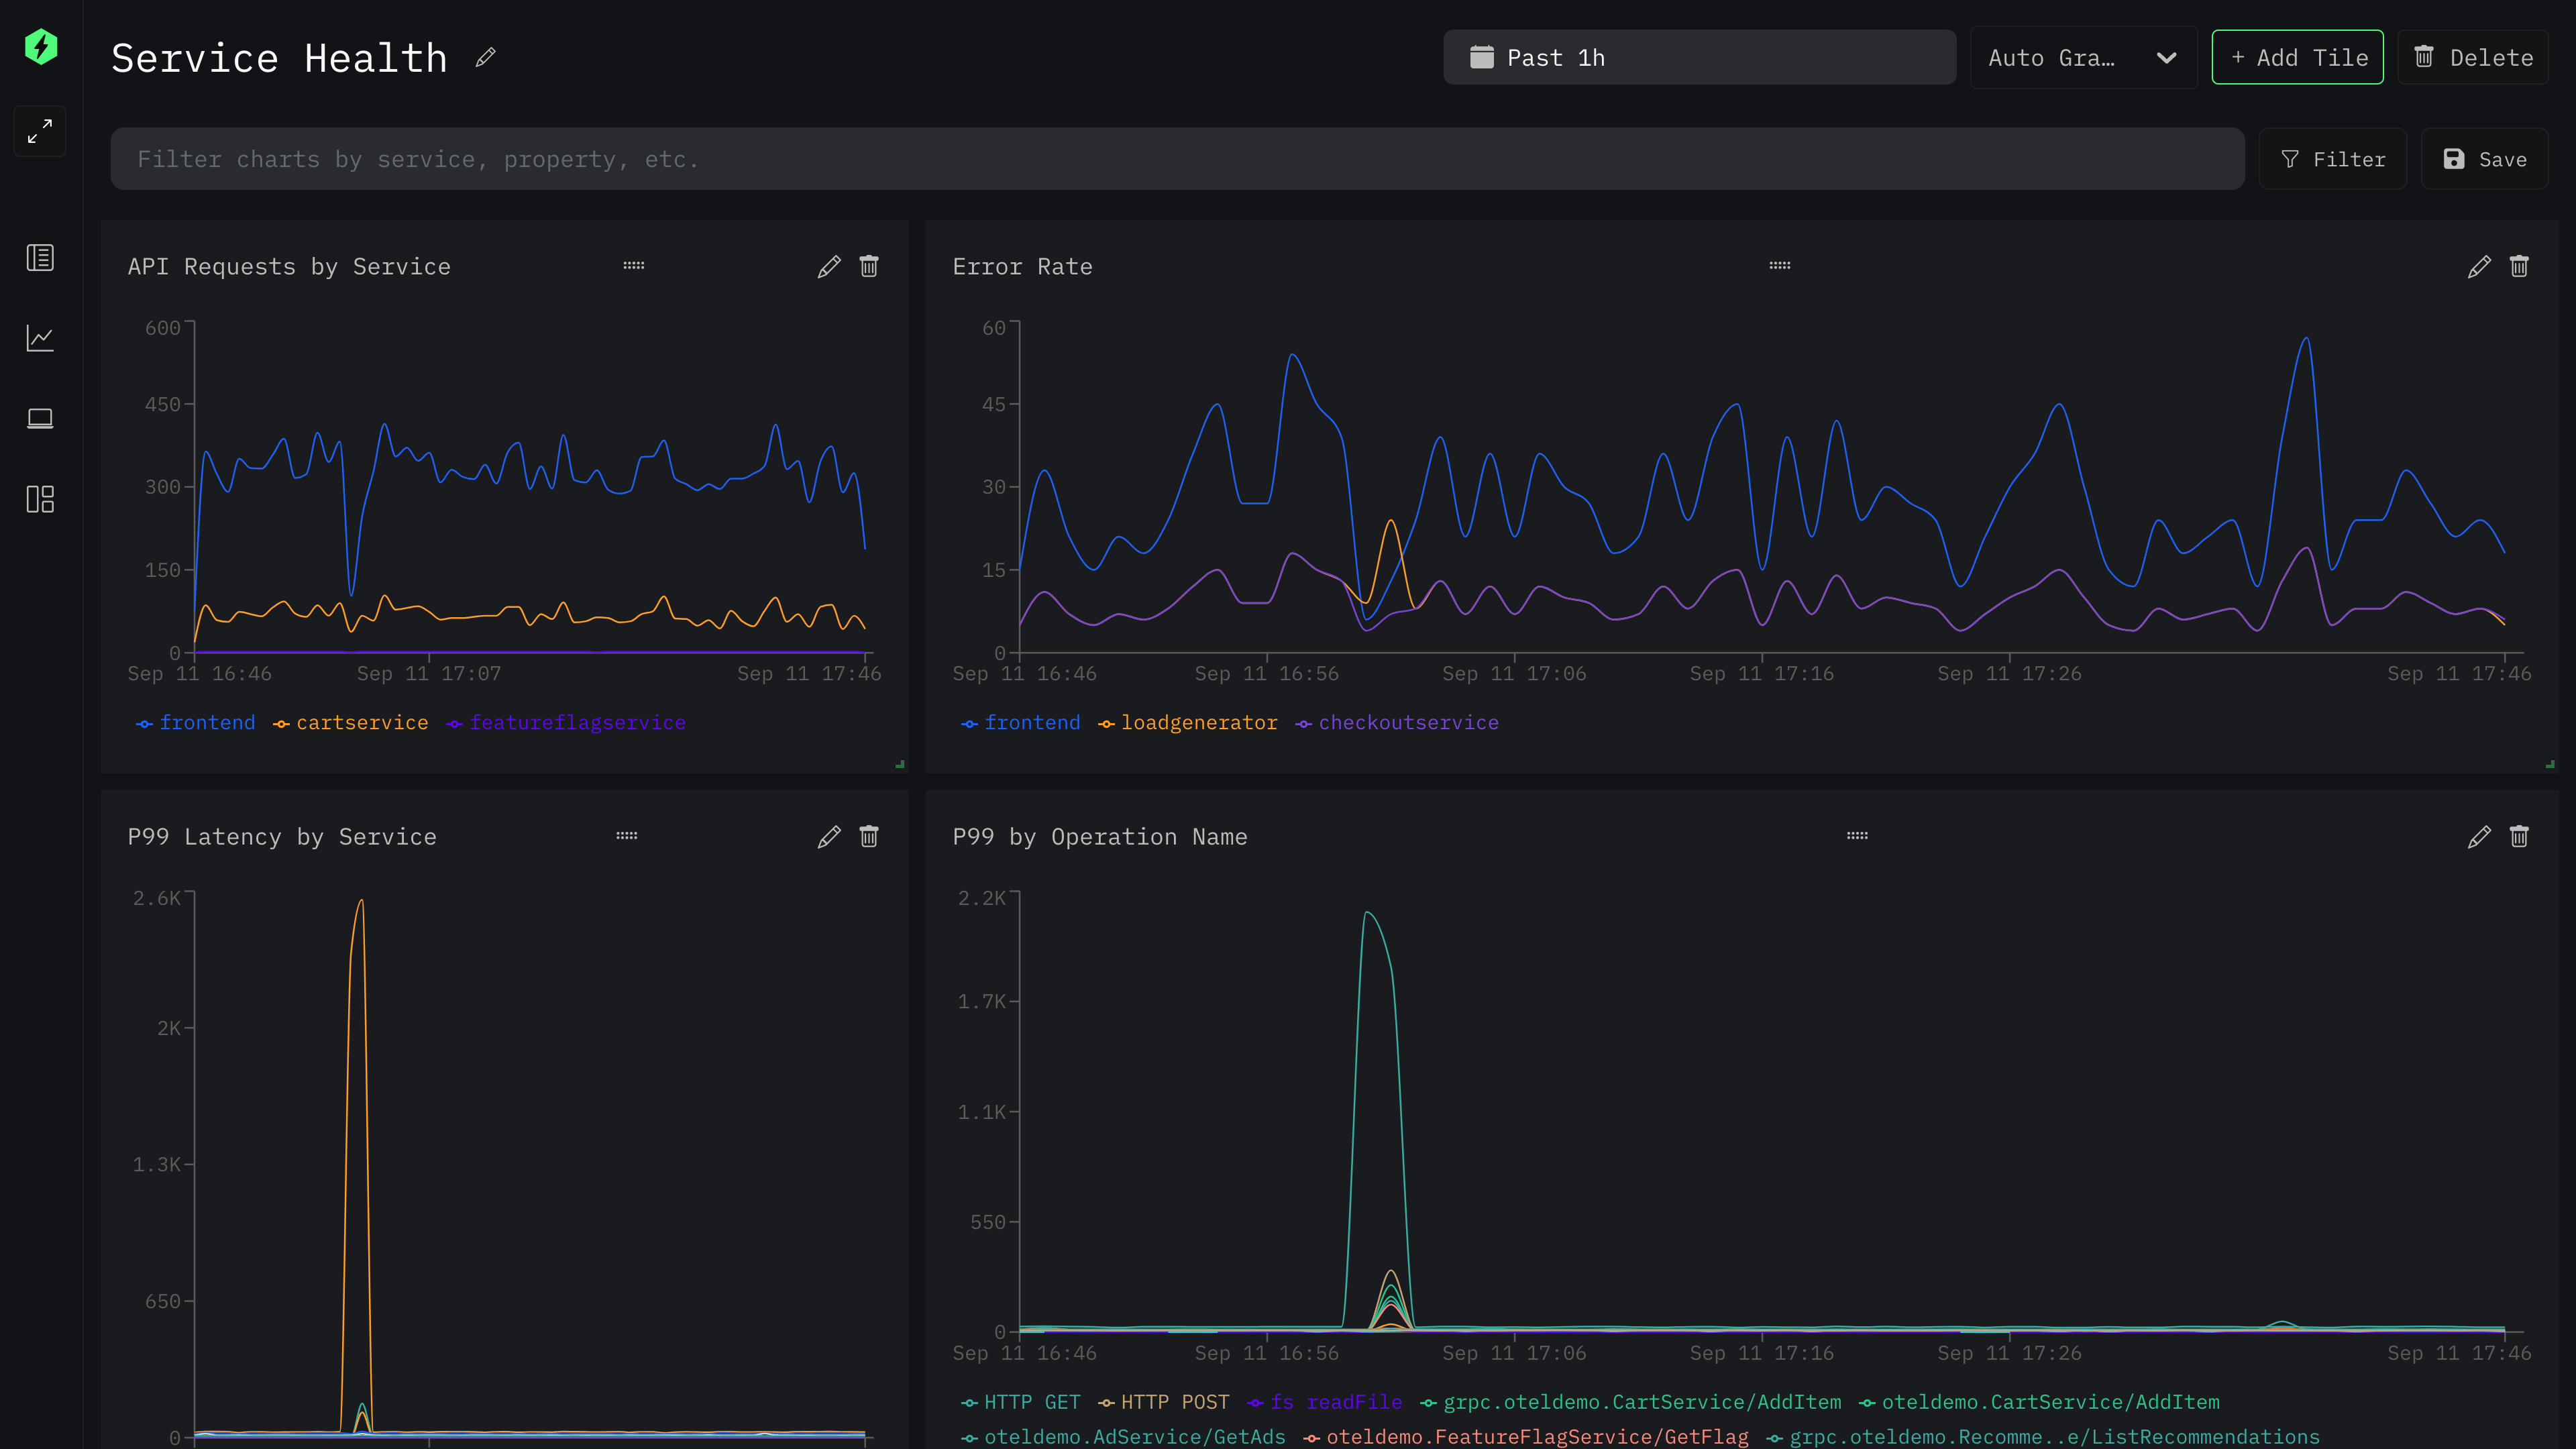
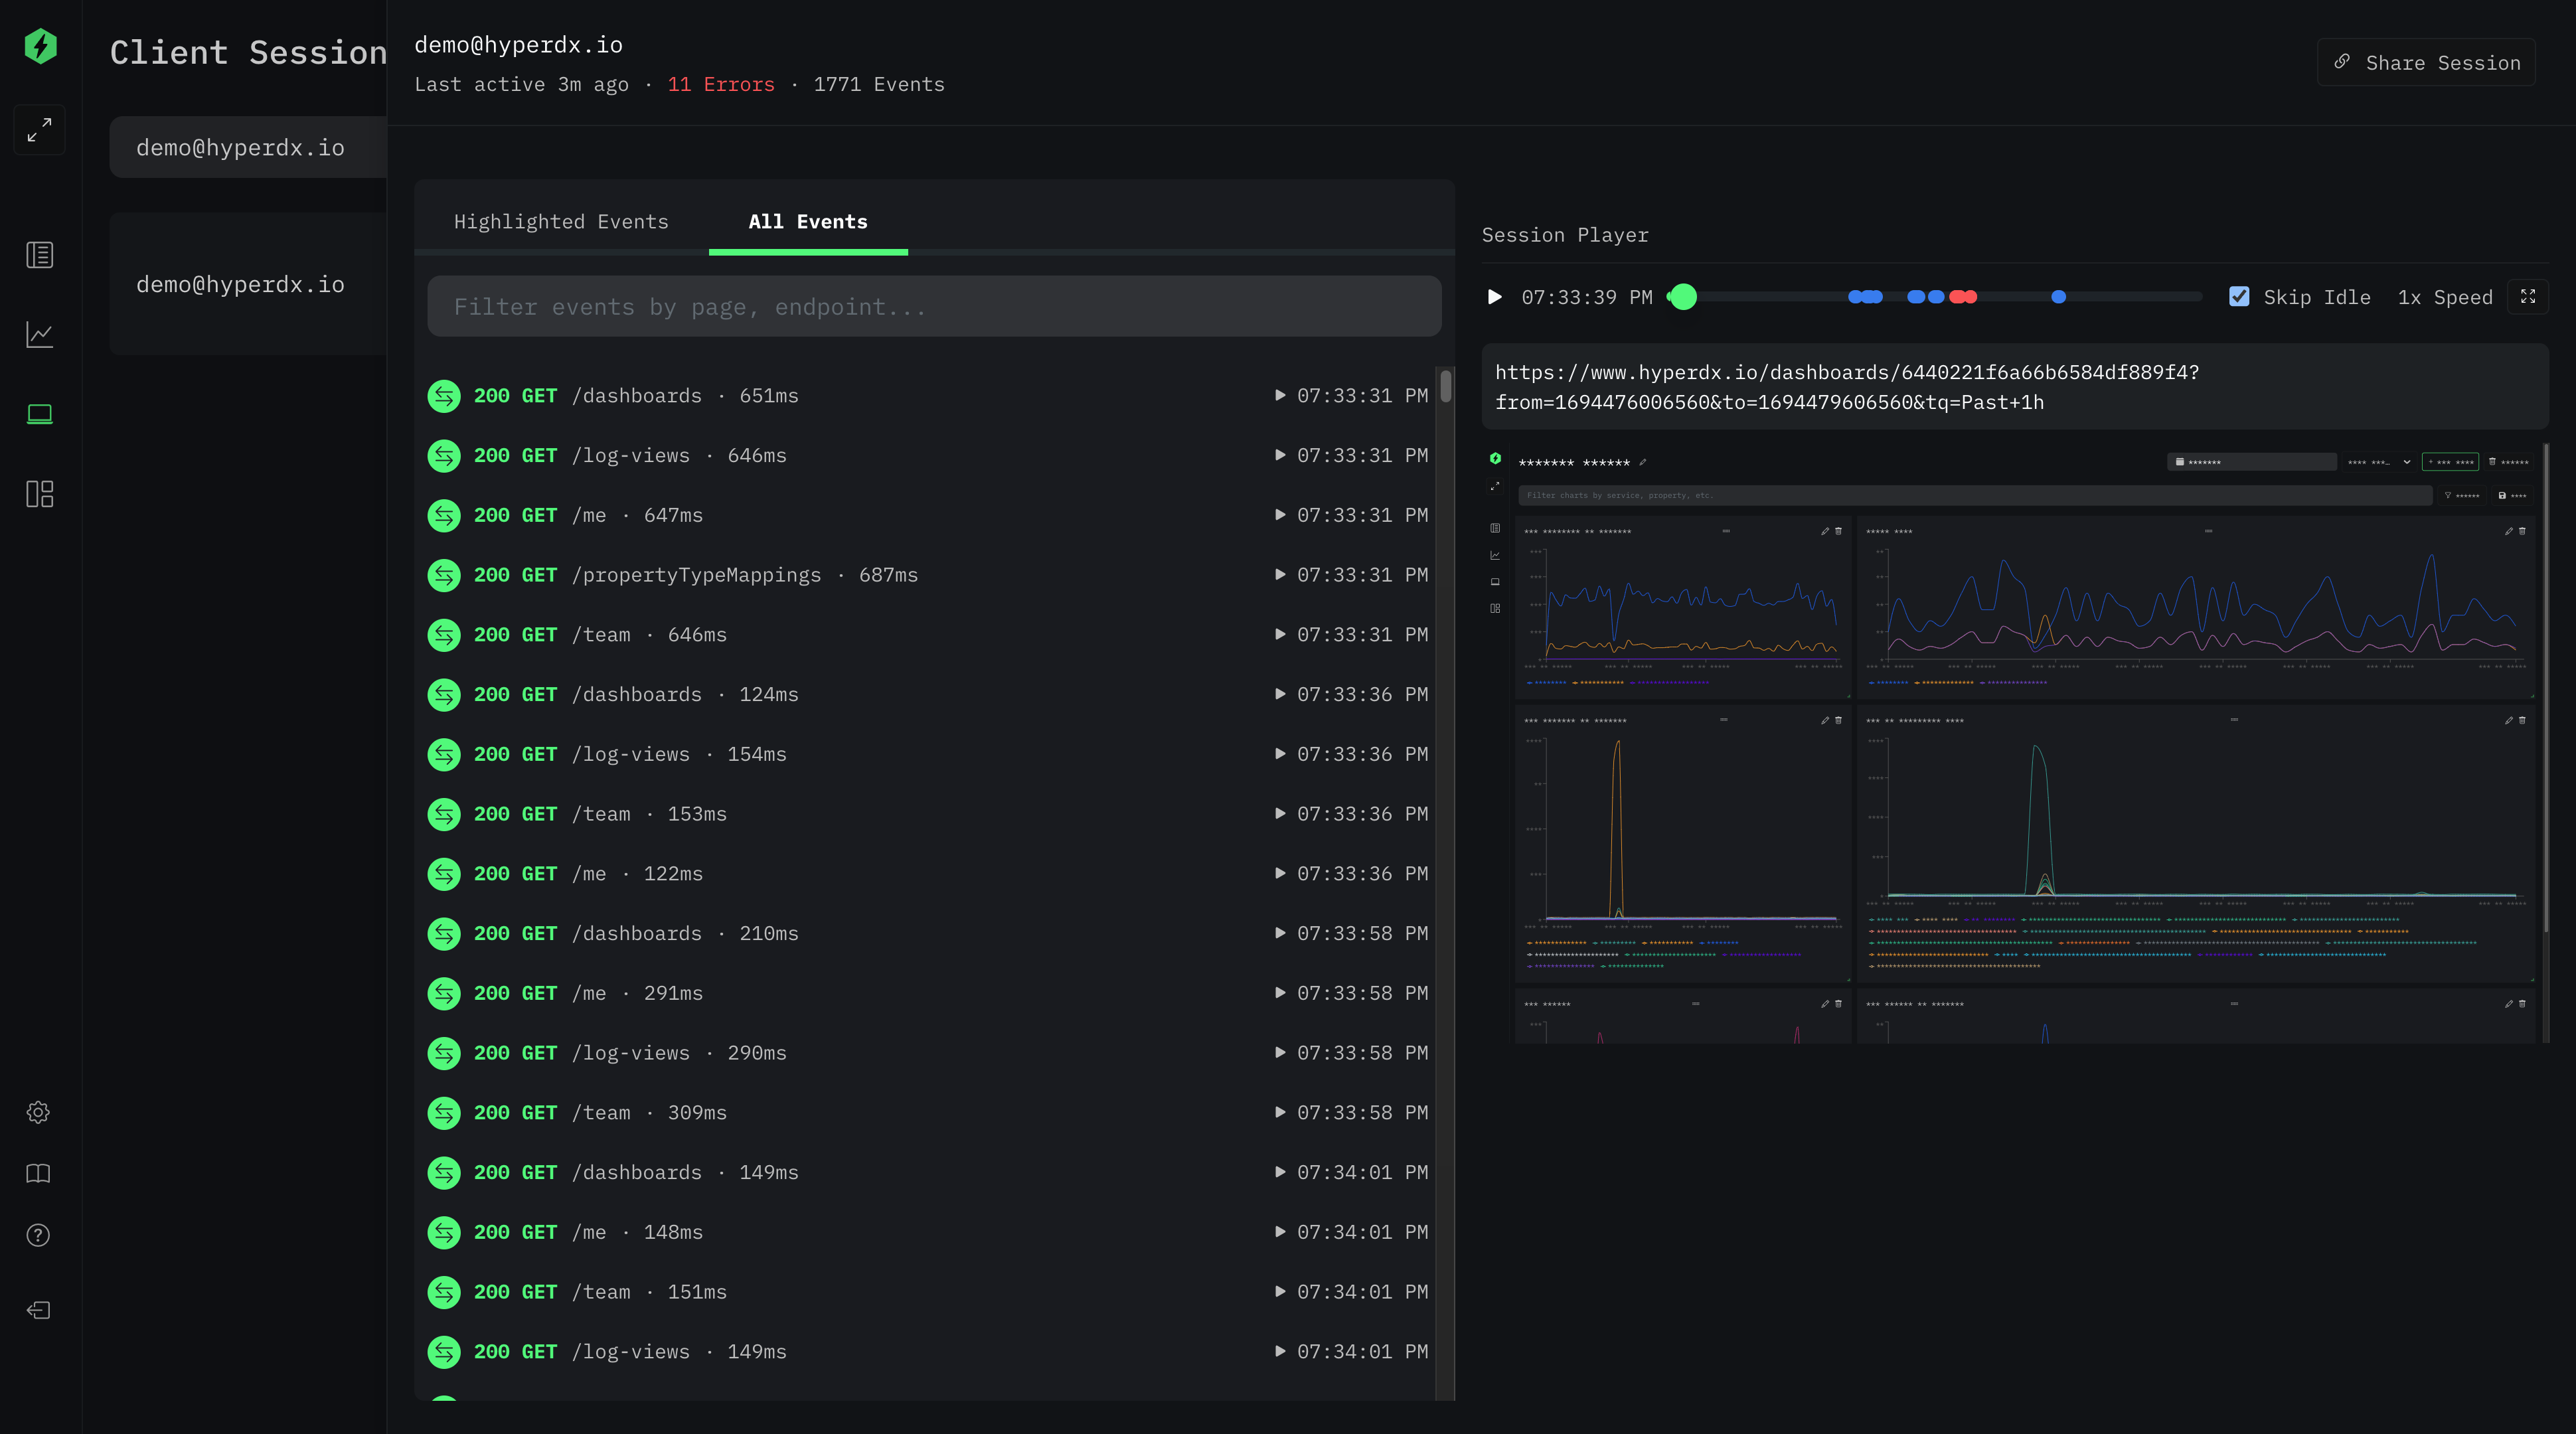
HyperDX helps engineers quickly figure out why production is broken by centralizing and correlating logs, metrics, traces, exceptions and session replays in one place. An open source and developer-friendly alternative to Datadog and New Relic.
Documentation • Chat on Discord • Live Demo • Bug Reports • Contributing
- 🕵️ Correlate end to end, go from browser session replay to logs and traces in just a few clicks
- 🔥 Blazing fast performance powered by Clickhouse
- 🔍 Intuitive full-text search and property search syntax (ex.
level:err) - ⏱️ Monitor health and performance from HTTP requests to DB queries (APM)
- 🤖 Automatically cluster event patterns from billions of events
- 📈 Dashboard high cardinality events without a complex query language
- 🔔 Set up alerts on logs, metrics, or traces in just a few clicks
{Automatic JSON/structured log parsing- 🔭 OpenTelemetry native
The HyperDX stack ingests, stores, and searches/graphs your telemetry data. After standing up the Docker Compose stack, you'll want to instrument your app to send data over to HyperDX.
You can get started by deploying a complete stack via Docker Compose. After cloning this repository, simply start the stack with:
docker compose up -dAfterwards, you can visit http://localhost:8080 to access the HyperDX UI.
If your server is behind a firewall, you'll need to open/forward port 8080, 8000 and 4318 on your firewall for the UI, API and OTel collector respectively.
We recommend at least 4GB of RAM and 2 cores for testing.
Enabling Self-instrumentation/Demo Logs
To get a quick preview of HyperDX, you can enable self-instrumentation and demo
logs by setting the HYPERDX_API_KEY to your ingestion key (go to
http://localhost:8080/team after creating your
account) and then restart the stack.
This will redirect internal telemetry from the frontend app, API, host metrics and demo logs to your new HyperDX instance.
ex.
HYPERDX_API_KEY=<YOUR_INGESTION_KEY> docker compose up -dIf you need to use
sudofor docker, make sure to forward the environment variable with the-Eflag:HYPERDX_API_KEY=<YOUR_KEY> sudo -E docker compose up -d
Changing Hostname and Port
By default, HyperDX app/api will run on localhost with port 8080/8000. You
can change this by updating HYPERDX_APP_** and HYPERDX_API_** variables in
the .env file. After making your changes, rebuild images with
make build-local.
DB Migration
Before running the migration, you'll need to install the migration tools:
- Install local dependencies with
make. - Install golang-migrate CLI.
You can initiate the DB migration process by executing make dev-migrate-db.
This will run the migration scripts in /packages/api/migrations against the
local DB.
HyperDX is also available as a hosted cloud service at hyperdx.io. You can sign up for a free account and start sending data in minutes.
To get logs, metrics, traces, session replay, etc into HyperDX, you'll need to instrument your app to collect and send telemetry data over to your HyperDX instance.
We provide a set of SDKs and integration options to make it easier to get started with HyperDX, such as Browser, Node.js, and Python
You can find the full list in our docs.
OpenTelemetry
Additionally, HyperDX is compatible with OpenTelemetry, a vendor-neutral standard for instrumenting your application backed by CNCF. Supported languages/platforms include:
- Kubernetes
- Javascript
- Python
- Java
- Go
- Ruby
- PHP
- .NET
- Elixir
- Rust
(Full list here)
Once HyperDX is running, you can point your OpenTelemetry SDK to the
OpenTelemetry collector spun up at http://localhost:4318.
Interested in using HyperDX for local development and debugging? Check out HyperDX Local, a single container local-optimized version of HyperDX that allows you to pipe OpenTelemetry telemetry (logs, metrics, traces) to a local instance of HyperDX running on your own machine.
Get started with HyperDX Local by running the following Docker command:
docker run -p 8000:8000 -p 4318:4318 -p 4317:4317 -p 8080:8080 -p 8002:8002 hyperdx/hyperdx-localWe welcome all contributions! There's many ways to contribute to the project, including but not limited to:
- Opening a PR (Contribution Guide)
- Submitting feature requests or bugs
- Improving our product or contribution documentation
- Voting on open issues or contributing use cases to a feature request
Our mission is to help engineers ship reliable software. To enable that, we believe every engineer needs to be able to easily leverage production telemetry to quickly solve burning production issues.
However, in our experience, the existing tools we've used tend to fall short in a few ways:
- They're expensive, and the pricing has failed to scale with TBs of telemetry becoming the norm, leading to teams aggressively cutting the amount of data they can collect.
- They're hard to use, requiring full-time SREs to set up, and domain experts to use confidently.
- They requiring hopping from tool to tool (logs, session replay, APM, exceptions, etc.) to stitch together the clues yourself.
We're still early on in our journey, but are building in the open to solve these key issues in observability. We hope you give HyperDX a try and let us know how we're doing!
HyperDX is open core, with most of our features available here under an MIT license. We have a cloud-hosted version available at hyperdx.io with a few additional features beyond what's offered in the open source version.
Our cloud hosted version exists so that we can build a sustainable business and continue building HyperDX as an open source platform. We hope to have more comprehensive documentation on how we balance between cloud-only and open source features in the future. In the meantime, we're highly aligned with Gitlab's stewardship model.
To suppress logs of a service, you can comment out the HYPERDX_API_KEY
environment variable in the docker-compose.yml file. The alternative is to set
the HYPERDX_LOG_LEVEL environment variable to 'error' to only log errors.


