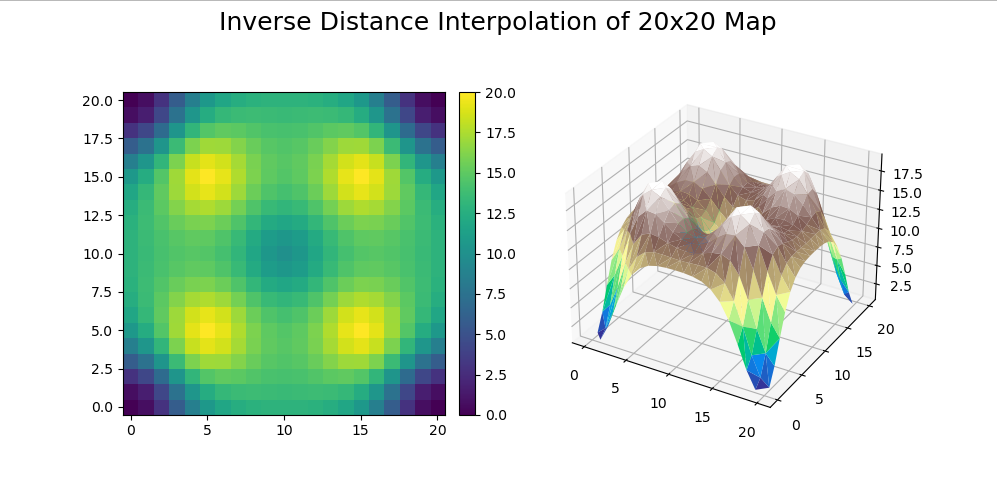
Contains different approaches to modeling terrain and topographic-style maps in python
A given point P(x, y) is determined by the values of its neighbors, inversely proportional to the distance of each neighbor.
P is more heavily influenced by nearer points via a weighting function w(x, y).
The value of P(x, y) is determined only by the closest raw data point.
This approach works best to get a "feel" for larger datasets. With few input points, the resulting map has little detail.
In the case of multiple equidistant points being closest, point values are stored, and averaged.
in progress 👷 🛠️
in progress 👷 🛠️
pip install topographynumpymatplotlib
see the requirements.txt
from topography.Map import Map
from topography.utils.io import getPointValuesFromCsv

# # make map from noise data
# noiseMaker = Noise((0, 50), (0, 50))
# noiseData = noiseMaker.getRandom(scaleFactor=1)
# M = Map(noiseData)

# make map from recorded data
rawData = getPointValuesFromCsv("tests/data/20x20.csv")
M = Map(rawData)

# # Display the inputted raw data values
M.showRawPointValues()

# interpolate the Map
M.idw(showWhenDone=True)

# Display the interpolated data values
M.showFilledPointValues()

# Save the data to a .csv file
# optionally, write to file as a matrix
# default is x, y, z
M.writeLastToCsv("idw_20x20", writeAsMatrix=True)


