The mRNA and miRNA profiles of goat bronchial epithelial cells stimulated by Pasteurella multocida strains of serotype A and D
- Published
- Accepted
- Received
- Academic Editor
- Jonathan Thomas
- Subject Areas
- Cell Biology, Genomics, Microbiology, Molecular Biology, Veterinary Medicine
- Keywords
- mRNA-Seq, miRNA-Seq, Pasteurella multocida, Goat bronchial epithelial cells, Immune response
- Copyright
- © 2022 An et al.
- Licence
- This is an open access article distributed under the terms of the Creative Commons Attribution License, which permits unrestricted use, distribution, reproduction and adaptation in any medium and for any purpose provided that it is properly attributed. For attribution, the original author(s), title, publication source (PeerJ) and either DOI or URL of the article must be cited.
- Cite this article
- 2022. The mRNA and miRNA profiles of goat bronchial epithelial cells stimulated by Pasteurella multocida strains of serotype A and D. PeerJ 10:e13047 https://doi.org/10.7717/peerj.13047
Abstract
Pasteurella multocida (P. multocida) is a zoonotic bacterium that predominantly colonizes the respiratory tract and lungs of a variety of farmed and wild animals, and causes severe respiratory disease. To investigate the characteristics of the host immune response induced by P. multocida strains of serotype A and D, high-throughput mRNA-Seq and miRNA-Seq were performed to analyze the changes in goat bronchial epithelial cells stimulated by these two serotypes of P. multocida for 4 h. Quantitative RT-PCR was used to validate the randomly selected genes and miRNAs. The results revealed 204 and 117 differentially expressed mRNAs (|log2(Fold-change)| ≥ 1, p-value < 0.05) in the P. multocida serotype A and D stimulated groups, respectively. Meanwhile, the number of differentially expressed miRNAs (|log2(Fold-change)| > 0.1, p-value < 0.05) were 269 and 290, respectively. GO and KEGG enrichment analyses revealed 13 GO terms (p-value < 0.05) and four KEGG pathways (p-value < 0.05) associated with immunity. In the serotype A-stimulated group, the immune-related pathways were the GABAergic synapse and Toll-like receptor signaling pathways, while in the serotype D-stimulated group, the immune-related pathways were the phagosome and B cell receptor signaling pathways. Based on the predicted results of TargetScan and miRanda, the differentially expressed mRNA–miRNA network of immune-related GO terms and KEGG pathways was constructed. According to the cell morphological changes and the significant immune-related KEGG pathways, it was speculated that the P. multocida serotype D strain-stimulated goat bronchial epithelial cells may induce a cellular immune response earlier than serotype A-stimulated cells. Our study provides valuable insight into the host immune response mechanism induced by P. multocida strains of serotype A and D.
Introduction
Pasteurella multocida is a common pathogen that infects humans and a variety of farmed and wild animals. This organism threatens human health as well as global animal husbandry (Mogilner & Katz, 2019). For ruminants, including goats, sheep, and cattle, serotypes of P. multocida can cause various clinical manifestations (Harper et al., 2011), and the pathogenic mechanisms mediated by P. multocida in different animals are complex. Pathogenic differences relate to variations in virulence factors and structural modifications among serotypes (Peng et al., 2019). Thus, it is essential to elucidate the specific pathogenic mechanism of P. multocida according to the serotype of the infecting strain.
According to capsule type, P. multocida can be divided into five serotypes: A, B, D, E, and F (Heddleston, Gallagher & Rebers, 1972). During P. multocida infection, virulence factors, including lipopolysaccharide, capsule, toxin, adhesion factor, iron metabolism-related protein, hyaluronidase, outer membrane protein, and sialic acid metabolism-related protein, play variable roles in pathogenesis (Wilkie et al., 2012). Boyce and Adler demonstrated that P. multocida is rapidly eliminated in the host on loss of its capsule (Boyce & Adler, 2000). Harper and colleagues observed that pcgC mutant of P. multocida VP161 strain resulted in fewer bacteria in infected chickens (Harper et al., 2007). Sellyei and coworkers proposed that ptfA gene, which encodes the fimbriae of P. multocida, plays an indispensable role in the adhesion of bacteria to host epithelial cells (Sellyei, Bányai & Magyar, 2010; Tang et al., 2009). Different virulence factors cause distinct host responses dependent on the serotypes of P. multocida.
In China, P. multocida serotype A, B, and D are the most prevalent. Epidemiological studies suggest that P. multocida serotypes A and D are commonly associated with fowl cholera, conjunctivitis, and respiratory disorders such as rhinitis and pneumonia, while serotype B is more frequently associated with hemorrhagic septicemia (Peng et al., 2019). Therefore, we selected P. multocida serotype A and D strains isolated from sheep and goat to explore the differences in host immune responses induced by these strains.
The target cells of P. multocida infection include spleen cells, liver cells, lung cells, macrophages, and epithelial cells (Kubatzky, 2012). Epithelial cells form an indispensable physical barrier (Wilson & Ho, 2013). They produce antimicrobial peptides and activate innate immune receptors, which effectively resist bacterial invasion. During P. multocida invasion of the host bronchus, adhesion to epithelial cells is vital to successful colonization and subsequent infection (Marques & Boneca, 2011). Sudaryatma and colleagues reported that P. multocida can adhere to human alveolar basal epithelial type II (A549) cells. When epithelial cells are infected by bovine respiratory syncytial virus, the adhesion ability of P. multocida can be increased 2–8-fold (Sudaryatma et al., 2018). This suggests that respiratory epithelial cell is an important physical barrier against P. multocida infection.
Zamri-Saad and coworkers established a model of pasteurellosis pneumonia in goats using P. multocida isolated from the lungs of goats, sheep, and rabbits. Goats are considered a good model in the study of pasteurellosis pneumonia, especially regarding the vaccination or pathogenesis of P. multocida (Zamri-Saad et al., 1996). Considering that the mechanisms involved in the host–bacteria interaction between goat bronchial epithelial cells and invading P. multocida remain unclear, we used goat bronchial epithelial cells to construct an infection model of P. multocida.
Transcriptome studies allow for gene transcription and transcriptional regulation to be studied in vivo or in vitro at the RNA level (Costa et al., 2010; Wang, Gerstein & Snyder, 2009). Compared with traditional Sanger sequencing technology, high-throughput sequencing technology is more sensitive, rapid, reproducible, and enables greater coverage (Cloonan et al., 2008; Morin et al., 2008; Nagalakshmi et al., 2008). RNA-Seq has been widely used to explore the mechanisms involved in host–bacteria interactions. Through comparative analysis of transcriptomes, Aprianto and colleagues found that pneumococcal adhesion inhibited the expression of IL-8 gene in human lung epithelial cells (Aprianto et al., 2016). Wu and coworkers established a P. multocida-induced pneumonia mouse model and transcriptome sequencing showed that the expression of the IL-17 gene was significantly upregulated in the lungs of P. multocida-infected mice (Wu et al., 2017). In our previous study, transcriptome sequencing and small RNA sequencing on goats challenged with P. multocida identified 2,673 significantly differentially expressed mRNAs and 56 miRNAs, some of them are involved in inflammatory response, immune effector process, and cell activation in response to endogenous stimuli (Chen et al., 2021).
In this study, we performed sequence analysis to investigate the effects of P. multocida infection with serotype A and D strains on mRNA and miRNA expression of goat bronchial epithelial cells in vitro.
Materials & Methods
Bacterial strains and culture conditions
The P. multocida strains used in this study were previously isolated and stored by Hainan Key Lab of Tropical Animal Reproduction, Breeding and Epidemic Disease Research (Cao et al., 2018). Briefly, serotype A P. multocida HN02 strain (GenBank Accession Number: CP037865.1) and serotype D P. multocida HN01 (GenBank Accession Number: CP037861.1) were isolated from the lung tissue of a sheep and a Hainan black goat, respectively, both of which had died of pneumonia. The strains were confirmed by amplifying the 16S rRNA using the primers: hyaD-hyaC (serotype A specific primers) and dcbF (serotype D specific primer). The PCR cycling conditions were as follows: an initial denaturation of 5 min at 95 °C, then 30 cycles of 50 s at 95 °C, 1.5 min at 60 °C, and 1.5 min at 72 °C, followed by 5 min at 72 °C. The products were detected by agarose gel electrophoresis. The bacterial strains were cultured in Tryptic Soy Broth (TSB) (Hopebio, China) supplemented with 5% (v/v) bovine serum (Sijiqing, China) at 37 °C overnight and were stored at −20 °C in glycerol at a final concentration of 12.5%. The resuscitated bacterial strains were identified according to the above steps.
Cell culture
Goat bronchial epithelial cells were obtained from a healthy 7-month-old female goat (iCell Bioscience Inc., Shanghai, China). Cells were cultured in 25-cm2 cell culture flasks in 5% CO2 at 37 °C. The medium was epithelial cell culture medium containing 2% fetal bovine serum (FBS) (PriMed-iCell-001, iCell Bioscience Inc.). Passage was carried out when the confluence of cells was >85%. In brief, the cultured cells were washed twice with sterile phosphate-buffered saline (PBS), then digested with trypsin (HyClone, Logan, Utah, USA). Digestion was stopped by adding RPMI 1640 medium (Sangon Biotech, Shanghai, China) containing 10% FBS. Cells were then centrifuged, resuspended in new culture flasks, and cultured.
P. multocida stimulation experiments
The stored P. multocida serotype A and D strains were resuscitated on soybean-casein digest agar medium (TSA) (Hopebio, China) containing 10% (v/v) bovine serum at 37 °C overnight, and then monoclonal colonies were inoculated into 20 mL of TSB. Based on the pre-determined growth curves and standard linear equations of the two strains (Figs. S1 and S2), cultures with an optical density (OD) of 0.6 at 600 nm (approximately 2 × 10⁹ CFU/mL) were used to prepare infection suspensions with a multiplicity of infection (MOI) of 100. Goat bronchial epithelial cells were then incubated with one mL of infection suspension for 4 h after three passages, whereas cells in the control group were added to one mL of epithelial cell culture medium containing 10% FBS (Gibco, Invitrogen, USA). Extracellular bacteria were removed by washing three times with sterile PBS. After rinsing three times with primary epithelial cell culture medium containing 10% FBS and 200 µg/mL gentamycin, cells were washed again with PBS and harvested with Trizol (Invitrogen, Carlsbad, CA, USA). The lysates were frozen in liquid nitrogen. The experiments were repeated three times.
mRNA library construction and sequencing
Nine cell samples from three different treatments, designated Ctrl_1/2/3, A_T4 h_1/2/3, and D_T4 h_1/2/3, were sent to Lc-Bio Technologies Co., Ltd. (Hangzhou, China) for mRNA-Seq analysis. In brief, total RNA from each sample was extracted using Trizol reagent following the manufacturer’s procedure. RNA quantity and purity were confirmed using an Agilent 2100 Bioanalyzer (Agilent technologies Santa Clara, CA, USA) with RNA 1000 Nano LabChip kit (Agilent, CA, USA). Next, mRNAs were enriched using oligo(dT)-attached magnetic beads and fragmented into small pieces using divalent cations under an elevated temperature. A reverse transcription reaction was performed to obtain double-stranded cDNA. Following cDNA purification with AMPure XP beads, T4 and Klenow DNA polymerases were used to generate blunt ends. Modifications to the 3′ ends included adenylation and adapt ligation. AMPure XP beads were used to select fragments, followed by PCR to obtain the cDNA library. Paired-end sequencing was performed on an Illumina Novaseq™ 6000 (Illumina, San Diego, CA, USA) following the manufacturer’s protocol. The raw data were deposited into the NCBI Sequence Read Archive (SRA) under accession number PRJNA655134.
miRNA library construction and sequencing
MiRNA library construction and sequencing were carried out as previously described in Pang et al. (2019) study. The raw data were deposited into the NCBI SRA under accession number PRJNA655261.
Bioinformatic analysis of mRNA sequencing data
To obtain valid data (clean data), the raw data were processed by cutadapt software (Version 1.9) to filter out the low-quality reads, as well as reads with adapters, reads containing more than 5% unknown nucleotides (N). The valid data were then mapped to the reference genome (GCF_001704415.1) using Hisat (Version 2.0) and information was recorded, including read statistics, regional distribution, and principal component analysis (PCA). StringTie (Version 1.3.0) was used to analyze the expression levels of genes by calculating fragments per kilobase of the exon model per million mapped reads (FPKM). The selected standards for differentially expressed genes between different treatment groups were —log2 (Fold-change)— ≥ 1 and statistical significance (p-value<0.05). The Kyoto Encyclopedia of Genes and Genomes (KEGG) database (http://www.kegg.jp/kegg) and Gene Ontology (GO) database (http://geneontology.org) were used for pathway annotation of the differentially expressed genes.
Bioinformatic analysis of miRNA sequencing data
The analysis of miRNA was carried out according to the method of Li et al.’s (2021a). And a previously reported method (Li et al., 2016; Cer et al., 2014) was used to normalize the expression levels of miRNA. MiRNAs with —log2 (Fold-change)— > 0.1 and p-value < 0.05 were regarded as differentially expressed.
Targeted prediction of differentially expressed miRNAs
TargetScan (Version 3.3a) and miRanda (Version 3.3a) software were used to predict the target genes of miRNAs with significant differences. The predicted target genes were screened as follows. In TargetScan, the target genes with a context score percentile less than 50 were removed, while in the miRanda algorithm, target genes with a max free energy greater than −10 were removed. The common target genes predicted by both two softwares were screened for the final target genes of differentially expressed miRNAs.
qRT-PCR validation
To validate the differentially expressed genes and miRNAs from multiple samples, qRT-PCR was performed using the previously extracted total RNA. Briefly, following removal of the genomic DNA from the total RNA, first-strand cDNA was synthesized using the RevertAid First Strand cDNA Synthesis Kit (Thermo Fisher Scientific, MA, USA) according to the manufacturer’s protocol. Genes and miRNAs were randomly selected for qRT-PCR validation. Primers were designed using the Primer Premier software (Version 5.0, PRIMER Biosoft International, Palo Alto, CA, USA) and the sequences are shown in Table 1. The qRT-PCR was performed using a SYBR® Select Master Mix (ABI, CA, USA), and the following was the thermal cycle profile: pre-degeneration at 95 °C for 10 min, then 40 cycles of 95 °C for 15 s, 60 °C for 1 min, followed by 95 °C for 15 s (tested once every 0.3 °C temperature rise). Expression levels of mRNAs and miRNAs were normalized to GAPDH and U6 expression, respectively. Reactions were performed in triplicate and one reaction for each gene was randomly selected for agarose gel electrophoresis. StepOne software (Version 2.3) was used along with the Δ ΔCT method for data analysis.
| Name | Primer Sequence (5′–3′) | Tm (°C) | Size (bp) |
|---|---|---|---|
| IRF7 | F: GCAAAGTCTACTGGGAGGTGG | 61.1 | 101 |
| R: GAAGTCAAAGATGGGCGTGTC | 62 | ||
| IL1A | F: AATAATCTGGAGGAGGCA | 53 | 138 |
| R: CTTTAGCAAGACGGGTTC | 53.4 | ||
| TNFSF18 | F: TGGCTCCTCTACTCAACA | 52.3 | 110 |
| R: GGTCCAAACTTCGCTACA | 54.6 | ||
| SPP1 | F: ATGATGGCCGAGGTGATA | 57.3 | 180 |
| R: TGGTTTCTTCGCTGTGGT | 57.7 | ||
| DUSP4 | F: AGCACAGCGGAGTCTTTGGA | 63.4 | 190 |
| R: CGAAGTGGTTTGGGCAGTCA | 64.5 | ||
| IL12RB2 | F: TGTTCACTGGCACTTACTT | 51.5 | 153 |
| R: GCCTTGTTTGGGCTTCA | 58.2 | ||
| IL6R | F: GGCAACATCTCAGTCAGCG | 60.6 | 197 |
| R: CCACTCCAGGCATCACG | 59.7 | ||
| CARD14 | F: ACTTGAGCCAGGAGGAGTATGAC | 61 | 136 |
| R: AGGAGGGCGTGGGTGTTCT | 64.3 | ||
| GAPDH | F: CTCTCTGCTCCTGCCCGTTC | 64.8 | 241 |
| R: TGTGCCGTGGAACTTGCCAT | 67.1 | ||
| Chi-let-7i-5p | F: ACACTCCAGCTGGGTGAGGTAGTAGTTTGT | 69.1 | 72 |
| R: CTCAACTGGTGTCGTGGAGTCGGCAATTCAGTTGAGAACAGCAC | 86.8 | ||
| Chi-miR-15b-3p | F: ACACTCCAGCTGGGCGAATCATTATTTGC | 73.8 | 71 |
| R: CTCAACTGGTGTCGTGGAGTCGGCAATTCAGTTGAGAGAGCAGC | 87.4 | ||
| bta-miR-138 | F: ACACTCCAGCTGGGAGCTGGTGTTGTGAATC | 76.6 | 73 |
| R: CTCAACTGGTGTCGTGGAGTCGGCAATTCAGTTGAGCGGCCTGA | 90.8 | ||
| bta-miR-2285i_R+1_1SS6CT | F: ACACTCCAGCTGGGAAAACTGGAACGAACTT | 74.6 | 73 |
| R: CTCAACTGGTGTCGTGGAGTCGGCAATTCAGTTGAGGCCAAAAA | 87.8 | ||
| U6 | F:CTCGCTTCGGCAGCACA | 59.3 | 94 |
| R: AACGCTTCACGAATTTGCGT | 60.8 | ||
| URP | TGGTGTCGTGGAGTCG | 49.4 |
Results
Changes in cell morphology
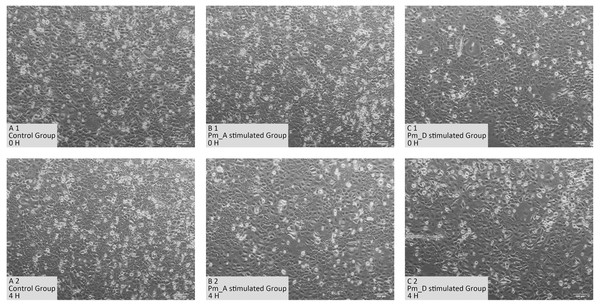
As shown in Fig. 1, normal goat bronchial epithelial cells are cobblestone-like adherent cells. After 4 h stimulation with the P. multocida strain of serotype A, the intercellular space became larger and some cells became rounded and non-adherent. When stimulated with the P. multocida strain of serotype D, more cells were non-adherent and showed irregular morphology.
Figure 1: Cellular changes in goat bronchial epithelial cells stimulated with P. multocida strains of serotype A and D strains for 4 h.
(A1)–(C1) Cell morphology of unstimulated group and stimulated groups at 0 h. (A2)–(C2) Cell morphology of unstimulated group and stimulated groups at 4 h.Quality checking of RNA-seq data
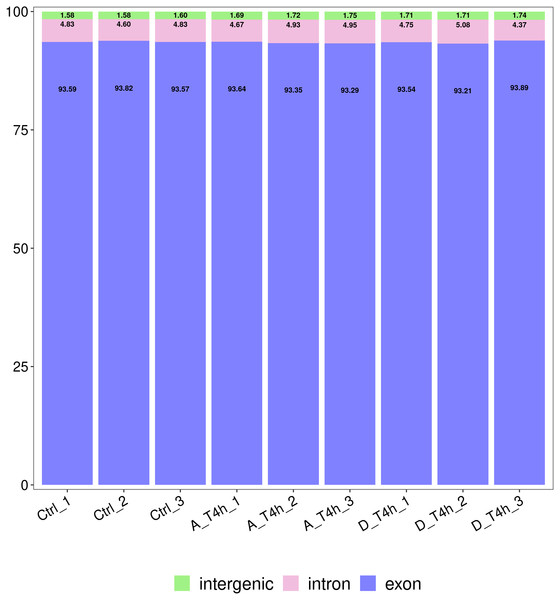
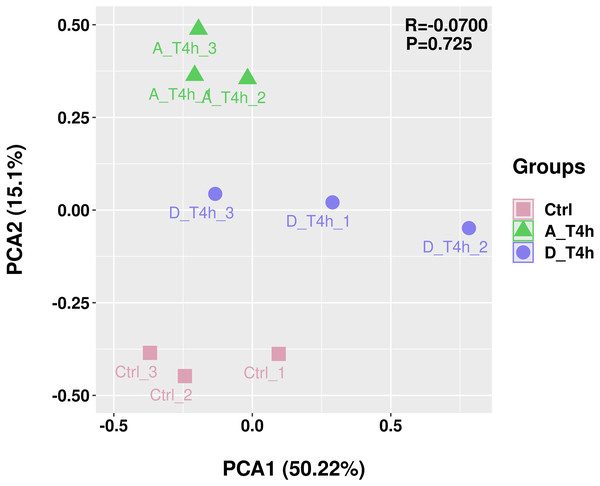
The statistical power of the experimental design was checked using RNASeqPower (https://bioconductor.org/packages/release/bioc/html/RNASeqPower.html) and was 0.98. The amount of raw data generated by each sample is shown in Table 2. After filtering, 25,883,644-47,830,984 valid data were obtained from each sample and the valid ratios were all above 96.5% (Table 2). As shown in Table 3, after comparison with the reference genome, the number of mapped reads was above 97%, which indicates the samples were of high quality. In addition, statistical analysis of the genomic structure of valid reads showed that exons accounted for above 93% (Fig. 2). PCA was used to reduce the dimension of the sequencing data (Fig. 3). It showed that the 1st principal component (PC1) contained 50.22% of the variance, while the 2nd principal component (PC2) contained 15.1% of the variance. Our PCA results revealed that after z-score normalization processing, the samples from the same treatment clustered together, whereas the control group and the two experimental groups were separate. It confirmed the reproducibility of the samples.
| Sample | Raw data | Valid data | Valid ratio (reads) | Q20% | Q30% | GC content% | ||
|---|---|---|---|---|---|---|---|---|
| Read | Base | Read | Base | |||||
| Ctrl_1 | 40010384 | 6.00G | 38763418 | 5.81G | 96.88 | 99.98 | 98.18 | 48 |
| Ctrl_2 | 46491232 | 6.97G | 45219788 | 6.78G | 97.27 | 99.98 | 98.02 | 48 |
| Ctrl_3 | 49210810 | 7.38G | 47830984 | 7.17G | 97.20 | 99.98 | 98.17 | 48 |
| A_T4 h_1 | 47608500 | 7.14G | 46391112 | 6.96G | 97.44 | 99.98 | 97.95 | 48 |
| A_T4 h_2 | 44011732 | 6.60G | 42667940 | 6.40G | 96.95 | 99.98 | 98.07 | 47.50 |
| A_T4 h_3 | 47924786 | 7.19G | 46453594 | 6.97G | 96.93 | 99.98 | 98.12 | 47 |
| D_T4 h_1 | 36983278 | 5.55G | 35864016 | 5.38G | 96.97 | 99.98 | 98.10 | 48 |
| D_T4 h_2 | 26730382 | 4.01G | 25883644 | 3.88G | 96.83 | 99.98 | 98.29 | 47 |
| D_T4 h_3 | 45917970 | 6.89G | 44608748 | 6.69G | 97.15 | 99.98 | 98.02 | 48 |
| Sample | Valid reads | Mapped reads | Unique mapped reads | Multi mapped reads | PE mapped reads | Reads map to sense strand | Reads map to antisense strand | Non- splice reads | Splice reads |
|---|---|---|---|---|---|---|---|---|---|
| Ctrl_1 | 38763418 | 37807871 (97.53%) | 29868004 (77.05%) | 7939867 (20.48%) | 33206340 (85.66%) | 17225038 (44.44%) | 17241395 (44.48%) | 18910088 (48.78%) | 15556345 (40.13%) |
| Ctrl_2 | 45219788 | 44078884 (97.48%) | 34709549 (76.76%) | 9369335 (20.72%) | 39391476 (87.11%) | 20125676 (44.51%) | 20143520 (44.55%) | 22056988 (48.78%) | 18212208 (40.27%) |
| Ctrl_3 | 47830984 | 46684392 (97.60%) | 36836297 (77.01%) | 9848095 (20.59%) | 41250982 (86.24%) | 21183939 (44.29%) | 21203482 (44.33%) | 23172307 (48.45%) | 19215114 (40.17%) |
| A_T4 h_1 | 46391112 | 45138922 (97.30%) | 35482143 (76.48%) | 9656779 (20.82%) | 40177014 (86.60%) | 20497427 (44.18%) | 20517519 (44.23%) | 22870956 (49.30%) | 18143990 (39.11%) |
| A_T4 h_2 | 42667940 | 41515873 (97.30%) | 32665549 (76.56%) | 8850324 (20.74%) | 36387522 (85.28%) | 18850948 (44.18%) | 18868646 (44.22%) | 21133437 (49.53%) | 16586157 (38.87%) |
| A_T4 h_3 | 46453594 | 45235688 (97.38%) | 35554191 (76.54%) | 9681497 (20.84%) | 39646378 (85.35%) | 20559852 (44.26%) | 20578799 (44.30%) | 23319895 (50.20%) | 17818756 (38.36%) |
| D_T4 h_1 | 35864016 | 34962146 (97.49%) | 27584731 (76.91%) | 7377415 (20.57%) | 30704328 (85.61%) | 15905496 (44.35%) | 15922287 (44.40%) | 17892395 (49.89%) | 13935388 (38.86%) |
| D_T4 h_2 | 25883644 | 25253083 (97.56%) | 20025119 (77.37%) | 5227964 (20.20%) | 21647082 (83.63%) | 11457350 (44.26%) | 11467649 (44.30%) | 12921853 (49.92%) | 10003146 (38.65%) |
| D_T4 h_3 | 44608748 | 43465480 (97.44%) | 34140391 (76.53%) | 9325089 (20.90%) | 38273354 (85.80%) | 19693887 (44.15%) | 19712295 (44.19%) | 22384493 (50.18%) | 17021689 (38.16%) |
Figure 2: Statistical analysis of the genomic structure of valid reads.
The vertical axis shows the proportions of the three gene structures.Figure 3: Principal component analysis (PCA) plot.
Different colors and shapes represent different groups, each with three replicates.Differential expression analyses of mRNAs and miRNAs
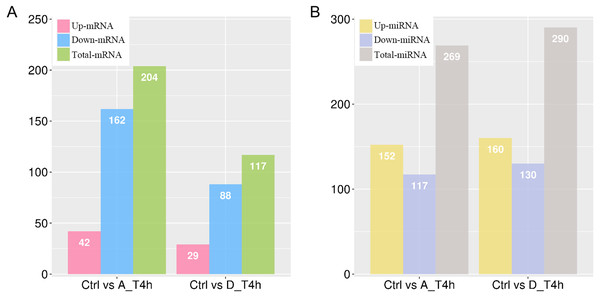
Based on the criterion of —log2 (Fold-change)— ≥ 1 and a p-value < 0.05, 204 (42 upregulated and 162 downregulated) and 117 (29 upregulated and 88 downregulated) differentially expressed mRNAs were identified in the P. multocida serotype A- and D-stimulated groups, respectively (Fig. 4A, Tables S1 and S2). When the criterion was changed to —log2 (Fold-change)— > 0.1 and a p-value < 0.05, the differentially expressed miRNAs were screened out in both groups (Tables S3 and S4). As shown in Fig. 4B, contrary to the number of differentially expressed mRNAs, the number of upregulated miRNAs exceeded that of downregulated miRNAs.
Figure 4: The numbers of differentially expressed mRNAs (A) and miRNAs (B) in P. multocida strain serotype A and D stimulated goat bronchial epithelial cells.
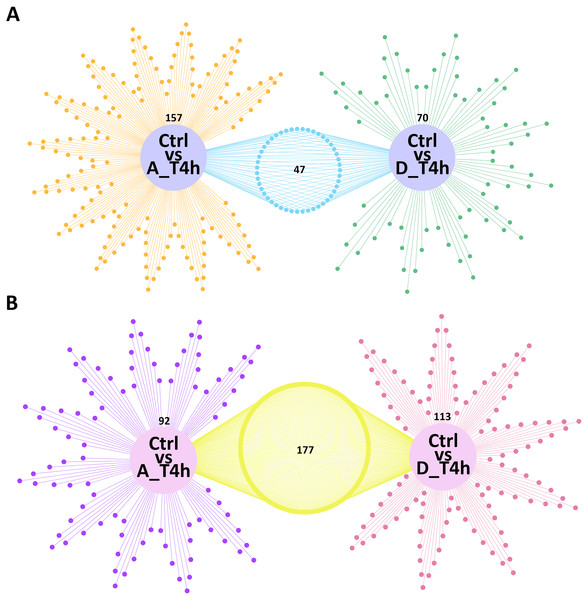
(A) and (B) The number of upregulated and downregulated differentially expressed mRNAs and miRNAs in the two groups.Venn network diagrams depicted the overlap among the differentially expressed mRNAs and miRNAs from the pairwise comparisons. In total, 157 and 70 specific intergroup differentially expressed mRNAs were detected in the P. multocida serotype A- and D-stimulated groups, respectively (Fig. 5A), compared with 92 and 113 differentially expressed miRNAs, respectively (Fig. 5B).
Figure 5: Venn network diagrams of the differentially expressed mRNAs (A) and miRNAs (B).
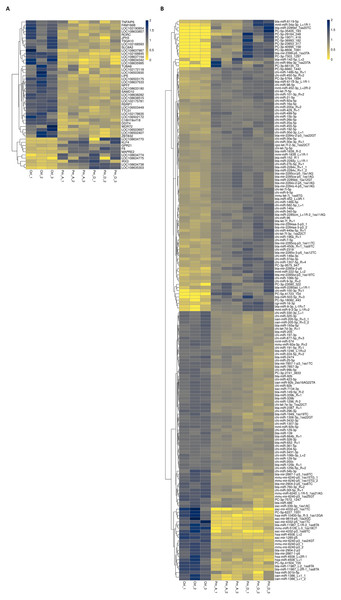
(A) The orange (left) and green (right) dots represent the differentially expressed mRNAs unique to the Ctrl vs A_T4 h and Ctrl vs D_T4 h groups, respectively. The blue (middle) dots represent the differentially expressed mRNAs shared by the two groups. (B) The purple (left) and rose red (right) dots represent the differentially expressed miRNAs unique to the Ctrl vs A_T4 h and Ctrl vs D_T4 h groups, respectively. The yellow (middle) dots represent differentially expressed miRNAs shared by the two groups.Heat maps showed that most shared differentially expressed mRNAs were downregulated in expression (Fig. 6A), while only half of the miRNAs showed this trend (Fig. 6B).
Figure 6: Heat map of common differentially expressed mRNAs (A) and miRNAs (B).
(A) The FPKM of 47 differentially expressed mRNAs shared by the two stimulated groups were used to do the heat map. (B) The FPKM of 177 differentially expressed miRNAs shared by the two stimulated groups were used to do the heat map. The data were standardized with z-score.GO and KEGG pathway analyses
As shown in Fig. 7, among the top 30 GO terms in each comparison group, the differentially expressed mRNAs were mainly enriched in biological processes. In the P. multocida strain serotype A-stimulated group, the GO terms with the most significant and the highest number of differentially expressed mRNAs were metanephros development (GO:0001656) and hormone activity (GO:0005179). The dysregulated mRNAs were mostly concentrated in GO terms that related to cell differentiation and proliferation (GO:0060501, GO:0010837, GO:0030182, GO:0045617, GO:0048514, GO:0032331). In the P. multocida strain serotype D-stimulated group, some differentially expressed mRNAs were annotated in immune responses (GO:0002264, GO:2000342, GO:0045415), oxidative stress (GO:0010310, GO:1903706, GO:0046985), and intracellular signal transduction (GO:1902532, GO:0097066, GO:0031769, GO:0036315, GO:0071889).
Figure 7: GO enrichment analysis of the differentially expressed mRNAs (top 30, p-value< 0.05).
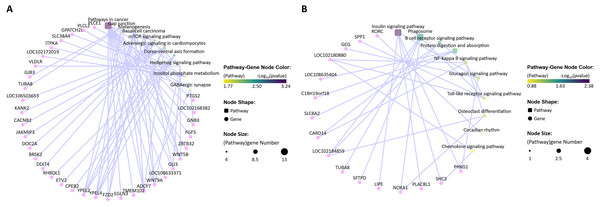
(A) GO enrichment analysis of the differentially expressed mRNAs in the P. multocida strain serotype A-stimulated group. (B) GO enrichment analysis of the differentially expressed mRNAs in the P. multocida strain serotype D-stimulated group.Through KEGG analysis, the most significantly enriched pathways for the dysregulated mRNAs in the P. multocida strain serotype A- and D-stimulated groups were pathways involved in cancer and insulin signaling (p-value < 0.05), respectively (Fig. 8). Compared with the P. multocida strain serotype D-stimulated group, the number of differentially expressed mRNAs enriched in the significant pathways was higher in the serotype A-stimulated group. However, the dysregulated mRNAs in the serotype D-stimulated group were significantly enriched in immune related pathways.
Figure 8: KEGG enrichment analysis of the differentially expressed mRNAs (top 10).
(A) KEGG enrichment analysis of the differentially expressed mRNAs in the P. multocida strain serotype A-stimulated group. (B) KEGG enrichment analysis of the differentially expressed mRNAs in the P. multocida strain serotype D-stimulated group.qRT-PCR validation
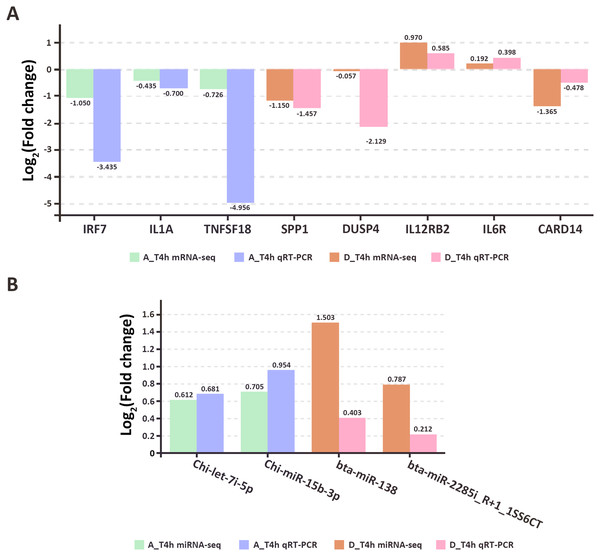
To assess the accuracy and reliability of the high-throughput sequencing results, eight genes (IRF7, IL1A, TNFSF18, SPP1, DUSP4, IL12RB2, IL6R, CARD14) and four miRNAs (Chi-let-7i-5p, Chi-miR-15b-3p, bta-miR-138, bta-miR-2285i_R+1_1SS6CT) were randomly selected for qRT-PCR validation. The results confirmed the correlation between the high-throughput sequencing data and the qRT-PCR results (Fig. 9, Table S5).
Figure 9: The qRT-PCR results of randomly selected genes (A) and miRNAs (B).
Correlation analysis of mRNAs and miRNAs
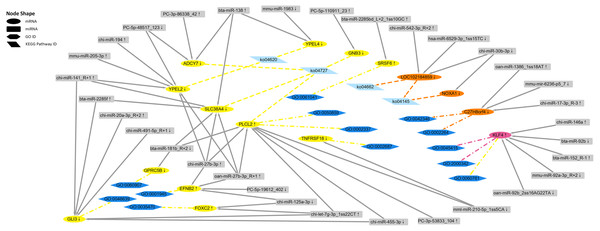
According to the immune-related GO (p-value < 0.05) and KEGG (p-value < 0.05) enrichment results and the targeted relationship between miRNA and mRNA (Table S6–S13), 15 dysregulated mRNAs and 32 dysregulated miRNAs were selected to build the mRNA–miRNA network (Fig. 10). Through the network diagram, we discovered that one common gene (KLF4), which was differentially expressed in the two comparison groups, was annotated as negative regulation of the interleukin-8 biosynthetic process (GO:0045415), negative regulation of chemokine (C-X-C motif) ligand 2 production (GO:2000342), and negative regulation of the response to cytokine stimulus (GO:0060761). The first two GO terms were significant in both the P. multocida strain serotype A- and D-stimulated groups, while the other GO term was significant only in the serotype A-stimulated group. In addition, the dysregulated gene C27H8orf4, which was unique to the serotype D-stimulated group, was annotated as endothelial cell activation involved in the immune response (GO:0002264) and positive regulation of NF-kappa B imported into the nucleus (GO:0042346), while another unique gene LOC102184859 was enriched in the B cell receptor signaling pathway (ko04662). Regarding the dysregulated genes specific to the serotype A-stimulated group, PLCL2 predicted the largest number of miRNAs, which were enriched in the negative regulation of the B cell receptor signaling pathway (GO:0050859), B-1a B cell differentiation (GO:0002337), and GABAergic synapse (ko04727).
Figure 10: The regulatory networks of the target differentially expressed mRNAs and miRNAs.
The yellow ellipses represent the differentially expressed mRNAs in the P. multocida strain serotype A-stimulated group. The orange ellipses represent the differentially expressed mRNAs in the P. multocida strain serotype D-stimulated group. The rose red ellipse represents the differentially expressed mRNA in both of the two stimulated groups. The gray rectangles represent the predicted differentially expressed miRNAs that target to the above mRNAs. The dark blue hexagons and light blue parallelograms represent enrichment to immune-related GO term (p-value < 0.05) and KEGG Pathways (p-value < 0.05), respectively. The yellow and orange lines represent the GO terms and KEGG Pathways enriched in P. multocida strain serotype A and D stimulated groups, respectively. The rose red lines represent the GO terms enriched in both of the two stimulated groups. The arrows after the mRNA and miRNA names indicate upregulated/downregulated expression.Discussion
We first observed morphological changes in goat epithelial cells over different time periods and different doses when detecting the degree of damage caused to the cells by invading bacteria. When the stimulant was the P. multocida strain of serotype A at a MOI of 10 and the stimulation time was 2 h, the stimulated goat epithelial cells adhered well, but the intercellular spaces became larger. After 4 to 6 h of incubation, a large number of cells detached and cell death was observed, along with a significant increase in the number of P. multocida. After culturing for a further 2 h, the cell death rate increased and only a small number of cells remained adherent. At a MOI of 100 and a stimulation time of 2 to 4 h, the cells became rounded and detached, some cells died, and the number of P. multocida increased After 6 to 8 h of infection, almost no normal cells were observed, along with significant multiplication of P. multocida. At a MOI of 500, significant cell death was observed within 2 to 4 h of infection, and only a few cells remained adherent. After 8 h of infection, the number of P. multocida cells was significantly higher than that at a MOI of 100. When the stimulant was the P. multocida strain of serotype D, the cell changes were similar to those observed for the P. multocida serotype A strain. Therefore, we selected a MOI of 100 and a stimulation time of 4 h as the infection conditions for subsequent experiments.
MiRNAs are known to either inhibit translation of target mRNAs or facilitate their deadenylation and subsequent degradation (Fabian, Sonenberg & Filipowicz, 2010). In both stimulation groups, the number of downregulated mRNAs was significantly higher than upregulated mRNAs, while miRNAs showed the opposite trend (Fig. 4). Although several miRNAs are associated with the increased expression of target mRNAs (Stavast & Erkeland, 2019), mammalian miRNAs primarily act to reduce target mRNA levels (Guo et al., 2010). Our statistical results again supported the regulatory effect of miRNAs on target mRNAs.
In the P. multocida strain serotype A-stimulated group, the significant KEGG pathways related to immunity were GABAergic synapse (ko04727) and the Toll-like receptor signaling pathway (ko04620). A recent study reported that GABAergic neurotransmission plays an important role in central nervous system physiology and cellular immune regulation, and revealed a new “synapse—muscular insulin—intestinal innate immunity” signaling axis, which may help to maintain immunological homeostasis and promote host survival (Zheng et al., 2021). As shown in Fig. 10, GNB3 (G protein subunit beta 3), ADCY7 (adenylate cyclase 7), SLC38A4 (solute carrier family 38 member 4), and PLCL2 (phospholipase C like 2) were enriched in the GABAergic synapse pathway. With the exception of PLCL2, the other three genes were downregulated in expression in the P. multocida strain serotype A treatment group compared with the control group. GNB3 is an isoform of the heterotrimeric G protein β subunit and an important mediator of transmembrane signaling (Ye et al., 2014; Ford et al., 1998). A previous study reported that GNB3 polymorphisms are associated with lung disease (Buroker et al., 2010). He and colleagues further demonstrated that GNB3 polymorphisms may protect against high altitude pulmonary edema progression (He et al., 2017). Since P. multocida mainly causes pneumonia in goats and sheep, GNB3 may also play a role in bacterial pneumonia. ADCY7 protein is one of a family of 10 enzymes that convert ATP to the ubiquitous second messenger cAMP, which regulates innate and adaptive immune functions (Luo et al., 2017). Cruz and colleagues confirmed that ADCY7 is important in corticotropin releasing factor modulation of presynaptic GABA release in the central amygdala (Cruz et al., 2011). In addition, inhibition of ADCY7 expression upregulates the expression of immune-related genes (Duan et al., 2010; Jiang, Sternweis & Wang, 2013; Risøe et al., 2015). In the current study, the expression of ADCY7 in goat bronchial epithelial cells was downregulated following stimulation with the P. multocida strain of serotype A. Downregulation of ADCY7 may activate the GABAergic synapse pathway, potentially inducing the host immune response. Research has shown that SLC38A4 depletion can repress hepatocellular carcinoma tumorigenesis in vivo (Li et al., 2021b). Furthermore, in a polymorphism study, SLC38A4 rs2429467C >T consistently showed significant associations with lung cancer (Lee et al., 2016). Therefore, SLC38A4 may play a crucial role in pneumonia caused by P. multocida infection. PLCL2 has been identified as a susceptibility gene (Arismendi et al., 2015), so inhibition of PLCL2 expression may suppress the infection of P. multocida.
In addition, 11 differentially expressed miRNAs were identified in the current study that may regulate GNB3, ADCY7, SLC38A4, and PLCL2 (Fig. 10), seven of which were upregulated. The expression levels of targeted mRNAs and miRNAs usually show the opposite trend. Ten pairs of mRNA–miRNAs conformed this regulatory relationship, and bta-miR-138 was the only miRNA that simultaneously regulated two genes (ADCY7 and SLC38A4). By qRT-PCR, Singh and colleagues verified that the expression of bta-miR-138 in peripheral blood mononuclear cells stimulated by Toll-like receptors (TLRs) was increased (Singh et al., 2016). Our sequencing results confirmed that the expression of bta-miR-138 was significantly increased after P. multocida strain serotype A stimulation. According to the mRNA–miRNA network diagram, YPEL4 (yippee-like 4) was also a target gene of bta-miR-138, and this gene was enriched in the TLR signaling pathway. Therefore, bta-miR-138 may play a role in the immune response induced by P. multocida.
YPEL2 (yippee-like 2) was also enriched in the TLR signaling pathway. TLRs are protective immune sentries that are known for their role in innate immunity, detecting and defending against microbial pathogens (Lim & Staudt, 2013; Brennan & Gilmore, 2018). YPEL2 and YPEL4 annotated to this pathway are both members of the YPEL (yippee-like) gene family, which are highly conserved across a diverse range of eukaryotic organisms (Mattebo et al., 2021). However, there are few studies on YPEL2. YPEL4 is part of a complex network of pathways involved in the development of many pulmonary diseases (Truong et al., 2018). The P. multocida serotype A strain may lead to downregulation of YPEL4 through TLRs, implying its involvement in pneumonia.
In the P. multocida strain serotype D-stimulated group, the significant KEGG pathways related to immunity were the phagosome (ko04145) and B cell receptor signaling pathway (ko04662). Notably, LOC102184859 was enriched in both pathways, and only the expression of chi-mir-542-3P_R +2 was upregulated, which was consistent with the regulatory relationship between mRNAs and miRNAs (Fig. 10). However, the function of LOC102184859 and chi-mir-542-3P remain largely unknown, and further studies are needed to investigate their immunological roles.
Interestingly, the number of significantly regulated KEGG pathways for the P. multocida strain serotype A-stimulated group was higher than that for the serotype D-stimulated group, and most were related to cell morphology, proliferation, differentiation, and signal transduction. Among these pathways, only GABAergic synapse and the TLR signaling pathway were associated with immunity. The former is a newly revealed pathway that may be associated with immunity, while the latter is a well-known immune-related KEGG pathway. TLRs are the first line of defense against pathogen invasion. However, the significant KEGG pathways for the P. multocida strain serotype D-stimulated group were classic immune-related pathways (phagosome and B cell receptor signaling pathway). Phagosomes are an indispensable component of the immune response to eliminate invading bacteria and viruses (Omotade & Roy, 2019). Antigen recognition by B cell receptors is the first step for T cells in helping naive B cells differentiate into plasma cells, germinal center B cells, and memory B cells (Tanaka & Baba, 2020). These results are consistent with the observed cellular changes. We hypothesized that when the P. multocida serotype A strain stimulated goat bronchial epithelial cells for 4 h, TLRs induced a series of intracellular signal transduction events that caused morphological changes in cells. The GABAergic synapse received the stimulating signal, but the immune response had not yet been induced. Whereas in the P. multocida strain serotype D-stimulated group, the immune response had already been induced. Thus, the significant KEGG pathways related to cell morphology were decreased, and the observed changes in cell morphology were more obvious. This also indirectly suggests that serotype D of P. multocida may be more virulent than serotype A.
Conclusions
Our research demonstrated transcriptome changes, as determined by high-throughput sequencing, when serotype A and D strains of P. multocida were used to stimulate goat bronchial epithelial cells. A total of 204 and 117 dysregulated mRNAs were identified in the P. multocida strain serotype A- and D-stimulated groups, respectively, compared with 269 and 290 dysregulated miRNAs. The significant KEGG pathways related to immunity were GABAergic synapse, Toll-like receptor signaling pathway, and B cell receptor signaling pathway. Serotype D P. multocida may thereby induce a cellular immune response earlier than serotype A in stimulated goat bronchial epithelial cells.
Supplemental Information
Total differentially expressed genes in the P. multocida strain serotype A- stimulated group
Total differentially expressed genes in the P. multocida strain serotype D- stimulated group
Total differentially expressed miRNAs in the P. multocida strain serotype A- stimulated group
Total differentially expressed miRNAs in the P. multocida strain serotype D- stimulated group
Prediction of miRNA target genes in the P. multocida strain serotype A- stimulated group
Prediction of miRNA target genes in the P. multocida strain serotype D- stimulated group
GO enrichment analysis of specific differentially expressed genes in the P. multocida strain serotype A- stimulated group
GO enrichment analysis of specific differentially expressed genes in the P. multocida strain serotype D -stimulated group
GO enrichment analysis of common differentially expressed genes in the P. multocida strain serotypes A- and D- stimulated groups
KEGG enrichment analysis of specific differentially expressed genes in the P. multocida strain serotype A-stimulated group
KEGG enrichment analysis of specific differentially expressed genes in the P. multocida strain serotype D- stimulated group
KEGG enrichment analysis of common differentially expressed genes in the P. multocida strain serotype A- and D-stimulated groups
Growth curves (A) and standard linear equations (B) of P. multocida serotype A
(A) The horizontal axis represents the incubation time of P. multocida strain serotype A in TSB. The vertical axis represents the absorption value of bacterial suspension at OD600 nm. (B) In the standard linear equation, X represents the absorption value at OD600 nm, and Y represents the CFU/mL.
Growth curves (A) and standard linear equations (B) of P. multocida serotype D
(A) The horizontal axis represents the incubation time of P. multocida strain serotype D in TSB. The vertical axis represents the absorption value of bacterial suspension at OD600 nm. (B) In the standard linear equation, X represents the absorption value at OD600 nm, and Y represents the CFU/mL.

