the Creative Commons Attribution 4.0 License.
the Creative Commons Attribution 4.0 License.
Firn seismic anisotropy in the Northeast Greenland Ice Stream from ambient-noise surface waves
Dimitri Zigone
Coen Hofstede
Andreas Fichtner
Joachim Rimpot
Sune Olander Rasmussen
Johannes Freitag
We analyse ambient-noise seismic data from 23 three-component seismic nodes to study firn velocity structure and seismic anisotropy near the EastGRIP camp along the Northeast Greenland Ice Stream (NEGIS). Using nine-component correlation tensors, we derive dispersion curves of Rayleigh and Love wave group velocities from 3 to 40 Hz. These velocity distributions exhibit anisotropy along and across the flow. To assess these variations, we invert dispersion curves for shear wave velocities (Vsh and Vsv) in the top 150 m of the NEGIS using a Markov chain Monte Carlo approach. The reconstructed 1-D shear velocity model reveals radial anisotropy in the firn, with Vsh 12 %–15 % greater than Vsv, peaking at the critical density (550 kg m−3). We combine density data from firn cores drilled in 2016 and 2018 to create a new density parameterisation for the NEGIS, serving as a reference for our results. We link seismic anisotropy in the NEGIS to effective and intrinsic causes. Seasonal densification, wind crusts, and melt layers induce effective anisotropy, leading to faster Vsh waves. Changes in firn recrystallisation cause intrinsic anisotropy, altering the Vsv / Vsh ratio. We observe a shallower firn–ice transition across the flow (≈ 50 m) compared with along the flow (≈ 60 m), suggesting increased firn compaction due to the predominant wind direction and increased deformation towards the shear margin. We demonstrate that short-duration (9 d minimum), passive, seismic deployments and noise-based analysis can determine seismic anisotropy in firn, and we reveal 2-D firn structure and variability.
- Article
(7375 KB) - Full-text XML
- BibTeX
- EndNote
Firn forms when snow survives for more than 1 year. When the yearly new-snow accumulation increases the overburden pressure, the snow properties transition into firn and, finally, pure glacier ice (Herron and Langway, 1980). The compaction profile of the firn column can preserve the local climate history, recording the amount of snow accumulation, snowmelt, temperature conditions, and the subsequent preservation of snow. Firn also represents an important source of uncertainty with respect to estimating changes in the surface mass balance (Verjans et al., 2021; Kowalewski et al., 2021), as the current rate of change in ice sheets' mass balance is often derived from tracking changes in surface elevation from satellite altimetry or interferometry. For a correct interpretation, potential changes in firn densification rates over time and space have to be accounted for. Firn is also used to monitor ice sheet collapse (Hubbard et al., 2016), establish the preservation and close-off depth of atmospheric gas in bubbles relevant for palaeoclimate reconstruction and ice core interpretation (Újvári et al., 2022; Schwander et al., 1997), and correct for near-surface effects in radar (Mojtabavi et al., 2022) and seismic data (Smith et al., 2021).
In principle, variations in the mechanical properties of firn depend on ice crystal anisotropy, which influences ice flow on larger scales (Duval et al., 1983; Bons et al., 2016). The ice crystal preferred-orientation axes have been shown to be affected at depths as shallow as the shallow subsurface. At EastGRIP camp on the Northeast Greenland Ice Stream (NEGIS), measurements of ice crystal eigenvectors show a clear characterisation of crystal anisotropy at depths as shallow as 100 m (Gerber et al., 2023; Stoll et al., 2024). Although not showing anisotropy in the firn, this strongly indicates that the fabric is being generated early. Recently, for the shear margin of the NEGIS, Oraschewski and Grinsted (2022) and Grinsted et al. (2022) showed that firn densification is a function of the applied strain and that it is higher in the shear margin. Hence, there is likely firn anisotropy present in the NEGIS.
Most direct knowledge about the vertical distribution of anisotropy in firn and ice has been obtained from a few cores in Greenland and Antarctica (e.g. Vallelonga et al., 2014). However, these analyses are very laborious, only provide discontinuous 1-D information along the vertical axis, and usually have a very coarse resolution. In addition, given the fragility of firn cores, anisotropic properties of firn (such as those obtained by standard thin-section fabric analyses) are rare. In 2023, a new standardised densification model of EastGRIP was created using core data from 2016 and 2018. These data are presented here and are used for comparison with our ambient seismic noise dispersion analysis results.
Seismic waves offer a method to image firn and ice structures that complements the capabilities of other techniques. For example, in glaciology, seismic methods have been shown to be an effective tool to determine firn structure and velocity profiles via the use of refraction data (e.g. Schlegel et al., 2019; Hollmann et al., 2021; Pearce et al., 2023; Picotti et al., 2015), distributed acoustic sensing methods (Zhou et al., 2022; Fichtner et al., 2023), or ambient noise (e.g. Chaput et al., 2022; Lévêque et al., 2010; Diez et al., 2016; Zhang et al., 2022). The use of seismic methods can give a unique insight into the firn anisotropy that is otherwise difficult to obtain.
Over the last decade, major progress has been made with respect to understanding and partly identifying anisotropic areas from the ice surface using geophysical methods. Among these methods, noise correlation techniques have been used. Diez et al. (2016) retrieved Rayleigh and Love waves from noise and inverted them for shear velocity (Vsh and Vsv) profiles at the Ross Ice Shelf. Zhang et al. (2022) used 7 d of ambient-noise data to obtain 2-D vertical and horizontal shear wave velocity models. Azimuthal anisotropy within firn has been explored using distributed acoustic sensing (DAS) by Zhou et al. (2022). However, their results show large uncertainty. Hence, Zhou et al. (2022) could not rule out anisotropy in the firn layer. Instead, they suggest the use of ambient-noise surface wave tomography to investigate this further.
Ambient-noise tomography is a widely adopted technique in seismology for obtaining high-resolution tomographic images spanning kilometre-scale dimensions (see Campillo and Roux, 2015, and Shapiro, 2019, for reviews). Unlike conventional methods that are reliant on impulsive sources, such as earthquakes or active seismic shots, noise-based imaging utilises the diffuse and random nature of the wave field to reconstruct virtual active sources at every passive station by cross-correlating the continuous seismic noise records between every pair of stations (Shapiro et al., 2005).
Thanks to its simplicity, this technique has revolutionised the use of seismic arrays for imaging complex structures at various scales, such as fault zones (e.g. Zigone et al., 2015, 2019), sedimentary basins (e.g. Schippkus et al., 2018), urban areas (e.g. Lin et al., 2013), geothermal reservoirs (e.g. Lehujeur et al., 2018), landslides (e.g. Renalier et al., 2010), water catchments (e.g. Wang et al., 2019), mountain glaciers (e.g. Sergeant et al., 2020), and ice shelves (e.g. Diez et al., 2016; Zhang et al., 2022).
With the advancement of seismic nodes (a compact all-in-one three-component, wireless seismometer), small, dense seismic arrays are being deployed in polar regions (e.g. Gimbert et al., 2021; Chaput et al., 2022; Zhang et al., 2022), giving rise to the possibility of using ambient-noise tomography to study shallower structures and anisotropy. The most notable advantages of this method are that ambient seismic noise exists in all places (with varying spatial and temporal variations) and that the method utilises a passive acquisition with relatively easy deployment.
Here, we present passive seismic data acquired over 29 d on the NEGIS. The corresponding noise-based Love and Rayleigh wave dispersion curves are inverted to estimate the S-wave velocity structure of the top 150 m of the NEGIS and the radial anisotropy within the firn (variations between horizontally and vertically polarised shear wave velocities). Our findings contribute novel insights into the internal structure of the NEGIS, advance our understanding of the complex dynamics characterising firn and ice formation, and show that environmental noise seismic acquisition is a useful and simple tool to obtain local firn properties.
The NEGIS is Greenland's largest ice stream. To investigate its internal properties, the International Partnership for Ice Core Sciences (https://scar.org/science/physical/ipics, last access: 4 October 2024) has undertaken drilling of an ice core in the onset region. Since 2015, an ice core has been drilled by the EastGRIP consortium. The drilling reached bedrock in July 2023, at approximately 2690 m depth. In the vicinity of the EastGRIP drill site (75.63° N, 35.98° W in 2022), 500 km from the calving front of the ice stream, we deployed a network of 23 three-component (N, E, and Z) SmartSolo seismic nodes (Fig. 1).
The ice flow direction at EastGRIP is approximately 20° from north (north-northeast) with a speed of approximately 60 m yr−1 (Joughin et al., 2018; Grinsted et al., 2022). Nodes were deployed along the flow (Line 1, 20° from north; Fig. 1c), across the flow (Line 5, 110° from north; Fig. 1c), and oblique to the flow (at 42.5, 65, and 82.5° from north), at varying distances from 100 to 4200 m from the drill site.
The crystal fabric in the ice of the NEGIS is well known in this area, with direct measurements along the ice core from 100 m depth down showing a broad vertical single maximum (largest eigenvalue in the vertical, λ1=0.25, λ2=0.25, and λ3=0.5). From 100 to 200 m, a transition from this broad single maximum into a broad vertical girdle occurs by redirecting the c axis from the vertical into the horizontal across-flow plane (Gerber et al., 2023), which then becomes the largest eigenvalue. Gerber et al. (2023) joined a suite of geophysical observations and methods with numerical modelling to map the spatial distribution of the fabric across the NEGIS.
In addition to the main EastGRIP core density data obtained in 2016, core S6 was acquired close to the borehole (1.2 km away) in 2018. We combined the available density data and included the first interpretation of a standardised EastGRIP density parameterisation, which we will use as a reference for our results inferred from passive seismic data.
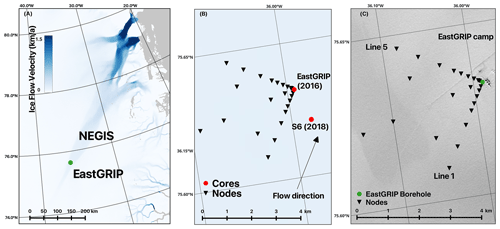
Figure 1Location of the seismic node array. Panel (a) shows the surface ice flow velocity of the Greenland Ice Sheet from Sentinel-1 (2019–2020) (Joughin et al., 2018), highlighting the Northeast Greenland Ice Stream (NEGIS) and its three major outlet glaciers. Panel (b) presents the seismic node array that was used in 2022 to acquire 29 d of ambient-noise data beginning on 21 July 2022 and the location of the two cores obtained in 2016 and 2018 used for the standardised density parameterisation at EastGRIP. Panel (c) provides a close-up of the camp area showing the location of the drilling and other camp infrastructure (trench, storage, airfield, etc.) and the location of the seismic nodes. The airfield was unused during the deployment of seismic nodes. The satellite image is from Landsat 8.
We use continuous noise data from 23 stations recorded from 21 July to 21 August 2022 with IGU-16HR 3C 5 Hz SmartSolo nodes. The network recorded at a sampling rate of 1000 Hz, with inter-station distances ranging from ≈ 50 to 2900 m. We process the ambient-noise data in the following order: (1) single-station data preparation; (2) cross-correlation and temporal stacking; (3) measurement of dispersion curves; and (4) quality control, including error analysis and selection of group velocity measurements. Processing of ambient-noise data follows a typical processing chain (Bensen et al., 2007; Poli et al., 2013), but it has been modified for higher-frequency content (see Zigone et al., 2019).
3.1 Data preprocessing
Preprocessing steps are used on the raw data to increase the quality of the correlation functions and, subsequently, dispersion measurements.
The following signal processing is done for each individual station:
-
The data are downsampled to 100 Hz and high-pass filtered at 0.04 Hz.
-
The data are split into 15 min segments. For each segment, a first glitch correction, which consists of a clipping at 15 standard deviations is performed to remove any high-amplitude samples caused by the digitisation. Additionally, we remove segments where gaps exceed 10 % of the segment length. Finally, segments with an energy greater than 3.5 times the mean energy over the entire day are removed, as this suggests the presence of a transient source signal (e.g. ice quake) within the segment.
-
The remaining segments are then whitened by dividing the amplitude of the noise spectrum by its absolute value for frequencies between 0.1 and 50 Hz, the Nyquist frequency (Bensen et al., 2007).
-
Finally, a second clipping of the data at 3 standard deviations is performed to further dampen the remaining transient signals that may have been missed with the energy threshold.
3.2 Correlations
With the processed 15 min segments, we compute the cross-correlation function between all station pairs in the frequency domain, following Bensen et al. (2007). All correlation functions from all segments in a day are then averaged to obtain a single daily correlation function per station pair. As all three components (vertical, Z; north–south, N; and east–west, E) are recorded by the stations, we compute the nine inter-component correlation functions corresponding to the elastic Green tensor (ZZ, ZE, ZN, EZ, EE, EN, NZ, NE, and NN).
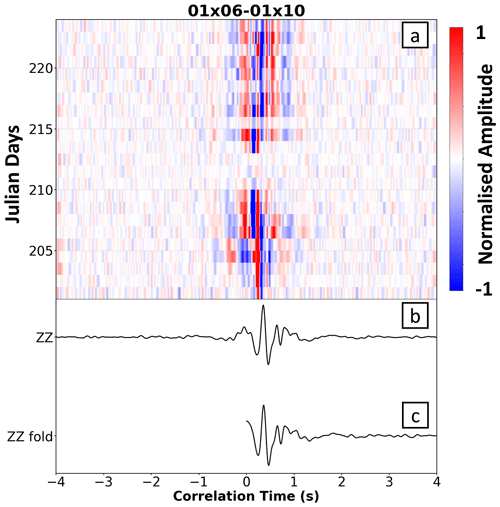
Figure 2Panel (a) provides the daily ZZ correlation functions plotted as a correlogram for station pair (an inter-station distance of 850 m). Panel (b) presents a stack of the ZZ correlation functions for the whole month. Panel (c) shows the final folded ZZ correlation function for station pair . Data are filtered between 1 and 7 Hz.
Figure 2 shows an example of the ZZ correlation functions between two stations with an 850 m inter-station distance, presented as a correlogram. We first note a high-frequency arrival at zero correlation time. We associate this feature with high-frequency wind resonance of the 2 ft (0.6 m) bamboo sticks that sat 20 cm above the snow and were used to mark the location of the seismometers. Such near-zero arrivals are sometimes observed on ZZ correlation functions, especially at high frequencies, and do not prevent the use (for imaging purposes) of surface waves that arrive later (e.g. Zigone et al., 2019) In addition, this zero-lag feature has a frequency different from that used to analyse the surfaces waves. In Fig. 2, the surface wave is clearly observed in positive time at around 0.5 s. Even if some small variations are visible in the daily correlation functions – for example, the decrease in amplitudes between Julian days 211 and 214 – the surface wave arrival remains stable for most of the 29 d recording period.
We note that our correlation functions are asymmetric, with much higher amplitudes at positive times. If sources of ambient noise were distributed homogeneously in the azimuth, the causal (positive lag) and acausal (negative lag) signals would be identical. However, asymmetry in amplitude and spectral content is typically observed, as in our data, indicating differences in both the source process and distance to the source with direction. The asymmetry in our correlation functions likely comes from the fact that most of the human activity at EastGRIP is concentrated around the main camp and the borehole trench (see Fig. 1c), leading to more energy at positive times (Schippkus et al., 2020; Hillers et al., 2013). Such asymmetry in the Green function retrieval is typical in noise correlation studies, as homogeneous noise sources are rarely possible, except in specially designed experiments with controlled noise source distributions (e.g. Roux et al., 2004). Our study faces a similar challenge, as the noise source distribution is nonuniform, which may bias the measured travel times on correlation functions (e.g. Froment et al., 2011). However Yao and Van Der Hilst (2009) and Hillers et al. (2013) studied the potential errors in arrival time measurements of Rayleigh waves due to the directional noise and found the effect to be small. In addition, to better sample the sightly varying distribution of noise sources around EastGRIP during the month of recordings, we stacked the 29 daily correlation functions. The stack also aims to reduce temporal variations in the correlations that can affect the quality of the cross-correlations, thus improving the signal-to-noise ratio (SNR). Finally, to broaden the frequency content, we fold the cross-correlations to merge low- and high-frequency information for the following travel time measurements (e.g. Shapiro and Campillo, 2004) (see Fig. 2).
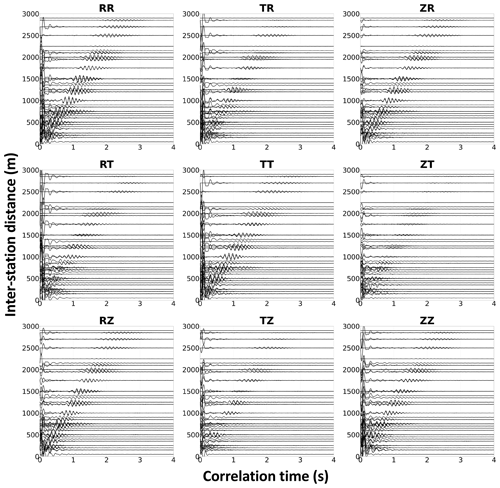
After stacking, the elastic Green correlation tensor is rotated along the inter-station azimuth to provide the correlation functions between the radial (R), transverse (T), and vertical (Z) components (RR, RT, RZ, TR, TT, TZ, ZR, ZT, and ZZ) of the seismic wave field propagating between the stations. This is illustrated in Fig. 3, which presents the nine components of the correlation tensor as a function of inter-station distances. The arrival patterns observed are dominated by surface waves travelling between the pairs of stations used. This is indicated by the visible frequency dependence of the reconstructed wave velocity, which is the dispersive characteristic of surface waves. Prominent Rayleigh waves are observed on the RR, ZZ, RZ, and ZR components, whereas Love waves are visible on the TT correlation term. Note that some scattered energy is still visible on mixed transverse terms (ZT, TZ, RT, and TR) due to complex interactions between the wave field and firn layers, as observed in other complex structures such as fault zones (e.g. Zigone et al., 2019).
3.3 Dispersion curves
We measure group velocity dispersion curves for all station pairs and then invert them to obtain a 1-D shear wave velocity depth profile. Dispersion measurements are performed on the folded correlation functions (see Fig. 3) for frequencies between 1 and 50 Hz using the automated multiple-filter technique of Pedersen et al. (2003).
For Rayleigh waves, we utilise the four components of the correlation tensor (RR, ZZ, RZ, and ZR) that contain Rayleigh waves, whereas we only use the TT component for Love waves. We first run the automated multiple-filter technique for each respective component in order to obtain a normalised frequency-group velocity diagram. The results for RR, ZZ, RZ, and ZR are then combined with a logarithmic stacking in the frequency-group velocity domain, as in Zigone et al. (2015). Following this, we stack the dispersion diagrams (independently for Love and Rayleigh waves) for station pairs along the flow and across the flow, producing four dispersion diagrams. The dispersion curve is then selected from the diagrams as the maximum amplitude at each frequency (Figs. 4, 5).
To avoid nonrepresentative dispersion measurements, we do not include modes higher than mode 3, as our dispersion curves at this point are not distinctive enough to establish which mode they represent. The criteria employed to select the modes used were based on the gradient of the mode always decreasing. The values selected for the inversion are presented as orange curves on the right of Figs. 4 and 5.
Our dispersion measurements all show the fundamental mode, with some also showing the first and second harmonic modes that introduce higher-frequency data. For our final inversions (see details in Sect. 4), we use group velocity values from all modes that can be properly identified. To confirm that we are selecting group velocities for the correct mode, we first run the Vs inversion with only the fundamental mode. The resulting velocity model is then used to compute synthetic dispersion curves to inform the selection of the first and, when possible, second higher modes using the same selection criteria as for the fundamental mode (see Figs. 4 and 5).
To obtain the error estimates for our group velocity values, we fit the dispersion diagram at each selected frequency with a Gaussian curve and assume the velocity error to be ± 1 standard deviation. Panels (b) and (d) in Figs. 4 and 5 show the selected dispersion curves used for the Love (Fig. 4) and Rayleigh (Fig. 5) waves.
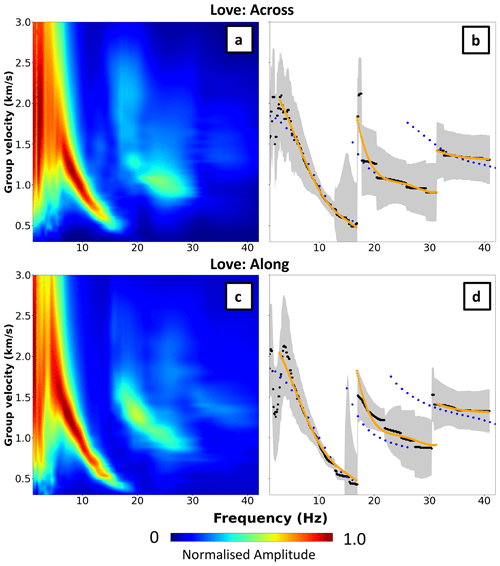
Figure 4Panels (a) and (c) show stacked dispersion diagram for Love waves for across- and along-flow stations, respectively. Panels (b) and (d) present the maximum amplitude of the dispersion curve shown by the black dots and error (± 1 standard deviation, grey shading). Orange shows the values used as the input for Markov chain Monte Carlo inversion. Blue dots are the forward-modelled dispersion curves.
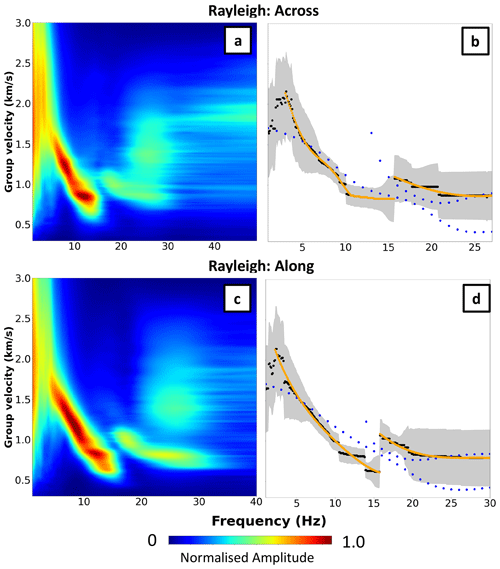
Figure 5Panels (a) and (c) show stacked dispersion diagrams for Rayleigh waves for across- and along-flow stations, respectively. Panels (b) and (d) present the maximum amplitude of the dispersion curve shown by the black dots and error (± 1 standard deviation, grey shading). Orange shows the values used as the input for Markov chain Monte Carlo inversion. Blue dots are the forward-modelled dispersion curves.
3.4 Density data and parameterisation
A density parameterisation of EastGRIP has been created and is used for the first time in our discussion (Fig. 6). The data used to create the parameterisation were obtained from various locations close to the EastGRIP main core: firstly, from the EastGRIP main borehole in 2016 to a depth of 117.15 m; secondly, from two, 5 m deep trenches at the EastGRIP camp; and, finally, from a 72 m long shallow core (denoted S6; Fig. 1) drilled in 2018. For the top 5 m, liners (thin-walled carbon-fibre tubes) were used to retrieve 100 firn sections of 1 m length with less mechanical influence than what is possible during drilling. The values were averaged to produce one density data point for each 1 m interval from the surface to 5 m depth. From the S6 shallow core, the firn core segments have a lot of scratches in the section above 12 m, leading to likely underestimation of the density; therefore, we only use data from 12 m down at a 1 m resolution. The EastGRIP main core density record has a 0.55 m resolution and covers the interval from 13.75 to 117.15 m. All data points for which the measurement notes indicate missing parts or bad data quality (producing outliers only in the downward direction) have been excluded. At 117.15 m depth, the density is about 900 kg m−3. In order to provide a standardised density profile and allow the calculation of extrapolated density for deeper sections, a density parameterisation was derived based on all data points. The parameterisation also allows the calculation of the ice-equivalent depth at all depths. The details of the parameterisation are provided along with the density data sets at PANGAEA (Rasmussen et al., 2023).
A visual inspection of 3-D reconstructions of pore and ice structure along the firn column from core S6, measured by X-ray tomography (Freitag et al., 2013), reveals no significant geometrical anisotropy in pore and ice structures. Enclosed air bubbles below the firn–ice transition at around 65 m depth show no indication of systematic deviations from spherical shapes (Fig. 6). Layering from a-few-centimetre-thick layers of different densities in the core is strong down to about 50 m; this is followed by a decreasing trend downwards, with the addition of 1 mm sized wind crust layers occurring one to two times per metre.
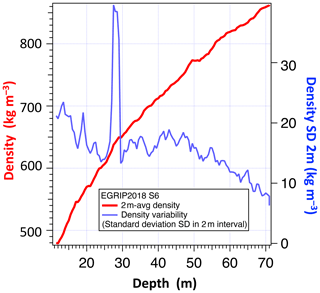
Figure 6The evolving standard deviation (SD) of the density in 2 m intervals along the depth profile (plotted in blue) and the averaged density (plotted in red). The density profile is measured by X-ray absorption at a 0.1 mm vertical resolution. The spike in the SD profile is due to a prominent refrozen melt layer at 28 m depth with a strong density jump of more than 250 kg m−3.
We use a Metropolis Markov chain Monte Carlo (MCMC) inversion (Brooks, 1998) to invert our dispersion measurements for Vsv and Vsh. The MCMC approach is used to solve nonlinear inverse problems with nonunique solutions (e.g. Sambridge and Mosegaard, 2002; Shapiro and Ritzwoller, 2002; Zigone et al., 2019; Gallagher et al., 2009; Lehujeur et al., 2018).
Table 1Parameterisation used for the MCMC inversion. The choice of velocity range for the inversion is based on the range of possible velocities that exist for snow and ice. The wide range is kept to avoid prior constraints on the inversion. As the transition of firn to ice is a relatively fast process with a large velocity gradient, it is important to allow all possible velocities for depths in order to not precondition the inversion.

We use a parameterisation with six layers over a half-space and invert for the S-wave velocity and depth of each interface (parameters given in Table 1), where the upper and lower bands of the prior for each parameter are the same in each layer and are taken based on the initial model used by Fichtner et al. (2023) at EastGRIP. Because the inversion of surface wave group velocity dispersion curves also requires a Vp and density model, we also invert for the ratio and the density in each layer. Note, however, that the sensitivity of group velocity dispersion curves to these parameters is low (Xia et al., 1999). Due to the use of surface waves, we have no sensitivity to Vp from the recorded Love waves and very little sensitivity to Vp from the Rayleigh waves. Hence, constraining Vp from our data set is difficult and involves high uncertainty. As such, the inverted Vp and density models from the MCMC inversion are not considered in this study.
The computation of the logarithm of the likelihood for each model (i.e. the misfit function) is done with a linear combination of the logarithm of the prior density functions from both the model and data spaces (see Lehujeur et al., 2018, and Zigone et al., 2019, for more details). In the context of this study, the prior probability density function (PDF) of the model space is determined by taking the product of uniform PDFs for each parameter present in the model. The prior PDF of the data space is approximated by employing lognormal probability distributions centred around the velocity values obtained from the dispersion curve. We consider that each dispersion point is independent; this means that the covariance matrix utilised for the data space is taken to be diagonal (Tarantola, 2005). The forward modelling of the dispersion curves for each possible model used a modal summation method from Herrmann (2013). For each stacked dispersion curve, we run 15 independent Markov chains in parallel; the step from one model to the next is governed by a Gaussian proposal PDF with a diagonal covariance matrix. The frequency ranges and the modes used for each model are given in Table A1. The terms of that covariance matrix are adjusted along the inversion to stabilise the acceptance ratio at around 25 % (Lehujeur et al., 2018). Each chain runs until 1500 models have been accepted. In total, the inversion keeps about 22 500 models from the 90 000 that were tested for each depth profile. From those 22 500 models, the median of the 1000 best models is taken as the solution of the inversion. Using the selected group velocity values for Love and Rayleigh waves, with an error of ± 1 standard deviation, we run separate inversions for each stacked dispersion curve, resulting in six independent shear wave velocity models for the NEGIS (Fig. 7). These models provide an averaged 1-D velocity for the extent of the along- and across-flow lines.
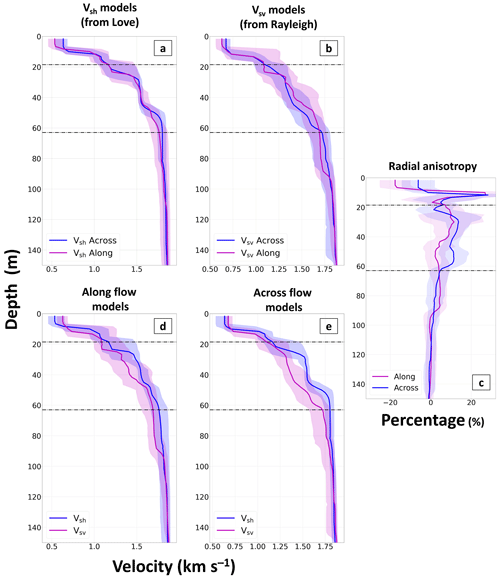
Figure 7(a) Vsh and (b) Vsv models for the across-flow (blue) and along-flow (magenta) station pairs. (c) The percentage of seismic radial anisotropy for along-flow (magenta) and across-flow (blue) stations. Vsh (blue) and Vsv (magenta) for (d) along-flow (e) and across-flow stations. All panels include dashed black lines at the critical density depth (18.5 m for 530 kg m−3) and pore close-off (63 m for 830 kg m−3) taken from the 2018 S6 ice core. The shaded regions are ± 1 standard deviation from the most likely model output from the MCMC inversion.
In our results (Fig. 7), we observe two key features: firstly, that Vsh is always greater than Vsv; secondly, that the magnitude of the difference between Vsh and Vsv changes with depth.
The variation in Vsh with direction (Fig. 7a) shows indistinguishable changes between the along- and across-flow directions above 60 m. Below this, the across-flow direction has higher velocities. In Fig. 7b, Vsv shows more variation in velocity with direction and has larger uncertainty due to the dispersion curves for Rayleigh waves with a lower maximum frequency (Table A1).
Both the along- and across-flow directions consistently have Vsh values greater than those of Vsv (Fig. 7d, e), resulting in a positive radial seismic anisotropy () at all depths, with the along-flow direction having Vsh and Vsv velocities closer together than the across-flow direction. The value of the radial anisotropy varies with depth, reaching a maximum of 15 % for the across-flow direction and 12 % for the along-flow direction at a depth of 30 m, with the ratio then decreasing with depth (Fig. 7c).
In a layered Earth model, Rayleigh and Love wave phase velocities have different sensitivities in response to the change in the S-wave velocity of the same layer (Yin et al., 2014). Because the frequencies used in our inversions are limited to a maximum of between 30 and 40 Hz, we have limited sensitivity to the top 10–20 m of the model (see Rayleigh and Love waves sensitivity kernels in Fig. A1). Hence, we can make no conclusions about the radial anisotropy in this part.
In general, the uncertainties associated with the models vary with depth. This comes from both (1) the varying number of modes and frequencies used from the dispersion curves and (2) the fact that no constraint is offered from Vp data. This could be overcome in the future by undertaking additional studies to better characterise Vp; this information could then be incorporated into the inversion, reducing the model uncertainty.
5.1 Seismic anisotropy
Seismic anisotropy in firn is caused by a combination of different processes: (1) effective anisotropy, caused by thin layers in the firn with different seismic velocities, smaller than the seismic wavelength, causing effective anisotropy; (2) intrinsic anisotropy, caused by the preferred orientation of the hexagonal ice crystals, the crystal orientation fabric (COF); and (3) structural anisotropy (e.g. crevasses and micro-cracks). In the following, we discuss our results with respect to each of these potential causes.
5.1.1 Effective anisotropy
The effective bulk anisotropy is an anisotropy caused by layers with varying density, i.e. layers with varying seismic velocities, significantly thinner than the seismic wavelength (Backus, 1962). At the NEGIS, firn density varies at a minimum, on the metre scale (Vallelonga et al., 2014), and our wavelength has a minimum length of approximately 40 m. Thus, the seismic wave experiences an effective, averaged medium velocity. From ice cores obtained at EastGRIP (Fig. 6), layering of different densities of a few centimetres thick, caused by buried dunes or sastrugi, frequently occurs in the core and is the main cause of the layered structure in firn. Additionally, wind crust layers (1 mm thick) are seen, along with melt layers. The layers produce a vertical transversely isotropic (VTI) medium, i.e. anisotropic with a vertical axis of rotation symmetry.
In a VTI medium, SH-wave velocities and SV-wave velocities are not equal, with their velocity dependent on the angle of incidence. Rayleigh wave velocity, depending on the Vsv, and Love wave velocity, depending on Vsh, reflect this effective anisotropy. Consistently, we see Vsh values that are greater than Vsv values due to this effect.
From our analysis, the difference in Vsh and Vsv is a maximum of 15 % and a maximum of 12 % at 30 m for the across- and along-flow directions, respectively. This effective anisotropy in firn due to thin layers has been previously observed in Antarctica (Diez et al., 2016; Schlegel et al., 2019). We compare this to anisotropy measurements obtained from active seismic experiments from the Antarctic Plateau (Schlegel et al., 2019), where a maximum anisotropy of 16 % was recovered, and from passive data on an Antarctic ice shelf (Diez et al., 2016), where 15 % higher velocities between 12 and 65 m were seen for Vsh compared with Vsv.
To validate that our computed difference between Vsv and Vsh is real and not affected by the absence of P waves, we compare our results to a Vsv model obtained by Fichtner et al. (2023) for the same location (Fig. A2), obtained using high-frequency seismic data and DAS. Our Vsv models agree well with Fichtner et al. (2023), and all of the Vsv models are slower than the Vsh models, validating our findings. The slight variations between the models likely come from the fact that (1) a different frequency content was used (more high frequency for DAS) and (2) the orientation of the DAS cable compared with the ice stream is not the same as the node arrays that we use in the present study.
The difference in the magnitude of the radial anisotropy between the along- and across-flow directions could possibly be attributed to the predominant wind direction at EastGRIP. The average predominant wind direction in 2022 for EastGRIP was 273° (EastGRIP, 2023), approximately 17° from the across-flow direction, versus 70° for the along-flow direction. The extent of high-density layers in the firn originating from buried dunes are typically enlarged along the predominate wind direction, as the dunes at the surface are enlarged (Birnbaum et al., 2010). As such, one observes stronger density variations in the predominant wind direction. This leads to a greater difference in Vsh and Vsv; hence, a larger radial anisotropy is seen in the across-flow direction.
5.1.2 Intrinsic anisotropy
In addition to effective anisotropy caused by small layers in the firn, we observe a relationship between changes in the magnitude of the radial anisotropy and variations in the intrinsic structure of the firn. Intrinsic anisotropy is caused by a preferred orientation of the anisotropic, hexagonal ice crystals and has been previously observed in seismic data (Picotti et al., 2015). The intrinsic anisotropy develops due to the stresses and accumulated strain within the ice, which are comparatively small within the firn. In general, the crystal fabric in the firn is expected to be rather isotropic, with slight preference for a vertical single maximum in the absence of strain other than compaction (Zeising et al., 2023). At the NEGIS, however, the few available measurements of fabric at a depth of around 100 m indicate that a weak single-maximum anisotropy has already developed at that depth. Below 100 m, this begins to transit towards a girdle fabric, increasing with depth (Gerber et al., 2023).
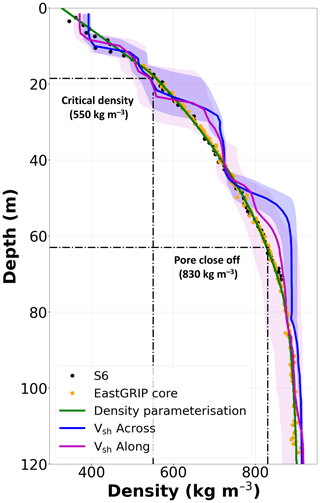
Figure 8Velocity models converted to density, using the Diez et al. (2016) empirical scaling law, and compared to density cores recovered from the NEGIS (S6 and EastGRIP core). Dashed lines denote the critical density depth (18.5 m for 530 kg m−3) and pore close-off (63 m for 830 kg m−3) taken from the density parameterisation of EastGRIP.
Using the empirical relationship from Diez et al. (2016), we convert our Vsh models to density (Fig. 8) and compare the results to the depths at which we see the transition from the critical density (550 kg m−3) at 18.5 m and pore close-off (830 kg m−3) at 63 m (Fig. 7), taken from the density parameterisation of EastGRIP.
In the first stage of densification (0–20 m depth), the dominant mechanism is grain settling and packing, i.e. the displacement of grains. This is usually the most rapid stage of densification and ends when the density reaches the critical density at 550 kg m−3, around a porosity of 40 % (Cuffey and Paterson, 2010). At this point, the grains have compacted as much as possible by displacement, and other mechanisms become active to cause any further densification. Here, we see no distinct pattern in the anisotropy, with Vsv and Vsh switching between being larger or smaller. As mentioned, we have no sensitivity to the upper 20 m of our models; hence, we can make no conclusions about the radial anisotropy in this part.
At a depth of 20 m, the critical density (550 kg m−3) is reached, and there is a decrease in the densification rate as the dominant process now becomes recrystallisation. As the shape and size of the crystals change to reduce the stress exceeded on the grain boundaries, a combination of molecular diffusion and movement along inner planes sees the pore space reduce further and the density increase to a value of around 830 kg m−3 (Herron and Langway, 1980; Faria et al., 2014a, b).
We see this reflected in the seismic radial anisotropy (Fig. 7c), where the maximum anisotropy (12 %–15 %) is observed after the critical density is reached, steadily decreasing until a density of 830 kg m−3 (pore close-off). Thus, the recrystallisation of the firn from the increased compaction has an effect on the radial anisotropy.
5.1.3 Structural anisotropy
At EastGRIP, crevasses have not been noted during previous geophysical surveys, on satellite images, or during any other field activity in the area surrounding EastGRIP; moreover, field studies of the area report that EastGRIP is a field site without crevasses (Ice and Climate Group, 2023). Although we cannot exclude the fact that micro-cracks may have an impact on the seismic anisotropy, there is no evidence to suggest that these structures are present.
5.2 Firn thickness at NEGIS
We choose to use our Vsh model to estimate the firn thickness, as the equation from Diez et al. (2016) is based on SH-waves, using a velocity of 1800 m s−1 (approximately that of ice; Peters et al., 2008) and a density of ice at 921 kg m−3, as assumed in the EastGRIP density parameterisation.
The along-flow velocity model shows a firn–ice transition between 60 and 70 m. This estimation is in agreement with other studies carried out in the ice stream, such as Fichtner et al. (2023), at between 65 and 71 m; Vallelonga et al. (2014), at approximately 65 m; and Riverman et al. (2019), at 68–70 m. Furthermore, it more closely matches the firn–ice transition observed in the density parameterisation of the EastGRIP borehole at 63 m.
The across-flow density model (Fig. 8) has a firn–ice transition at a depth of 50 m, thereby showing increased densification compared with the along-flow profile, for which the firn–ice transition is 10 m deeper. We attribute this measurement to the increased densification from the predominant wind direction at EastGRIP (Craven and Allison, 1998). Additionally, we expect to see firn thickness decrease towards the shear margin, due to increased accumulation (Riverman et al., 2019) and strain softening (Oraschewski and Grinsted, 2022), where firn thickness decreases to a minimum of 40 m.
These interpretations are based on the most likely models obtained from our MCMC inversion; however, at the depth of the firn–ice transition, we observe that the uncertainty in our results could lead to firn being a similar thickness regardless of direction. Nevertheless, the uncertainty in this region still indicates that the across-flow model always has a higher density at depth than the along-flow model, thereby indicating increased densification.
Riverman et al. (2019) observed homogeneous firn above 35 m, regardless of the proximity to the shear margin. This also seems to be reflected in our results, as we see marginal variation between the along- and across-flow Vsh models above 40 m.
Information on the 2-D firn structure gained from 29 d of ambient seismic noise correlations provides additional insight into the glaciological context of the NEGIS and further information about the recrystallisation process of firn. Our results suggest an increased densification of firn across the flow, perhaps due to the predominant wind direction and the increasing proximity to the shear margin. Additionally, the processes that dominate after the critical density (550 kg m−3) is reached increase the magnitude of the radial anisotropy of the firn structure. A combination of effective and intrinsic anisotropic effects leads to variations in radial anisotropy in firn across and along the flow. This has implications for the firn structure and rigidity, as the process of recrystallisation causes horizontally polarised shear waves to travel faster than vertically polarised shear waves. Furthermore, it shows the anisotropy effects in the firn are not only caused by effective bulk anisotropy but also by intrinsic anisotropy. At present, seismic studies in the NEGIS use anisotropy values of 5 % (Fichtner et al., 2023), but we show it is much higher than at EastGRIP camp. Furthermore, seismic studies in the NEGIS used to obtain estimations of firn thickness (e.g. Riverman et al., 2019) require measurements of the anisotropy in the firn to improve the accuracy of modelling.
5.3 Stability of correlations with time
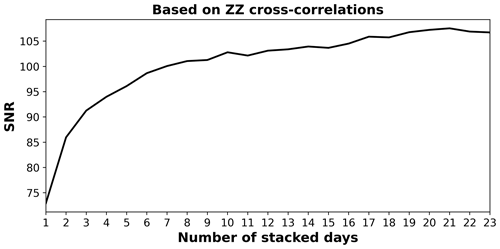
We assess the SNR of our cross-correlations for all station pairs and examine the improvement in the SNR with respect to the number of days stacked (Fig. 9). We stack our data for a maximum of 23 d, after which only 8 of the 23 stations were recording. We are able to show that, for 23 stations, the improvement in the SNR from additional stacked days after 9 d of recording is minimal, suggesting that our analysis can be replicated by a minimum of 9 d of noise recording. The high-frequency content, dense station spacing, and high scattering rate of snow and ice allow stable imaging results with shorter recording times.
We demonstrate that simple, short-duration, passive seismic deployment and environmental noise-based analysis can be used to determine variations in the 2-D structure of firn, thereby allowing improved interpretations of changes in surface mass balance. Our observations reveal variations in the magnitude of the radial anisotropy of the firn and the depth of the firn–ice transition along and across the flow of the NEGIS, providing valuable information about the 2-D variability in the ice stream related to the predominant wind direction and proximity to the shear margin. Additionally, we find a consistent relationship, both along and across the flow, between the magnitude of the radial anisotropy and the firn densification process, with a distinct change in the magnitude of the radial anisotropy occurring when critical density (550 kg m−3) and pore close-off (830 kg m−3) are reached during firn compaction. These results, obtained from the cross-correlation of ambient seismic noise data, present a promising methodology for obtaining 2-D models of firn coverage. The relative ease of deploying seismic nodes and their accessibility in large numbers offer an exciting opportunity for glaciology to gain insights into firn anisotropy and structure, which has previously been limited to 1-D profiles from cores.
Table A1Frequency range and number of modes used for each model as the input for the MCMC inversions. The wide range is used to avoid prior constraints on the inversion. As the transition from firn to ice is a fast process with a large velocity gradient, it is important to allow all possible velocities for depth in order to not precondition the inversion.

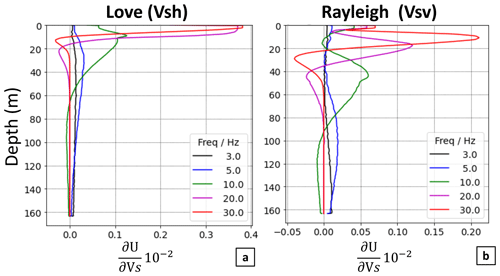
Figure A1Depth sensitivity kernels at different frequencies for (a) Love and (b) Rayleigh waves for the fundamental mode. Note the differing axes between the Love and Rayleigh waves.
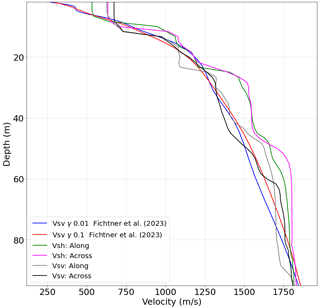
Figure A2Velocity models obtained for the NEGIS from this study and from Fichtner et al. (2023).
Density data used for the 2023 parameterisation of the NEGIS (Rasmussen et al., 2023) and raw recorded seismic data for the 23 stations (Pearce et al., 2022) can be found at PANGAEA.
EP, DZ, and OE conceptualised the study. CH and AF conducted the fieldwork in 2022. EP, DZ, and JR defined the methodology and processed the data. SOR and JF provided the density data and the density parameterisation. EP, OE, JF, and DZ interpreted the results. The manuscript was jointly written by EP, OE, and DZ, with input from all authors.
At least one of the (co-)authors is a member of the editorial board of The Cryosphere. The peer-review process was guided by an independent editor, and the authors also have no other competing interests to declare.
Publisher’s note: Copernicus Publications remains neutral with regard to jurisdictional claims made in the text, published maps, institutional affiliations, or any other geographical representation in this paper. While Copernicus Publications makes every effort to include appropriate place names, the final responsibility lies with the authors.
This research was funded by a University of Strasbourg Institute for Advanced Studies (USIAS) fellowship to Olaf Eisen; this fellowship supported Emma Pearce and the equipment. Data were acquired at the EastGRIP camp in 2022. EastGRIP is directed and organised by the Centre for Ice and Climate at the Niels Bohr Institute, University of Copenhagen. It is supported by funding agencies and institutions in Denmark (A. P. Møller Foundation, University of Copenhagen), the USA (US National Science Foundation, Office of Polar Programs), Germany (Alfred Wegener Institute, Helmholtz Centre for Polar and Marine Research), Japan (National Institute of Polar Research and Arctic Challenge for Sustainability), Norway (University of Bergen and the Trond Mohn Foundation), Switzerland (Swiss National Science Foundation), France (French Polar Institute Paul-Émile Victor, Institute for Geosciences and Environmental Research), Canada (University of Manitoba), and China (Chinese Academy of Sciences and Beijing Normal University). We thank the EastGRIP team for their great support in the field, in particular the fearless driller Søren Børsting, Sverrir Hilmarson, and Dorthe-Dahl Jensen. We also thank Maxime Bes de Berc, who prepared the nodes, and Steven Franke, Nicholas Stoll, and Fernando Valero Delgado for support, especially during the pilot study in 2019. This project used devices from the Geophysical Instrument Pool Potsdam (GIPP202204). We are grateful for the thorough and thoughtful reviews from both Stefano Picotti and an anonymous reviewer, which helped to refine this research for publication.
The article processing charges for this open-access publication were covered by the Alfred-Wegener-Institut Helmholtz-Zentrum für Polar- und Meeresforschung.
This paper was edited by Huw Horgan and reviewed by Stefano Picotti and one anonymous referee.
Backus, G. E.: Long-wave elastic anisotropy produced by horizontal layering, J. Geophys. Res., 67, 4427–4440, 1962. a
Bensen, G., Ritzwoller, M., Barmin, M., Levshin, A. L., Lin, F., Moschetti, M., Shapiro, N., and Yang, Y.: Processing seismic ambient noise data to obtain reliable broad-band surface wave dispersion measurements, Geophys. J. Int., 169, 1239–1260, 2007. a, b, c
Birnbaum, G., Freitag, J., Brauner, R., König-Langlo, G., Schulz, E., Kipfstuhl, S., Oerter, H., Reijmer, C. H., Schlosser, E., Faria, S. H., and Ries, H.: Strong-wind events and their influence on the formation of snow dunes: observations from Kohnen station, Dronning Maud Land, Antarctica, J. Glaciol., 56, 891–902, 2010. a
Bons, P. D., Jansen, D., Mundel, F., Bauer, C. C., Binder, T., Eisen, O., Jessell, M. W., Llorens, M.-G., Steinbach, F., Steinhage, D., and Weikusat, I.: Converging flow and anisotropy cause large-scale folding in Greenland's ice sheet, Nat. Commun., 7, 11427, https://doi.org/10.1038/ncomms11427, 2016. a
Brooks, S.: Markov chain Monte Carlo method and its application, J. Roy. Stat. Soc. Ser. D, 47, 69–100, 1998. a
Campillo, M. and Roux, P.: 1.12 – Crust and Lithospheric Structure – Seismic Imaging and Monitoring with Ambient Noise Correlations, in: Treatise on Geophysics (Second Edition), edited by: Schubert, G., 391–417, Elsevier, Oxford, 2nd Edn., ISBN 978-0-444-53803-1, https://doi.org/10.1016/B978-0-444-53802-4.00024-5, 2015. a
Chaput, J., Aster, R., Karplus, M., Nakata, N., Gerstoft, P., Bromirski, P., Nyblade, A., Stephen, R., and Wiens, D.: Near-surface seismic anisotropy in Antarctic glacial snow and ice revealed by high-frequency ambient noise, J. Glaciol., 69, 773–789, https://doi.org/10.1017/jog.2022.98, 2022. a, b
Craven, M. and Allison, I.: Firnification and the effects of wind-packing on Antarctic snow, Ann. Glaciol., 27, 239–245, 1998. a
Cuffey, K. M. and Paterson, W. S. B.: The physics of glaciers, Academic Press, Elsevier, ISBN: 9780123694614, 2010. a
Dahl-Jensen, D., Wilhelms, F., Weikusat, I., Eisen, O., and Pattyn, F.: Ice coring for ice dynamics: The role of ice-core sciences in the understanding of past and present ice flow, International Partnerships in Ice Core Sciences, https://scar.org/science/physical/ipics (last access: 4 October 2024), 2021.
Diez, A., Bromirski, P., Gerstoft, P., Stephen, R., Anthony, R., Aster, R., Cai, C., Nyblade, A., and Wiens, D.: Ice shelf structure derived from dispersion curve analysis of ambient seismic noise, Ross Ice Shelf, Antarctica, Geophys. J. Int., 205, 785–795, 2016. a, b, c, d, e, f, g, h
Duval, P., Ashby, M., and Anderman, I.: Rate-controlling processes in the creep of polycrystalline ice, J. Phys. Chem., 87, 4066–4074, 1983. a
EastGRIP: EastGRIP weather conditions, EastGRIP, http://weather.egrip.camp (last access: 10 October 2023), 2023. a
Faria, S. H., Weikusat, I., and Azuma, N.: The microstructure of polar ice, Part I: Highlights from ice core research, J. Struct. Geol., 61, 2–20, 2014a. a
Faria, S. H., Weikusat, I., and Azuma, N.: The microstructure of polar ice. Part II: State of the art, J. Struct. Geol., 61, 21–49, 2014b. a
Fichtner, A., Hofstede, C., N. Kennett, B. L., Nymand, N. F., Lauritzen, M. L., Zigone, D., and Eisen, O.: Fiber-Optic Airplane Seismology on the Northeast Greenland Ice Stream, Seismic Record, 3, 125–133, 2023. a, b, c, d, e, f, g
Freitag, J., Kipfstuhl, S., and Laepple, T.: Core-scale radioscopic imaging: a new method reveals density–calcium link in Antarctic firn, J. Glaciol., 59, 1009–1014, 2013. a
Froment, B., Campillo, M., and Roux, P.: Reconstructing the Green's function through iteration of correlations, C. R. Geosci., 343, 623–632, 2011. a
Gallagher, K., Charvin, K., Nielsen, S., Sambridge, M., and Stephenson, J.: Markov chain Monte Carlo (MCMC) sampling methods to determine optimal models, model resolution and model choice for Earth Science problems, Mar. Petrol. Geol., 26, 525–535, 2009. a
Gerber, T. A., Lilien, D. A., Rathmann, N. M., Franke, S., Young, T. J., Valero-Delgado, F., Ershadi, M. R., Drews, R., Zeising, O., Humbert, A., and Stoll, N.: Crystal orientation fabric anisotropy causes directional hardening of the Northeast Greenland Ice Stream, Nat. Commun., 14, 2653, https://doi.org/10.1038/s41467-023-38139-8, 2023. a, b, c, d
Gimbert, F., Nanni, U., Roux, P., Helmstetter, A., Garambois, S., Lecointre, A., Walpersdorf, A., Jourdain, B., Langlais, M., Laarman, O., and Lindner, F.: A multi-physics experiment with a temporary dense seismic array on the Argentière glacier, French Alps: The RESOLVE project, Seismol. Soc. Am., 92, 1185–1201, 2021. a
Grinsted, A., Hvidberg, C. S., Lilien, D. A., Rathmann, N. M., Karlsson, N. B., Gerber, T., Kjær, H. A., Vallelonga, P., and Dahl-Jensen, D.: Accelerating ice flow at the onset of the Northeast Greenland Ice Stream, Nat. Commun., 13, 5589, https://doi.org/10.1038/s41467-022-32999-2, 2022. a, b
Herrmann, R. B.: Computer programs in seismology: An evolving tool for instruction and research, Seismol. Res. Lett., 84, 1081–1088, 2013. a
Herron, M. M. and Langway, C. C.: Firn densification: an empirical model, J. Glaciol., 25, 373–385, 1980. a, b
Hillers, G., Ben-Zion, Y., Landes, M., and Campillo, M.: Interaction of microseisms with crustal heterogeneity: A case study from the San Jacinto fault zone area, Geochem. Geophy. Geosy., 14, 2182–2197, 2013. a, b
Hollmann, H., Treverrow, A., Peters, L. E., Reading, A. M., and Kulessa, B.: Seismic observations of a complex firn structure across the Amery Ice Shelf, East Antarctica, J. Glaciol., 67, 777–787, 2021. a
Hubbard, B., Luckman, A., Ashmore, D. W., Bevan, S., Kulessa, B., Kuipers Munneke, P., Philippe, M., Jansen, D., Booth, A., Sevestre, H., and Tison, J. L.: Massive subsurface ice formed by refreezing of ice-shelf melt ponds, Nat. Commun., 7, 11897, https://doi.org/10.1038/ncomms11897, 2016. a
Ice and Climate Group, N.: East GReenland Ice core Project (EGRIP) 2015–2023: Sixth year of EGRIP deep drilling, Eastgrip, https://eastgrip.nbi.ku.dk/documentation/2022/EGRIP2022FieldPlan_1stVersion.pdf (last access: 10 October 2023), 2023. a
Joughin, I., Smith, B. E., and Howat, I. M.: A complete map of Greenland ice velocity derived from satellite data collected over 20 years, J. Glaciol., 64, 1–11, 2018. a, b
Kowalewski, S., Helm, V., Morris, E. M., and Eisen, O.: The regional-scale surface mass balance of Pine Island Glacier, West Antarctica, over the period 2005–2014, derived from airborne radar soundings and neutron probe measurements, The Cryosphere, 15, 1285–1305, https://doi.org/10.5194/tc-15-1285-2021, 2021. a
Lehujeur, M., Vergne, J., Schmittbuhl, J., Zigone, D., Le Chenadec, A., and Team, E.: Reservoir imaging using ambient noise correlation from a dense seismic network, J. Geophys. Res.-Sol. Ea., 123, 6671–6686, 2018. a, b, c, d
Lévêque, J.-J., Maggi, A., and Souriau, A.: Seismological constraints on ice properties at Dome C, Antarctica, from horizontal to vertical spectral ratios, Antarct. Sci., 22, 572–579, 2010. a
Lin, F.-C., Li, D., Clayton, R. W., and Hollis, D.: High-resolution 3D shallow crustal structure in Long Beach, California: Application of ambient noise tomography on a dense seismic array, Geophysics, 78, Q45–Q56, https://doi.org/10.1190/geo2012-0453.1, 2013. a
Mojtabavi, S., Eisen, O., Franke, S., Jansen, D., Steinhage, D., Paden, J., Dahl-Jensen, D., Weikusat, I., Eichler, J., and Wilhelms, F.: Origin of englacial stratigraphy at three deep ice core sites of the Greenland Ice Sheet by synthetic radar modelling, J. Glaciol., 68, 799–811, 2022. a
Oraschewski, F. M. and Grinsted, A.: Modeling enhanced firn densification due to strain softening, The Cryosphere, 16, 2683–2700, https://doi.org/10.5194/tc-16-2683-2022, 2022. a, b
Pearce, E., Dimitri, Z., and Eisen, O.: Seismic node data from EastGRIP 2022, PANGAEA [data set], https://doi.org/10.1594/PANGAEA.963914, 2022. a
Pearce, E., Booth, A. D., Rost, S., Sava, P., Konuk, T., Brisbourne, A., Hubbard, B., and Jones, I.: A synthetic study of acoustic full waveform inversion to improve seismic modelling of firn, Ann. Glaciol., 63, 44–48, https://doi.org/10.1017/aog.2023.10 2023. a
Pedersen, H. A., Mars, J. I., and Amblard, P. O.: Improving Surface-Wave Group Velocity Measurements by Energy Reassignment, Geophysics, 68, 677–684, https://doi.org/10.1190/1.1567238, 2003. a
Peters, L., Anandakrishnan, S., Holland, C., Horgan, H., Blankenship, D., and Voigt, D.: Seismic detection of a subglacial lake near the South Pole, Antarctica, Geophys. Res. Lett., 35, L23501, https://doi.org/10.1029/2008GL035704, 2008. a
Picotti, S., Vuan, A., Carcione, J. M., Horgan, H. J., and Anandakrishnan, S.: Anisotropy and crystalline fabric of Whillans Ice Stream (West Antarctica) inferred from multicomponent seismic data, J. Geophys. Res.-Sol. Ea., 120, 4237–4262, 2015. a, b
Poli, P., Pedersen, H., Campillo, M., and Group, P. W.: Noise directivity and group velocity tomography in a region with small velocity contrasts: The northern Baltic shield, Geophys. J. Int., 192, 413–424, 2013. a
Rasmussen, S. O., Vinther, B. M., Freitag, J., and Kipfstuhl, S.: A standardized EGRIP density profile, true depth and ice-equivalent depth, PANGAEA [data set], https://doi.org/10.1594/PANGAEA.962754, 2023. a, b
Renalier, F., Jongmans, D., Campillo, M., and Bard, P.-Y.: Shear wave velocity imaging of the Avignonet landslide (France) using ambient noise cross correlation, J. Geophys. Res.-Earth, 115, F03032, https://doi.org/10.1029/2009JF001538, 2010. a
Riverman, K., Alley, R., Anandakrishnan, S., Christianson, K., Holschuh, N., Medley, B., Muto, A., and Peters, L.: Enhanced firn densification in high-accumulation shear margins of the NE Greenland Ice Stream, J. Geophys. Res.-Earth, 124, 365–382, 2019. a, b, c, d
Roux, P., Kuperman, W. A., and the NPAL Group: Extracting coherent wave fronts from acoustic ambient noise in the ocean, J. Acoust. Soc. Am., 116, 1995–2003, https://doi.org/10.1121/1.1797754, 2004. a
Sambridge, M. and Mosegaard, K.: Monte Carlo methods in geophysical inverse problems, Rev. Geophys., 40, 3-1–3-29, 2002. a
Schippkus, S., Zigone, D., Bokelmann, G., and the AlpArray Working Group: Ambient-noise tomography of the wider Vienna Basin region, Geophys. J. Int., 215, 102–117, https://doi.org/10.1093/gji/ggy259, 2018. a
Schippkus, S., Garden, M., and Bokelmann, G.: Characteristics of the ambient seismic field on a large-N seismic array in the Vienna basin, Seismol. Soc. Am., 91, 2803–2816, 2020. a
Schlegel, R., Diez, A., Löwe, H., Mayer, C., Lambrecht, A., Freitag, J., Miller, H., Hofstede, C., and Eisen, O.: Comparison of elastic moduli from seismic diving-wave and ice-core microstructure analysis in Antarctic polar firn, Ann. Glaciol., 60, 220–230, 2019. a, b, c
Schwander, J., Sowers, T., Barnola, J.-M., Blunier, T., Fuchs, A., and Malaizé, B.: Age scale of the air in the summit ice: Implication for glacial-interglacial temperature change, J. Geophys. Res.-Atmos., 102, 19483–19493, 1997. a
Sergeant, A., Chmiel, M., Lindner, F., Walter, F., Roux, P., Chaput, J., Gimbert, F., and Mordret, A.: On the Green's function emergence from interferometry of seismic wave fields generated in high-melt glaciers: implications for passive imaging and monitoring, The Cryosphere, 14, 1139–1171, https://doi.org/10.5194/tc-14-1139-2020, 2020. a
Shapiro, N.: Applications with Surface Waves Extracted from Ambient Seismic Noise, in: Seismic Ambient Noise, edited by: Nakata, N., Gualtieri, L., and Fichtner, A., 218–238, Cambridge University Press, https://doi.org/10.1017/9781108264808.009, 2019. a
Shapiro, N. and Ritzwoller, M.: Monte-Carlo inversion for a global shear-velocity model of the crust and upper mantle, Geophys. J. Int., 151, 88–105, 2002. a
Shapiro, N. M. and Campillo, M.: Emergence of broadband Rayleigh waves from correlations of the ambient seismic noise, Geophys. Res. Lett., 31, L07614, https://doi.org/10.1029/2004GL019491, 2004. a
Shapiro, N. M., Campillo, M., Stehly, L., and Ritzwoller, M. H.: High-resolution surface-wave tomography from ambient seismic noise, Science, 307, 1615–1618, https://doi.org/10.1126/science.1108339, 2005. a
Smith, A., Anker, P., Nicholls, K., Makinson, K., Murray, T., Rios-Costas, S., Brisbourne, A., Hodgson, D., Schlegel, R., and Anandakrishnan, S.: Ice stream subglacial access for ice-sheet history and fast ice flow: the BEAMISH Project on Rutford Ice Stream, West Antarctica and initial results on basal conditions, Ann. Glaciol., 62, 203–211, 2021. a
Stoll, N., Weikusat, I., Jansen, D., Bons, P., Darányi, K., Westhoff, J., Llorens, M.-G., Wallis, D., Eichler, J., Saruya, T., Homma, T., Drury, M., Wilhelms, F., Kipfstuhl, S., Dahl-Jensen, D., and Kerch, J.: EastGRIP ice core reveals the exceptional evolution of crystallographic preferred orientation throughout the Northeast Greenland Ice Stream, EGUsphere [preprint], https://doi.org//10.5194/egusphere-2024-2653, 2024. a
Tarantola, A.: Inverse Problem Theory and Methods for Model Parameter Estimation, SIAM: Society for Industrial and Applied Mathematics, ISBN 978-0-89871-572-9, 2005. a
Újvári, G., Klötzli, U., Stevens, T., Svensson, A., Ludwig, P., Vennemann, T., Gier, S., Horschinegg, M., Palcsu, L., Hippler, D., and Kovács, J.: Greenland ice core record of last glacial dust sources and atmospheric circulation, J. Geophys. Res.-Atmos., 127, e2022JD036597, https://doi.org/10.1029/2022JD036597, 2022. a
Vallelonga, P., Christianson, K., Alley, R. B., Anandakrishnan, S., Christian, J. E. M., Dahl-Jensen, D., Gkinis, V., Holme, C., Jacobel, R. W., Karlsson, N. B., Keisling, B. A., Kipfstuhl, S., Kjær, H. A., Kristensen, M. E. L., Muto, A., Peters, L. E., Popp, T., Riverman, K. L., Svensson, A. M., Tibuleac, C., Vinther, B. M., Weng, Y., and Winstrup, M.: Initial results from geophysical surveys and shallow coring of the Northeast Greenland Ice Stream (NEGIS), The Cryosphere, 8, 1275–1287, https://doi.org/10.5194/tc-8-1275-2014, 2014. a, b, c
Verjans, V., Leeson, A., McMillan, M., Stevens, C., van Wessem, J. M., van de Berg, W. J., van den Broeke, M. R., Kittel, C., Amory, C., Fettweis, X., and Hansen, N.: Uncertainty in East Antarctic firn thickness constrained using a model ensemble approach, Geophys. Res. Lett., 48, e2020GL092060, https://doi.org/10.1029/2020GL092060, 2021. a
Wang, W., Chen, P., Keifer, I., Dueker, K., Lee, E.-J., Mu, D., Jiao, J., Zhang, Y., and Carr, B.: Weathering front under a granite ridge revealed through full-3D seismic ambient-noise tomography, Earth Planet. Sc. Lett., 509, 66–77, https://doi.org/10.1016/j.epsl.2018.12.038, 2019. a
Xia, J., Miller, R. D., and Park, C. B.: Estimation of near-surface shear-wave velocity by inversion of Rayleigh waves, Geophysics, 64, 691–700, 1999. a
Yao, H. and Van Der Hilst, R. D.: Analysis of ambient noise energy distribution and phase velocity bias in ambient noise tomography, with application to SE Tibet, Geophys. J. Int., 179, 1113–1132, 2009. a
Yin, X., Xia, J., Shen, C., and Xu, H.: Comparative analysis on penetrating depth of high-frequency Rayleigh and Love waves, J. Appl. Geophys., 111, 86–94, 2014. a
Zeising, O., Gerber, T. A., Eisen, O., Ershadi, M. R., Stoll, N., Weikusat, I., and Humbert, A.: Improved estimation of the bulk ice crystal fabric asymmetry from polarimetric phase co-registration, The Cryosphere, 17, 1097–1105, https://doi.org/10.5194/tc-17-1097-2023, 2023. a
Zhang, Z., Nakata, N., Karplus, M., Kaip, G., and Yi, J.: Shallow ice-sheet composite structure revealed by seismic imaging near the West Antarctic Ice Sheet (WAIS) Divide Camp, J. Geophys. Res.-Earth, 127, e2022JF006777, https://doi.org/10.1029/2022JF006777, 2022. a, b, c, d
Zhou, W., Butcher, A., Brisbourne, A. M., Kufner, S.-K., Kendall, J.-M., and Stork, A. L.: Seismic Noise Interferometry and Distributed Acoustic Sensing (DAS): Inverting for the Firn Layer S-Velocity Structure on Rutford Ice Stream, Antarctica, J. Geophys. Res.-Earth, 127, e2022JF006917, https://doi.org/10.1029/2022JF006917, 2022. a, b, c
Zigone, D., Ben-Zion, Y., Campillo, M., and Roux, P.: Seismic tomography of the Southern California plate boundary region from noise-based Rayleigh and Love waves, Pure Appl. Geophys., 172, 1007–1032, 2015. a, b
Zigone, D., Ben-Zion, Y., Lehujeur, M., Campillo, M., Hillers, G., and Vernon, F. L.: Imaging subsurface structures in the San Jacinto fault zone with high-frequency noise recorded by dense linear arrays, Geophys. J. Int., 217, 879–893, 2019. a, b, c, d, e, f
- Abstract
- Introduction
- Study area
- Data, noise processing, and cross-correlations
- Results: inversion of dispersion measurements for shear wave velocity
- Discussion
- Conclusions
- Appendix A
- Data availability
- Author contributions
- Competing interests
- Disclaimer
- Acknowledgements
- Financial support
- Review statement
- References


