Wavelet-ANN versus ANN-Based Model for Hydrometeorological Drought Forecasting


<p>Neural network structure.</p> "> Figure 2
<p>Schematic diagram of wavelet-based artificial neural network (W-ANN) model development.</p> "> Figure 3
<p>Langat River Basin.</p> "> Figure 4
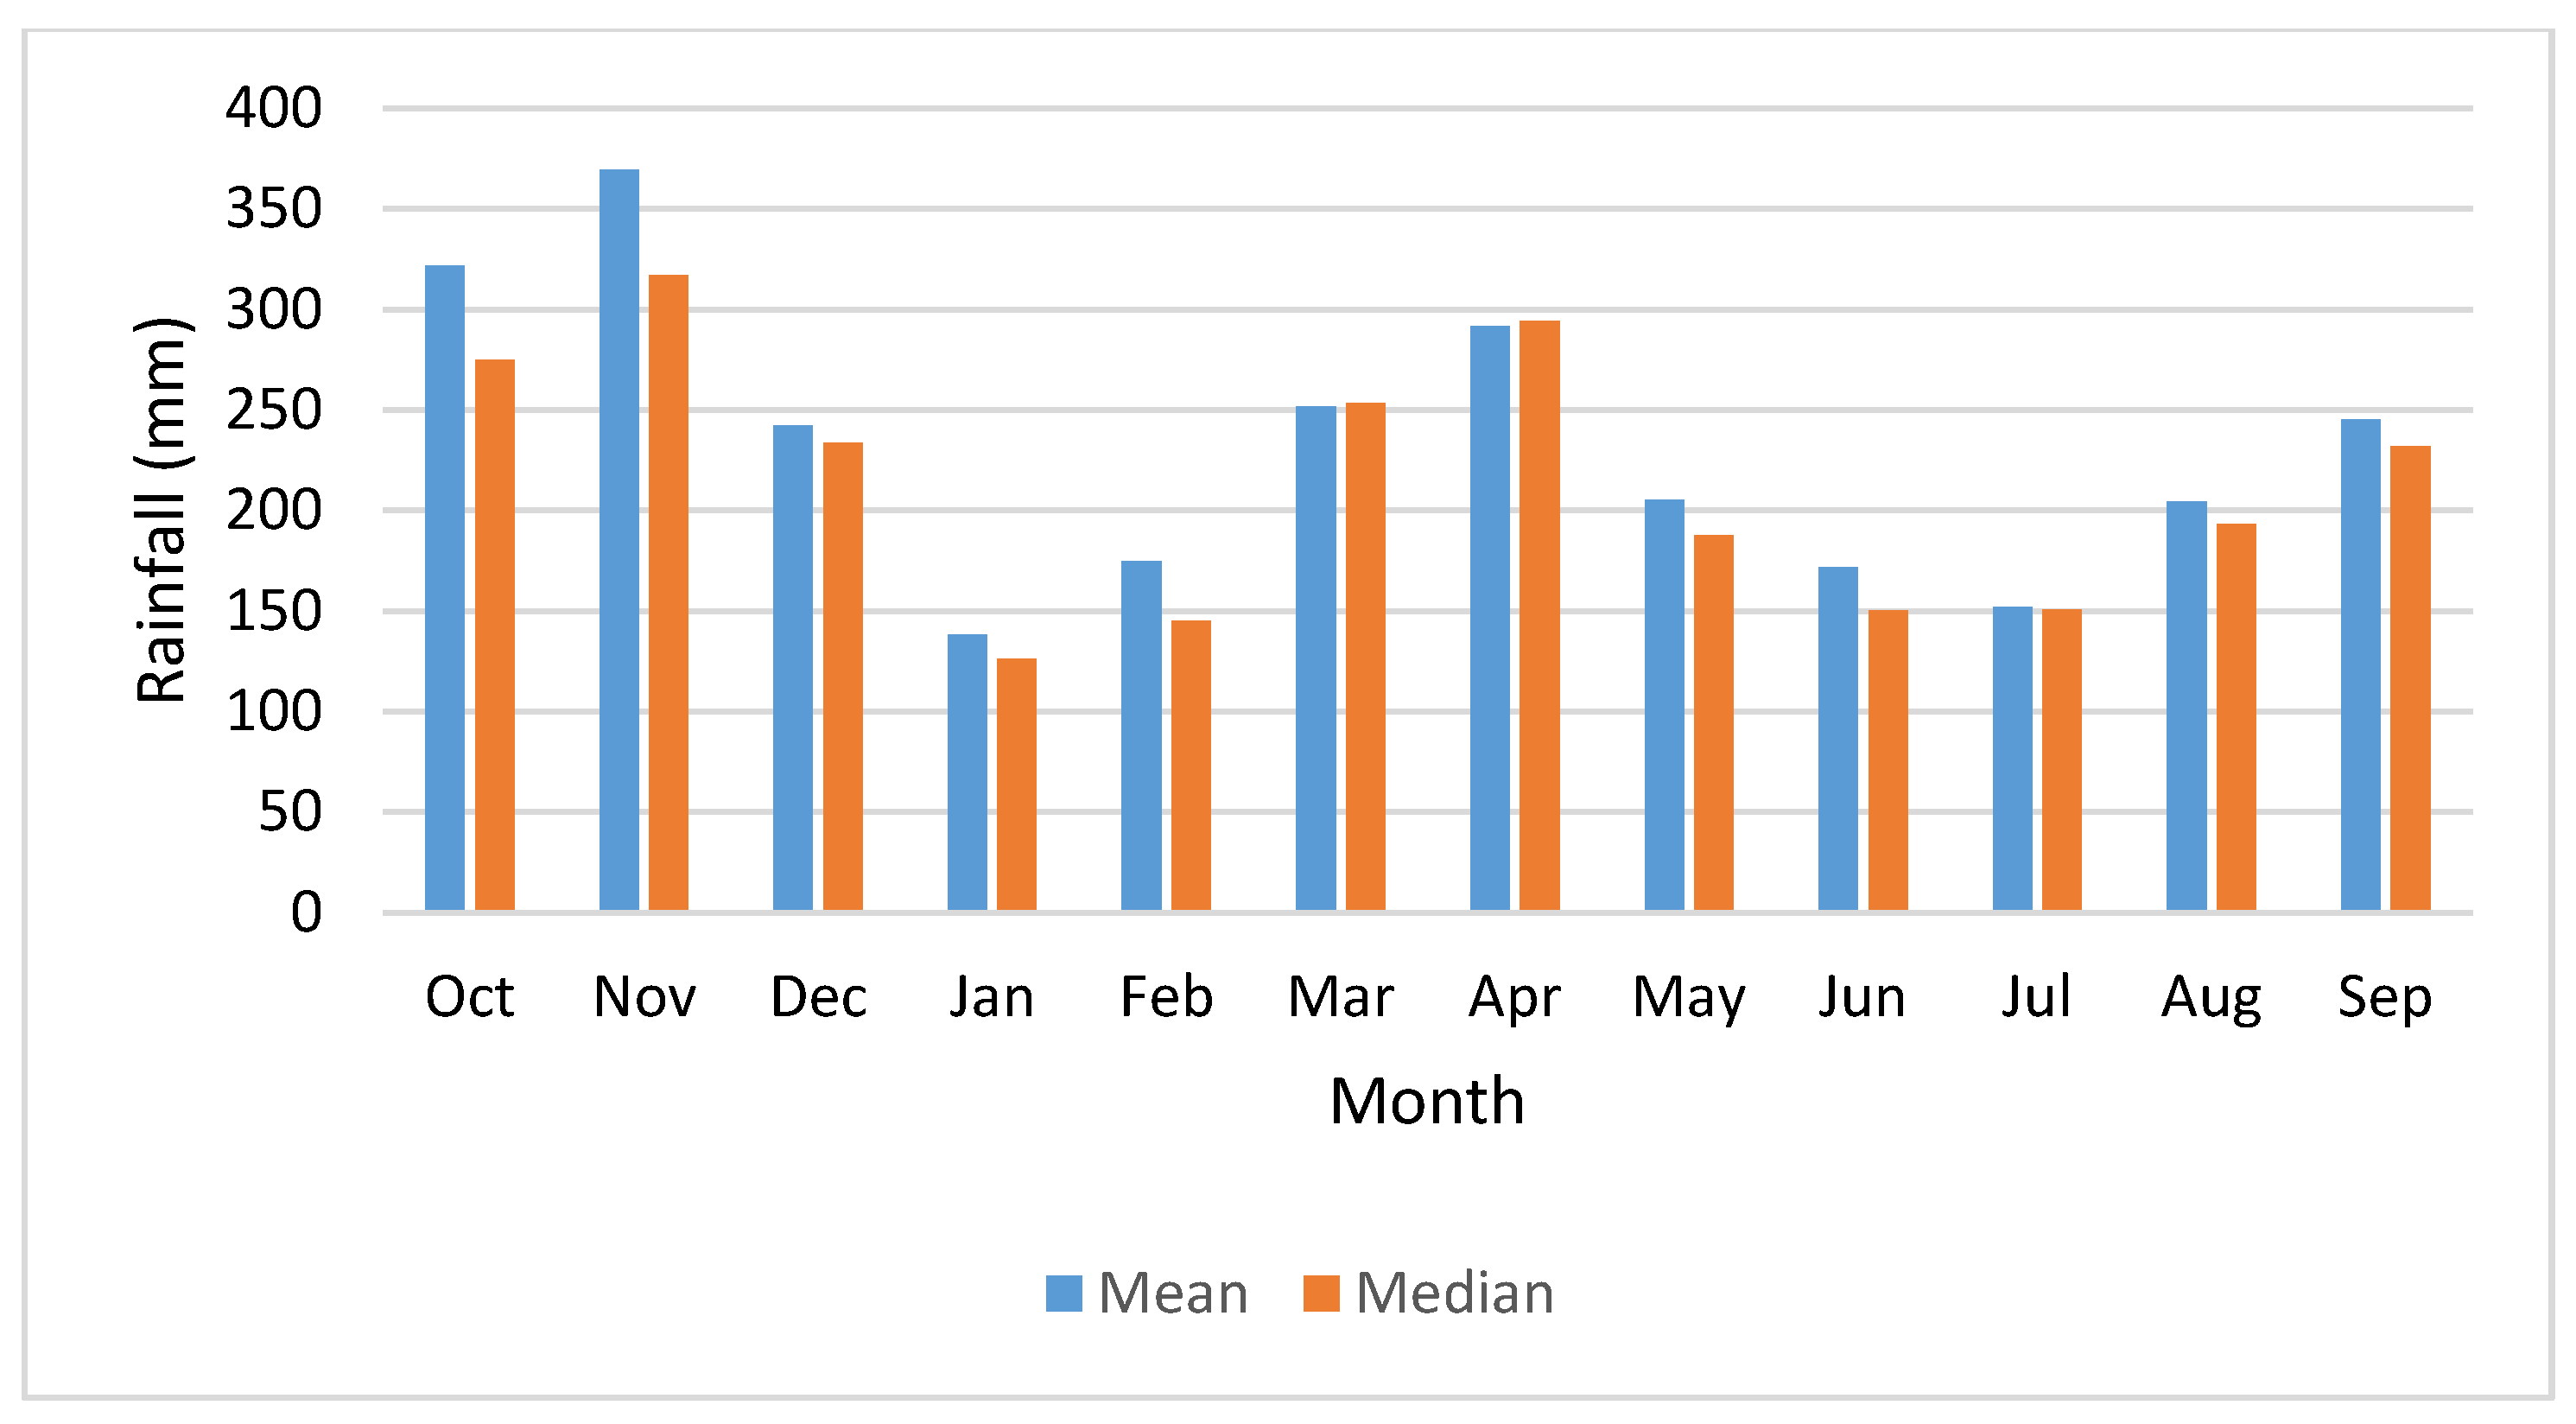
<p>Monthly rainfall distribution at station 2, estimated using data from 1986 to 2016.</p> "> Figure 5
<p>Water level data for 30 years at station 1 (1986–2016).</p> "> Figure 6
<p>Standard Index of Annual Precipitation (SIAP) values for 30 years at station 2.</p> "> Figure 7
<p>Distribution of SIAP values into classes (station 2).</p> "> Figure 8
<p>Neural network training regression for input model 1.</p> "> Figure 9
<p>Error histogram of input model number 1.</p> "> Figure 10
<p>Comparison of observed and forecasted SIAP at station 2 of input model number 1.</p> "> Figure 11
<p>Standardized Water Storage Index (SWSI) values for station 1 for 30 years (360 months).</p> "> Figure 12
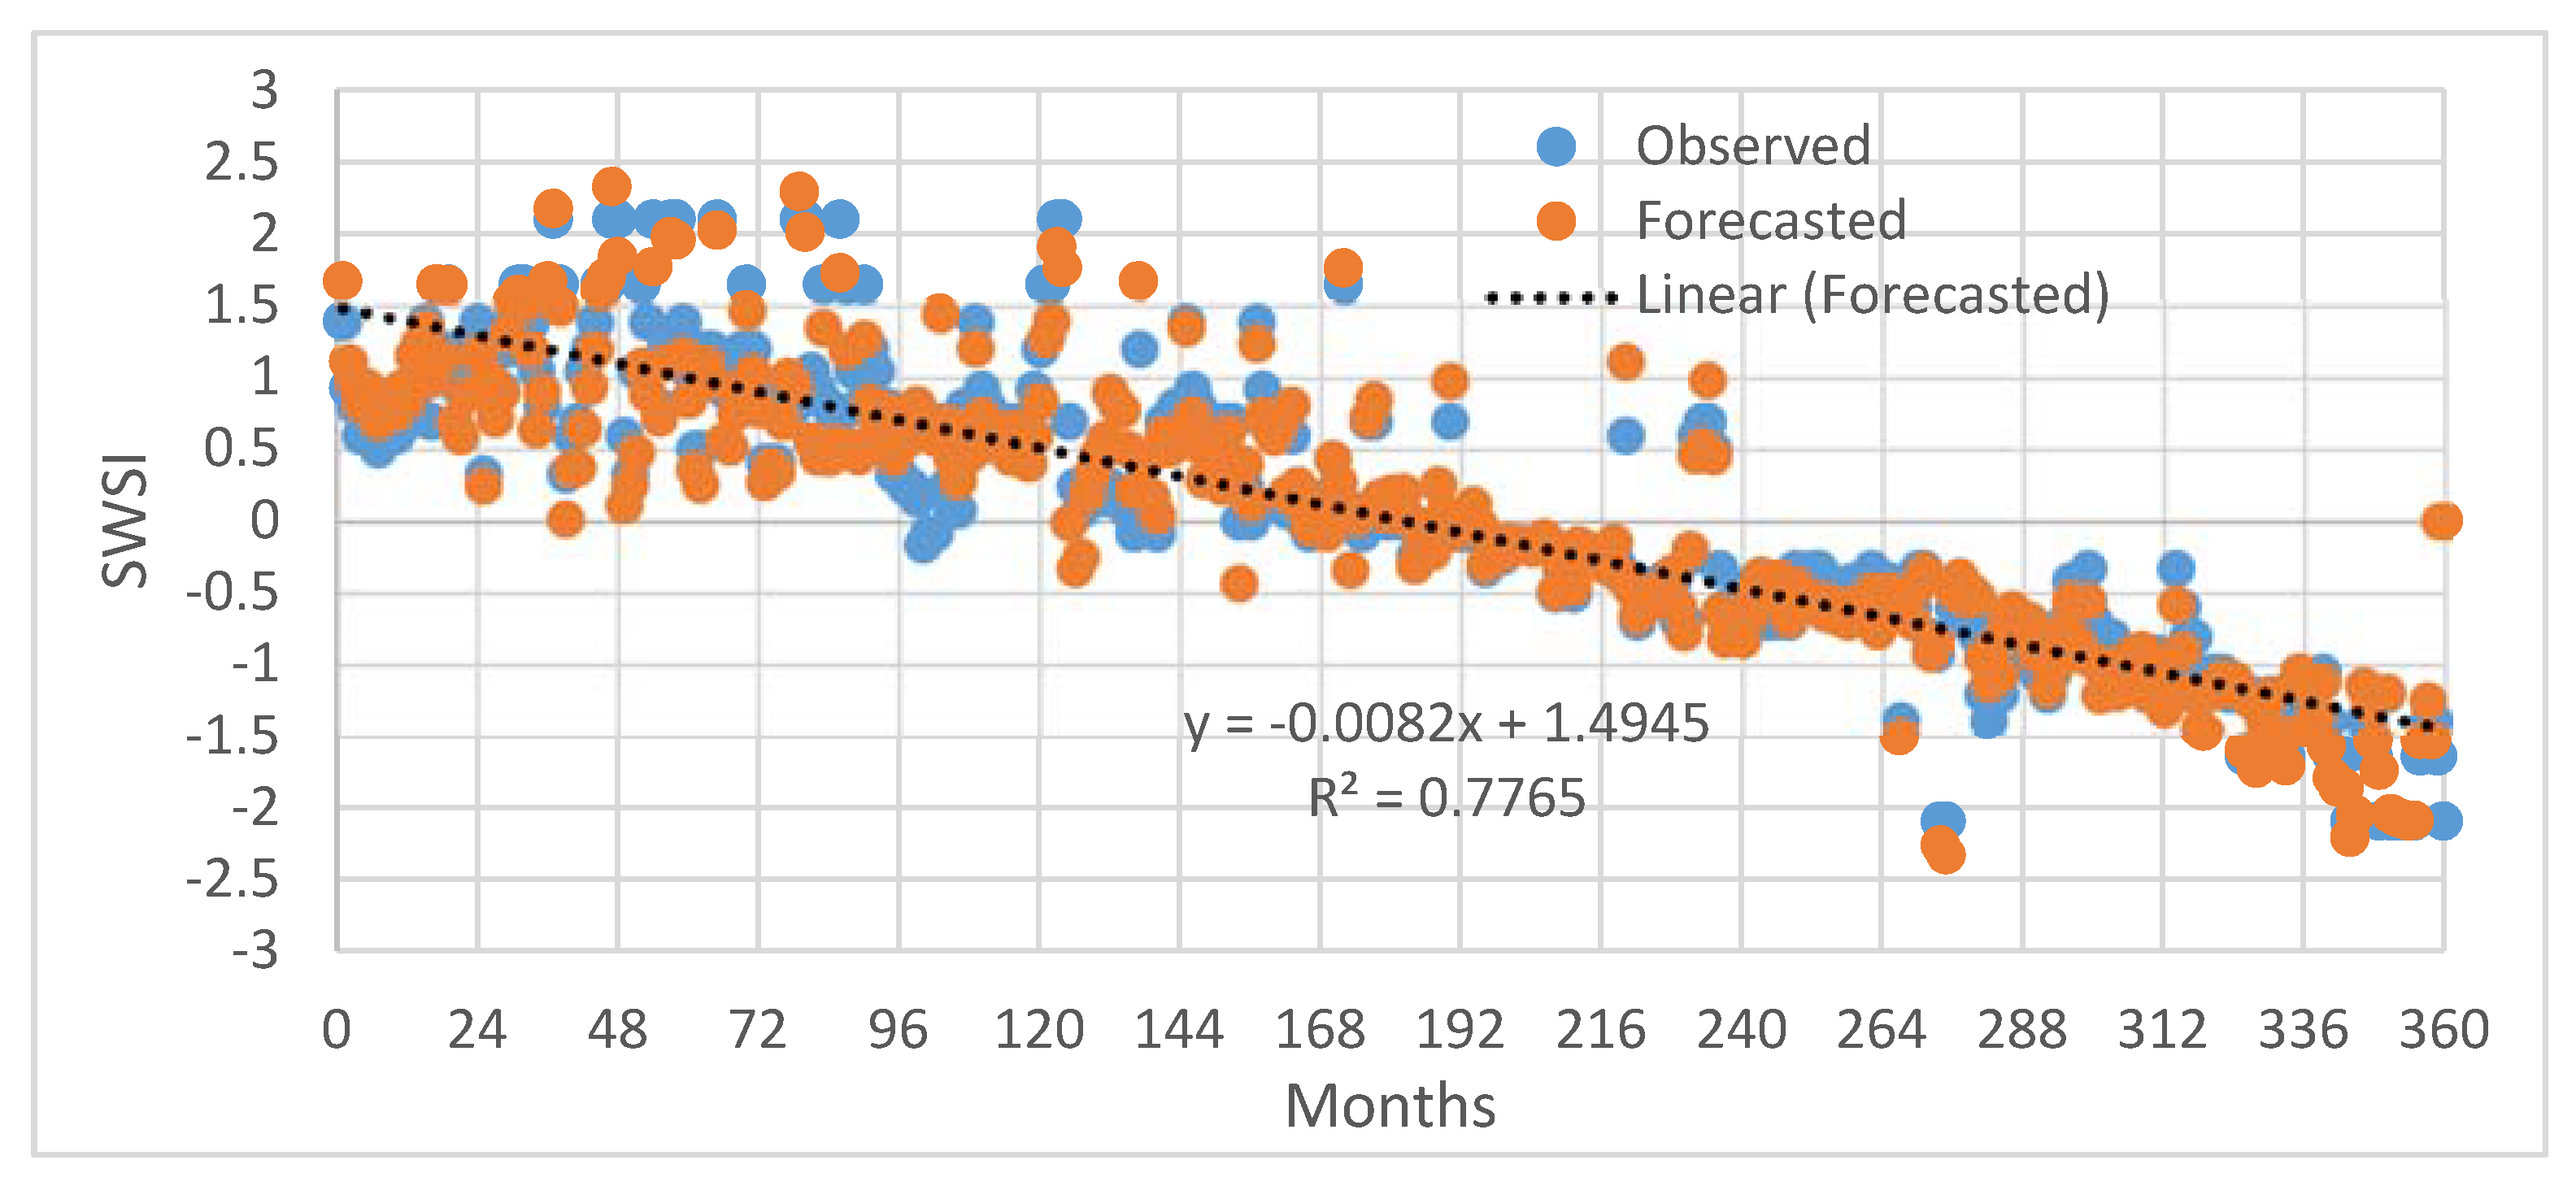
<p>SWSI observed and forecasted values (360 months) of station 1 for input model number 3.</p> "> Figure 13
<p>Error histogram for SWSI input model number 3.</p> "> Figure 14
<p>Correlation coefficient for SWSI at station 1 for input model number 3.</p> "> Figure 15
<p>Scatter plot comparing observed and forecasted hydrological drought using W-ANN models.</p> "> Figure 16
<p>Scatter plot comparing observed and forecasted meteorological drought using W-ANN models.</p> ">
Abstract
:1. Introduction
2. Materials and Methods
2.1. Standard Index of Annual Precipitation (SIAP)
2.2. Standardized Water Storage Index (SWSI)
2.3. Development of Forecasting Model Using ANN
2.4. Discrete Wavelet
2.5. W-ANN Model
- Decompose the original time series for each input into subseries components (details and approximations) by DWT.
- Select the most important and effective of each subseries component for each input by the correlation coefficient.
- Construct a W-ANN model using the new summed series obtained by adding the significant components of details sub-time series and approximations sub-time series for each input as the new input to the ANN, and the original output time series as the output of the ANN. Figure 2 shows a schematic representation of the model.
2.6. Study Area and Data Collection
2.6.1. Langat River Basin
2.6.2. Data Collection
2.6.3. Distribution of Rainfall and Water Level
3. Results and Discussion
3.1. Assessment Using Standard Index of Annual Precipitation (SIAP)
Artificial Neural Network (ANN) Model
3.2. Assessment Using SWSI for Hydrological Drought
Artificial Neural Network Model for Hydrological Drought
3.3. W-ANN Model
4. Conclusions
Author Contributions
Funding
Acknowledgments
Conflicts of Interest
References
- Basics, D.; Drought, T. Types of Drought. Available online: http://drought.unl.edu/DroughtBasics/TypesofDrought.aspx (accessed on 14 October 2017).
- Deni, S.; Jemain, A.; Ibrahim, K. The spatial distribution of wet and dry spells over Peninsular Malaysia. Theor. Appl. Climatol. 2008, 94, 163–173. [Google Scholar] [CrossRef]
- Jamalluddin, S.A.; Low, K.S. Droughts in Malaysia: A Look at Its Characteristics, Impacts, Related Policies and Management Strategies. In Proceedings of the Water and Drainage 2003 Conference, Kuala Lumpur, Malaysia, 28–29 April 2003. [Google Scholar]
- Staff, S.; Staff, S. Drought beyond India: Malaysia Faces a Massive Water Crisis as South East Asia Swelters. Available online: http://scroll.in/article/806812/drought-beyond-india-malaysia-faces-a-massive-water-crisis-as-south-east-asia-swelters (accessed on 25 November 2017).
- Wan, W.Z.; Ibrahim, K.; Jemain, A.A. Evaluating dry conditions in Peninsular Malaysia using bivariate copula. Anziam J. 2010, 51, 555–569. [Google Scholar]
- Morid, S.; Smakhtin, V.; Moghaddasi, M. Comparison of seven meteorological indices for drought monitoring in Iran. Int. J. Climatol. 2006, 26, 971–985. [Google Scholar] [CrossRef] [Green Version]
- Karavitis, C.A.; Alexandris, S.; Tsesmelis, D.E.; Athanasopoulos, G. Application of the Standardized Precipitation Index (SPI) in Greece. Water 2011, 3, 787–805. [Google Scholar] [CrossRef] [Green Version]
- Gourabi, B.R. The Recognition of Drought with Dri and Siap Method and its Effects on Rice Yield and Water Surface in Shaft, Gilan, south Western of Caspian Sea. Aust. J. Basic Appl. Sci. 2010, 4, 4374–4378. [Google Scholar]
- Arvind Singh, T.; Bhawana, N.; Lokendra, S. Drought spells identification with indices for Almora district of Uttarakhand, India. Am. Int. J. Res. Sci. Technol. Eng. Math. 2015, 12, 1–5. [Google Scholar]
- Farahmand, A.; AghaKouchak, A. A generalized framework for deriving nonparametric standardized drought indicators. Adv. Water Resour. 2015, 76, 140–145. [Google Scholar] [CrossRef]
- Wang, W.; Wang, P.; Cui, W. A comparison of terrestrial water storage data and multiple hydrological data in the Yangtze River basin. Adv. Water Sci. 2015, 26, 759–768. [Google Scholar]
- Nourani, V.; Komasi, M.; Mano, A. A Multivariate ANN-Wavelet Approach for Rainfall–Runoff Modeling. Water Resour. Manag. 2009, 23, 2877. [Google Scholar] [CrossRef]
- Panagoulia, D. Hydrological modeling of a medium-sized mountainous catchment from incomplete meteoro-logical data. J. Hydrol. 1992, 137, 279–310. [Google Scholar] [CrossRef]
- Panagoulia, D. Artificial neural networks and high and low flows in various climate regimes. Hydrol. Sci. J. 2006, 51, 563–587. [Google Scholar] [CrossRef] [Green Version]
- Govindaraju, R. Artificial neural networks in hydrology. II: hydrologic applications. J. Hydrol. Eng. 2000, 5, 124–137. [Google Scholar]
- Peng, T.; Zhou, J.; Zhang, C.; Fu, W. Streamflow Forecasting Using Empirical Wavelet Transform and Artificial Neural Networks. Water 2017, 9, 406. [Google Scholar] [CrossRef]
- Zhou, J.; Peng, T.; Zhang, C.; Sun, N. Data Pre-Analysis and Ensemble of Various Artificial Neural Networks for Monthly Streamflow Forecasting. Water 2018, 10, 628. [Google Scholar] [CrossRef]
- Remesan, R.; Shamim, M.A.; Han, D.; Mathew, J. Runoff prediction using an integrated hybrid modelling scheme. J. Hydrol. 2009, 372, 48–60. [Google Scholar] [CrossRef]
- Tayyab, M.; Zhoua, J.; Adnana, R.; Zenga, X.; Zenga, X. Application of Artificial Intelligence Method Coupled with Discrete Wavelet Transform Method. Procedia. Comput. Sci. 2017, 107, 212–217. [Google Scholar] [CrossRef]
- Zhou, T.; Wang, F.; Yang, Z. Comparative Analysis of ANN and SVM Models Combined with Wavelet Preprocess for Groundwater Depth Prediction. Water 2017, 9, 781. [Google Scholar] [CrossRef]
- Seo, Y.; Choi, Y.; Choi, J. River Stage Modeling by Combining Maximal Overlap Discrete Wavelet Transform, Support Vector Machines and Genetic Algorithm. Water 2017, 9, 525. [Google Scholar] [Green Version]
- Wang, D.; Ding, J. Wavelet network model and its application to the prediction of hydrology. Nat. Sci. 2003, 1, 67–71. [Google Scholar]
- Kim, T.W.; Valdes, J.B. Nonlinear model for drought forecasting based on a conjunction of wavelet transforms and neural networks. J. Hydrol. Eng. 2003, 6, 319–328. [Google Scholar] [CrossRef]
- Shabri, A. A hybrid model for stream flow forecasting using wavelet and least Squares support vector machines. Jurnal Teknologi 2015, 73, 89–96. [Google Scholar] [CrossRef]
- Belayneh, A.; Adamowski, J. Drought forecasting using new machine learning methods. J. Water Land Dev. 2013, 18, 3–12. [Google Scholar] [CrossRef]
- Khalili, A.; Bazrafshan, J. Assessing the efficiency of several drought indices in different climatic regions of Iran. Nivar J. 2003, 48, 79–93. [Google Scholar]
- Najjar, S.; Rouhollah, R.Y. Studying & Comparing the Efficiency of 7 Meteorological Drought Indices in Droughts Risk Management (Case Study: North West Regions). Appl. Math. Eng. Manag. Technol. 2015, 3, 131–142. [Google Scholar]
- Haykin, S. Neural Networks: A Comprehensive Foundation, 2nd ed.; Prentice Hall: Upper Saddle River, NJ, USA, 1999. [Google Scholar]
- Demuth, H.; Beale, M. Neural Network Toolbox: For Use with Matlab; The MathWorks, Inc.: Natick, MA, USA, 2005. [Google Scholar]
- Bishop, C.M. Neural Networks for Pattern Recognition; Oxford University Press: Oxford, UK, 1995; p. 482. [Google Scholar]
- El-Shafie, A.; Noureldin, A.; Taha, M.; Hussain, A. Dynamic versus static neural network model for rainfall forecasting at Klang River Basin, Malaysia. Hydrol. Earth Syst. Sci. Discuss. 2011, 8, 6489–6532. [Google Scholar] [CrossRef]
- Dawson, C.W.; Abrahart, R.J.; See, L.M. HydroTest: A web-based toolbox of statistical measures for the standardised assessment of hydrological forecasts. Environ. Modell. Softw. 2007, 27, 1034–1052. [Google Scholar] [CrossRef]
- Napolitano, G.; Serinaldi, F.; See, L. Impact of EMD decomposition and random initialisation of weights in ANN hindcasting of daily stream flow series: An empirical examination. J. Hydrol. 2011, 406, 199–214. [Google Scholar] [CrossRef]
- Barua, S.; Ng, A.; Perera, B. Artificial Neural Network—Based Drought Forecasting Using a Nonlinear Aggregated Drought Index. J. Hydrol. Eng. 2012, 17, 1408–1413. [Google Scholar] [CrossRef]
- Kisi, O. Wavelet regression model as an altrnative to neural networks for river stage forecasting. Water Resour. Manag. 2011, 25, 579–600. [Google Scholar] [CrossRef]
- Nourani, V.; Baghanam, A.H.; Adamowski, J.; Kisi, O. Applications of hybrid wavelet-Artificial Intelligence models in hydrology: A review. J. Hydrol. 2014, 514, 358–377. [Google Scholar] [CrossRef]
- Mallat, S.G. A theory for multi decomposition signal decomposition: The wavelet representation. IEEE Trans. Pattern Anal. Mach. Intell. 1989, 11, 674–693. [Google Scholar] [CrossRef]
- Hasan, M.; Begum, M.; Al Mamun, A.; Haque Khan, Z. Selection of extreme drought event for Langat Basin and its consequence on salinity intrusion through Langat River System. IOSR J. Mech. Civ. Eng. 2014, 11, 62–69. [Google Scholar] [CrossRef]
- Singh, V.P. Elementary Hydrology; Prentice Hall of India: New Delhi, India, 1994. [Google Scholar]
- Dawson, C.W.; Abrahart, R.J.; Shamseldin, A.Y.; Wilby, R.C. Flood estimation at ungauged sites using artificial neural networks. J. Hydrol. 2006, 319, 391–409. [Google Scholar] [CrossRef] [Green Version]
- Morid, S.; Smakhtin, V.; Bagherzadeh, K. Drought forecasting using artificial neural networks and time series of drought indices. Int. J. Climatol. 2007, 27, 2103–2111. [Google Scholar] [CrossRef] [Green Version]
- Shahin, M.A.; Maier, H.R.; Jaksa, M.B. Data Division for Developing Neural Networks Applied to Geotechnical Engineering. J. Comput. Civ. Eng. 2004, 18, 105–114. [Google Scholar] [CrossRef]
- Khadr, M. Forecasting of meteorological drought using Hidden Markov Model (case study: The upper Blue Nile river basin, Ethiopia). Ain Shams Eng. J. 2016, 7, 47–56. [Google Scholar] [CrossRef]
- Claudio, G.; Joseph, Q.; Carmine, T.; Svetoslav, I.; Silviya, P. Public Transportation Energy Consumption Prediction by means of Neural Network and Time Series Analysis Approaches. In Proceedings of the 6th International Conference on Automotive and Transportation Systems, Slerno, Italy, 27–29 June 2015; pp. 64–70. [Google Scholar]
- Amit, K.Y.; Hasmat, M.; Chandel, S.S. Selection of most relevant input parameters using WEKA for artificial Neural network based solar radiation prediction models. Renew. Sustain. Energy Rev. 2014, 31, 509–519. [Google Scholar]


| Classes of Drought Intensity | SIAP Values |
|---|---|
| Extremely wet | 0.84 or more |
| Wet | 0.52 to 0.84 |
| Normal | −0.52 to 0.52 |
| Drought | −0.52 to −0.84 |
| Extreme drought | −0.84 or less |
| SWSI Values | Classification |
|---|---|
| 2.0 or more | Extremely wet |
| 1.5 to 1.99 | Very wet |
| 1.0 to 1.49 | Moderately wet |
| −0.99 to 0.99 | Near normal |
| −1.49 to −1.00 | Moderate drought |
| −1.99 to −1.5 | Severe drought |
| −2 or less | Extreme drought |
| Station | Station Name | Station No. | Coordinates | Data Availability (Years) | Missing Data (%) | |
|---|---|---|---|---|---|---|
| Latitude (N) | Longitude (E) | |||||
| 1 | Sg. Semenyih di Sg. Rincing | WL 2918401 | 02°54′55″ | 101°49′25″ | 1986–2016 | 5.4% |
| 2 | Ldg. Dominion | RF 3018107 | 03°00′13″ | 101°52′55″ | 6.5% | |
| Category | Number of Months | Percentage (%) |
|---|---|---|
| Extremely wet | 62 | 17 |
| Wet | 25 | 7 |
| Normal | 140 | 39 |
| Drought | 61 | 17 |
| Very severe drought | 72 | 20 |
| Total | 360 | 100 |
| Input Model Number | Number of Neurons | R | |||
|---|---|---|---|---|---|
| Training | Validation | Testing | Overall | ||
| 1 | 10 | 0.907 | 0.865 | 0.908 | 0.899 |
| 1 | 15 | 0.803 | 0.845 | 0.758 | 0.800 |
| 1 | 12 | 0.796 | 0.765 | 0.801 | 0.783 |
| 2 | 8 | 0.712 | 0.813 | 0.705 | 0.741 |
| 2 | 9 | 0.737 | 0.799 | 0.782 | 0.770 |
| 2 | 10 | 0.882 | 0.875 | 0.851 | 0.868 |
| Drought Classification | Condition | Number of Months | Percentage (%) |
|---|---|---|---|
| Extremely wet | >2 | 12 | 3.33 |
| Very wet | 1.5 to −2 | 16 | 4.44 |
| Moderately wet | 1.0 to 1.5 | 35 | 9.72 |
| Near normal | −1.0 to 1.0 | 240 | 66.67 |
| Moderate drought | −1.5 to −1.0 | 37 | 10.28 |
| Severe drought | −2.0 to −1.5 | 9 | 2.50 |
| Extreme drought | <−2 | 11 | 3.06 |
| Input Model Number | Number of Neurons | R | |||
|---|---|---|---|---|---|
| Training | Validation | Testing | Overall | ||
| 3 | 10 | 0.968 | 0.967 | 0.969 | 0.968 |
| 3 | 11 | 0.898 | 0.908 | 0.951 | 0.918 |
| 3 | 7 | 0.767 | 0.801 | 0.822 | 0.796 |
| 4 | 15 | 0.901 | 0.855 | 0.835 | 0.865 |
| 4 | 10 | 0.911 | 0.899 | 0.853 | 0.888 |
| 4 | 6 | 0.751 | 0.772 | 0.811 | 0.779 |
| Discrete Wavelet Components (db3) | Correlation between Detailed Sub-Time Series and Observed Drought Index/Rainfall/Water Level Data | ||||
|---|---|---|---|---|---|
| SIAP | SWSI | Rainfall | Water Level * | Dominant | |
| D1 | 0.5291 | 0.1996 | 0.5291 | 0.1335 | √ |
| D2 | 0.5732 | 0.2221 | 0.5732 | 0.1522 | √ |
| D3 | 0.3645 | 0.1900 | 0.3645 | 0.1409 | √ |
| D4 | 0.2130 | 0.1322 | 0.2130 | 0.1120 | x |
| D5 | 0.1616 | 0.1519 | 0.1616 | 0.1333 | x |
| D6 | 0.2576 | 0.1885 | 0.2576 | 0.0694 | x |
| D7 | 0.2015 | 0.0820 | 0.2015 | 0.3151 * | |
| D8 | 0.3201 | 0.3923 | 0.3201 | 0.4303 * | √ |
| Average | 0.3274 | 0.1948 | 0.3274 | 0.1858 | |
| Input Model (After Wavelet Decomposition) | RMSE (Validation) | R (Overall) | Hidden Neurons |
|---|---|---|---|
| 1 (Rt-1, Rt-2, Rt-3) | 0.38 | 0.932 | 8 |
| 1 (Rt-1, Rt-2, Rt-3) | 0.41 | 0.931 | 10 |
| 1 (Rt-1, Rt-2, Rt-3) | 0.38 | 0.901 | 15 |
| 2 (SIt-1, SIt-2, SIt-3) | 0.40 | 0.922 | 8 |
| 2 (SIt-1, SIt-2, SIt-3) | 0.42 | 0.931 | 10 |
| 2 (SIt-1, SIt-2, SIt-3) | 0.39 | 0.940 | 15 |
| 3 (Wt-1, Wt-2, Wt-3) | 0.40 | 0.902 | 8 |
| 3 (Wt-1, Wt-2, Wt-3) | 0.43 | 0.901 | 10 |
| 3 (Wt-1, Wt-2, Wt-3) | 0.38 | 0.910 | 15 |
| 4 (SWt-1, SWt-2, SWt-3) | 0.19 | 0.971 | 10 |
| 4 (SWt-1, SWt-2, SWt-3) | 0.17 | 0.972 | 13 |
| 4 (SWt-1, SWt-2, SWt-3) | 0.21 | 0.973 | 15 |
| Input Model | R (With Wavelet Decomposition) | R (Without Wavelet Decomposition) | Performance Improvement (%) |
|---|---|---|---|
| 1 (Rt-1, Rt-2, Rt-3) | 0.932 | 0.899 | +3.67 |
| 2 (SIt-1, SIt-2, SIt-3) | 0.940 | 0.868 | +8.29 |
| 3 (Wt-1, Wt-2, Wt-3) | 0.910 | 0.968 | −5.99 |
| 4 (SWt-1, SWt-2, SWt-3) | 0.973 | 0.888 | +9.57 |
© 2018 by the authors. Licensee MDPI, Basel, Switzerland. This article is an open access article distributed under the terms and conditions of the Creative Commons Attribution (CC BY) license (http://creativecommons.org/licenses/by/4.0/).
Share and Cite
Khan, M.M.H.; Muhammad, N.S.; El-Shafie, A. Wavelet-ANN versus ANN-Based Model for Hydrometeorological Drought Forecasting. Water 2018, 10, 998. https://doi.org/10.3390/w10080998
Khan MMH, Muhammad NS, El-Shafie A. Wavelet-ANN versus ANN-Based Model for Hydrometeorological Drought Forecasting. Water. 2018; 10(8):998. https://doi.org/10.3390/w10080998
Chicago/Turabian StyleKhan, Md Munir H., Nur Shazwani Muhammad, and Ahmed El-Shafie. 2018. "Wavelet-ANN versus ANN-Based Model for Hydrometeorological Drought Forecasting" Water 10, no. 8: 998. https://doi.org/10.3390/w10080998