
Design and Implementation of a Low-Cost Chlorophyll Content Meter


<p>The low-cost chlorophyll meter presented in this work: external (<b>a</b>) and internal view (<b>b</b>).</p> "> Figure 2
<p>The experimental prototype sensor clip part of the device. Figures (<b>a</b>–<b>i</b>) show details from the concept design stage to the final implementation.</p> "> Figure 3
<p>The wiring diagram of the experimental chlorophyll meter device’s prototype.</p> "> Figure 4
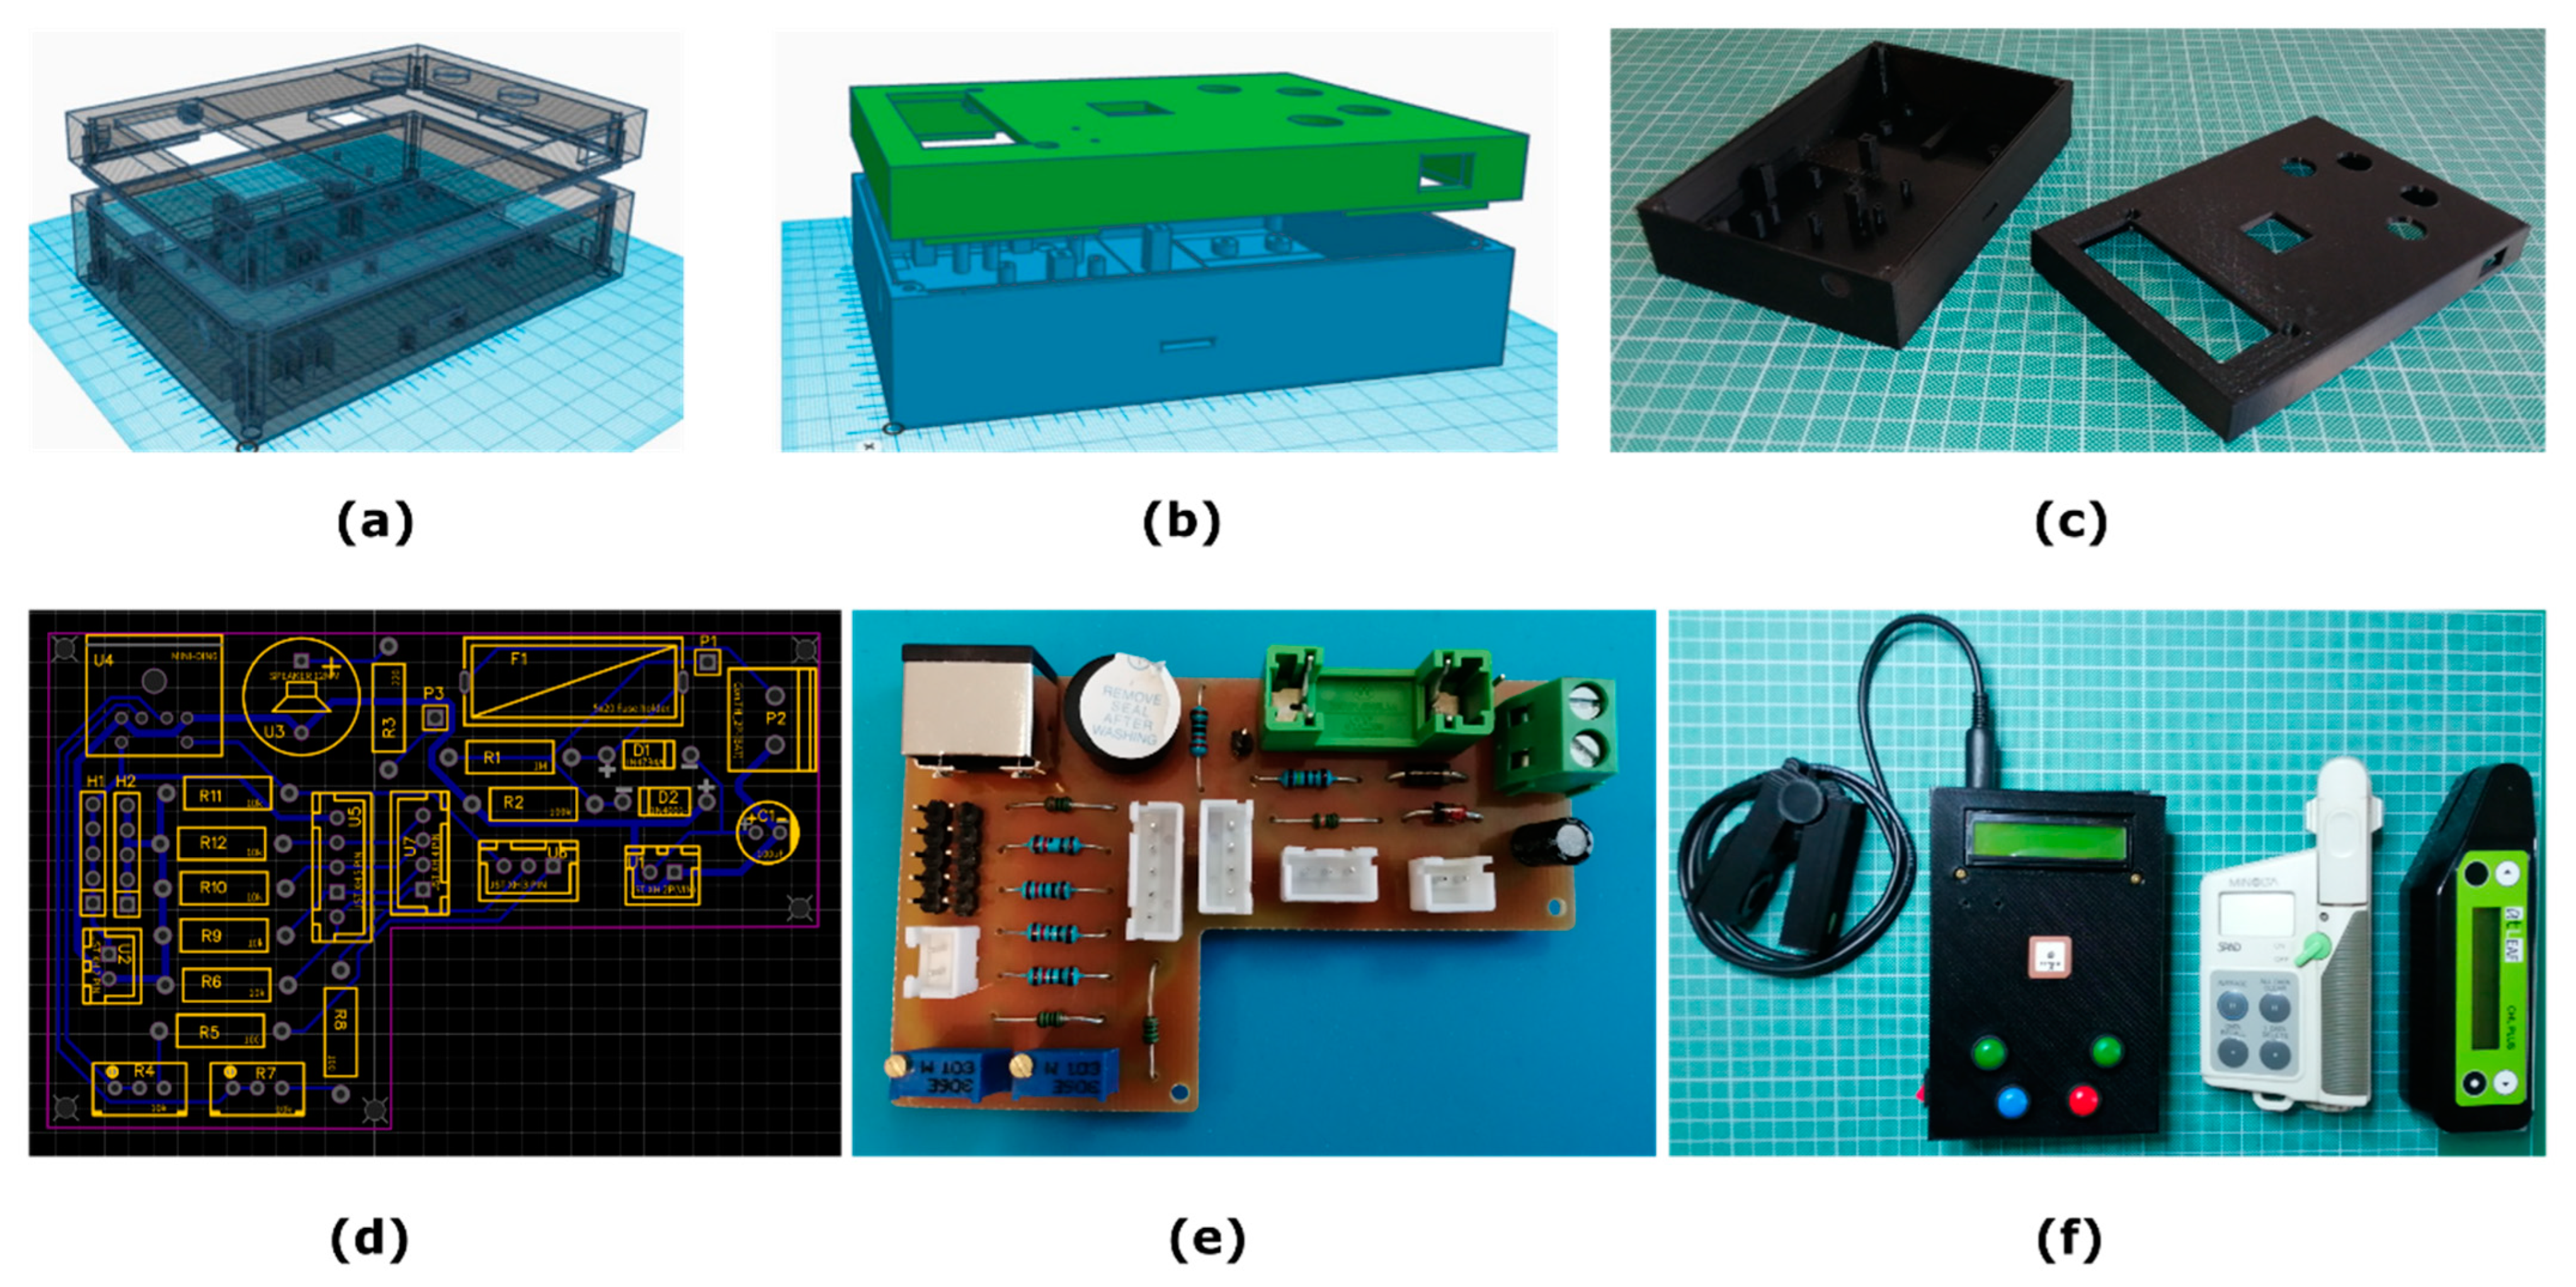
<p>The designed model’s front (dimensions-WxLxH: 100 mm × 149.18 mm × 17 mm) and back cover (dimensions-WxLxH: 100 mm × 149.18 mm × 29.02 mm) of the “control box” are shown in (<b>a</b>,<b>b</b>), along with the 3D-printed parts (<b>c</b>). The designed (<b>d</b>) and constructed (<b>e</b>) simple, one-sided, auxiliary PCB is shown. In (<b>f</b>), the experimental meter is shown along with the two commercial chlorophyll meters, the SPAD-502 and atLeaf CHL Plus.</p> "> Figure 5
<p>Flowchart of the proposed chlorophyll meter device software’s operation pipeline.</p> "> Figure 6
<p>In (<b>a</b>), the 30 lemon leaves samples of experiment 1 are shown, selected to span a wide range of color shades (slightly yellow to dark green). In (<b>b</b>), a snapshot of some of the young Brussels sprouts growing in an experimental garden that were used for the measurements referred to in experiment 2. The chlorophyll meter measurements were all performed on-site, using all sensors and trying to avoid the major veins and to reach the leaf areas marked with the letters A to E in Figure (<b>c</b>) and A to C in Figure (<b>d</b>), in most cases. In each of these areas, 5 measurements were acquired, and the values were averaged prior to model fitting. The samples in (<b>a</b>) were collected to be photographed after being measured on-site.</p> "> Figure 7
<p>Color plastic filters in 5 different shades of green (no. 1, 2, 3, 4, 7, 8, 9, 10 in (<b>a</b>) and 13 in (<b>c</b>)) and 3 different shades of blue (no. 5, 6 in (<b>a</b>), 11, 12 in (<b>c</b>)) used for a low-cost evaluation of accuracy and repeatability of the 3 sensors. In (<b>b</b>,<b>d</b>) the transmission spectra of the samples are shown as acquired with a spectrophotometer. The numbers in the transmission spectra correspond to the numbers of the sample color filter used.</p> "> Figure 8
<p>In (<b>a</b>), a scatter plot showing the relation of data measurements with atLeaf CHL Plus and (<b>b</b>) with SPAD-502 as compared to the proposed sensor, on all 13 green and blue color filters.</p> "> Figure 9
<p>In (<b>a</b>), a scatter plot showing the correlation of data measurements with atLeaf CHL Plus and in (<b>c</b>), with SPAD-502 as compared to the proposed sensor, with only the 9 green color filters (numbered as 1, 2, 3, 4, 7, 8, 9, 10, and 13 in <a href="#sensors-23-02699-f007" class="html-fig">Figure 7</a>) used. (<b>b</b>,<b>d</b>) Plots of the residuals (marked with + in the Figure) for the simple linear regression model fit applied on data and plotted on (<b>a</b>,<b>b</b>). The norm of the residuals was calculated to be 0.2205 and 0.4520, for the atLeaf and SPAD-502, respectively.</p> "> Figure 10
<p>In Figures (<b>a</b>,<b>b</b>) the repetitive measurements on the 9 green-only color filters (numbered no. 1, 2, 3, 4, 7, 8, 9, 10, and 13 in <a href="#sensors-23-02699-f007" class="html-fig">Figure 7</a>) are shown. In (<b>a</b>), the measurements with atLeaf and SPAD are plotted while in (<b>b</b>) the same measurements with the proposed device are shown. The numbers on the plot correspond to the filters presented in <a href="#sec2dot3dot2-sensors-23-02699" class="html-sec">Section 2.3.2</a>, <a href="#sensors-23-02699-f007" class="html-fig">Figure 7</a>. The red and blue asterisks as well as the magenta star represent the mean of the 10 values plotted for each filter. Each value plotted is the mean of 5 measurements per point.</p> "> Figure 11
<p>Plot showing the standard deviation among each of the measurements performed, with the 3 sensors used, on the 9 green filters only (90 points in total, 10 random areas per filter, 5 measurements per point).</p> "> Figure 12
<p>(<b>a</b>) A scatter plot showing the relation of data measurements with atLeaf CHL Plus and the proposed sensor in this work, on 30 lemon tree leaves, while in (<b>c</b>) the relation with the SPAD-502 is shown for the same data measurements. The red (dotted) lines correspond to 95% confidence prediction intervals. In (<b>b</b>,<b>d</b>), plots of the residuals (marked with +) for the simple linear regression model fit in each case applied on data plotted on (<b>a</b>,<b>c</b>) are shown, respectively.</p> "> Figure 13
<p>(<b>a</b>) A scatter plot showing the relation of data measurements with atLeaf CHL Plus as compared to the proposed sensor in this work, on 32 Russel’s cabbage leaves, while in (<b>c</b>) the relation with the SPAD-502 is shown for the same data measurements. In (<b>b</b>,<b>d</b>), plots of the residuals (marked with +) for the simple linear regression model fit in each case, applied on data and plotted on (<b>a</b>,<b>c</b>) are shown, respectively.</p> ">
Abstract
:1. Introduction
2. Materials and Methods
2.1. Experimental Design
2.2. Device’s Operation and Software Pipeline
2.3. Data Acquisition
2.3.1. Data Acquisition on Leaves
2.3.2. Data Acquisition on Non-Leaves Samples
2.4. Device Accuracy Evaluation and Validation Metrics
3. Results and Discussion
3.1. Experimental Resuslts on Non-Leaves Samples—Accuracy Repeatability Evaluation
3.2. Experimental Results on Leaves Samples
3.3. Limitations and Comparison with Previous Studies
4. Conclusions and Future Outlook
Author Contributions
Funding
Institutional Review Board Statement
Informed Consent Statement
Data Availability Statement
Acknowledgments
Conflicts of Interest
References
- Porra, R.J.; Thompson, W.A.; Kriedemann, P.E. Determination of accurate extinction coefficients and simultaneous equations for assaying chlorophylls a and b extracted with four different solvents: Verification of the concentration of chlorophyll standards by atomic absorption spectroscopy. Biochim. Biophys. Acta BBA Bioenerg. 1989, 975, 384–394. [Google Scholar] [CrossRef]
- Wellburn, A.R. The spectral determination of chlorophylls a and b, as well as total carotenoids, using various solvents with spectrometers of different resolution. J. Plant Physiol. 1994, 144, 307–313. [Google Scholar] [CrossRef]
- Arnon, D.I. Copper enzymes in isolated chloroplasts. Polyphenoloxidase in Beta vulgaris. Plant Physiol. 1949, 24, 1–15. [Google Scholar] [CrossRef] [PubMed] [Green Version]
- Ritchie, R.J. Consistent Sets of Spectrophotometric Chlorophyll Equations for Acetone, Methanol and Ethanol Solvents. Photosynth. Res. 2006, 89, 27–41. [Google Scholar] [CrossRef] [PubMed]
- Karcher, D.E.; Richardson, M.D. Quantifying Turfgrass Color Using Digital Image Analysis. Crop Sci. 2003, 43, 943–951. [Google Scholar] [CrossRef]
- Pagola, M.; Ortiz, R.; Irigoyen, I.; Bustince, H.; Barrenechea, E.; Aparicio-Tejo, P.; Lamsfus, C.; Lasa, B. New method to assess barley nitrogen nutrition status based on image colour analysis: Comparison with SPAD-502. Comput. Electron. Agric. 2009, 65, 213–218. [Google Scholar] [CrossRef]
- Yuan, Z.; Cao, Q.; Zhang, K.; Ata-Ul-Karim, S.T.; Tian, Y.; Zhu, Y.; Cao, W.; Liu, X. Optimal Leaf Positions for SPAD Meter Measurement in Rice. Front. Plant Sci. 2016, 7, 719. [Google Scholar] [CrossRef] [Green Version]
- Scharf, P.C.; Lory, J.A. Calibrating Corn Color from Aerial Photographs to Predict Sidedress Nitrogen Need. Agron. J. 2002, 94, 397–404. [Google Scholar] [CrossRef]
- Daughtry, C.S.T.; Walthall, C.L.; Kim, M.S.; De Colstoun, E.B.; McMurtrey, J.E., III. Estimating Corn Leaf Chlorophyll Concentration from Leaf and Canopy Reflectance. Remote Sens. Environ. 2000, 74, 229–239. [Google Scholar] [CrossRef]
- Hunt, E.R.; Cavigelli, M.; Daughtry, C.S.T.; Mcmurtrey, J.E.; Walthall, C.L. Evaluation of digital photography from model aircraft for remote sensing of crop biomass and nitrogen status. Precis. Agric. 2005, 6, 359–378. [Google Scholar] [CrossRef]
- Zhang, Y.; Chen, J.M.; Miller, J.R.; Noland, T.L. Leaf chlorophyll content retrieval from airborne hyperspectral remote sensing imagery. Remote Sens. Environ. 2008, 112, 3234–3247. [Google Scholar] [CrossRef]
- Wu, C.; Niu, Z.; Tang, Q.; Huang, W. Estimating chlorophyll content from hyperspectral vegetation indices: Modeling and validation. Agric. For. Meteorol. 2008, 148, 1230–1241. [Google Scholar] [CrossRef]
- Tang, D.Y.Y.; Chew, K.W.; Ting, H.-Y.; Sia, Y.-H.; Gentili, F.G.; Park, Y.-K.; Banat, F.; Culaba, A.B.; Ma, Z.; Show, P.L. Application of regression and artificial neural network analysis of Red-Green-Blue image components in prediction of chlorophyll content in microalgae. Bioresour. Technol. 2023, 370, 128503. [Google Scholar] [CrossRef]
- Odabas, M.S.; Simsek, H.; Lee, C.W.; Iseri, I. Multilayer Perceptron Neural Network Approach to Estimate Chlorophyll Concentration Index of Lettuce (Lactuca sativa L.). Commun. Soil Sci. Plant Anal. 2016, 48, 162–169. [Google Scholar] [CrossRef]
- Vesali, F.; Omid, M.; Kaleita, A.; Mobli, H. Development of an android app to estimate chlorophyll content of corn leaves based on contact imaging. Comput. Electron. Agric. 2015, 116, 211–220. [Google Scholar] [CrossRef]
- Furuya, S. Growth diagnosis of rice plant by means of leaf color. Jpn. Agric. Res. Q. 1987, 20, 147–153. Available online: https://www.jircas.go.jp/sites/default/files/publication/jarq/20-3-147-153_0.pdf (accessed on 10 August 2021).
- Anand, M.H.; Byju, G. Chlorophyll meter and leaf colour chart to estimate chlorophyll content, leaf colour, and yield of cassava. Photosynthetica 2008, 46, 511–516. [Google Scholar] [CrossRef]
- Zhang, H.; Ge, Y.; Xie, X.; Atefi, A.; Wijewardane, N.K.; Thapa, S. High throughput analysis of leaf chlorophyll content in sorghum using RGB, hyperspectral, and fluorescence imaging and sensor fusion. Plant Methods 2022, 18, 60. [Google Scholar] [CrossRef]
- Pérez-Patricio, M.; Camas-Anzueto, J.L.; Sanchez-Alegría, A.; Aguilar-González, A.; Gutiérrez-Miceli, F.A.; Escobar-Gómez, E.; Voisin, Y.; Rios-Rojas, C.; Grajales-Coutiño, R. Optical Method for Estimating the Chlorophyll Contents in Plant Leaves. Sensors 2018, 18, 650. [Google Scholar] [CrossRef] [Green Version]
- Choi, Y.-J.; Watanabe, N.; Takahashi, K.; Toda, S.; Takayama, K.; Noda, T.; Sawada, K. Proposal of leaf chlorophyll content and its a/b ratio measurement method using a filter-free multiple wavelength sensor. Jpn. J. Appl. Phys. 2022, 61, SD1041. [Google Scholar] [CrossRef]
- Padilla, F.M.; Gallardo, M.; Peña-Fleitas, M.T.; de Souza, R.; Thompson, R.B. Proximal Optical Sensors for Nitrogen Management of Vegetable Crops: A Review. Sensors 2018, 18, 2083. [Google Scholar] [CrossRef] [PubMed] [Green Version]
- Padilla, F.M.; De Souza, R.; Pena-Fleitas, T.; Gallardo, M.; Gimenez, C.; Thompson, R.B. Different Responses of Various Chlorophyll Metetrs to Increasing Notrogen Supply in Sweet Pepper. Front. Plant Sci. 2018, 9, 1752. [Google Scholar] [CrossRef] [PubMed] [Green Version]
- SPAD 502 PLUS Chlorophyll Meter, Konica Minolta. Available online: https://www.konicaminolta.com.cn/instruments/download/manual/pdf/SPAD-502_Manual.pdf (accessed on 10 August 2021).
- CCM-200 Plus Chlorophyll Content Meter, Opti-Sciences, Inc. 8 Winn Avenue, Hudson, USA. Available online: https://www.optisci.com/ccm-200.html (accessed on 13 August 2021).
- atLEAF CHL PLUS Chlorophyll Meter, FT GREEN LLC, 1000 N. West St. Suite 1200 #638, Wilmington, DE19801. Available online: https://www.atleaf.com/atLEAF_CHL_PLUS) (accessed on 16 August 2021).
- N-Tester, Handheld Leaf Nitrogen Measurement Tool, Yara International ASA, Oslo, Norway. Available online: https://www.yara.co.nz/crop-nutrition/farmers-toolbox/n-tester/ (accessed on 14 August 2021).
- Dualex Optical Leafclip Meter, Force-A, Centre Universitaire Paris-Sud Batiment 503, rue du Belvédère, 91400 Orsay France. Available online: https://www.force-a.com/wp-content/uploads/2019/09/BROCHURE-DUALEX-1.pdf (accessed on 13 August 2021).
- CL-01 Chlorophyll Meter, Hansatech Instruments Ltd., Narborough Road, Pentney King’s Lynn Norfolk PE32 1JL, United Kingdom. Available online: https://www.hansatech-instruments.com/product/cl-01-chlorophyll-content-meter/# (accessed on 20 September 2021).
- MultipecQ V1.0, PhotosynQ Inc. 325 E. Grand River Ave. Suite #331 East Lansing, MI 48823. Available online: https://help.photosynq.com/instruments/multispeq-v1.0.html#configuration (accessed on 30 August 2022).
- Kuhlgert, S.; Austic, G.; Zegarac, R.; Osei-Bonsu, I.; Hoh, D.; Chilvers, M.I.; Roth, M.G.; Bi, K.; TerAvest, D.; Weebadde, P.; et al. MultispeQ Beta: A tool for large-scale plant phenotyping connected to the open PhotosynQ network. R. Soc. Open Sci. 2016, 3, 160592. [Google Scholar] [CrossRef] [Green Version]
- MC-100 Chlorophyll Concentration Meter, Apogee Instruments Inc., Logan, UT 84321, USA. Available online: https://www.apogeeinstruments.com/chlorophyll-concentration-meter/ (accessed on 13 August 2021).
- Markwell, J.; Osterman, J.C.; Mitchell, J.L. Calibration of the Minolta SPAD-502 leaf chlorophyll meter. Photosynth. Res. 1995, 46, 467–472. [Google Scholar] [CrossRef] [PubMed]
- Uddling, J.; Gelang-Alfredsson, J.; Piikki, K.; Pleijel, H. Evaluating the relationship between leaf chlorophyll concentration and SPAD-502 chlorophyll meter readings. Photosynth. Res. 2007, 91, 37–46. [Google Scholar] [CrossRef] [PubMed]
- Feret, J.-B.; François, C.; Asner, G.P.; Gitelson, A.A.; Martin, R.E.; Bidel, L.P.R.; Ustin, S.L.; Le Maire, G.; Jacquemoud, S. PROSPECT-4 and 5: Advances in the leaf optical properties model separating photosynthetic pigments. Remote Sens. Environ. 2008, 112, 3030–3043. [Google Scholar] [CrossRef]
- Hunt, E.R.; Daughtry, C.S.T. Chlorophyll Meter Calibrations for Chlorophyll Content Using Measured and Simulated Leaf Transmittances. Agron. J. 2014, 106, 931–939. [Google Scholar] [CrossRef] [Green Version]
- Parry, C.; Blonquist, J.M.; Bugbee, B. In situ measurement of leaf chlorophyll concentration: Analysis of the optical/absolute relationship. Plant Cell Environ. 2014, 37, 2508–2520. [Google Scholar] [CrossRef]
- Monje, O.A.; Bugbee, B. Inherent limitations of nondestructive chlorophyll meters: A comparison of two types of meters. Hortscience 1992, 27, 69–71. [Google Scholar] [CrossRef] [Green Version]
- Gitelson, A.A.; Gritz, Y.; Merzlyak, M.N. Relationships between leaf chlorophyll content and spectral reflectance and algorithms for non-destructive chlorophyll assessment in higher plant leaves. J. Plant Physiol. 2003, 160, 271–282. [Google Scholar] [CrossRef]
- Dong, T.; Shang, J.; Chen, J.M.; Liu, J.; Qian, B.; Ma, B.; Morrison, M.J.; Zhang, C.; Liu, Y.; Shi, Y.; et al. Assessment of Portable Chlorophyll Meters for Measuring Crop Leaf Chlorophyll Concentration. Remote Sens. 2019, 11, 2706. [Google Scholar] [CrossRef] [Green Version]
- Nauš, J.; Prokopová, J.; Řebíček, J.; Špundová, M. SPAD chlorophyll meter reading can be pronouncedly affected by chloroplast movement. Photosynth. Res. 2010, 105, 265–271. [Google Scholar] [CrossRef] [PubMed]
- Sims, D.A.; A Gamon, J. Relationships between leaf pigment content and spectral reflectance across a wide range of species, leaf structures and developmental stages. Remote Sens. Environ. 2002, 81, 337–354. [Google Scholar] [CrossRef]
- Ustin, S.L.; Gitelson, A.A.; Jacquemoud, S.; Schaepman, M.; Asner, G.P.; Gamon, J.A.; Zarco-Tejada, P. Remote Sensing of Environment Retrieval of foliar information about plant pigment systems from high resolution spectroscopy. Remote Sens. Environ. 2009, 113, S67–S77. [Google Scholar] [CrossRef] [Green Version]
- TSL257 High Sensitivity Light-to-Voltage-Converter, TAOS. Available online: https://www.farnell.com/datasheets/301933.pdf (accessed on 5 August 2021).
- Marquard, R.D.; Tipton, J.L. Relationship Between Extractable Chlorophyll and an in Situ Method to Estimate Leaf Greenness. Hortscience 1987, 22, 1327. [Google Scholar] [CrossRef]
- Martínez, D.E.; Guiamet, J.J. Distortion of the SPAD 502 chlorophyll meter readings by changes in irradiance and leaf water status. Agron. 2004, 24, 41–46. [Google Scholar] [CrossRef] [Green Version]
- Xiong, D.; Chen, J.; Yu, T.; Gao, W.; Ling, X.; Li, Y.; Peng, S.; Huang, J. SPAD-based leaf nitrogen estimation is impacted by environmental factors and crop leaf characteristics. Sci. Rep. 2015, 5, 13389. [Google Scholar] [CrossRef] [Green Version]
- Hoel, B.O. Effect of Irradiance on Chlorophyll Estimation with the Minolta SPAD-502 Leaf Chlorophyll Meter. Ann. Bot. 1998, 82, 389–392. [Google Scholar] [CrossRef] [Green Version]
- Singh, B.; Ali, A.M. Using Hand-Held Chlorophyll Meters and Canopy Reflectance Sensors for Fertilizer Nitrogen Management in Cereals in Small Farms in Developing Countries. Sensors 2020, 20, 1127. [Google Scholar] [CrossRef] [Green Version]
- Zhu, J.; Tremblay, N.; Liang, Y. Comparing SPAD and atLEAF values for chlorophyll assessment in crop species. Can. J. Soil Sci. 2012, 92, 645–648. [Google Scholar] [CrossRef]
- Gianquinto, G.; Goffart, J.P.; Olivier, M.; Guarda, G.; Colauzzi, M.; Dalla Costa, L.; Delle Vedove, G.; Vos, J.; MacKerron, D.K.L. The use of hand-held chlorophyll meters as a tool to assess the nitrogen status and to guide nitrogen fertilization of potato crop. Potato Res. 2004, 47, 35–80. [Google Scholar] [CrossRef]
- Shapiro, C.A.; Schepers, J.S.; Francis, D.D.; Shanahan, J.F. Using a Chlorophyll Meter to Improve N Management; G1632; University of Nebraska-Lincoln: Lincoln, NE, USA, 2006; Available online: https://digitalcommons.unl.edu/cgi/viewcontent.cgi?article=2349&context=extensionhist (accessed on 25 July 2022).
- Westerveld, S.M.; McKeown, A.W.; McDonald, M.R.; Scott-Dupree, C.D. Assessment of Chlorophyll and Nitrate Meters as Field Tissue Nitrogen Tests for Cabbage, Onions, and Carrots. Horttechnology 2004, 14, 179–188. [Google Scholar] [CrossRef]
- Richardson, A.D.; Duigan, S.P.; Berlyn, G.P. An evaluation of noninvasive methods to estimate foliar chlorophyll content. New Phytol. 2002, 153, 185–194. [Google Scholar] [CrossRef] [Green Version]
- Sookchalearn, T.; Abdullakasim, W. A Low-Cost Sensor for Measuring and Mapping Chlorophyll Content in Cassava Leaves. CMU J. Nat. Sci. 2017, 16, 183. Available online: https://www.cabdirect.org/cabdirect/abstract/20193338161 (accessed on 16 June 2022).
- Maleki, M.; Massah, J.; Dehghan, M. Application of spectral sensor for the assessment of nitrogen content in lettuce plants. Aust. J. Crop Sci. 2012, 6, 188–193. Available online: http://www.cropj.com/maleki_6_2_2012_188_193.pdf (accessed on 17 June 2022).
- Hutomo, E.E.P.; Adibawa, M.A.S.; Prilianti, K.R.; Heriyanto, H.; Brotosudarmo, T.H.P. Low-cost chlorophyll meter (LCCM): Portable measuring device for leaf chlorophyll. In Proceedings of the Second International Seminar on Photonics, Optics, and Its Applications (ISPhOA 2016), Bali, Indonesia, 11 November 2016; p. 10150. [Google Scholar] [CrossRef]
- Andrianto, H.; Suhardi, S.; Faizal, A. Performance evaluation of low-cost IoT based chlorophyll meter. Bull. Electr. Eng. Inform. 2020, 9, 956–963. [Google Scholar] [CrossRef]
- Sumriddetchkajorn, S.; Intaravanne, Y. Single-wavelength based rice leaf color analyzer for nitrogen status estimation. Opt. Lasers Eng. 2014, 53, 179–184. [Google Scholar] [CrossRef]


| Leaf Chlorophyll Meter | LED Light Sources Wavelengths Used (nm) |
|---|---|
| Konica Minolta SPAD-502+ | 650, 940 |
| FT Green atLeaf CHL PLUS | 640, 940 |
| Opti-Sciences CCM-200 | 653, 931 |
| Force-A Dualex 4 Scientific | 710, 850 |
| Hansatech Instruments CL-01 | 660, 940 |
| PhotosynQ MultispeQ V1.0 | 655, 950 |
| Apogee Instruments MC-100 | 653, 931 |
| Yara International N-tester | 650, 960 |
| Chlorophyll Meters | Lemon Tree (r) | Young Brussels Sprouts (r) | Blue and Green Filters (r) | Green Filters (r) |
|---|---|---|---|---|
| AtLeaf—proposed device | ||||
| SPAD-502—proposed device |
| Manufacturer’s Manual [23,25] | Estimated Values in This Study | |||
|---|---|---|---|---|
| Chlorophyll Meter | Accuracy | Repeatability | Accuracy | Repeatability |
| atLeaf CHL Plus (atLeaf units) | [−0.6, +0.5] | 0.054 * | [−0.7, +0.6] | 0.0218 |
| SPAD-502 (SPAD units) | .0 ** | 0.3 ** | [−0.6, +0.9] | 0.06 |
| [−0.03, +0.02] | 0.0044 | |||
| Proposed device (CHL-meter units) | n/a | n/a | 1.34 (atLeaf-units) | 0.2999 (atLeaf units) |
| 1.22 (SPAD units) | 0.2780 (SPAD units) | |||
| Samples Measured | atLeaf CHL Plus Conversion Values * | SPAD-502 Conversion Values * |
|---|---|---|
| Lemon tree leaves | ||
| Brussels sprouts leaves | ||
| Non-leaves |
Disclaimer/Publisher’s Note: The statements, opinions and data contained in all publications are solely those of the individual author(s) and contributor(s) and not of MDPI and/or the editor(s). MDPI and/or the editor(s) disclaim responsibility for any injury to people or property resulting from any ideas, methods, instructions or products referred to in the content. |
© 2023 by the authors. Licensee MDPI, Basel, Switzerland. This article is an open access article distributed under the terms and conditions of the Creative Commons Attribution (CC BY) license (https://creativecommons.org/licenses/by/4.0/).
Share and Cite
Kamarianakis, Z.; Panagiotakis, S. Design and Implementation of a Low-Cost Chlorophyll Content Meter. Sensors 2023, 23, 2699. https://doi.org/10.3390/s23052699
Kamarianakis Z, Panagiotakis S. Design and Implementation of a Low-Cost Chlorophyll Content Meter. Sensors. 2023; 23(5):2699. https://doi.org/10.3390/s23052699
Chicago/Turabian StyleKamarianakis, Zacharias, and Spyros Panagiotakis. 2023. "Design and Implementation of a Low-Cost Chlorophyll Content Meter" Sensors 23, no. 5: 2699. https://doi.org/10.3390/s23052699