
After-Effects of Hydrochar Amendment on Water Spinach Production, N Leaching, and N2O Emission from a Vegetable Soil under Varying N-Inputs

<p>Responses of N contents of water spinach to hydrochar amendments under three N-inputs, i.e., 200 kg/ha (<b>A</b>), 160 kg/ha (<b>B</b>). and 120 kg/ha (<b>C</b>). Error bars represent the SD of the mean of three replicates. Identical letters above each column in the chart indicate the differences between each treatment with same N input were not statistically significant, according to Duncan’s post hoc test at level of <span class="html-italic">p</span> < 0.05.</p> "> Figure 2
<p>The pH (<b>A</b>) and EC (<b>B</b>) of leachate sampled at three observations on 30 July, 11 August, and 29 August 2021. Error bars represent the SD of the mean of three replicates. Same letters above column chart indicate the differences between each treatment with same N input were not statistically significant, according to Duncan’s post hoc test at level of <span class="html-italic">p</span> < 0.05.</p> "> Figure 3
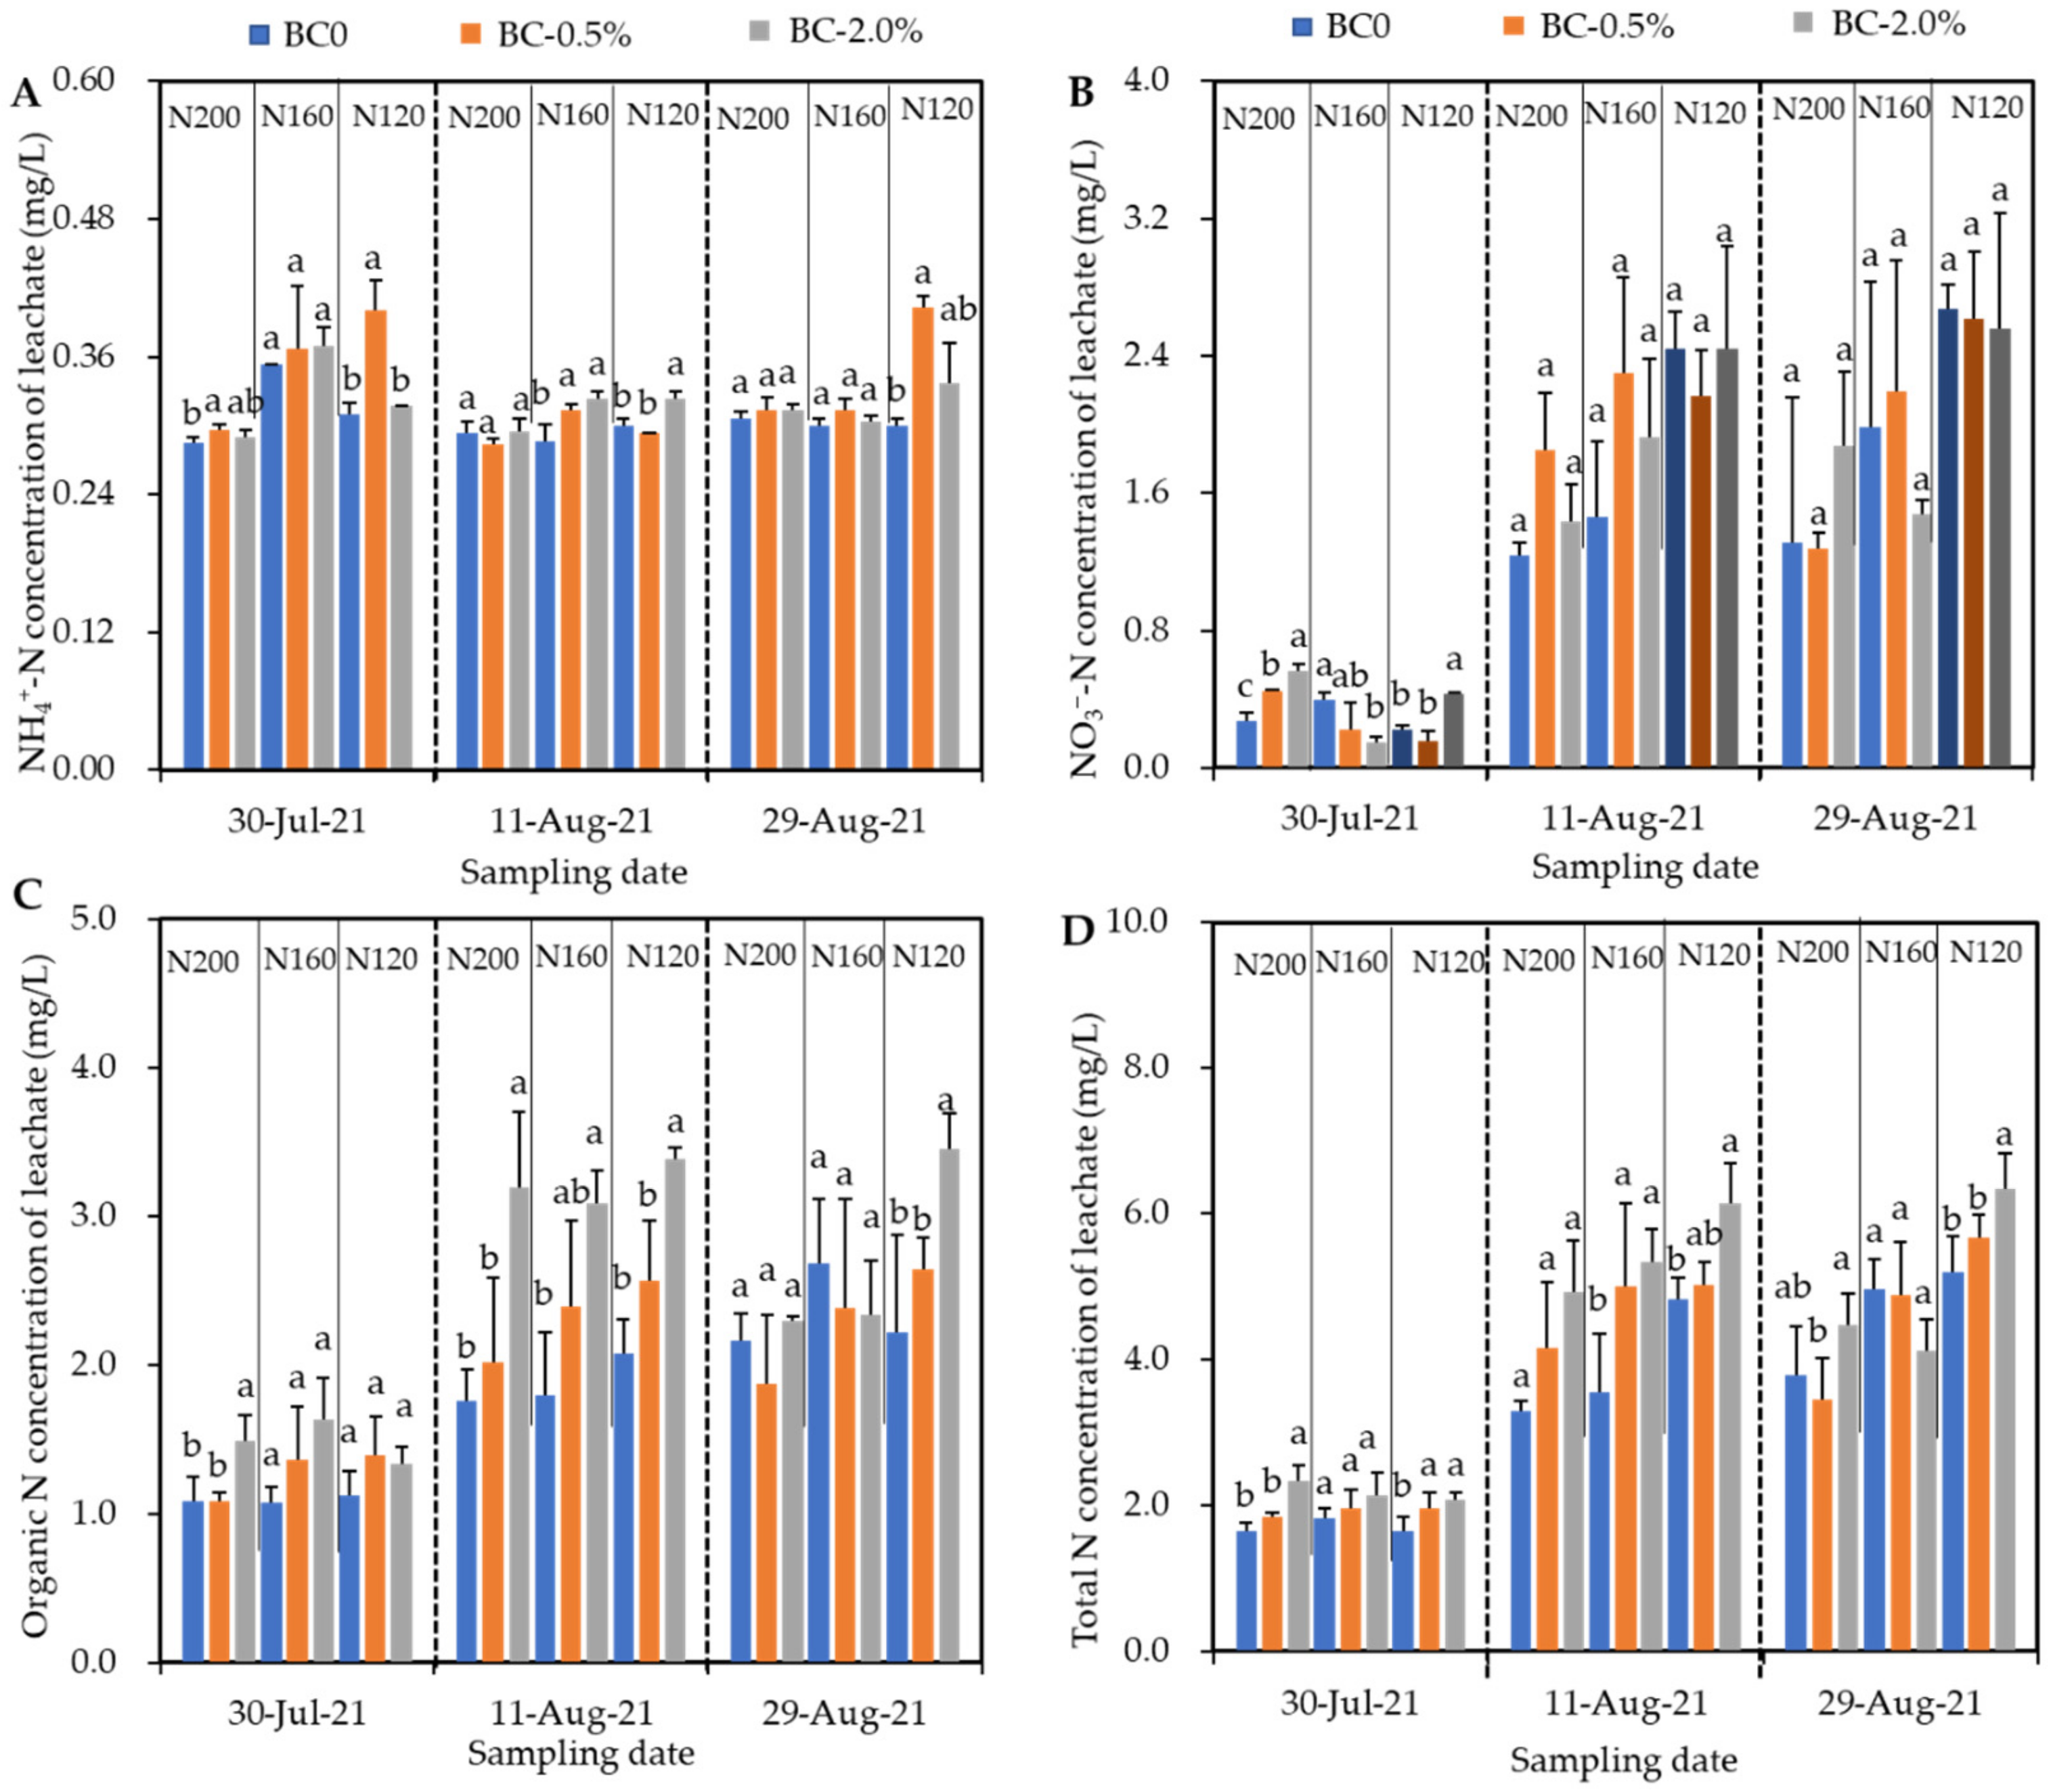
<p>The NH<sub>4</sub><sup>+</sup>-N (<b>A</b>), NO<sub>3</sub><sup>−</sup>-N (<b>B</b>), organic (<b>C</b>) and total N (<b>D</b>) of leachate sampled at three observations on 30 July, 11 and 29 August 2021. Error bars represent the SD of the mean of three replicates. Different (same) letters above column chart indicate the differences between each treatment with same N input were (not) statistically significant, according to Duncan’s post hoc test at level of <span class="html-italic">p</span> < 0.05.</p> "> Figure 4
<p>Effects of biochar on the N<sub>2</sub>O emission rate (<b>A</b>) and the total N<sub>2</sub>O emission flux (<b>B</b>) in a water-spinach-planted vegetable soil receiving three N inputs. Error bars represent the SD of the mean of three replicates. Different letters above column chart indicate the differences between each treatment with same N input were statistically significant, according to Duncan’s post hoc test at level of <span class="html-italic">p</span> < 0.05.</p> ">
Abstract
:1. Introduction
2. Results
2.1. Production of Water Spinach
2.2. The N Contents and Uptake Capacity of Water Spinach
2.3. The Properties of Leachate
2.4. N2O Emission
3. Discussion
3.1. Hydrochar with High Rate Improves Production of Water Spinach under Reducing N Inputs
3.2. Hydrochar Potentially Increase the N Leaching Risk
3.3. Effects of Hydrochar on N2O Emission Depend on N Rate
4. Materials and Methods
4.1. Soil and Hydrochar Characterization, Soil Column Installation
4.2. Experiment Design and Crop Management
4.3. Sampling and Measurements
4.3.1. Plant Sample and Its Total N Content Determination
4.3.2. N2O Emission
4.3.3. The pH, EC, NH4+-N, NO3−-N, Organic and Total N Concentrations in Leachate
4.4. Data Statistics
5. Conclusions
Author Contributions
Funding
Data Availability Statement
Acknowledgments
Conflicts of Interest
References
- Min, J.; Sun, H.J.; Kronzucker, H.J.; Wang, Y.; Shi, W.M. Comprehensive assessment of the effects of nitrification inhibitor application on reactive nitrogen loss in intensive vegetable production systems. Agric. Ecosyst. Environ. 2021, 307, 107227. [Google Scholar] [CrossRef]
- Bai, X.L.; Zhang, Z.B.; Cui, J.J.; Liu, Z.J.; Chen, Z.J.; Zhou, J.B. Strategies to mitigate nitrate leaching in vegetable production in China: A meta-analysis. Environ. Sci. Pollut. Res. 2020, 27, 18382–18391. [Google Scholar] [CrossRef] [PubMed]
- Qasim, W.; Xia, L.L.; Lin, S.; Wan, L.; Zhao, Y.M.; Butterbach-Bahl, K. Global greenhouse vegetable production systems are hotspots of soil N2O emissions and nitrogen leaching: A meta-analysis. Environ. Pollut. 2021, 272, 116372. [Google Scholar] [CrossRef] [PubMed]
- Yan, X.Y.; Ti, C.P.; Vitousek, P.; Chen, D.L.; Leip, A.; Cai, Z.C.; Zhu, Z.L. Fertilizer nitrogen recovery efficiencies in crop production systems of China with and without consideration of the residual effect of nitrogen. Environ. Res. Lett. 2014, 9, 095002. [Google Scholar] [CrossRef] [Green Version]
- Li, B.; Bi, Z.C.; Xiong, Z.Q. Dynamic responses of nitrous oxide emission and nitrogen use efficiency to nitrogen and biochar amendment in an intensified vegetable field in southeastern China. GCB Bioenergy 2017, 9, 400–413. [Google Scholar] [CrossRef]
- Song, X.Z.; Zhao, C.X.; Wang, X.L.; Li, J. Study of nitrate leaching and nitrogen fate under intensive vegetable production pattern in northern China. C. R. Biol. 2009, 332, 385–392. [Google Scholar] [CrossRef]
- Guo, Y.X.; Chen, Y.F.; Searchinger, T.D.; Zhou, M.; Pan, D.; Yang, J.N.; Wu, L.; Cui, Z.L.; Zhang, W.F.; Zhang, F.S.; et al. Air quality, nitrogen use efficiency and food security in China are improved by cost-effective agricultural nitrogen management. Nat. Food 2020, 105, 291–298. [Google Scholar] [CrossRef]
- Zhu, J.H.; Li, X.L.; Christie, P.; Li, J.L. Environmental implications of low nitrogen use efficiency in excessively fertilized hot pepper (Capsicum frutescens L.) cropping systems. Agric. Ecosyst. Environ. 2005, 111, 70–80. [Google Scholar] [CrossRef] [Green Version]
- Fan, Z.B.; Lin, S.; Zhang, X.M.; Jiang, Z.M.; Yang, K.C.; Jian, D.D.; Chen, Y.Z.; Li, J.L.; Chen, Q.; Wang, J.G. Conventional flooding irrigation causes an overuse of nitrogen fertilizer and low nitrogen use efficiency in intensively used solar greenhouse vegetable production. Agric. Water Manag. 2014, 144, 11–19. [Google Scholar] [CrossRef]
- Rashti, M.R.; Wang, W.J.; Moody, P.; Chen, C.R.; Ghadiri, H. Fertiliser-induced nitrous oxide emissions from vegetable production in the world and the regulating factors: A review. Atmos. Environ. 2015, 112, 225–233. [Google Scholar] [CrossRef]
- Schmidt, H.; Kammann, C.; Hagemann, N.; Leifeld, J.; Bucheli, T.D.; Monedero, M.A.S.; Cayuela, M.L. Biochar in agriculture—A systematic review of 26 global meta-analysis. GCB Bioenergy 2021, 13, 1708–1730. [Google Scholar] [CrossRef]
- Ahmad, Z.; Mosa, A.; Zhan, L.; Gao, B. Biochar modulates mineral nitrogen dynamics in soil and terrestrial ecosystems: A critical review. Chemosphere 2021, 278, 130378. [Google Scholar] [CrossRef] [PubMed]
- Sha, Z.P.; Li, Q.Q.; Lv, T.T.; Misselbrook, T.; Liu, X.J. Responses of ammonia volatilization to biochar addition: A meta-analysis. Sci. Total Environ. 2019, 655, 1387–1396. [Google Scholar] [CrossRef] [PubMed]
- Li, B.; Huang, W.H.; Elsgaard, L.; Yang, B.; Li, Z.Y.; Yang, H.F.; Lu, Y. Optimal biochar amendment rate reduced the yield-scaled N2O emissions from Ultisols in an intensive vegetable field in South China. Sci. Total Environ. 2020, 723, 138161. [Google Scholar] [CrossRef] [PubMed]
- Borchard, N.; Schirrmann, M.; Cayuela, M.L.; Kammann, C.; Wrage-Mönnig, N.; Estavillo, J.M.; Fuertes-Mendizábal, T.; Sigua, G.; Spokas, K.; Ippolito, J.A.; et al. Biochar, soil and land-use interactions that reduce nitrate leaching and N2O emissions: A meta-analysis. Sci. Total Environ. 2019, 651, 2354–2364. [Google Scholar] [CrossRef] [PubMed]
- Feng, Y.F.; He, H.Y.; Xue, L.H.; Liu, Y.; Sun, H.J.; Guo, Z.; Wang, Y.M.; Zheng, X.B. The inhibiting effects of biochar-derived organic materials on rice production. J. Environ. Manag. 2021, 293, 112909. [Google Scholar] [CrossRef] [PubMed]
- Fornes, F.; Belda, R.M.; Lidón, A. Analysis of two biochars and one hydrochar from different feedstock: Focus set on environmental, nutritional and horticultural considerations. J. Clean. Prod. 2015, 86, 40–48. [Google Scholar] [CrossRef]
- Fan, C.H.; Chen, H.; Li, B.; Xiong, Z.Q. Biochar reduces yield-scaled emissions of reactive nitrogen gases from vegetable soils across China. Biogeosciences 2017, 14, 2851–2863. [Google Scholar] [CrossRef] [Green Version]
- Sun, H.J.; Jeyakumar, P.; Xiao, H.D.; Li, X.W.; Liu, J.Y.; Yu, M.; Rana, P.B.J.; Shi, W.M. Biochar can increase Chinese cabbage (Brassica oleracea L.) yield, decrease nitrogen and phosphorus leaching losses in intensive vegetable soil. Phyton-Int. J. Exp. Bot. 2022, 91, 197–206. [Google Scholar] [CrossRef]
- Li, H.X.; Lu, X.Q.; Xu, Y.; Liu, H.T. How close is artificial biochar aging to natural biochar aging in fileds? A meta-analysis. Geoderma 2019, 352, 96–103. [Google Scholar] [CrossRef]
- Liu, Y.Y.; Chen, J.W. Effect of ageing on biochar properties and pollutant management. Chemosphere 2022, 292, 133427. [Google Scholar] [CrossRef] [PubMed]
- Ke, Y.H.; Syu, C.H.; Liao, Y.J.; Lee, D.Y. Field experiments for evaluating the effects of water management and phosphate application on inorganic arsenic accumulation in water spinach (Ipomoea aquatica Forsk.). Sci. Total Environ. 2022, 844, 157232. [Google Scholar] [CrossRef]
- Milla, O.V.; Rivera, E.B.; Huang, W.J.; Chien, C.C.; Wang, Y.M. Agronomic properties and characterization of rice husk and wood biochars and their effects on the growth of water spinach in a field test. J. Soil Sci. Plant Nutr. 2013, 13, 251–266. [Google Scholar]
- Guo, L.L.; Yu, H.W.; Kharbach, M.; Zhang, W.Q.; Wang, J.W.; Niu, W.Q. Biochar improves soil-tomato plant, tomato production, and economic benefits under reduced nitrogen application in Northwest China. Plants 2021, 10, 759. [Google Scholar] [CrossRef] [PubMed]
- Losacco, D.; Tumolo, M.; Cotugno, P.; Leone, N.; Massarelli, C.; Convertini, S.; Tursi, A.; Uricchio, V.F.; Ancona, V. Use of biochar to improve the sustainable crop production of cauliflower (Brassica oleracea L.). Plants 2022, 11, 1182. [Google Scholar] [CrossRef]
- Ren, K.Y.; Xu, M.G.; Li, R.; Zheng, L.; Liu, S.G.; Reis, S.; Wang, H.Y.; Lu, C.G.; Zhang, W.J.; Gao, H.; et al. Optimizing nitrogen fertilizer use for more grain and less pollution. J. Clean. Prod. 2022, 360, 132180. [Google Scholar] [CrossRef]
- Jeffery, S.; Verheijen, F.G.A.; van der Velde, M.; Bastos, A.C. A quantitative review of the effects of biochar application to soils on crop productivity using meta-analysis. Agric. Ecosyst. Environ. 2011, 144, 175–187. [Google Scholar] [CrossRef]
- Joseph, S.; Cowie, A.L.; Van Zwieten, L.; Bolan, N.; Budai, A.; Buss, W.; Cayuela, M.L.; Graber, E.R.; Ippolito, J.A.; Kuzyakov, Y.; et al. How biochar works, and when it doesn’t: A review of mechanisms. GCB Bioenergy 2021, 13, 1731–1764. [Google Scholar] [CrossRef]
- Murtaza, G.; Ahmed, Z.; Usman, M.; Tariq, W.; Ullah, Z.; Shareef, M.; Iqbal, H.; Waqas, M.; Tariq, A.; Wu, Y.F.; et al. Biochar induced modifications in soil properties and its impacts on crop growth and production. J. Plant Nutr. 2021, 44, 1677–1691. [Google Scholar] [CrossRef]
- Wang, H.F.; Zheng, H.; Jiang, Z.X.; Dai, Y.H.; Liu, G.C.; Chen, L.; Luo, X.X.; Liu, M.H.; Wang, Z.Y. Efficacies of biochar and biochar-based amendment on vegetable yield and nitrogen utilization in four consecutive planting seasons. Sci. Total Environ. 2017, 593, 124–133. [Google Scholar] [CrossRef]
- Chintala, R.; Mollinedo, J.; Schumacher, T.E.; Papiernik, S.K.; Malo, D.D.; Clay, D.E.; Kumar, S.; Gulbrandson, D.W. Nitrate sorption and desorption in biochars from pyrolysis. Microporous Mesoporous Mater. 2013, 179, 250–257. [Google Scholar] [CrossRef]
- Hale, S.E.; Alling, V.; Martinsen, V.; Mulder, J.; Breedveld, G.D.; Cornelissen, G. The sorption and desorption of phosphate-P, ammonium-N and nitrate-N in cacao shell and corn cob biochars. Chemosphere 2013, 91, 1612–1619. [Google Scholar] [CrossRef] [PubMed]
- Shi, W.; Ju, Y.Y.; Bian, R.J.; Li, L.Q.; Joseph, S.; Mitchell, D.R.G.; Munroe, P.; Taherymoosavi, S.; Pan, G.X. Biochar bound urea boosts plant growth and reduces nitrogen leaching. Sci. Total Environ. 2020, 701, 13442. [Google Scholar] [CrossRef] [PubMed]
- Cayuela, M.; van Zwieten, L.; Singh, B.; Jeffery, S.; Roig, A.; Sanchez-Monedero, M. Biochar’s role in mitigating soil nitrous oxide emissions: A review and meta-analysis. Agric. Ecosyst. Environ. 2014, 191, 5–16. [Google Scholar] [CrossRef]
- Ding, X.L.; Zhao, R.W.; Dai, Y.L.; Zhang, Y.; Lin, S.X.; Ye, J.R. Comprehensive analysis of copy number variations on glycoside hydrolase 45 genes among different Bursaphelenchus xylophilus strains. Int. J. Mol. Sci. 2022, 23, 15323. [Google Scholar] [CrossRef]
- Jensen, E.S. Evaluation of automated analysis of 15N and total N in plant material and soil. Plant Soil 1991, 133, 83–92. [Google Scholar] [CrossRef]
- Sun, H.J.; Zhang, H.L.; Powlson, D.; Min, J.; Shi, W.M. Rice production, nitrous oxide emission and ammonia volatilization as impacted by the nitrification inhibitor 2-chloro-6-(trichloromethyl)-pyridine. Field Crop. Res. 2015, 173, 1–7. [Google Scholar] [CrossRef]


| Treatment | Shoot Biomass of Water Spinach Plant at Different Sample Date (Fresh Weight, g/pot) | |||||
| 30 July 2021 | 13 August 2021 | 1 September 2021 | 20 September 2021 | Total | ||
| N200 | BC0 | 89.0 ± 36.2 a | 110.1 ± 34.3 a | 272.9 ± 36.8 a | 196.5 ± 21.5 a | 668.4 ± 58.4 a |
| BC-0.5% | 89.6 ± 29.4 a | 129.7 ± 52.4 a | 288.2 ± 40.2 a | 201.0 ± 44.5 a | 708.5 ± 48.5 a | |
| BC-2.0% | 104.9 ± 27.7 a | 139.8 ± 21.9 a | 288.6 ± 48.6 a | 205.9 ± 13.8 a | 738.8 ± 18.6 a | |
| N160 | BC0 | 130.5 ± 47.3 a | 96.8 ± 17.1 a | 234.7 ± 15.1 a | 189.0 ± 32.4 a | 650.4 ± 53.7 b |
| BC-0.5% | 84.4 ± 36.1 a | 106.1 ± 27.9 a | 243.7 ± 12.7 a | 206.5 ± 52.7 a | 640.8 ± 62.9 b | |
| BC-2.0% | 103.1 ± 21.3 a | 136.7 ± 18.9 a | 278.8 ± 39.4 a | 207.3 ± 19.0 a | 725.9 ± 56.7 a | |
| N80 | BC0 | 70.9 ± 16.7 b | 108.4 ± 15.2 b | 221.0 ± 13.9 a | 215.5 ± 45.7 a | 615.8 ± 52.4 b |
| BC-0.5% | 64.3 ± 21.3 b | 139.2 ± 13.6 ab | 191.6 ± 15.6 a | 197.1 ± 34.6 a | 592.3 ± 36.7 b | |
| BC-2.0% | 119.9 ± 12.3 a | 155.3 ± 16.7 a | 206.6 ± 18.5 a | 221.3 ± 18.7 a | 703.0 ± 12.1 a | |
| Treatment | N Uptake Capacity of Water Spinach at Different Sample Time (mg/pot) | |||||
| 30 July 2021 | 13 August 2021 | 1 September 2021 | 20 September 2021 | Total | ||
| N200 | BC0 | 42 ± 8 a | 44 ± 14 a | 102 ± 11 a | 83 ± 3 a | 272 ± 7 a |
| BC-0.5% | 42 ± 11 a | 50 ± 22 a | 113 ± 27 a | 84 ± 22 a | 289 ± 76 a | |
| BC-2.0% | 49 ± 18 a | 51 ± 14 a | 116 ± 12 a | 85 ± 13 a | 301 ± 47 a | |
| N160 | BC0 | 54 ± 20 a | 39 ± 3 a | 88 ± 6 a | 76 ± 10 a | 258 ± 18 a |
| BC-0.5% | 37 ± 17 a | 40 ± 12 a | 90 ± 12 a | 81 ± 21 a | 247 ± 44 a | |
| BC-2.0% | 42 ± 10 a | 54 ± 6 a | 99 ± 20 a | 80 ± 5 a | 276 ± 27 a | |
| N120 | BC0 | 30 ± 6 b | 43 ± 3 a | 72 ± 7 a | 83 ± 19 a | 227 ± 22 b |
| BC-0.5% | 27 ± 7 b | 56 ± 17 a | 70 ± 7 a | 78 ± 10 a | 232 ± 4 b | |
| BC-2.0% | 52 ± 8 a | 62 ± 3 a | 77 ± 3 a | 89 ± 9 a | 279 ± 10 a | |
| N Losses | Treatment | Sampling Date | Total | |||
| g/pot | 21 July 2021 | 11 August 2021 | 29 August 2021 | |||
| NH4+-N | N200 | BC0 | 0.34 ± 0.02 a | 0.36 ± 0.02 a | 0.37 ± 0.03 a | 1.07 ± 0.07 a |
| BC-0.5% | 0.35 ± 0.02 a | 0.33 ± 0.02 a | 0.37 ± 0.04 a | 1.06 ± 0.08 a | ||
| BC-2.0% | 0.37 ± 0.04 a | 0.37 ± 0.04 a | 0.39 ± 0.04 a | 1.13 ± 0.13 a | ||
| N160 | BC0 | 0.42 ± 0.09 a | 0.34 ± 0.04 b | 0.35 ± 0.05 a | 1.11 ± 0.17 a | |
| BC-0.5% | 0.45 ± 0.04 a | 0.39 ± 0.03 ab | 0.39 ± 0.04 a | 1.22 ± 0.11 a | ||
| BC-2.0% | 0.50 ± 0.03 a | 0.44 ± 0.01 a | 0.41 ± 0.02 a | 1.34 ± 0.05 a | ||
| N120 | BC0 | 0.30 ± 0.01 b | 0.29 ± 0.01 b | 0.29 ± 0.02 b | 0.87 ± 0.02 b | |
| BC-0.5% | 0.47 ± 0.00 a | 0.34 ± 0.01 a | 0.47 ± 0.17 a | 1.27 ± 0.16 a | ||
| BC-2.0% | 0.39 ± 0.10 ab | 0.39 ± 0.07 a | 0.41 ± 0.06 ab | 1.19 ± 0.23 a | ||
| NO3−-N | N200 | BC0 | 0.33 ± 0.02 c | 1.50 ± 0.44 a | 1.59 ± 0.18 a | 3.42 ± 0.59 a |
| BC-0.5% | 0.53 ± 0.01 b | 2.20 ± 0.38 a | 1.54 ± 0.64 a | 4.27 ± 0.97 a | ||
| BC-2.0% | 0.71 ± 0.08 a | 1.83 ± 0.62 a | 2.45 ± 1.37 a | 4.99 ± 1.90 a | ||
| N160 | BC0 | 0.47 ± 0.18 a | 1.71 ± 0.64 b | 2.31 ± 0.80 a | 4.49 ± 1.25 a | |
| BC-0.5% | 0.28 ± 0.06 b | 2.82 ± 0.62 a | 2.69 ± 0.11 a | 5.79 ± 0.71 a | ||
| BC-2.0% | 0.20 ± 0.04 b | 2.59 ± 0.33 ab | 1.99 ± 0.22 a | 4.78 ± 0.32 a | ||
| N120 | BC0 | 0.21 ± 0.07 b | 2.34 ± 0.23 a | 2.56 ± 0.29 a | 5.11 ± 0.48 a | |
| BC-0.5% | 0.19 ± 0.01 b | 2.53 ± 0.71 a | 3.05 ± 0.79 a | 5.76 ± 1.45 a | ||
| BC-2.0% | 0.52 ± 0.07 a | 2.90 ± 0.45 a | 3.11 ± 0.59 a | 6.52 ± 0.72 a | ||
| Organic N | N200 | BC0 | 1.31 ± 0.08 b | 2.14 ± 0.76 b | 2.63 ± 0.68 b | 6.08 ± 1.27 b |
| BC-0.5% | 1.27 ± 0.10 b | 2.40 ± 0.74 b | 2.21 ± 0.16 b | 5.89 ± 0.77 b | ||
| BC-2.0% | 1.87 ± 0.20 a | 4.05 ± 0.91 a | 2.85 ± 0.22 b | 8.77 ± 0.82 a | ||
| N160 | BC0 | 1.27 ± 0.52 b | 2.11 ± 0.67 b | 3.11 ± 0.74 a | 6.49 ± 0.44 b | |
| BC-0.5% | 1.68 ± 0.42 b | 2.93 ± 0.06 b | 2.91 ± 0.23 a | 7.52 ± 0.27 b | ||
| BC-2.0% | 2.20 ± 1.29 a | 4.14 ± 0.19 a | 3.15 ± 0.87 a | 9.49 ± 0.94 a | ||
| N120 | BC0 | 1.07 ± 0.20 b | 2.01 ± 0.46 b | 2.14 ± 0.29 b | 5.21 ± 0.54 c | |
| BC-0.5% | 1.62 ± 0.12 a | 2.98 ± 0.10 b | 3.07 ± 0.30 b | 7.68 ± 0.46 b | ||
| BC-2.0% | 1.62 ± 0.23 a | 4.07 ± 0.50 a | 4.16 ± 0.52 a | 9.85 ± 1.07 a | ||
| Total N | N200 | BC0 | 1.98 ± 0.10 b | 4.00 ± 1.21 b | 4.59 ± 0.88 ab | 10.6 ± 1.90 a |
| BC-0.5% | 2.16 ± 0.08 b | 4.94 ± 1.12 ab | 4.12 ± 0.83 d | 11.2 ± 1.75 a | ||
| BC-2.0% | 2.95 ± 0.32 a | 6.25 ± 1.49 a | 5.69 ± 1.20 a | 14.9 ± 2.82 a | ||
| N160 | BC0 | 2.16 ± 0.50 b | 4.16 ± 1.31 b | 5.78 ± 0.25 a | 12.1 ± 1.69 b | |
| BC-0.5% | 2.41 ± 0.51 ab | 6.14 ± 0.57 a | 5.98 ± 0.14 a | 14.5 ± 0.59 ab | ||
| BC-2.0% | 2.89 ± 0.34 a | 7.17 ± 0.37 a | 5.54 ± 0.66 a | 15.6 ± 1.06 a | ||
| N120 | BC0 | 1.58 ± 0.15 b | 4.63 ± 0.49 b | 4.99 ± 0.32 b | 11.2 ± 0.62 b | |
| BC-0.5% | 2.27 ± 0.11 a | 5.85 ± 0.67 ab | 6.59 ± 0.56 a | 14.7 ± 1.07 a | ||
| BC-2.0% | 2.52 ± 0.35 a | 7.36 ± 0.75 a | 7.67 ± 1.09 a | 17.6 ± 1.85 a | ||
Publisher’s Note: MDPI stays neutral with regard to jurisdictional claims in published maps and institutional affiliations. |
© 2022 by the authors. Licensee MDPI, Basel, Switzerland. This article is an open access article distributed under the terms and conditions of the Creative Commons Attribution (CC BY) license (https://creativecommons.org/licenses/by/4.0/).
Share and Cite
Sun, H.; Chen, Y.; Yi, Z. After-Effects of Hydrochar Amendment on Water Spinach Production, N Leaching, and N2O Emission from a Vegetable Soil under Varying N-Inputs. Plants 2022, 11, 3444. https://doi.org/10.3390/plants11243444
Sun H, Chen Y, Yi Z. After-Effects of Hydrochar Amendment on Water Spinach Production, N Leaching, and N2O Emission from a Vegetable Soil under Varying N-Inputs. Plants. 2022; 11(24):3444. https://doi.org/10.3390/plants11243444
Chicago/Turabian StyleSun, Haijun, Ying Chen, and Zhenghua Yi. 2022. "After-Effects of Hydrochar Amendment on Water Spinach Production, N Leaching, and N2O Emission from a Vegetable Soil under Varying N-Inputs" Plants 11, no. 24: 3444. https://doi.org/10.3390/plants11243444