Introduction
Johnsons Glacier is a small (about 5 km2) tidewater glacier located at Livingston Island, South Shetland Islands, Antarctica (62˚40’ S, 60˚30’ W). A local ice divide, at 200–330 ma.s.l., defines it as a separate glacier basin within the Hurd Peninsula ice cap (Fig. 1). It terminates in a 50 m high ice cliff extending 500 m along the coast. The northern part of the glacier has larger slopes (typical values about 10˚) than those in the southern part (typical values about 6˚). The confluence of the northern and southern flows of ice results in a folded and highly fractured terminal zone. Because of the orography and the prevailing northeasterly wind direction, the northern sector shows the largest accumulation rates. The equilibrium-line altitude is about 150m in the northern area and 180–260m in the southern area (Reference XimenisXimenis, 2001). From the thermal point of view, Johnsons Glacier is temperate, as revealed by temperature and density profiles measured at boreholes (Reference Furdada, Pourchet and VilaplanaFurdada and others, 1999; data from M. Pourchet and J. M. Casas reported in Reference XimenisXimenis, 2001). This is an unusual characteristic of Antarctic glaciers, though common for the glaciers in the South Shetland Islands, where typical summer temperatures at sea level are a few degrees above zero.
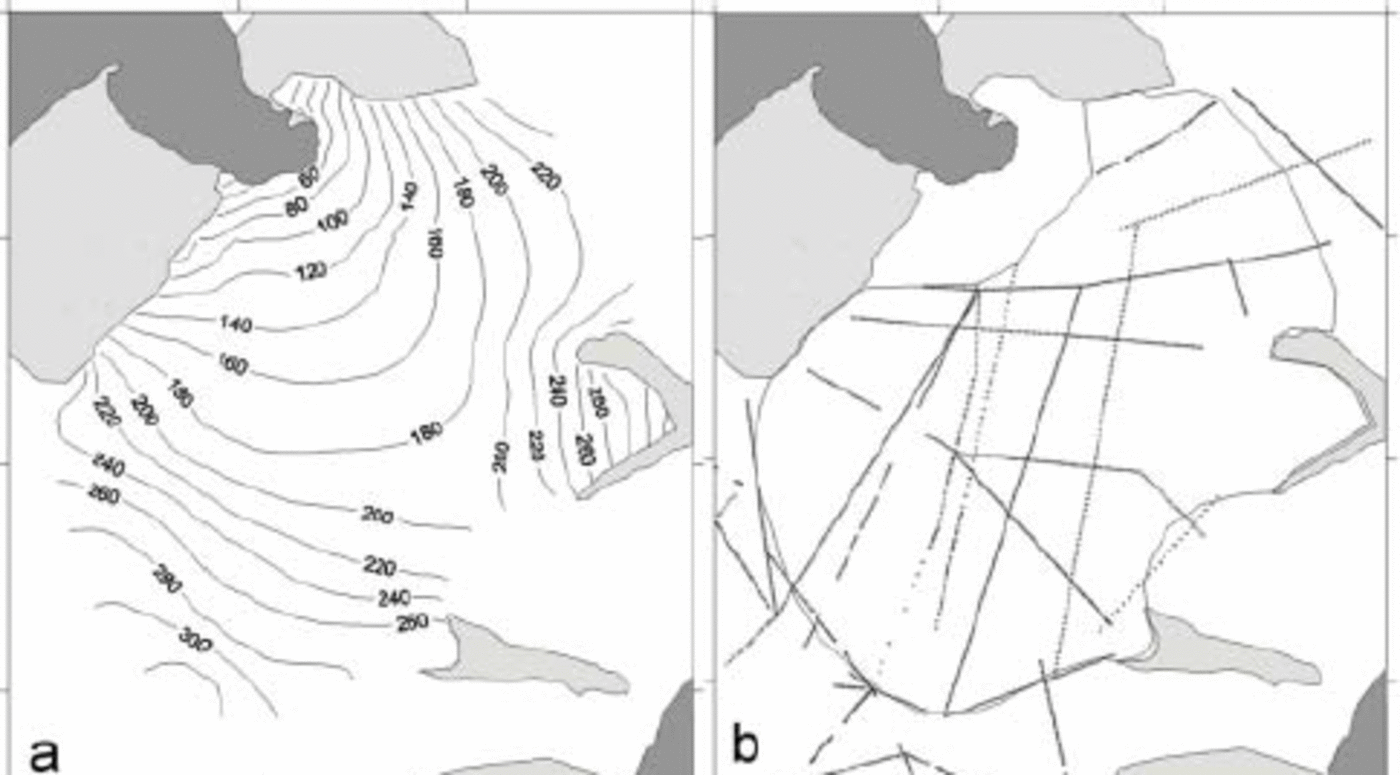
Fig. 1. (a) Surface topography of Johnsons Glacier; (b) location of radar and seismic profiles; (c) ice-thickness map retrieved from radar and seismic data; (d) subglacial relief determined by subtracting ice thickness from surface elevation. The light-grey areas are ice-free zones and the dark grey represents the sea. Contour interval is 20 m. The contour lines in (c) and (d) are restricted to the area covered by the radar and seismic surveys and used for the modelling. This is delimited by ice divides, rock outcrops and an artificial section delimiting the start of the highly crevassed terminal zone. This artificial section follows a line joining velocity/accumulation–ablation stakes (not shown).
This paper is focused on the modelling of the dynamics of Johnsons Glacier, with the aim of determining the velocity and stress fields for the present geometry, computed for the values of the parameters in the constitutive relation and sliding law that provide the best fit between observed and computed ice surface velocities. The assumptions of the shallow-ice approximation (SIA) typical of ice-sheet modelling are not appropriate for the modelling of small glaciers with complex geometry such as Johnsons Glacier. Therefore, we have developed a model of the dynamics of temperate glaciers that numerically solves the full Stokes system of differential equations governing glacier dynamics without recourse to simplifications such as those involved in the SIA. In a previous paper (Reference Corcuera, Navarro, Martn, Calvet and XimenisCorcuera and others, 2001) we applied an earlier two-dimensional (2-D) steady-state model to a flowline of Johnsons Glacier. One of our conclusions was that, due to the complex geometry of this glacier and its lack of symmetries, a 2-D model was not suitable and a three-dimensional (3-D) model was demanded. We now present such a model, which has also been improved to include the possibility of time evolution. It consists of two sub-models: the dynamical sub-model involves the momentum- and mass-conservation equations and uses Glen’s flow law as the constitutive relation; the surface evolution sub-model is defined by the kinematic characterization of the free surface relating the changes in ice thickness to the velocity field and the net mass balance. The latter sub-model is the one allowing for the analysis of the time evolution; however, in the present application its use has been restricted to the smoothing of the surface geometry.
The proximity of Johnsons Glacier to the Spanish Antarctic Station (BAE) Juan Carlos I has provided the opportunity to collect a sufficient amount of field data to be used both as input to the model and as a database for tuning purposes. These data include:
Glacier geometry (Fig. 1): ice surface determined from topographic measurements (Reference XimenisXimenis, 2001) and ice thickness inferred from seismic data (Reference BenjumeaBenjumea and Teixidó 2001) and radar data (Reference Benjumea, Macheret, Navarro and TeixidóBenjumea and others, 2003).
Ice velocity at the glacier surface, measured at a net of 20 stakes deployed in 1994 (Reference XimenisXimenis, 2001).
Mass balance at the surface, measured at the net of stakes (Reference XimenisXimenis, 2001).
Meteorological data at the BAE (Reference XimenisXimenis, 2001).
Model Equations
The ice mass is considered to be an incompressible and isotropic non-linear viscous fluid. Because of the extremely low Reynolds number (Re∼10–13), we may consider a stationary quasi-static flow regime. The model can be separated into two sub-models, whose unknowns are functions of space and time and are solved separately, through an iterative procedure that uncouples the equations.
Dynamical sub-model
The equations describing the dynamical model are the usual ones for steady conservation of linear momentum and conservation of mass for an incompressible continuous medium:
where τij is the deviatoric stress tensor and p is the pressure (compressive mean stress), linked to the stress tensor σij through the relations
Conservation of angular momentum implies the symmetry of the stress tensor, ![]() altconstitutive relation, we adopt Glen’s law, given by the equations
altconstitutive relation, we adopt Glen’s law, given by the equations

In the previous equations
and

are, respectively, the strain-rate tensor and the effective strain rate.
We have set n = 3 and taken B as a phenomenological parameter whose value can be varied, within reasonable limits, to fit the observed and computed velocities at the glacier surface.
Free-surface evolution sub-model
This sub-model is given by the kinematic characterization of the free surface, which defines the evolution of the glacier surface due to the glacier motion and the accumulation and ablation processes. The unknown function is the glacier surface elevation h. Its material derivative (i.e. dh/dt) represents the temporal variation of the glacier surface, measured while ‘riding’ a moving particle, and has to equal the vertical component w of the velocity plus the accumulation rate a. Separating the material derivative into local component ∂h/∂t and convective term u . ▽H h (where u is the velocity vector and ▽H is a horizontal gradient), we get
which provides the kinematic characterization of the free surface.
Numerical Solution
The model is solved iteratively by means of a procedure that uncouples the dynamical and free-surface evolution sub-models. Starting from an initial glacier configuration, the finite-element method is used to solve the dynamical sub-model, providing the velocity and pressure fields for the initial configuration. These are then used to solve the free-surface evolution sub-model, by semi-Lagrangian methods, thus producing a new glacier surface configuration at a time ▽ t later. The process is repeated until convergence.
Dynamical sub-model
Equations (1) and (2) are a Stokes system of equations (Reference Quarteroni and ValliQuarteroni and Valli, 1994, ch. 9) whose non-linearity is not associated with the convective term usual in fluid dynamics (which is absent) but with the non-linear character of the constitutive relation. The unknowns are the velocity components and the pressure. This system is reformulated in a weak form, whose solution is approximated by finite-element methods. The details are given in the Appendix.
The domain is divided into hexahedral elements such that the pressure is constant within each element and the velocities vary bilinearly across the element. For each hexahedron, the velocity nodes are located at its eight corners, while the pressure node is located at the centre of the element. A sample grid of 960 elements is shown in Figure 2. The main practical problem of using hexahedral elements is that zero thickness points are not allowed. Where such points really exist, the ice thickness has been set to 5 m. As an alternative, a 3-D automatic gridding routine which generates tetrahedral elements constructed by the Voronoï method following Delaunay triangulation rules (Reference Frey and GeorgeFrey and George, 2000, ch. 7) is also available. Though it is more efficient, it has a higher computational cost and it produces a non-structured grid.
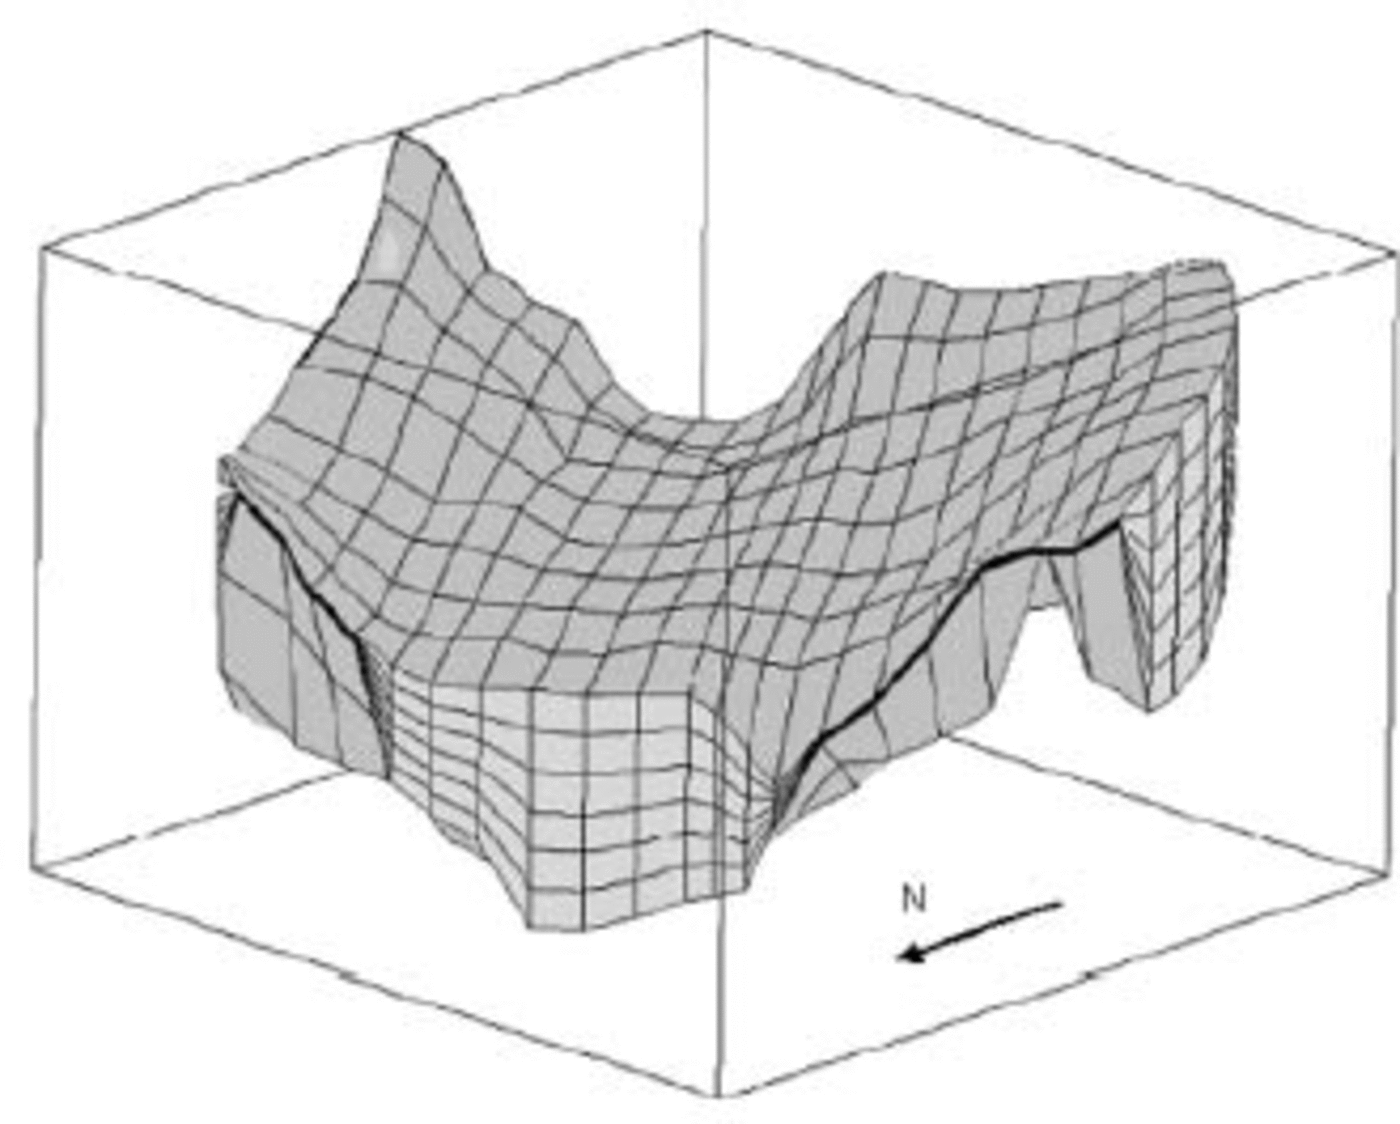
Fig. 2. Finite-element grid made of 21×9×7=1323 velocity nodes and 960 pressure nodes (one pressure node and eight velocity nodes per element). Vertical dimension is exaggerated ×5. The light-grey area in the foreground is the artificial boundary near the glacier terminus. The elements in the columns on both sides of this boundary are shown to coalesce in zero-thickness boundaries. The light-grey area on the righthand side represents an ice divide.
The choice of basis functions of the approximating spaces for pressure and velocity made up of polynomials of different degree is dictated by considerations of convergence and stability of the numerical solution (Reference Carey and OdenCarey and Oden, 1986, §3.3.3; Reference Quarteroni and ValliQuarteroni and Valli, 1994, §9.3). From this point of view, a much better choice would be to use bilinear pressures and biquadratic velocities, as we did in a previous
application of the earlier 2-D model (Reference Corcuera, Navarro, Martn, Calvet and XimenisCorcuera and others, 2001). In the present 3-D application, however, such an option would involve too much computational effort. The ice density and the rheological parameters B and n have been taken as constant across the full glacier, though B can be set as a function of position, temperature or water content.
The integrals involved in the element computations are calculated by means of Gauss–Legendre quadrature. The master integrals are computed by the usual isoparametric transformation. The non-linear system of equations (A3) has been solved iteratively, using a direct procedure based on fixed-point iteration. The linear system associated with each step of this iterative procedure is solved by a LU decomposition method. The iteration procedure stops when the norm of the vector difference between the non-dimensional solutions for successive iterations falls below a prescribed tolerance. We usually set this to 10–6.
Free-surface evolution sub-model
The surface evolution equation (6) is a non-linear advection equation. Advection equations are usually numerically solved by means of finite-difference methods combining time and space discretizations (e.g. Reference Van der VeenVan der Veen, 1999, §8.2). An alternative approach would be the use of pseudo-spectral methods (e.g. Reference Hindmarsh, Straughan, Greve, Ehrentraut and WangHindmarsh, 2001). However, the use of semi-Lagrangian methods has been found to be more appropriate (Reference Staniforth and CôtéStaniforth and Côté, 1991). Eulerian advection schemes work well on regular Cartesian meshes, but often lead to overly restrictive time-steps due to considerations of computational stability. Lagrangian advection schemes allow for much larger time-steps, but have the disadvantage that an initially regularly spaced set of particles will generally evolve to a highly irregularly spaced set at later times, and important features of the flow may consequently not be well represented. The idea behind semi-Lagrangian advection schemes is to try to get the best of both approaches: the regular resolution of Eulerian schemes and the enhanced stability of Lagrangian schemes. This is achieved by using a different set of particles at each time-
step, the set of particles being chosen such that they arrive exactly at the points of a regular Cartesian mesh at the end of the time-step.
Focusing on our problem, if we try to solve iteratively the equations for the dynamical and surface evolution sub-models, starting from the present surface geometry, until it reaches a steady-state configuration, the non-linear advection equation causes spurious dispersion coupled with other fields leading to non-linear instabilities (Reference Hindmarsh, Straughan, Greve, Ehrentraut and WangHindmarsh, 2001). Finite-difference schemes for time evolution involve migration of modes at different phase speeds, while the semi-Lagrangian methods show good phase speeds with little dispersion (Reference Staniforth and CôtéStaniforth and Côté, 1991).
In particular, our implementation of semi-Lagrangian methods uses cubic spatial interpolation and two-step linear time extrapolation. No further details of the method will be given, as its use in the present application has been rather limited. The model has not been run into steady state. Starting from the present glacier geometry, the surface evolution equation has only been used for a few very short time-steps (five steps of 0.2 years) with the aim of smoothing the upper surface of the glacier. The resulting ∂h/∂t field after such short time evolution is rather small in large parts of the glacier, especially at the mid-altitudes, though it shows maximum values of the same order of magnitude as the accumulation rate in some parts of the divide (negative values) and terminus (positive values) areas, indicating that the glacier is not in a steady-state configuration but is not very far from balance.
Boundary Conditions
The domain boundary can be divided into portions having different boundary conditions. The upper surface is considered a stress-free area with unconstrained velocities. This means that the observed surface velocities are not used as boundary conditions; instead, they are used, together with the computed surface velocities, for tuning of the free parameters of the model, as is described later. At the ice divides, the horizontal velocities and the shear stresses are expected to be small, so we have set them as null and left the vertical velocity unconstrained. Notice, however, that for 3-D models the divide is a curved surface where the component of horizontal velocity in the normal direction is null but the component in the tangent plane can be non-zero (though usually small). At the lateral zero-thickness walls, the ice is considered to be frozen to the wall, i.e. null velocities are specified. No ice-thickness data are available near the glacier terminus, which is a highly crevassed area. Because of this, we have not modelled the glacier right to its terminus. Instead, an artificial vertical boundary has been introduced near the terminus (Fig. 1). At this boundary we have set velocity boundary conditions. Both velocity modulus and direction at the surface nodes of this boundary have been interpolated from experimental velocities measured at the stakes located along it. The velocities at depth have been set according to a SIA velocity–depth profile. At the basal nodes, the velocities are specified according to a sliding law
where τb is the basal shear stress, p e is the effective pressure (ice pressure less buoyant force) and we have set p = 3 and q = 1, leaving k as a free parameter for the tuning process. Equation (7) was used to determine the horizontal components of the basal velocity, from which the vertical component was computed using the equilibrium condition at the bed, assuming a rigid bed and no melting at the bed, i.e. w = u(∂b/∂x) + v(∂b/∂y), where b is the glacier bed elevation. In this way, the resulting sliding velocity follows the driving-stress horizontal direction while remaining tangent to the bed. There are no measurements of water pressure at Johnsons Glacier. Instead of making assumptions without any experimental foundation, we assumed the water level to be at sea level, which is the lower limit for a tidewater glacier. The basal slope was averaged over a circle with radius equal to the ice thickness, in order to avoid local effects.
Concerning the implementation of the boundary conditions on the system of equations (A3), those given in terms of stresses (Neumann conditions) are used in the computation of the independent term of the system, which also involves the body-forces terms. The boundary conditions given in terms of velocities (Dirichlet conditions) are applied directly upon the system, so reducing its dimension.
Sensitivity Tests, Model Tuning and Results
In a previous paper (Reference Corcuera, Navarro, Martn, Calvet and XimenisCorcuera and others, 2001, fig. 4), the earlier 2-D model solution was successfully tested against Nye’s analytical solution for an inclined parallel ice slab. For an ice sheet with irregular surface and bed, the 2-D version of the model solution was compared with the SIA solution, showing a very good agreement at distances from the ice divide larger than the divide ice thickness (unpublished data from the authors).
A number of tests were also performed to check the sensitivity of the model to changes in input data. The effects
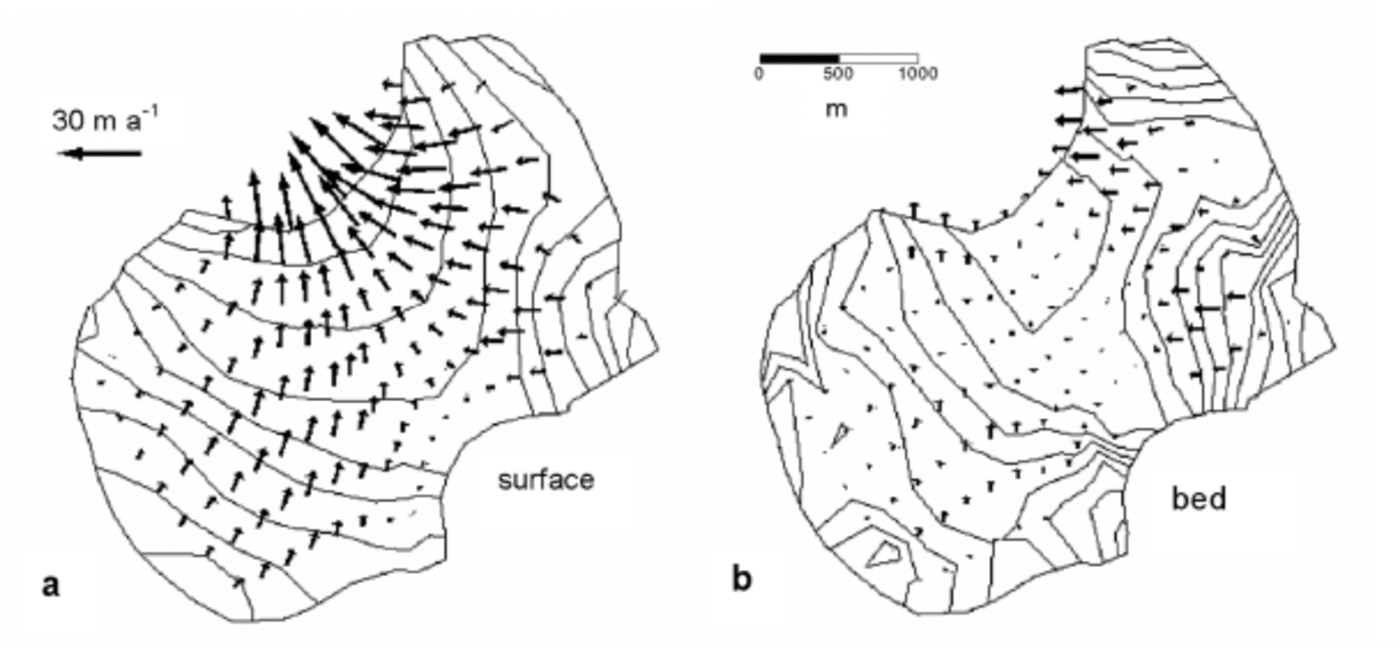
Fig. 4. Computed velocities at the glacier surface (a) and at the bed (b), for model parameters ![]() Though the results were computed for a 5600 element grid, they have been decimated to aid graphical clarity.
Though the results were computed for a 5600 element grid, they have been decimated to aid graphical clarity.
of an increase in resolution were tested first. Starting from a rather coarse grid (about 7× 5 × 3 nodes), the finite-element solution starts to converge. Increasing the resolution from such values improves the solution smoothly, the improvement being more remarkable for the pressure than for the velocity solution, i.e. the pressure solution is much more sensitive to mesh size. The observed surface velocities are not used as input data to the model (they are only used for tuning purposes), except for the velocities in the stakes at the artificial boundary near the terminus. Changes for the latter, using year average velocities instead of summer velocities, which differ by about 35%, resulted in comparable changes in the model solution. Finally, the process of tuning the free parameters of the model (B and k) also constitutes a sensitivity test.
The tuning parameters in our model are the stiffness parameter B in the constitutive relation and the coefficient k in the sliding law. Grid sizes larger than 960-elements (as in Fig. 2) did not substantially change the estimates of the tuning parameters, while they implied a large increase in computational effort, so that the 960-element grid was selected for this purpose. For the tuning, B values were increased from 0.15 to 0.35 MPa a1/3, in steps of 0.02 MPa a1/3, and k from 0 to 7 × 10³ma–1MPa–2, in steps of 0.7 × 10³ma–1MPa–2. Tuning was made looking for optimal vector correlation, as defined by Reference Hanson, Klink, Matsuura, Robeson and WillmottHanson and others (1992), between computed and observed summer surface velocities. Correlation improves as the correlation coefficient approaches 1. At the model resolution, the best fit between computed and observed velocities is obtained within a large area with B values >0.19MPaa1/3 and k values between 0.3×10³ and 6.8 × 10³ma–1MPa–2 (see Fig. 3). Within the area of highest correlation (>0.975), the average ratios of basal to surface velocity (shown as dashed lines in Fig. 3) cover a quite wide range (0.1–0.7). Taking into account that this ratio is a value averaged over the full glacier, we could consider 0.3 a reasonable value. The corresponding values for B and k are then within 0.19–0.23 MPaa1/3 and 2.2–2.7×10³ma–1 MPa–2, respectively. As B and k are also responsible for the height-to-width ratio of the glacier geometry and the latter can be obtained by looking at the results in a steady state, the analysis used is therefore only strictly valid if the present glacier geometry is considered to be in steady state.
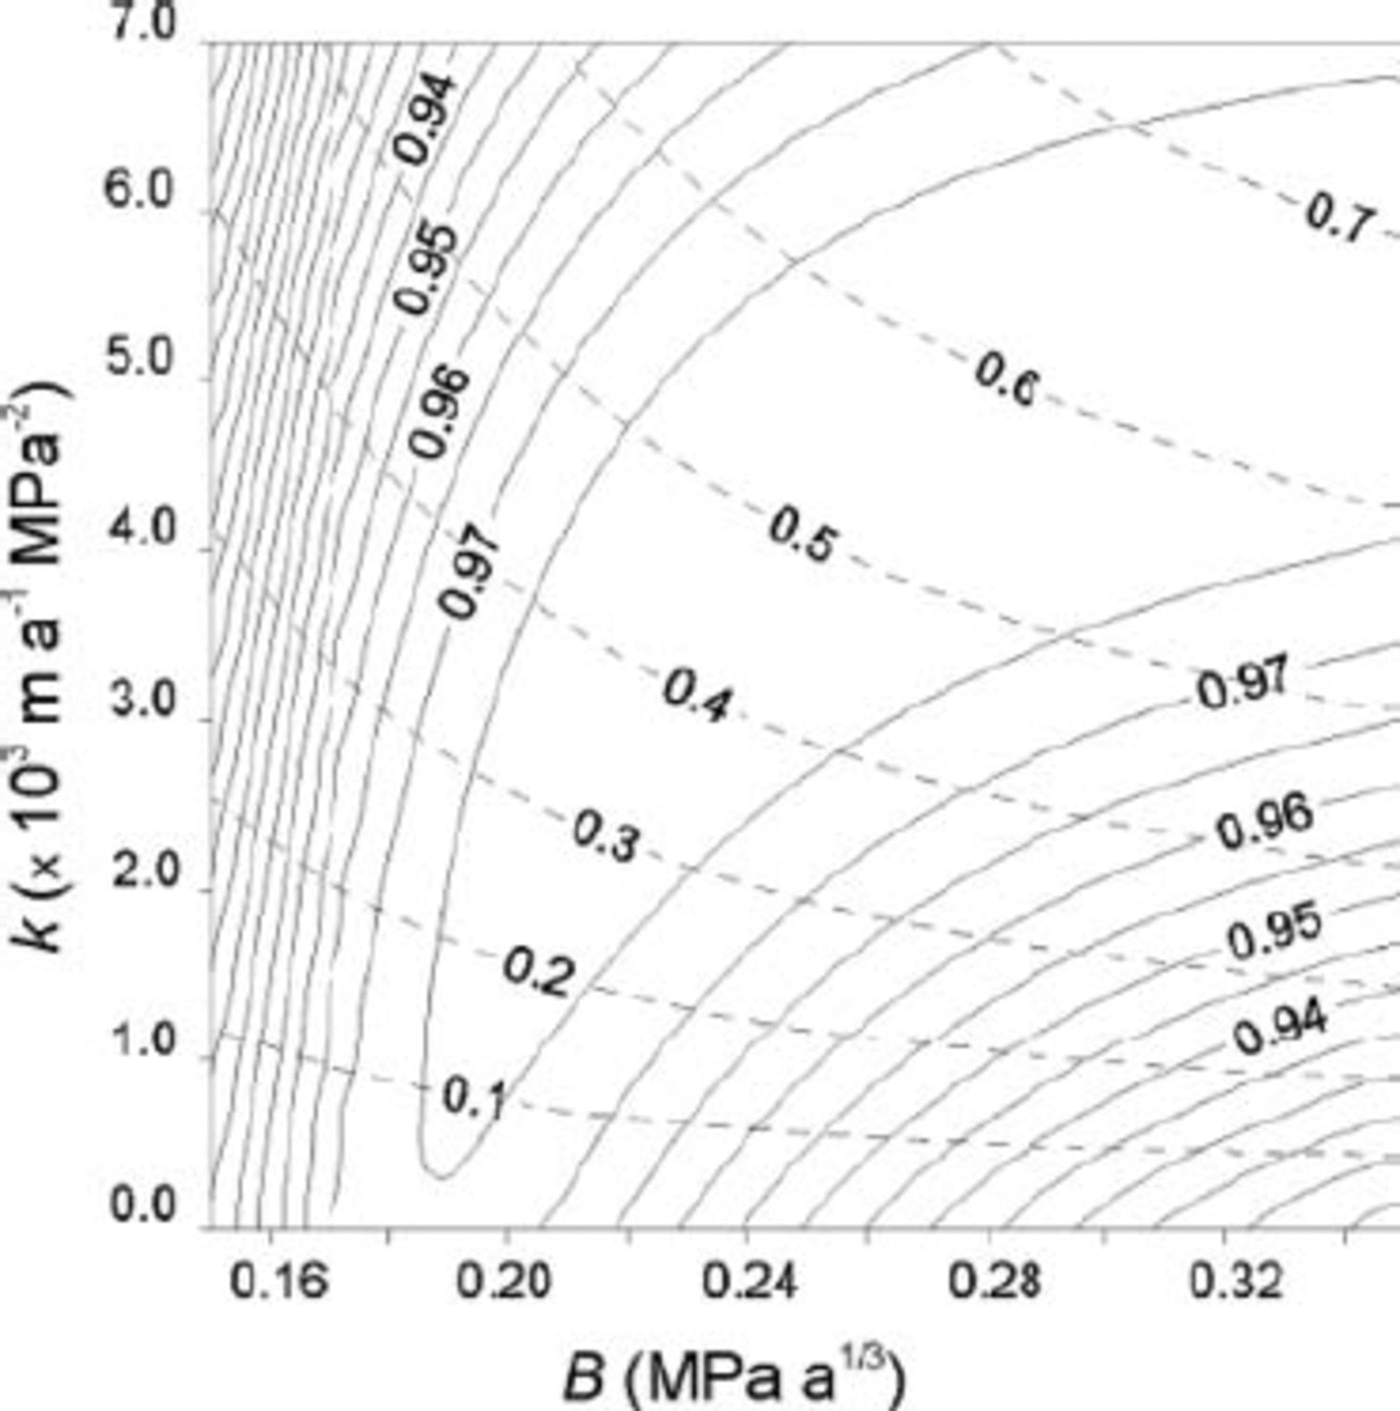
Fig. 3. Coefficient of vector correlation between computed and observed velocities at the surface, as a function of B and k. Contour interval for vector correlation is 0.005. The ratio of basal velocity to surface velocity is represented by dashed lines, shown with a contour interval of 0.1.
For the choice B=0.21MPa a1/3 and k=2.4×10³ma–1 MPa–2, the velocity and pressure fields were computed for a grid of 5600 elements, much denser than that used for the tuning, in order to obtain better resolution. The computed velocities at the surface, together with the sliding velocities, are shown in Figure 4. From the velocity and pressure fields, the six terms of the stress tensor can be calculated. This provides a means for calculating the force-balance components (Reference Van der VeenVan der Veen, 1999, §3.2). In Figure 5, driving stress and basal drag are shown. Another possibility is to compute, from the model output, the effective stress at surface. The areas where their values exceed a particular material failure criterion can be compared to the areas of occurrence of crevasses. Figure 6 is a contour map of effective stress at the surface, showing that the largest values are located near the glacier terminus and, in particular, in its northernmost area, where both the surface and bed slopes are very high.
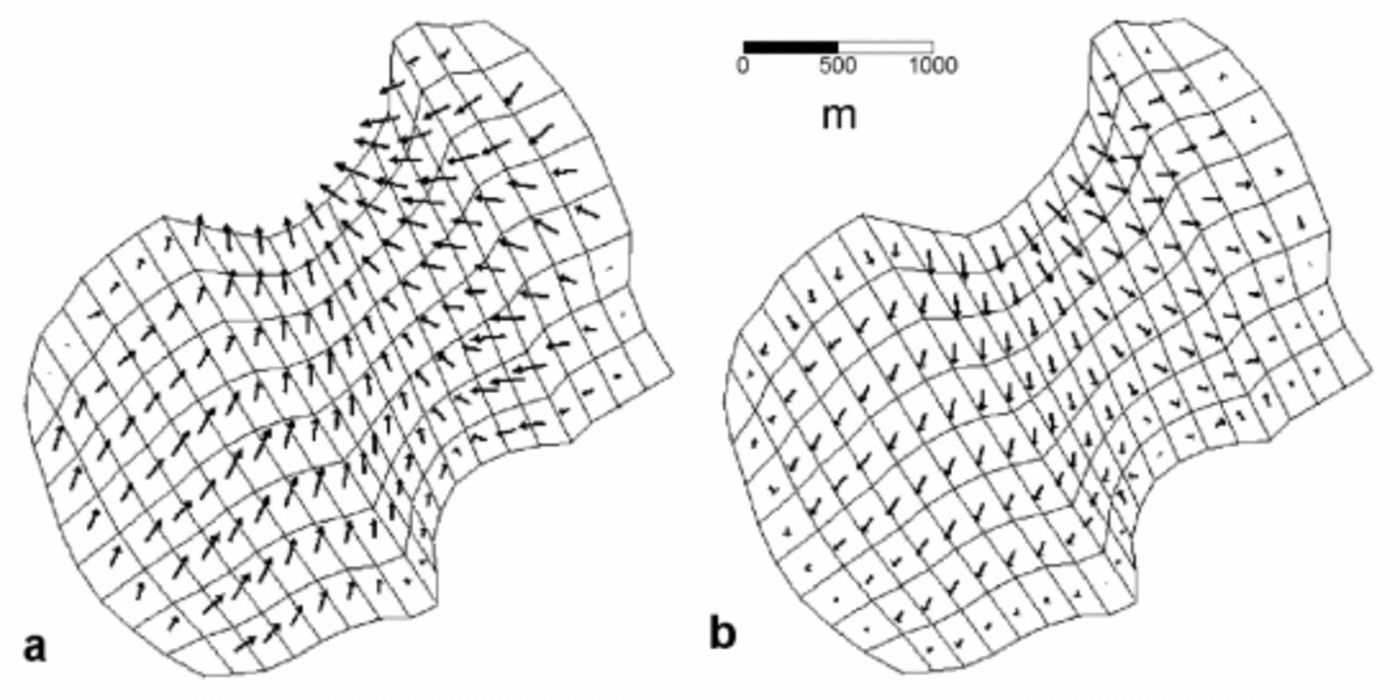
Fig. 5. Force-balance components: (a) driving stress; (b) basal drag. Force-balance components having much lower values (longitudinal stress gradients and lateral drag) are not shown. The results shown have been decimated to aid graphical clarity.
Discussion and Conclusions
The model results are satisfactory, showing a good overall agreement between computed and experimentally observed ice surface velocities, except for vertical velocities, which show the largest discrepancies: the average per cent differences between computed and observed velocity components are 4%, 7% and 39% for u, v and w respectively. Locally, there exist some significant discrepancies between computed and observed velocity values. For the horizontal components, this is limited to 3 (of 20) stakes; while the discrepancies for vertical velocities involve a much higher number of stakes (about 7 of 20), not showing any special pattern of spatial distribution. The use of a constant value for B across the glacier could be a reason for the local discrepancies; however, it is intrinsic to the tuning procedure. A positive feature of the model is that, in the divide areas, it shows the velocity pattern typical of higher-order models and absent in SIA models (Raymond bumps).
The pattern of contour lines of the correlation coefficient between computed and observed surface velocities (Fig. 3) is consistent: an increase in B (which means lower deformations) corresponds to an increase in sliding. However, within the area of highest correlation (>0.975), the values of the stiffness parameter B required to match the observed ice
surface velocities (>0.19MPa a1/3) are higher than expected for ice close to the melting point (∼0.17MPa a1/3, according to Reference PatersonPaterson, 1994, ch. 5). Nevertheless, the values corresponding to a reasonable average ratio of sliding to surface velocities of 0.3 (B∼0.19–0.23MPa a1/3) are close to those found by other authors for temperate glaciers. For instance, Reference HansonHanson (1995) obtained values of 0.20 –0.22 MPa a1/3 for Storglaciären, Sweden, and reported that similar values were obtained for Variegated Glacier, Alaska, USA, by Reference Raymond and HarrisonRaymond and Harrison (1988). Moreover, Hanson stressed that the sliding speeds needed to match surface velocities were set much lower than would have been expected from borehole studies in Storglaciären. Although for Johnsons Glacier there are no direct observations of sliding velocity, the velocities produced by the sliding law are lower than would be expected for a temperate tidewater glacier, especially since, for the tuning, we have used summer stake velocities. As shown in Figure 4b, the sliding velocities are very low in the central part of the terminal zone. This is due to the small surface slope in this area. The dividend in the sliding law roughly depends on (ρgH▽h)3 ,H being the ice thickness, while the divisor roughly depends on ρgH, since we have taken the water table equal to sea level and almost all of the glacier bed is above it (see Fig. 1d). The quotient then roughly depends on H 2(▽h)3. In spite of having the thickest ice in this area (see Fig. 1c), the small value of ▽h dominates. The only way to obtain larger sliding velocities would be to have a very high water table, so that the buoyant force could strongly decrease the effective pressure. Assumptions on water pressure such as those used by Reference Vieli, Funk and BlatterVieli and others (2000) for Hansbreen could be made; however, the lack of water-pressure and meltwater production measurements for Johnsons Glacier has not allowed us to make any assumption having an experimental foundation. We have thus taken a conservative approach, using the lower limit of the water pressure, as the authors mentioned did for their theoretical model of dynamics of tidewater glaciers (Reference Vieli, Funk and BlatterVieli and others, 2001). Another source of discrepancy between modelled and observed velocities could be the use of an artificial boundary in the terminal zone. The unavailability of ice-thickness measurements in this area, due to the abundance of crevasses, prevents modelling of the ‘real’ glacier, which has a calving front. It is doubtful, however, that its inclusion would improve the results, because of the complexity of the calving process and its modelling (e.g. Reference Van der VeenVan der Veen, 1996; Reference Vieli, Funk and BlatterVieli and others, 2000, Reference Vieli, Funk and Blatter2001). Neither has a deforming bed been considered, again because of lack of experimental evidence. There would be the possibility of including both sliding and bed deformation through the use of a thin layer of soft material at the bed. However, this would imply a higher number of tuning parameters (as the rheological parameters of the deforming bed should be included), which is not advisable.
Temperate glaciers are isothermal, except for a small dependence of the melting point on pressure, so that we may consider B independent of temperature. For these glaciers, however, B is strongly dependent on the water content of ice. Reference DuvalDuval (1977), using ice samples from temperate glaciers and water contents of 0.01–0.8%, showed a linear relationship between water content W (given as %) and the rate factor A 0 in Glen’s flow law (Reference Lliboutry and DuvalLliboutry and Duval, 1985):
where A 0 = B – n. According to such a relationship, our best-fit estimate B∼0.19–0.23MPa a1/3 would correspond to temperate ice with a very low water content (0–0.3%). However, water-content estimates from radio-wave velocity data reported for Johnsons Glacier have an average of 0.6 ± 1.1% (Benjumea and others, 2003), for which B values close to 0.17MPa a1/3 should be expected according to Duval’s formula.
Concerning k, the best-fit values k∼2.2–2.7×10³ma–1 MPa–2 are of the same order of magnitude as that found by Reference HansonHanson (1995), 104ma–1MPa–2, for the same choice of p and q.
The computations of force-balance components show that the main source of flow resistance is basal drag (80% of the driving stress for the whole glacier system). The longitudinal stress gradients are significant mainly in divide areas, where an extensional regime dominates, and to a lesser extent in the terminal zone. Lateral drag is only important on both sides of the terminal zone, where narrowing of the glacier basin, proximity to the glacier
walls and strong bed and surface slopes are combined. Unfortunately, the need to artificially end the glacier near the terminus does not allow the model to fully exploit the characteristics inherent to the solution of the full Stokes system, except for the divide areas, where the typical velocity pattern of higher-order models is shown.
The terminal zone of Johnsons Glacier is highly crevassed, which is typical of tidewater glaciers. These crevasses are a consequence of the extensional stress regime. The effective stress computed from the model (Fig. 6) shows that the highest values are reached near the glacier terminus, exceeding 1 bar only in its northernmost area. If we consider a von Mises criterion for the occurrence of crevasses corresponding to an effective stress of >1 bar (Reference VaughanVaughan, 1993), this correlates well with the location of the crevassed area.
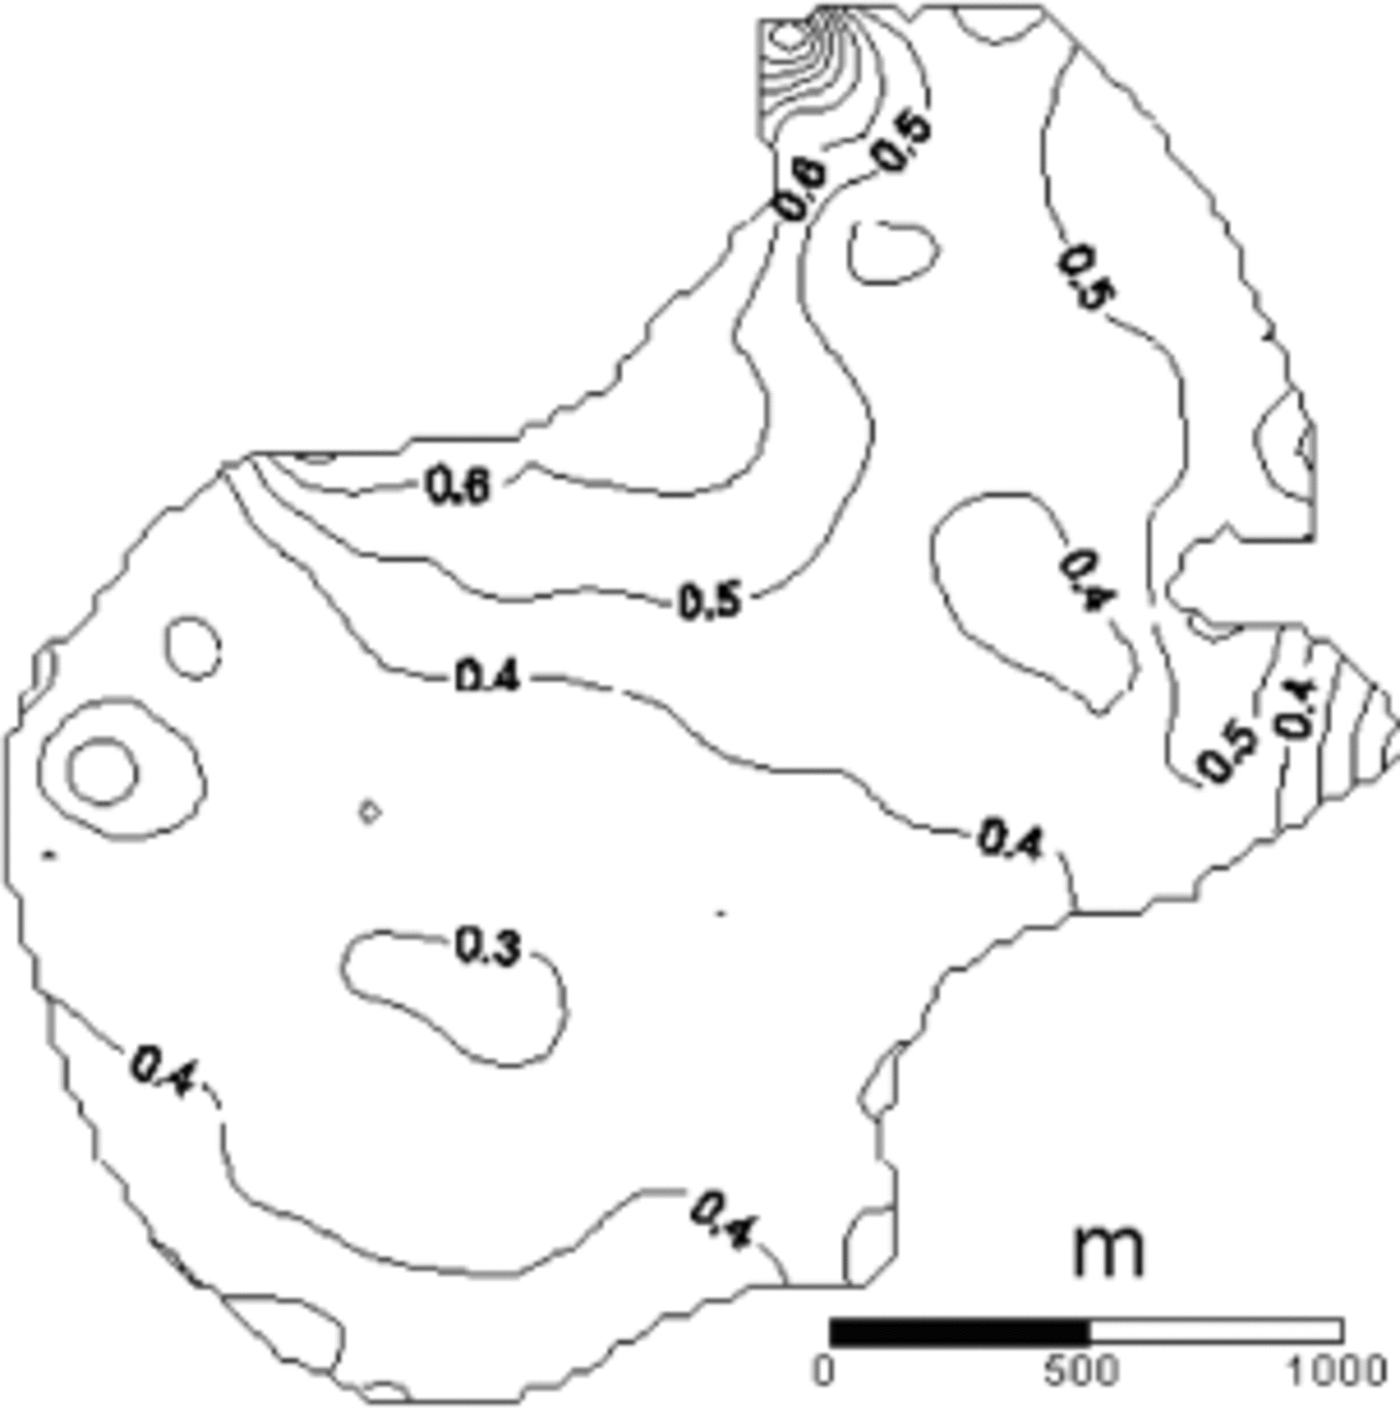
Fig. 6. Effective stress at surface, expressed in bar (1 bar = 105 Pa). Contour interval is 0.1 bar. Values larger than 1 bar would correspond to crevasses considering a von Mises criterion.
Summarizing, the model results, and their comparison with the field observations, clearly improve on those previously obtained using a 2-D model (Reference Corcuera, Navarro, Martn, Calvet and XimenisCorcuera and others, 2001). However, the sliding speeds required to match the observed surface velocities are smaller than would be expected for a tidewater temperate glacier, as the velocities used for the tuning correspond to the melt season. A better description of basal sliding is demanded, including a more realistic treatment of water pressure. Allowance should also be made in the model for deformation of glacial sediments.
Acknowledgements
This research has been supported by grants ANT99-0963 and REN2002-03199/ANT from the Spanish Ministry of Science and Technology.
Appendix
Weak Formulation And Finite-Element Discretization
Weak formulation
Let us take a Cartesian reference system with vertical coordinate z (positive upward) and horizontal coordinates x and y in directions east and north, respectively. Therefore, g = (00–g). To set the weak formulation of the problem, we choose a mixed velocity–pressure method (Carey and Oden, 1986, §3.3.3), applying the usual weighted residual argument by multiplying Equations (1) and (2), expressed in terms of σij , by arbitrary test functions qu , qv , qw , qp (respectively) and setting equal to zero the integrals, over the domain under consideration, of the resulting products. We then apply Green’s theorem (integration by parts) to the terms containing stress derivatives. The weak formulation is thus stated as follows: find u, v, w, p satisfying the prescribed boundaryconditions and such that
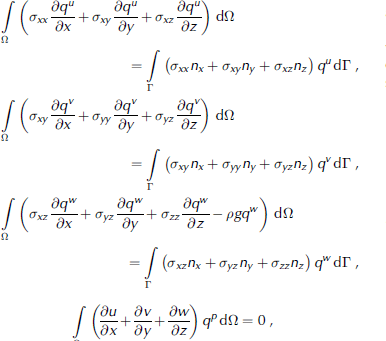
for all test functions qu
, qv
, qw
, qp
belonging to spaces of appropriate nature (Sobolev-type, for velocities, and square-integrable functions, for pressure). The weak solution (u,v,w,p) is also sought in the same spaces. In these equations, n = (nx
,ny
,nz
) is the unit vector normal (outward) to the boundary ![]() of the domain Ω.
of the domain Ω.
Finite-element discretization
In order to obtain a finite-element approximation to the weak form of our problem, we first discretize the domain Ω to a union of finite elements. Next we introduce global piecewise approximations U, V, W, P to the unknown functions u, v, w, p constructing finite-dimension subspaces Φ u , Φ v , Φ w and Φ p , using piecewise Lagrange polynomials. Denoting the corresponding basis as
the approximate solutions (or trial functions) are given by

The finite-element equations are constructed by means of the Galerkin method, taking as equal the spaces for the test and trial functions. The weak statement (A1) then leads, using Equations (A2), together with the constitutive relation
(4) and the definitions (5), to the system of equations

where U = (U1,...,UNU) T V = (V1,...,VNV) T W= (W1, ...,WNW)T , P = (P1,...,PNP) T , T means transpose and the elements of the submatrices and vectors in Equation (A3) are given by the following expressions, in which a comma followed by a subindex denotes a partial derivative with respect to the variable specified by the subindex:


The above system of NU+NV+NW+NP equations is symmetric, because of the symmetry of the submatrices in the principal diagonal and the transpose structure of the remaining submatrices. However, the system is undefined. Therefore, the eigenvalues are real but with variable sign. It is possible to transform system (A3) into an equivalent one which is positive definite, but no longer symmetric, so that all its eigenvalues have a positive real part (Reference Quarteroni and ValliQuarteroni and Valli, 1994, §9.2.1).
Although system (A3) has the appearance of a linear system of equations, the elements in the submatrices K depend on the viscosity μ, which in turn depends on the derivatives of the velocities. The system is therefore non-linear and has to be solved iteratively.


