Runtime performance is how your page performs when it is running, as opposed to loading. This tutorial teaches you how to use the Chrome DevTools Performance panel to analyze runtime performance. In terms of the RAIL model, the skills you learn in this tutorial are useful for analyzing the Response, Animation, and Idle phases of your page.
Get started
In this tutorial, we will use the Performance panel to find a performance bottleneck on a live page. To begin:
- Open Google Chrome in Incognito Mode. Incognito Mode ensures that Chrome runs in a clean state. For example, if you have a lot of extensions installed, those extensions might create noise in your performance measurements.
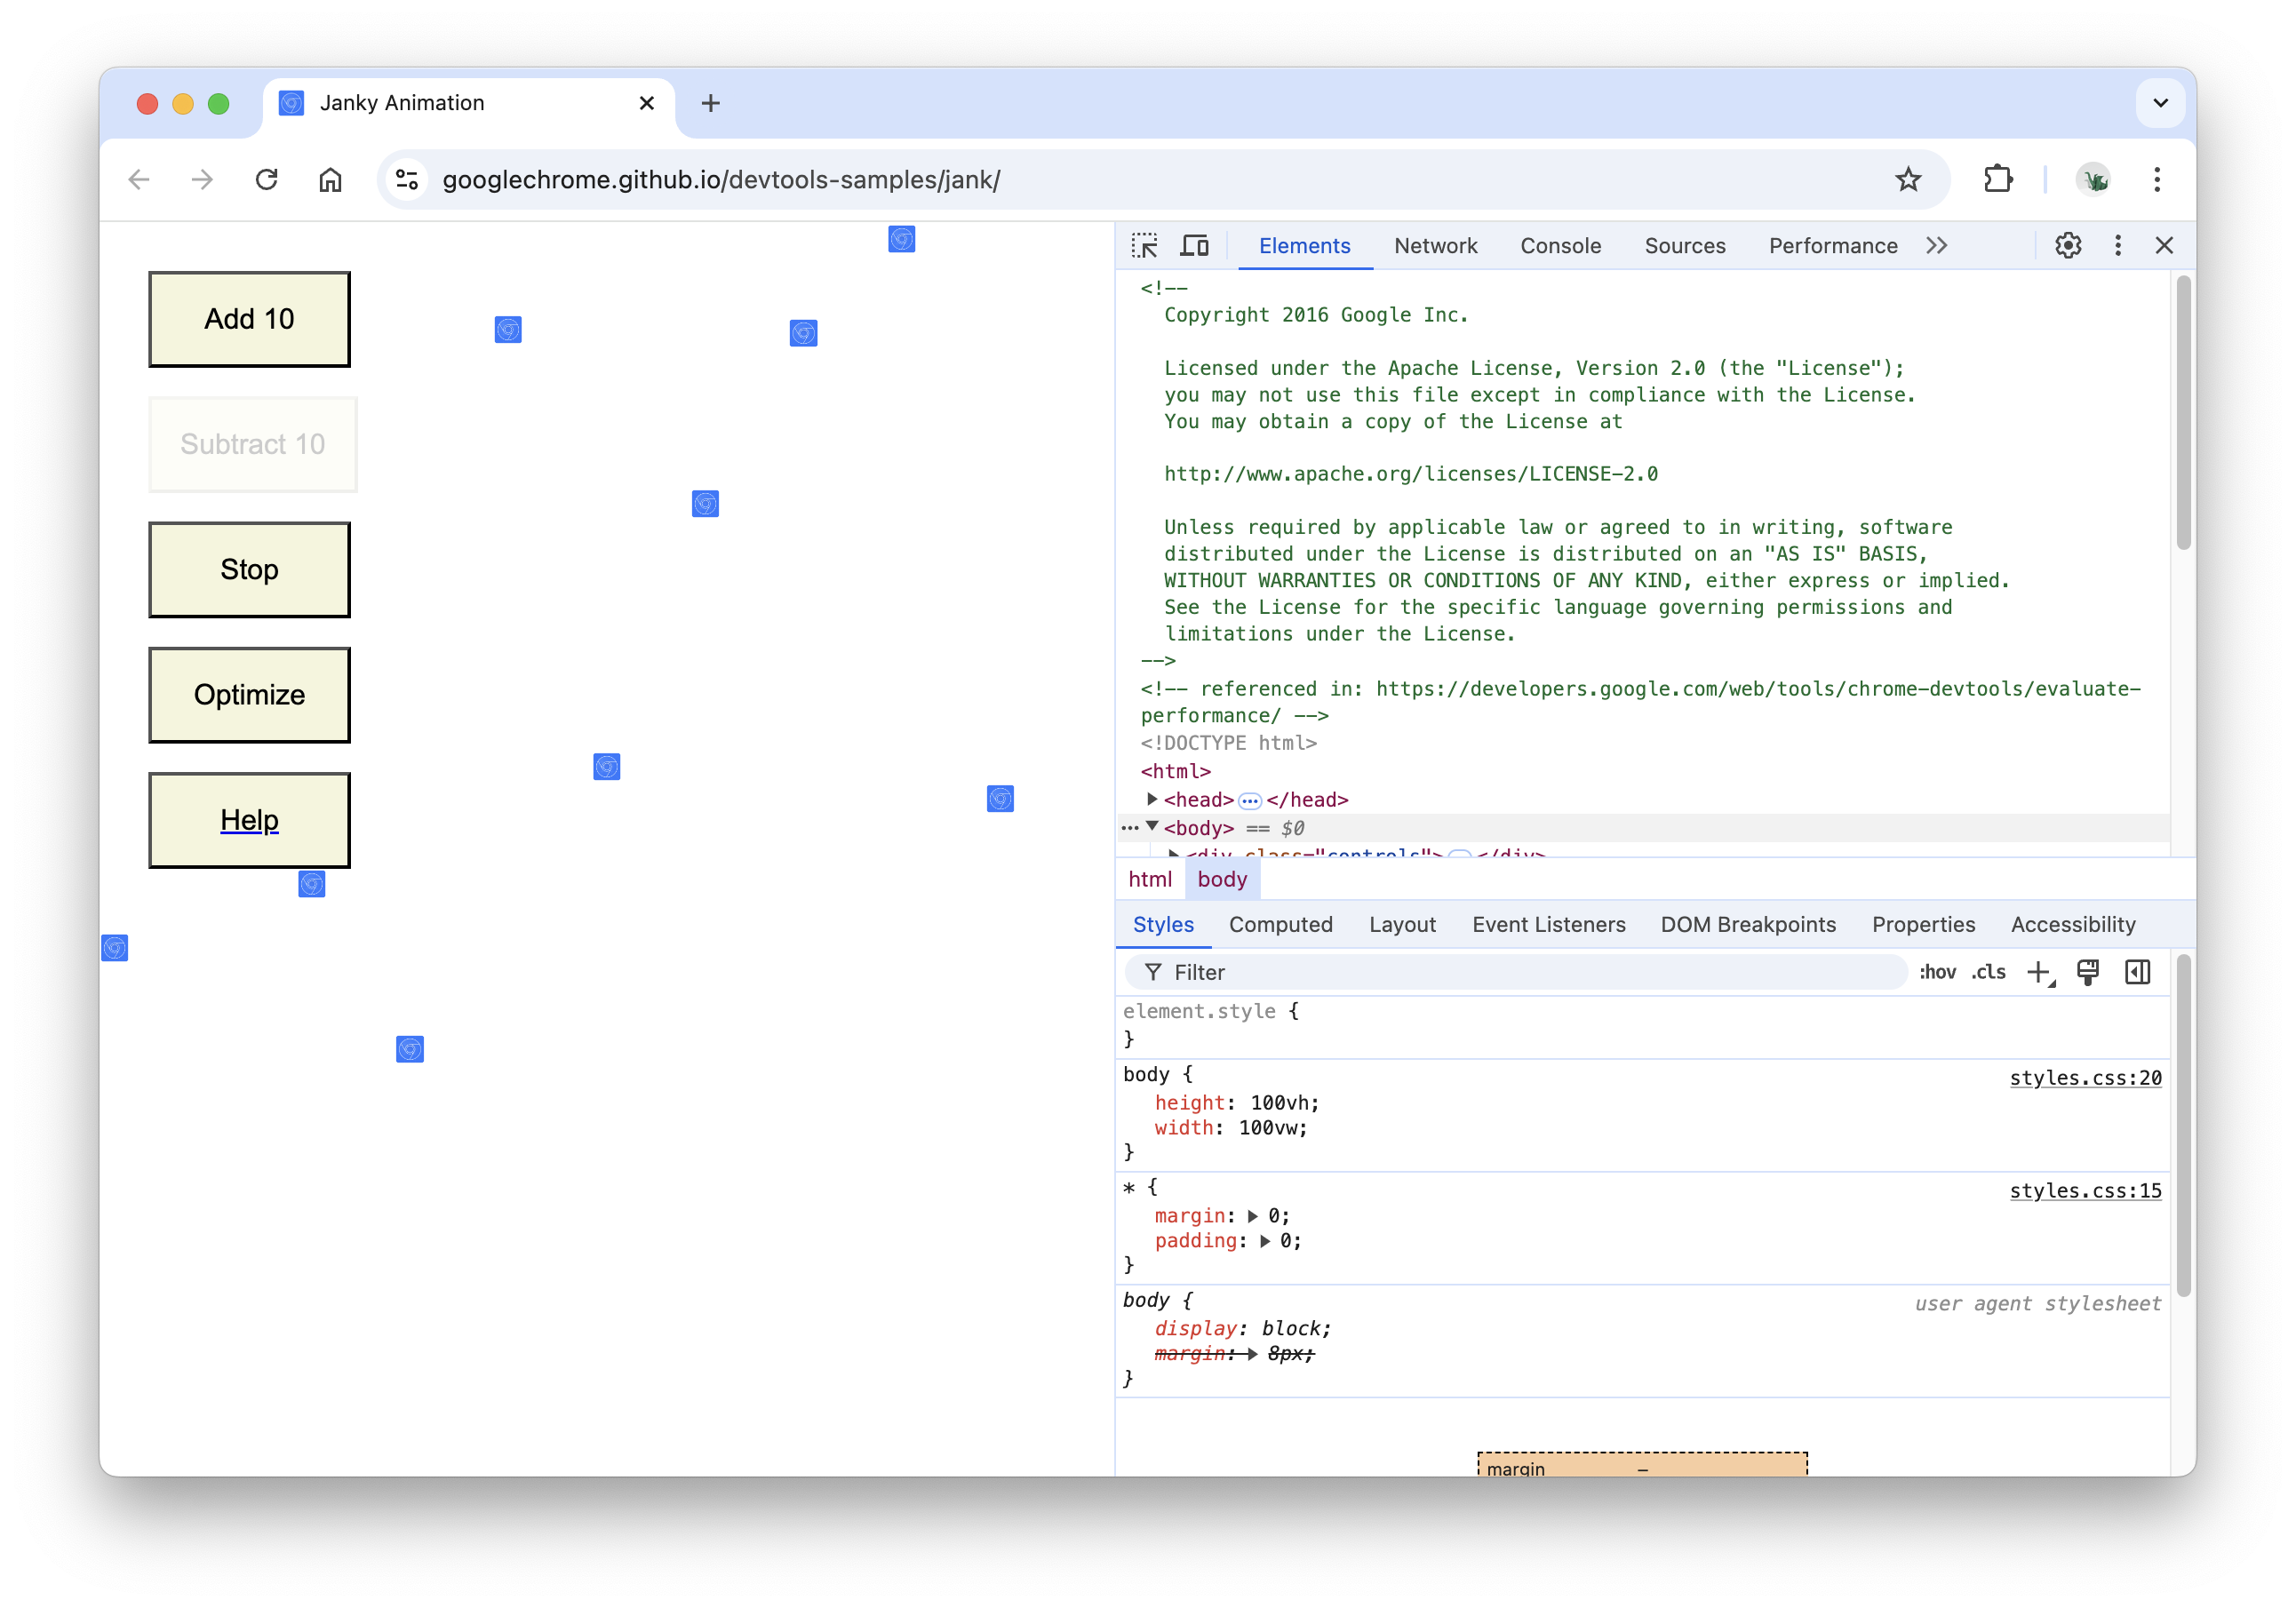
Load the following page in your Incognito window. This is the demo that you're going to profile. The page shows a bunch of little blue squares moving up and down.
https://googlechrome.github.io/devtools-samples/jank/Press Command+Option+I (Mac) or Control+Shift+I (Windows, Linux) to open DevTools.
Simulate a mobile CPU
Mobile devices have much less CPU power than desktops and laptops. Whenever you profile a page, use CPU Throttling to simulate how your page performs on mobile devices.
- In DevTools, click the Performance tab.
- Make sure that the Screenshots checkbox is enabled.
- Click Capture Settings . DevTools reveals settings related to how it captures performance metrics.
For CPU, select 4x slowdown. DevTools throttles your CPU so that it's 4 times slower than usual.

Set up the demo
It's hard to create a runtime performance demo that works consistently for all readers of this website. This section lets you customize the demo to ensure that your experience is relatively consistent with the screenshots and descriptions you see in this tutorial, regardless of your particular setup.
- Keep clicking Add 10 until the blue squares move noticeably slower than before. On a high-end machine, it may take about 20 clicks.
Click Optimize. The blue squares should move faster and more smoothly.
Click Un-Optimize. The blue squares move slower and with more jank again.
Record runtime performance
When you ran the optimized version of the page, the blue squares move faster. Why is that? Both versions are supposed to move each square the same amount of space in the same amount of time. Take a recording in the Performance panel to learn how to detect the performance bottleneck in the un-optimized version.
In DevTools, click Record . DevTools captures performance metrics as the page runs.
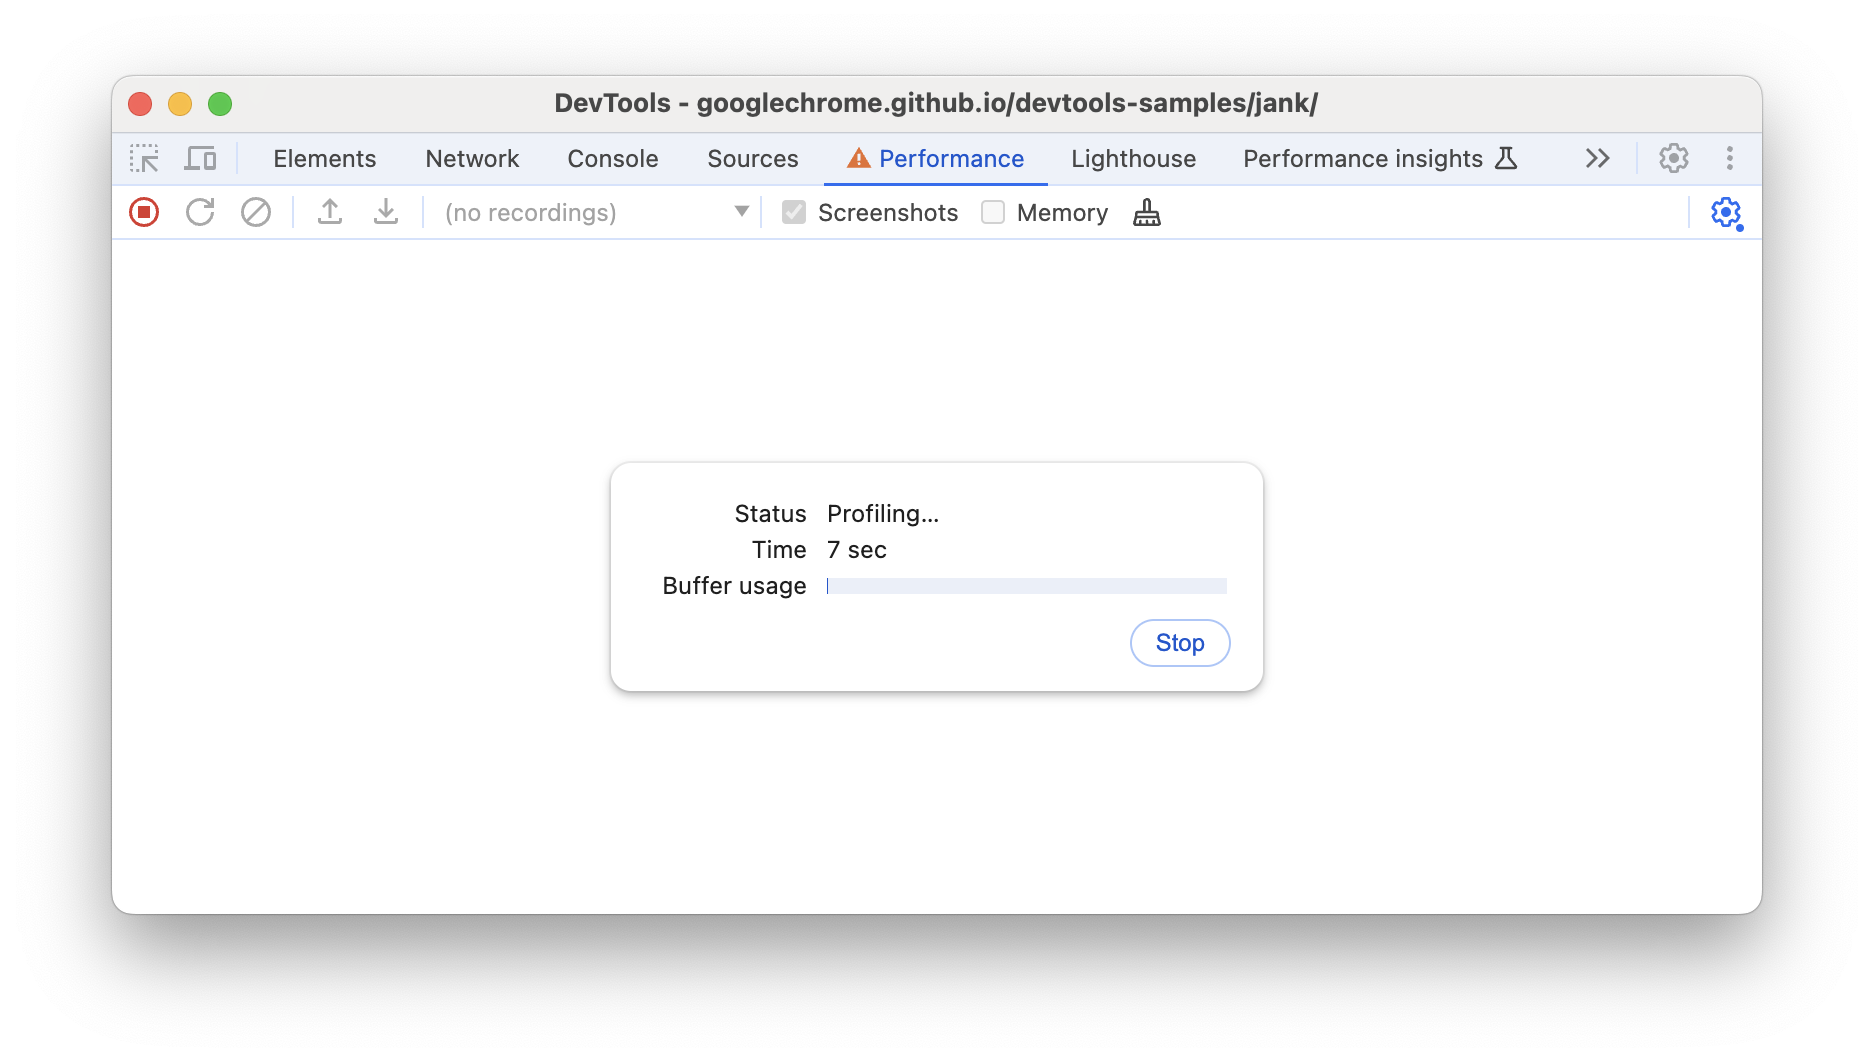
Wait a few seconds.
Click Stop. DevTools stops recording, processes the data, then displays the results in the Performance panel.

Wow, that's an overwhelming amount of data. Don't worry, it'll make more sense shortly.
Analyze the results
Once you have a performance recording, you can analyze just how poor the page's performance is, and find the cause(s).
Analyze frames per second
The main metric for measuring the performance of any animation is frames per second (FPS). Users are happy when animations run at 60 FPS.
Look at the FPS chart. Whenever you see a red bar above FPS, it means that the framerate dropped so low that it's probably harming the user experience.
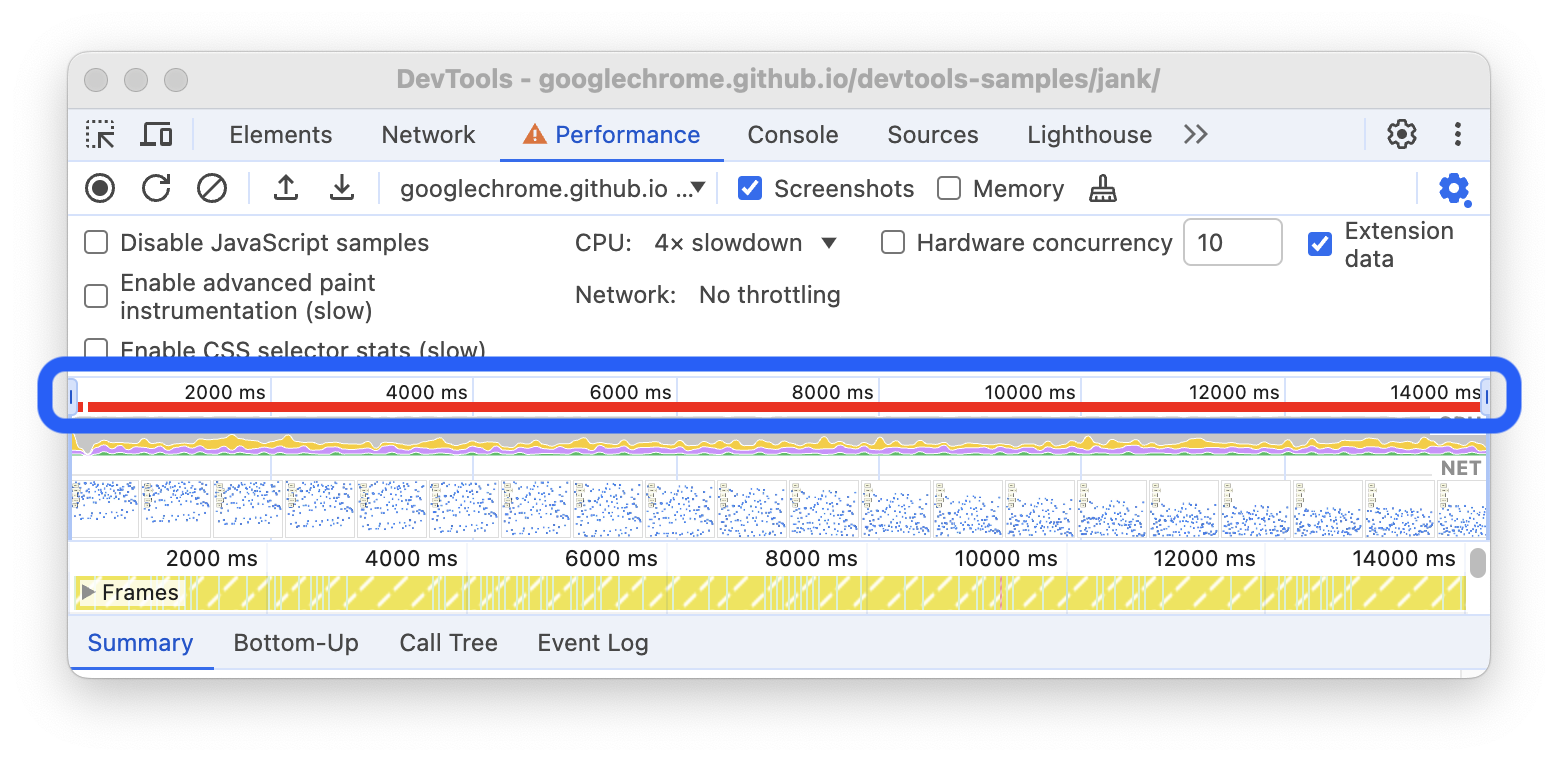
Below the FPS chart you see the CPU chart. The colors in the CPU chart correspond to the colors in the Summary tab, at the bottom of the Performance panel. The fact that the CPU chart is full of color means that the CPU was maxed out during the recording. Whenever you see the CPU maxed out for long periods, it's a cue to find ways to do less work.
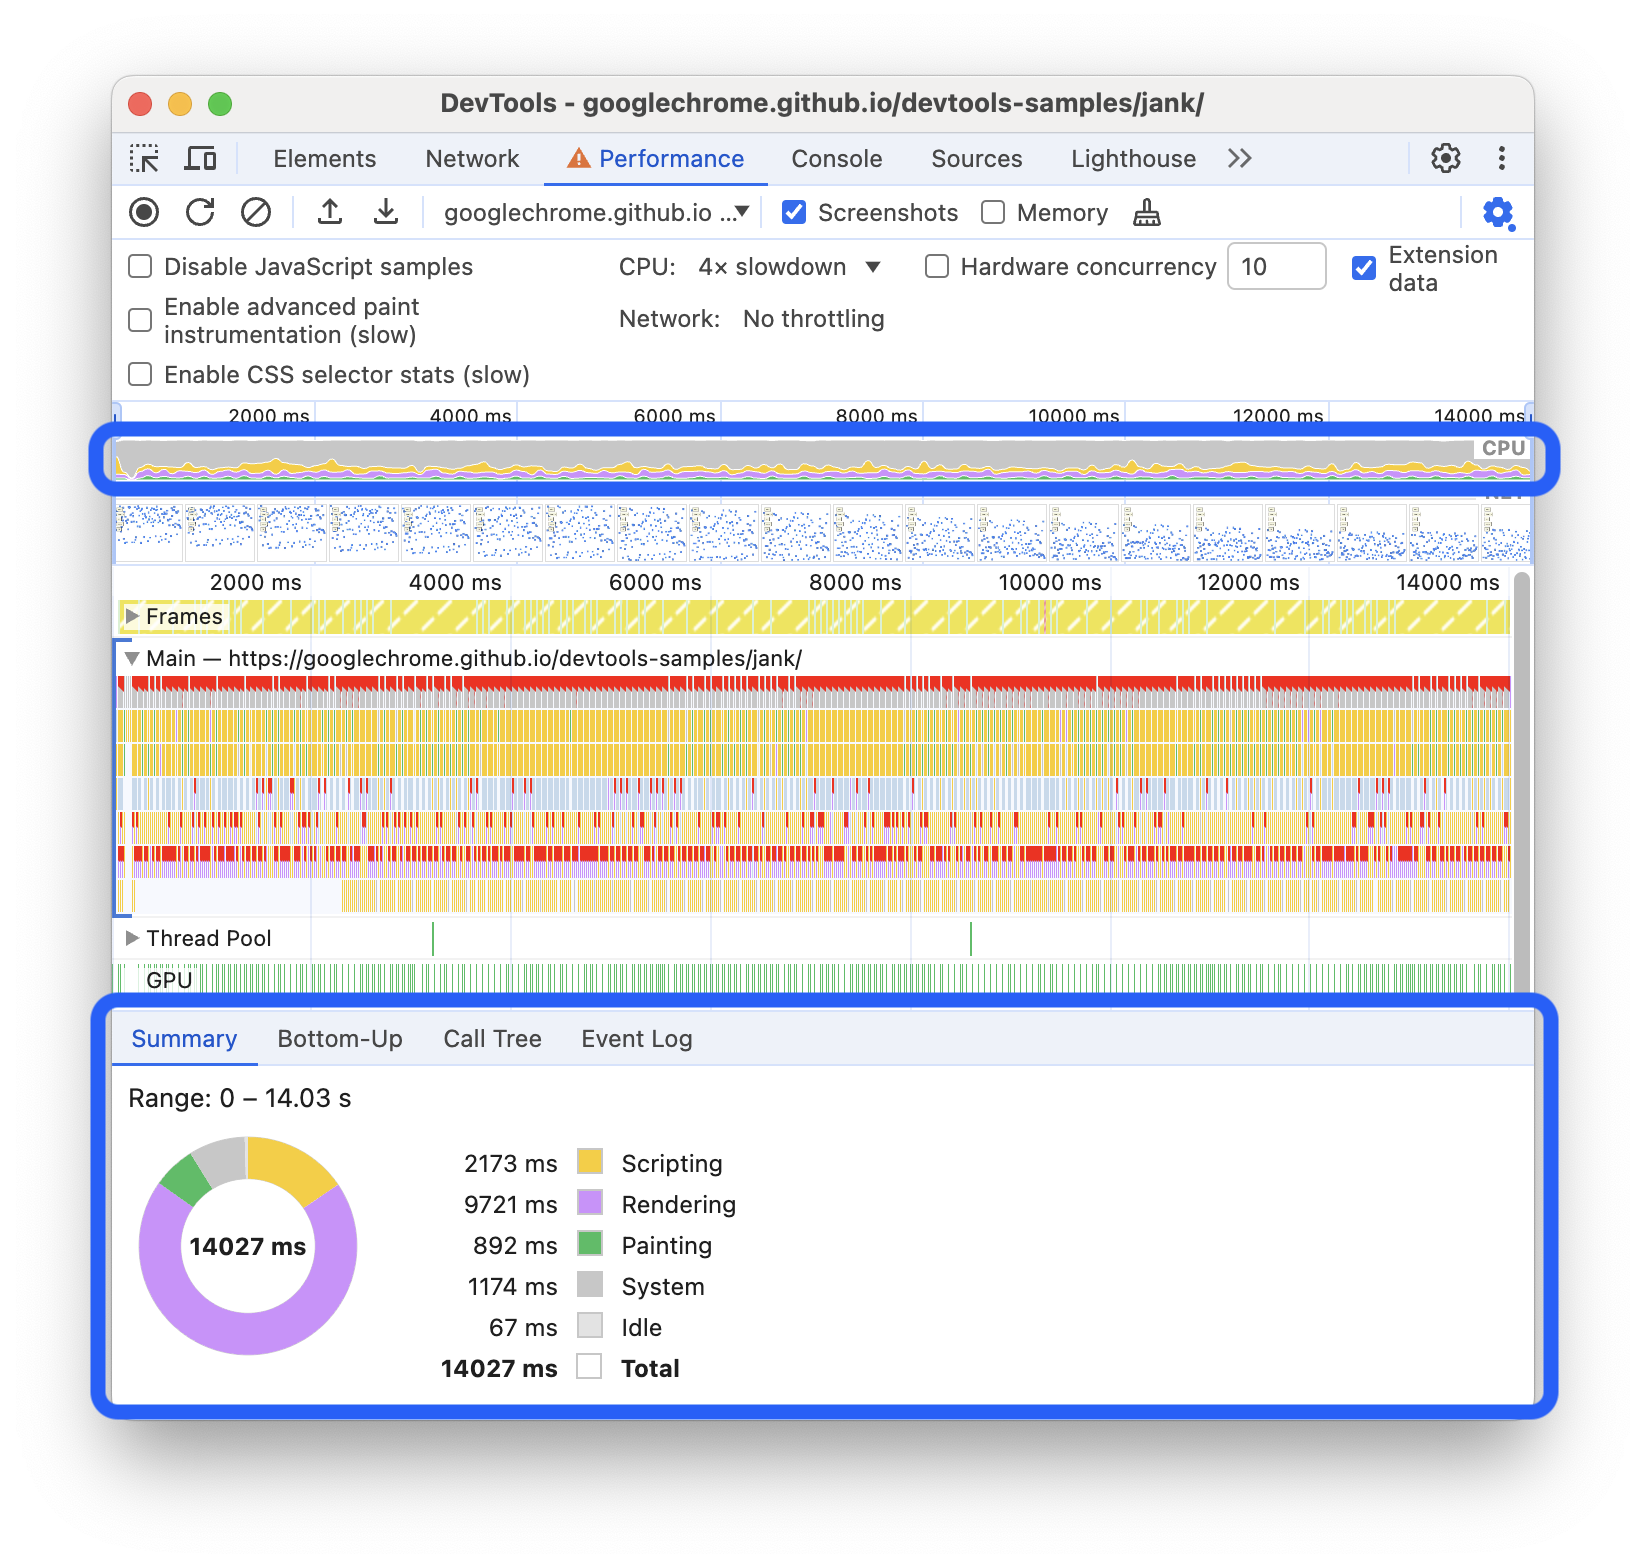
Hover your mouse over the FPS, CPU, or NET charts. DevTools shows a screenshot of the page at that point in time. Move your mouse left and right to replay the recording. This is called scrubbing, and it's useful for manually analyzing the progression of animations.
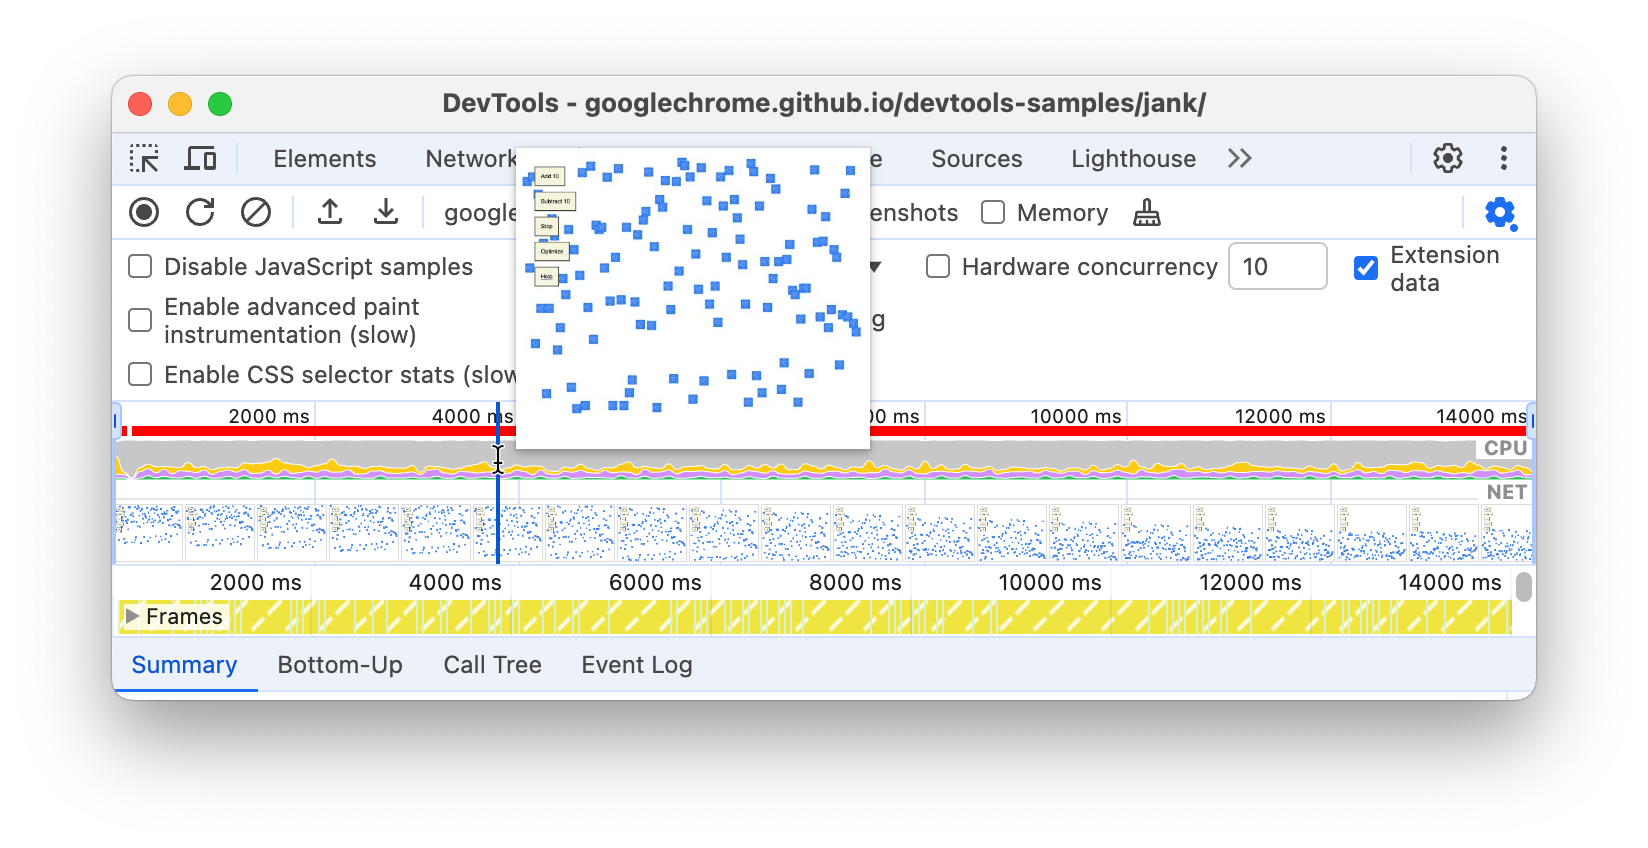
In the Frames section, hover your mouse over one of the green squares. DevTools shows you the FPS for that particular frame. Each frame is probably well below the target of 60 FPS.

Of course, with this demo, it's pretty obvious that the page is not performing well. But in real scenarios, it may not be so clear, so having all of these tools to make measurements comes in handy.
Bonus: Open the FPS meter
Another handy tool is the FPS meter, which provides real-time estimates for FPS as the page runs.
- Press Command+Shift+P (Mac) or Control+Shift+P (Windows, Linux) to open the Command Menu.
- Start typing
Renderingin the Command Menu and select Show Rendering. In the Rendering panel, enable Show Rendering stats. A new overlay appears in the top-right of your viewport.

Disable the FPS Meter and press Escape to close the Rendering panel. You won't be using it in this tutorial.
Find the bottleneck
Now that you've measured and verified that the animation is not performing well, the next question to answer is: why?
Note the Summary tab. When no events are selected, this tab shows you a breakdown of activity. The page spent most of its time rendering. Since performance is the art of doing less work, your goal is to reduce the amount of time spent doing rendering work.

Expand the Main section. DevTools shows you a flame chart of activity on the main thread, over time. The x-axis represents the recording, over time. Each bar represents an event. A wider bar means that event took longer. The y-axis represents the call stack. When you see events stacked on top of each other, it means the upper events caused the lower events.
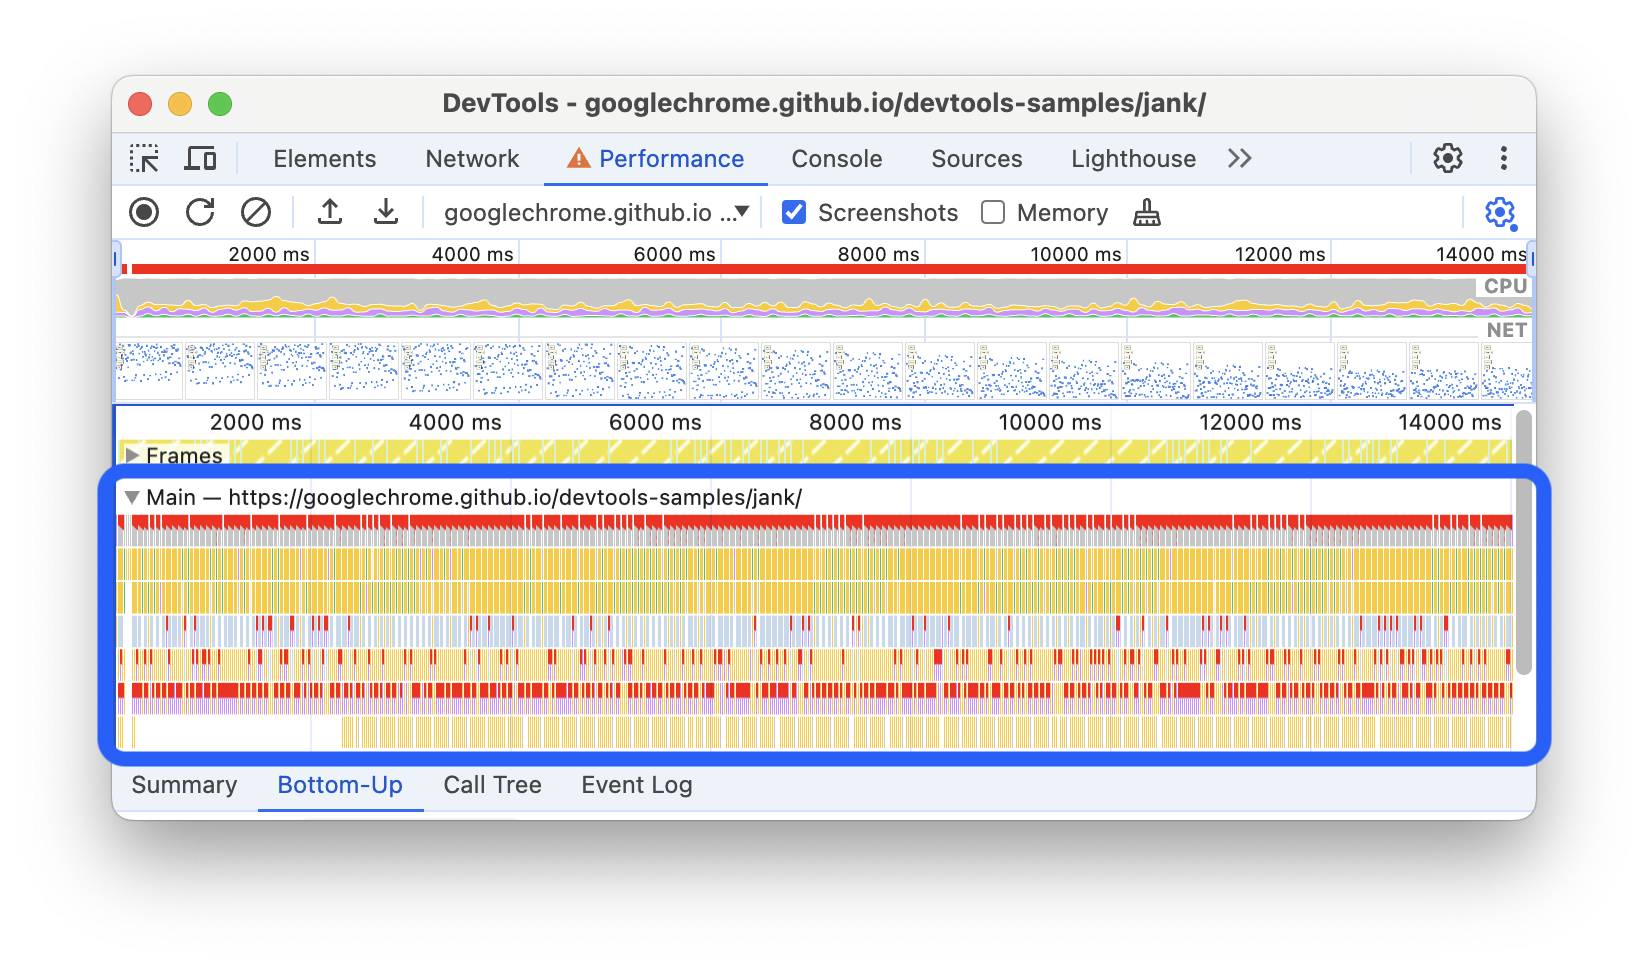
There's a lot of data in the recording. Zoom in on a single Animation Frame Fired event by clicking, holding, and dragging your mouse over the Overview, which is the section that includes the FPS, CPU, and NET charts. The Main section and Summary tab only display information for the selected portion of the recording.
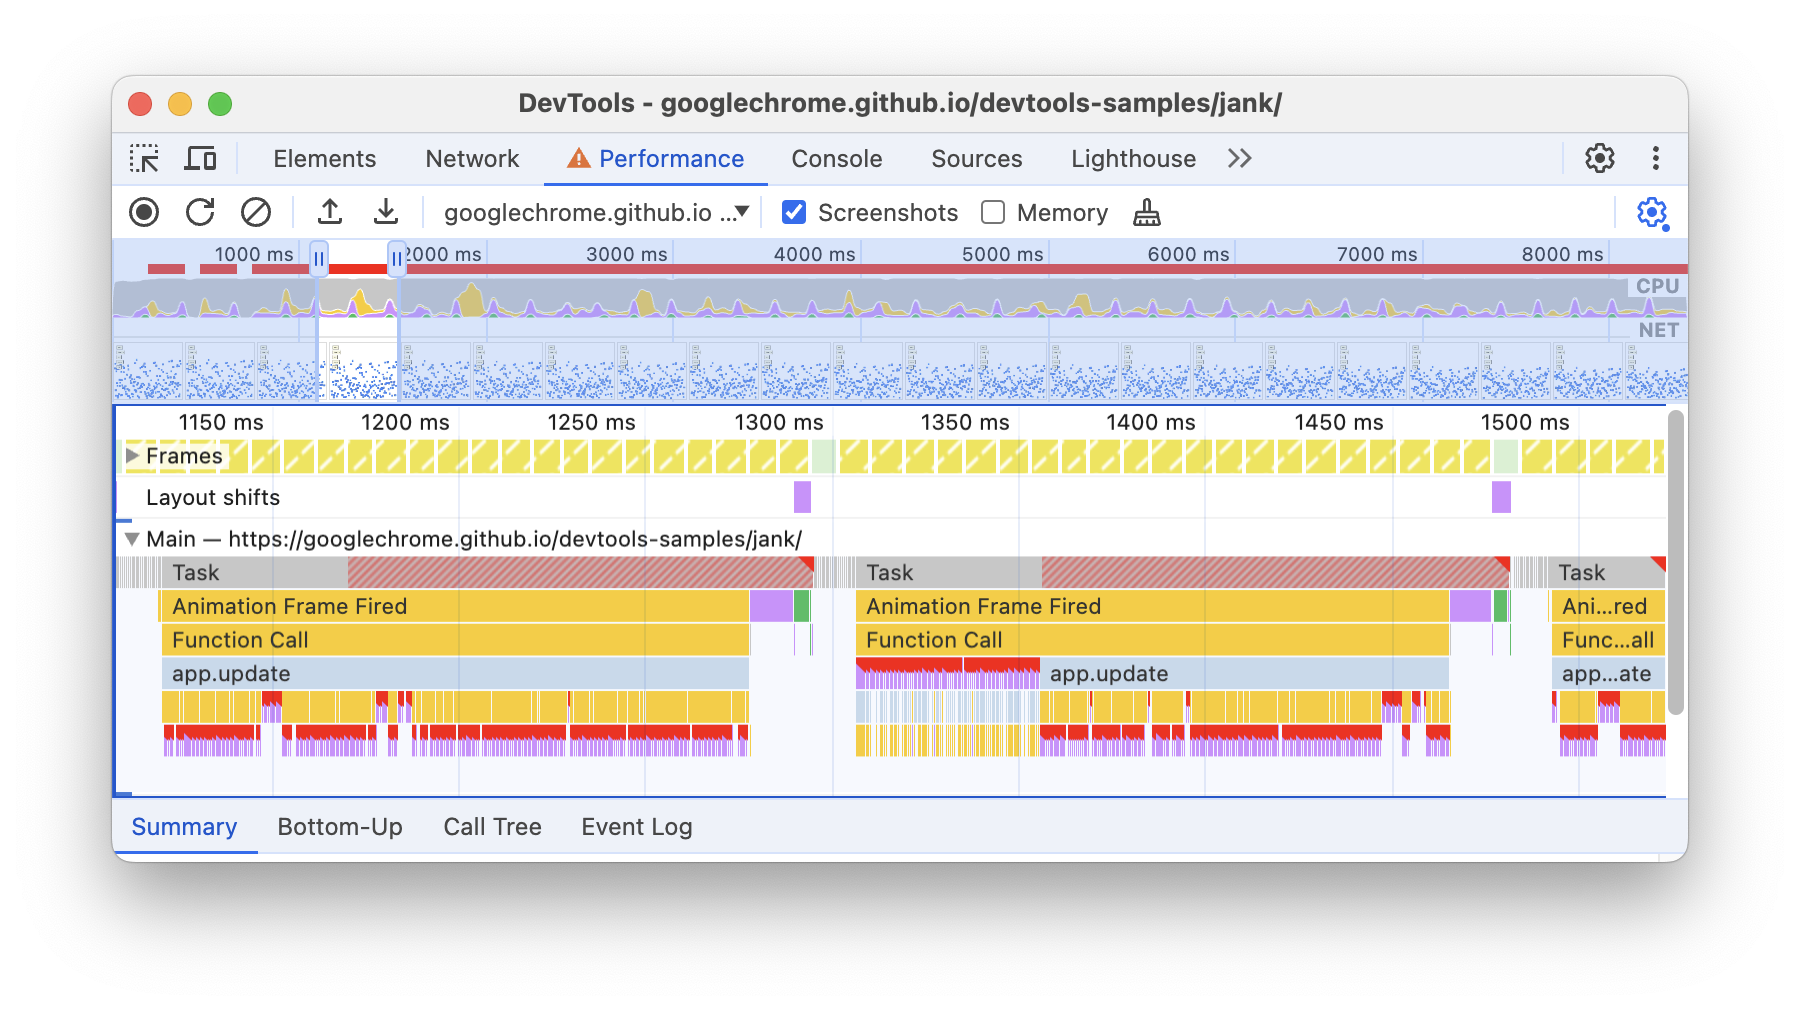
Note the red triangle in the top-right of the Task and layout events. Whenever you see a red triangle, it's a warning that there may be an issue related to this event. A red triangle on a Task means that it was a long task.
Click the Animation Frame Fired event. The Summary tab now shows you information about that event. Clicking the link next to Initiated by causes DevTools to highlight the event that initiated the Animation Frame Fired event. Also note the app.update @ link. Clicking that jumps you to the relevant line in the source code.
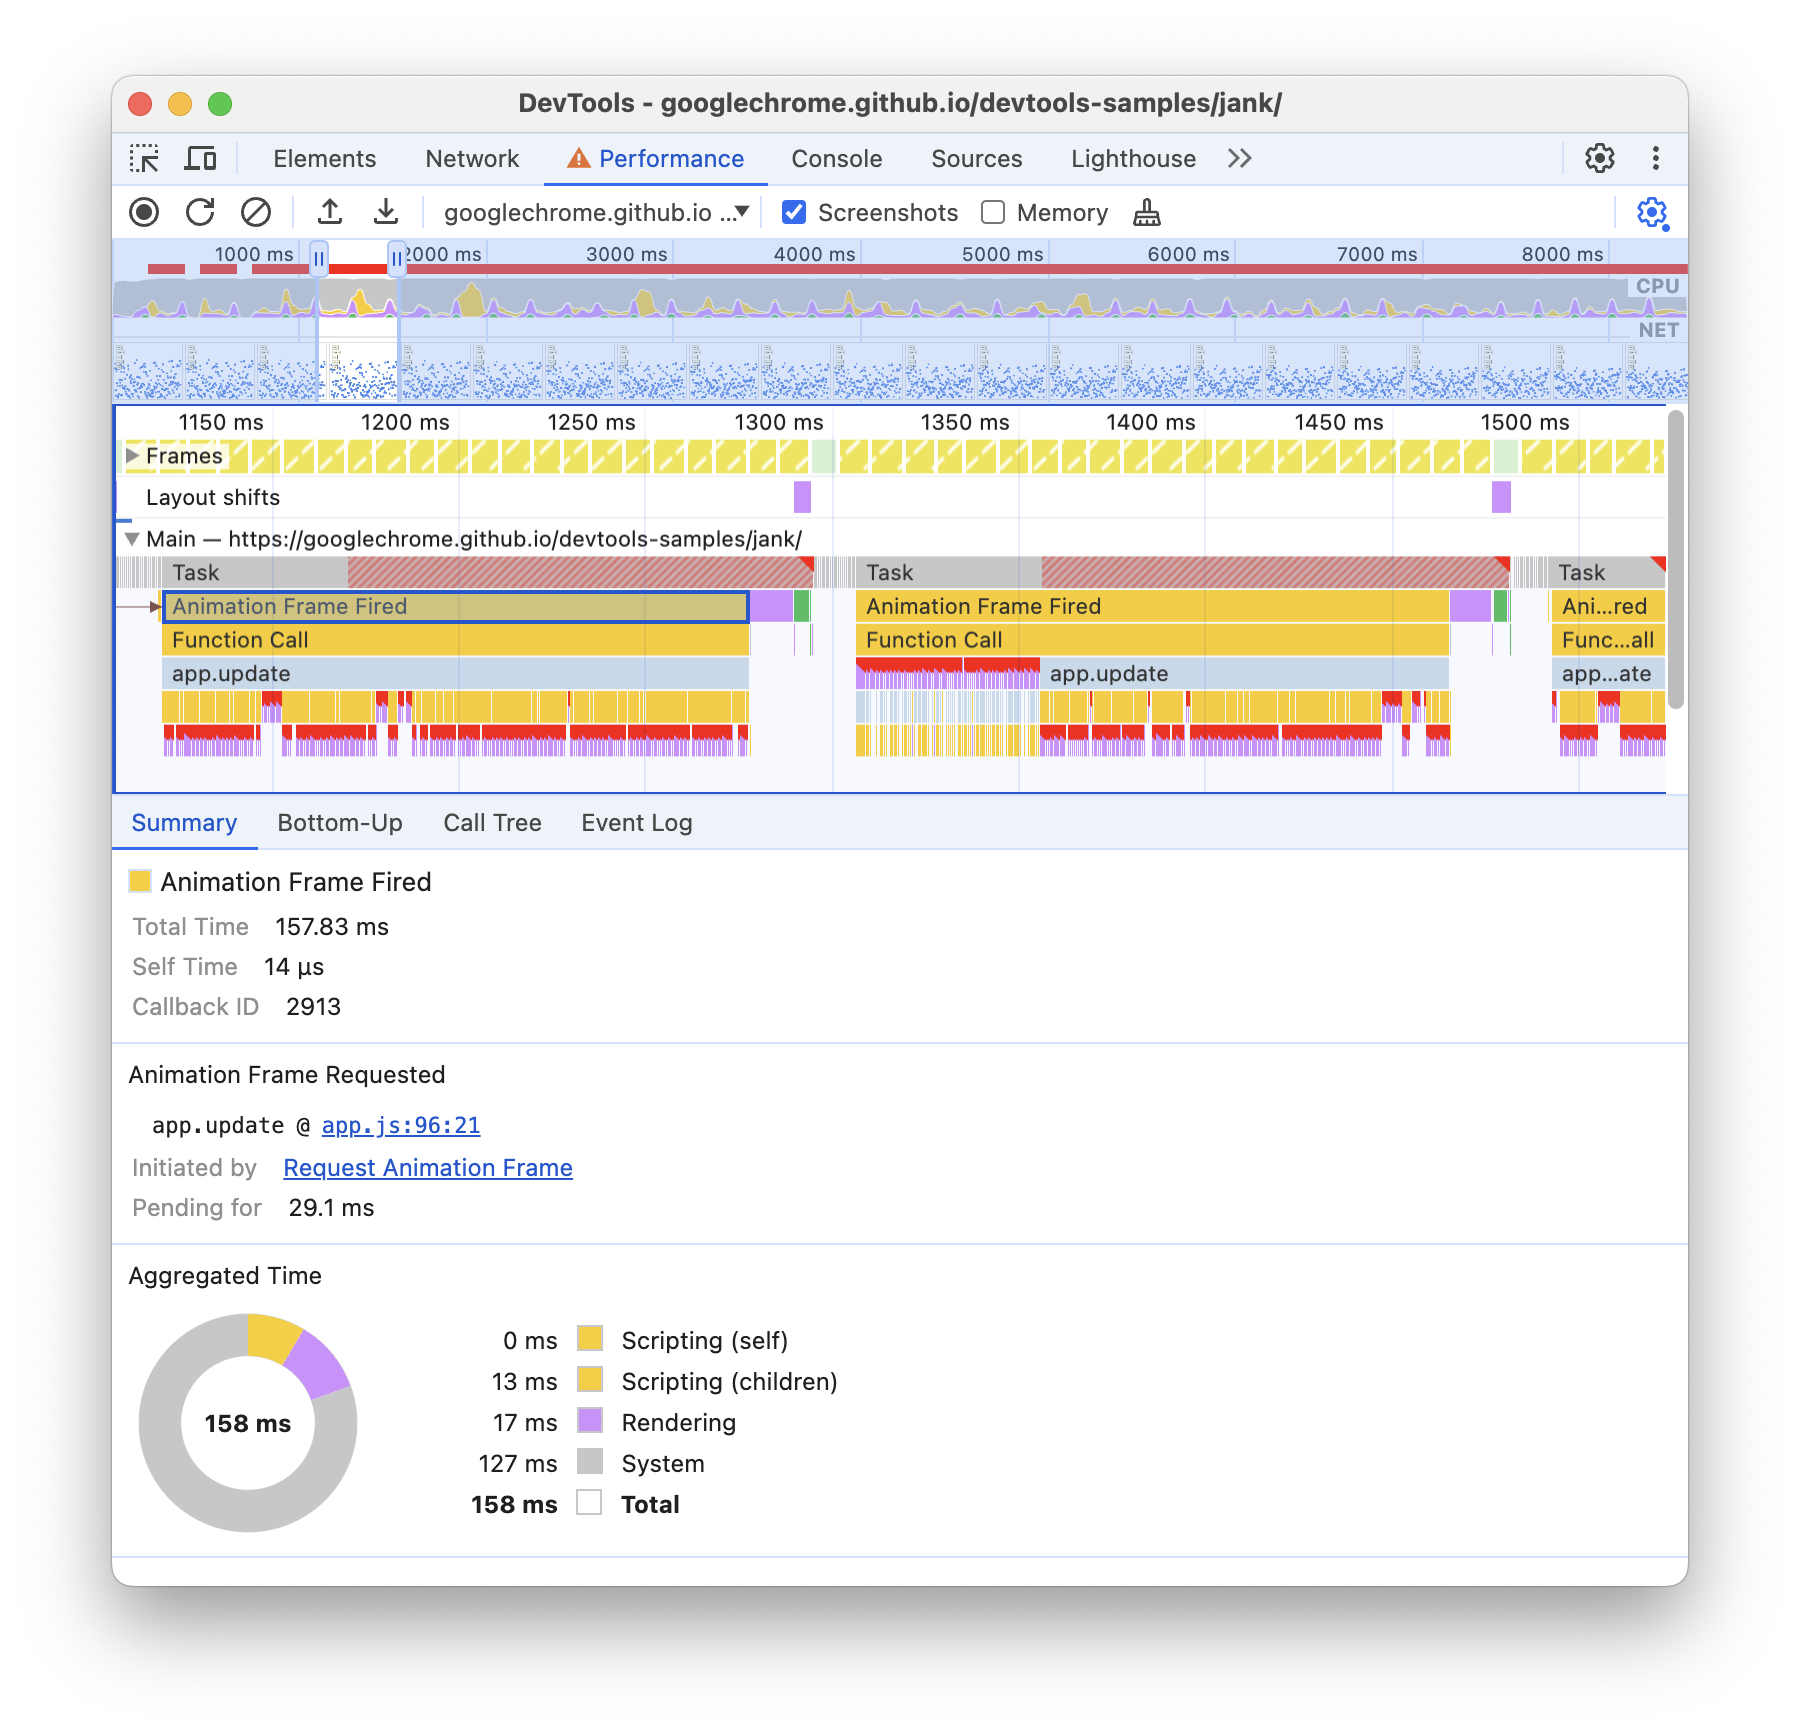
Under the app.update event, there's a bunch of purple events. If they were wider, it looks as though each one might have a red triangle on it. Click one of the purple Layout events now. DevTools provides more information about the event in the Summary tab. Indeed, there's a warning about forced reflows (another word for layout).
In the Summary tab, click the link next to app.update @ under First Layout Invalidation. DevTools takes you to the line of code that forced the layout.
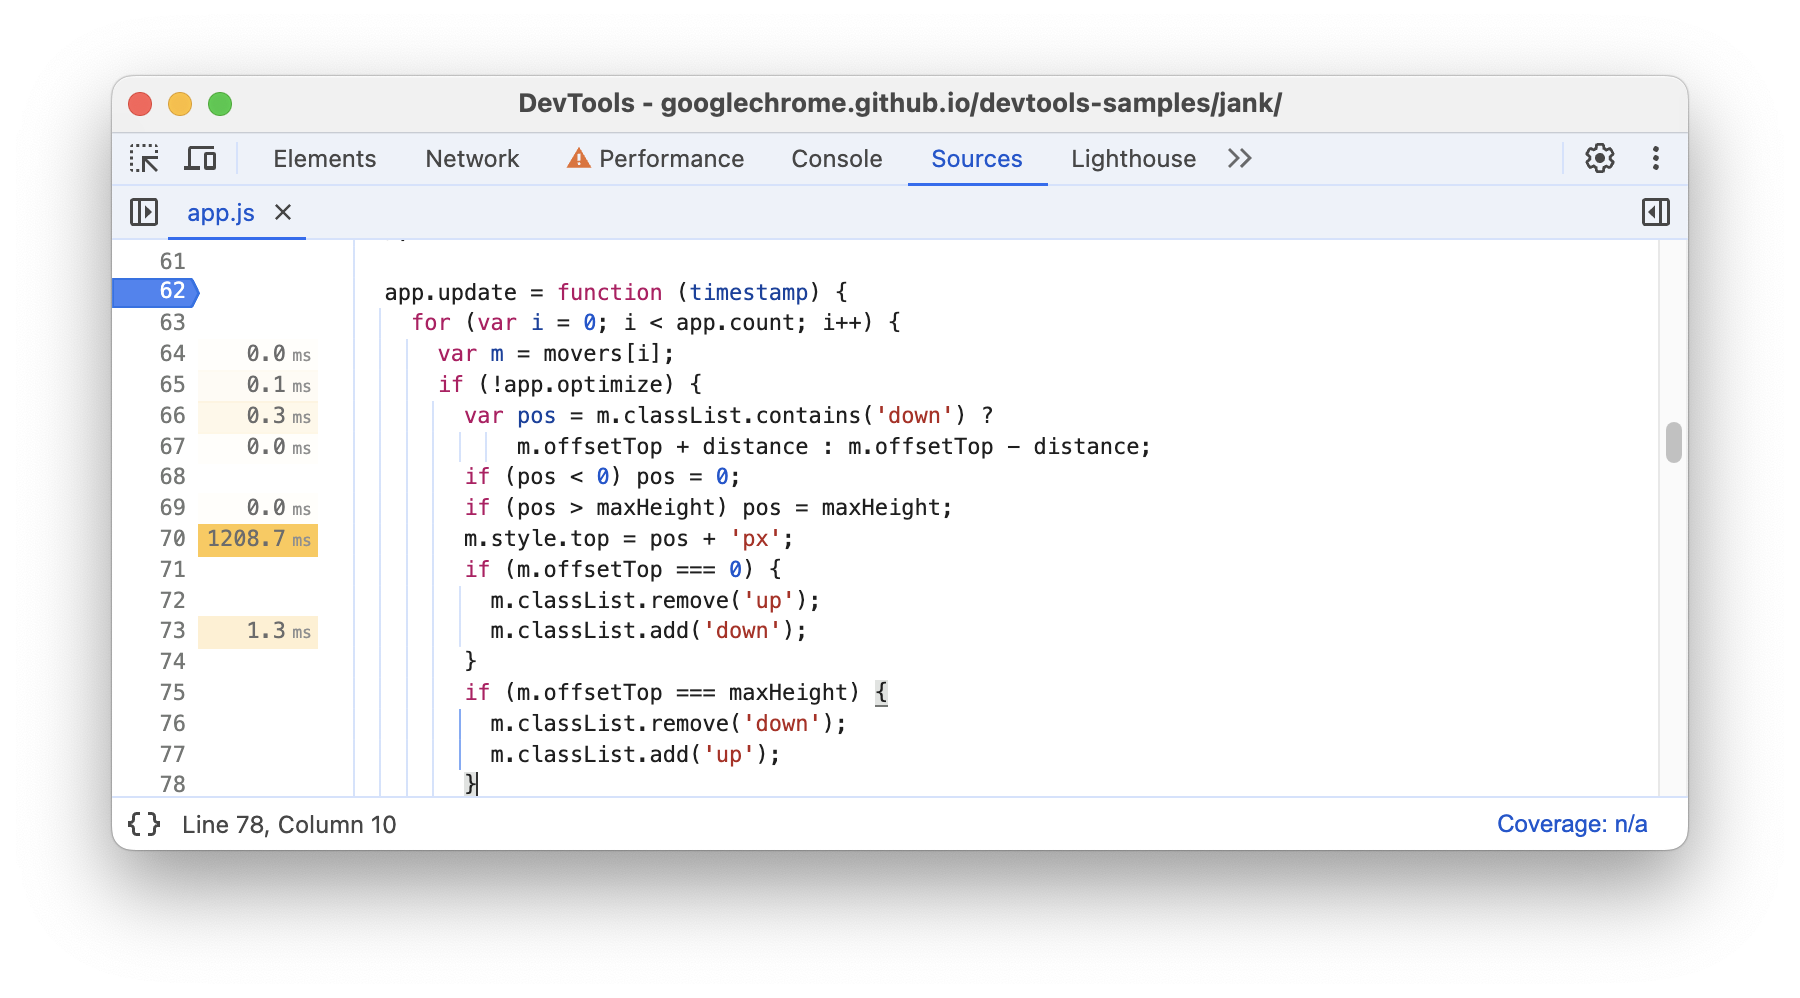
Phew! That was a lot to take in, but you now have a solid foundation in the basic workflow for analyzing runtime performance. Good job.
Bonus: Analyze the optimized version
Using the workflows and tools that you just learned, click Optimize on the demo to enable the optimized code, take another performance recording, and then analyze the results. From the improved framerate to the reduction in events in the Main section's flame chart, you can see that the optimized version of the app does much less work, resulting in better performance.
Next steps
The foundation for understanding performance is the RAIL model. This model teaches you the performance metrics that are most important to your users. See Measure Performance With The RAIL Model to learn more.
To get more comfortable with the Performance panel, practice makes perfect. Try profiling your own
pages and analyzing the results. If you have any questions about your results, open a Stack
Overflow question tagged with google-chrome-devtools. Include screenshots or links to
reproducible pages, if possible.
To become an expert in runtime performance, you've got to learn how the browser translates HTML, CSS, and JS into pixels on a screen. The best place to start is the Rendering Performance Overview. The Anatomy Of A Frame dives into even more detail.
Last, there are many ways to improve runtime performance. This tutorial focused on one particular animation bottleneck to give you a focused tour through the Performance panel, but it's only one of many bottlenecks you may encounter. The rest of the Rendering Performance series has a lot of good tips for improving various aspects of runtime performance, such as:
