Debugging uLisp
Printing objects
When writing your own extensions to uLisp it's useful to be able to print out Lisp objects at different points in the code. For example, to print the Lisp object arg to the serial output you can add a statement such as:
printobject(arg, pserial);
Debugging the effect of garbage collections
Unpredictable corruptions are often the result of garbage collection having an effect on temporary Lisp structures. For example, if your extension to uLisp is constructing a list, it's important to make sure that it doesn't get garbage collected while it is being constructed.
To debug this situation, turn off the call to gc() in repl(), by commenting out the line:
gc(NULL, env);
Also, turn on the printing of garbage collections, by uncommenting:
#define printgcs
Now, if the corruption only occurs after a garbage collection it's probably due to an unprotected temporary structure.
The solution is to push a pointer to the temporary structure onto GCStack so that it will be marked during garbage collection. For an example, see the definition of loadfromlibrary():
void loadfromlibrary (object *env) {
  GlobalStringIndex = 0;
  object *line = read(glibrary);
  while (line != NULL) {
    push(line, GCStack);
    eval(line, env);
    pop(GCStack);
    line = read(glibrary);
  }
}
Dumping the uLisp workspace
When debugging uLisp it's often useful to be able to dump the uLisp workspace, so you can trace the pointers and check that objects are being represented correctly. In case it's useful to anyone interested in extending uLisp, here's the procedure I use.
First add the function dumpimage() to the source:
void dumpimage() {
  int imagesize = WORKSPACESIZE;
  char tmp[16];
  Serial.println();
  sprintf(tmp, "Freelist: %04x, ", (int)Freelist);
  Serial.print(tmp);
  sprintf(tmp, "GlobalEnv: %04x, ", (int)GlobalEnv);
  Serial.print(tmp);
  sprintf(tmp, "GCStack: %04x, ", (int)GCStack);
  Serial.print(tmp);

  for (int i=0; i<imagesize; i++) {
    if (i%8 == 0) {
      Serial.println();
      sprintf(tmp, "%04x: ", (int)&Workspace[i]);
      Serial.print(tmp);
    }
    sprintf(tmp, "%04x.%04x ",
      (unsigned int)car(&Workspace[i]) , (unsigned int)cdr(&Workspace[i]));
    Serial.print(tmp);
  }
  Serial.println();
}
This will print the contents of the workspace in hexadecimal in the Serial Monitor, 8 objects per line.
Then reduce the size of the workspace to a suitable multiple of 8 by changing the definition of workspacesize; for example:
const int Workspacesize = 32;
Then insert a call to dumpimage() at an appropriate place in the code; for example, near the end of the for(;;) loop in repl().
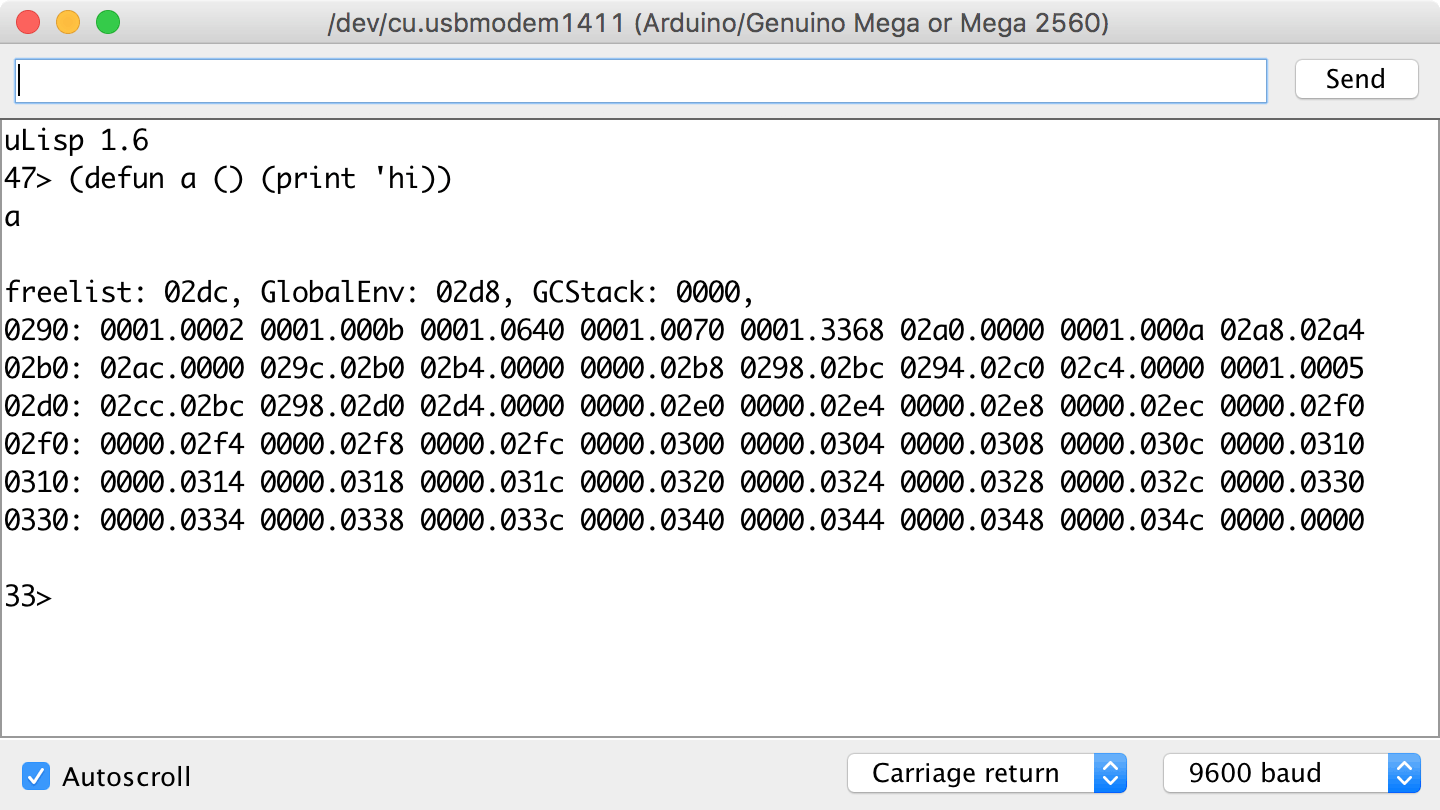
After evaluating an object you can then examine the dump to see the effect on the workspace. For example, entering:
(defun a () (print 'hi))
will produce:

The number at the left of each row is the address of the first object in that row; this is followed by eight objects, in hexadecimal.
The following diagram highlights some of the key features of this dump:

- Green: The freelist linked-list of free cells.
- Red: The symbol 'a.
- Yellow: The symbol 'hi.
- Blue: The symbol 'lambda.
Starting from GlobalEnv, 02d8, you should be able to trace the list structure of:
(a . (lambda () (print 'hi))
