AMSR-2 Air-Sea Essential Climate Variables (AS-ECV)
|
In previous versions, water vapor was missing in heavy rain.
With Version 8.2, water vapor is now included in heavy rain, yielding values up to 120 mm.
AMSR-2 (10 meters above) Ocean Surface Wind Speeds
| ||||||||||||||||||||||||||||||||
Wind LF uses channels resampled to match the 10.65 GHz footprint (Low Frequency).
Wind MF uses channels resampled to match the 18.70 GHz footprint (Medium Frequency).
Wind AW is a blend of wind LF in no rain, and a statisical algorithm developed to retrieve wind through rain.
Wind AW is rich with information about wind speeds in and around storms, including tropical cyclones.
However, Wind AW should not be used for climate studies such as trend analysis.
AMSR Instrument Series
The Advanced Microwave Scanning Radiometer (AMSR) has operated on three satellites:
- AMSR-2 on JAXA's GCOM-W1 spacecraft, launched May 18, 2012...currently operating.
- AMSR-E on NASA's EOS Aqua spacecraft, launched May 4, 2002...stopped rotating Oct 4, 2011.
- AMSR-J on JAXA's ADEOS-II spacecraft, launched Dec 14, 2002...solar panels stopped Oct 25, 2003.
AMSR-J is more formally named 'AMSR'. We AMSR-J for clarity.
A key feature of AMSR instruments is the ability to see through clouds, providing a largely uninterrupted view of ocean measurements. There are differences between the three instruments as outlined in the table below.
| AMSR-2 | AMSR-E | AMSR-J | |
| Satellite Platform | GCOM-W1 | AQUA | ADEOS-II |
| Altitude | 700 km | 705 km | 802.9 km |
| Equator Crossing Time (Local time zone) |
1:30 PM Ascending 1:30 AM Descending |
1:30 PM Ascending 1:30 AM Descending |
10:30 PM Ascending 10:30 AM Descending |
| Antenna Size | 2 m | 1.6 m | 2 m |
| Swath Width | 1450 km | 1450 km | 1600 km |
Instrument Description
The AMSR instruments are dual-polarized, conical scanning, passive microwave radiometers. Each is placed in a near-polar orbit which allows for up to twice daily sampling of a given Earth location. The channels are summarized in the following tables.
AMSR-2 on GCOM-W1
| Band [GHz] | Polarization |
Spatial Resolution |
| 6.93 | V,H | 62 x 35 |
| 7.3 | V,H | 62 x 35 |
| 10.65 | V,H | 42 x 24 |
| 18.7 | V,H | 22 x 14 |
| 23.8 | V,H | 26 x 15 |
| 36.5 | V,H | 12 x 7 |
| 89.0 | V,H | 5 x 3 |
AMSR-E on Aqua
| Band [GHz] | Polarization |
Spatial Resolution |
| 6.93 | V,H | 75 x 43 |
| 10.65 | V,H | 51 x 29 |
| 18.7 | V,H | 27 x 16 |
| 23.8 | V | 32 x 18 |
| 36.5 | V,H | 14 x 8 |
| 89.0 | V,H | 6 x 4 |
AMSR on ADEOS-II
|
Band [GHz] |
Polarization |
Spatial Resolution |
| 6.93 | V,H | 70 x 40 |
| 10.65 | V,H | 46 x 27 |
| 18.7 | V,H | 25 x 14 |
| 23.8 | V,H | 29 x 17 |
| 36.5 | V,H | 14 x 8 |
| 50.3 | V | 10 x 6 |
| 52.8 | V | 10 x 6 |
| 89.0 | V,H | 6 x 3 |
RSS AMSR Data Products
We produce Daily binary data files and Time-Averaged (3-day, weekly and monthly) data files for all instruments. The daily files consist of ocean measurements mapped to a regular grid complete with data gaps between orbits. Two maps exist for each parameter, one of ascending orbit segments (local daytime passes) and the other of descending orbit segments (local nighttime passes). Data on each of the segment maps are overwritten at both the high latitudes where successive orbits cross and at the "seam" or region where the last orbit of the day overlaps the first orbit of the day. Daily data files contain time maps consisting of the UTC observation time for each set of passes (ascending and descending). Time-Averaged data files do not contain any time information.
Gridded data are organized according to observation date. All dates and times are Coordinated Universal Time (UTC), also known as Greenwich Mean Time (GMT), Zulu Time (Z), Universal Time (UT), and World Time. Data products include daily and time averaged geophysical data as follows:
| Daily | orbital data mapped to 0.25 degree grid divided into 2 maps based on ascending and descending passes early data may be overwritten by later data at high latitudes and daily "seam" |
| 3-Day | average of 3 days ending on and including file date |
| Weekly | average of 7 days ending on and including the Saturday file date |
| Monthly | average of all data within the calendar month |
RSS AMSR-E Data Products
Each AMSR-E binary data file available from our ftp site consists of fourteen (daily) or six (averaged) 0.25 x 0.25 degree grid (1440,720) byte maps. For daily files, seven daytime, ascending maps in the following order, Time (UTC), Sea Surface Temperature (SST), 10 meter Surface Wind Speed (Wind_LF), 10 meter Surface Wind Speed (Wind_MF), Atmospheric Water Vapor (VAPOR), Cloud Liquid Water (CLOUD), and Rain Rate (RAIN), are followed by seven nighttime maps in the same order. Time-Averaged files contain just the geophysical layers in the same order [SST, Wind_LF, Wind_MF, VAPOR, CLOUD, RAIN].
| Acronym | Product Name |
Product Description |
Scale | Offset | Valid Data Range | Reason for No Data |
|---|---|---|---|---|---|---|
| TIME | Time |
Minutes since midnight GMT |
6.0 |
0. |
0 to 1440 |
no data |
| SST | Sea surface temperature | Temperature of top layer (skin) of water ~1 mm thick |
0.15 | -3.0 | -3 to 34.5 deg | high winds (<20 m/s), sun glint, rain, RFI, near sea ice or land (~75 km) |
| WSPD_LF | 10-m wind speed | Wind speed using channels: 10.7, 18.7, 23.8, and 36.5 GHz |
0.2 | 0. | 0. to 50.0 m/s | sun glint, rain, RFI, near sea ice or land (~50 km) |
| WSPD_MF | 10-m wind speed | Wind speed using channels: 18.7, 23.8, and 36.5 GHz |
0.2 | 0. | 0. to 50.0 m/s | sun glint, rain RFI, near sea ice or land (~50 km) |
| VAPOR | Columnar atmospheric water vapor | Total gaseous water contained in a vertical column of atmosphere |
0.3 | 0. |
0. to 75.0 mm |
heavy rain or near land (~25 km) |
| CLOUD* | Columnar cloud liquid water | Total cloud liquid water contained in a vertical column of atmosphere |
0.01 | -0.05 | -0.05 to 2.45 mm | near land (~25 km) |
| RAIN | Rain rate | Rate of liquid water precipitation | 0.1 | 0. | 0. to 25.0 mm/hr | near land (~25 km) |
* Note: The Version-5 AMSR-J data do not have the cloud offset shown in this table. For Version-5, the valid cloud range is 0 to 2.5 mm. These files also only contain 1 wind (LF) for a total of 6 instead of 7 data layers.
The data values between 0 and 250 need to be scaled to obtain meaningful geophysical data. To scale the data, multiply by the scale factors listed in the table above.
We produce two standard rain-free radiometer wind products: Wind_LF (low-frequency) and Wind_MF (medium frequency). Wind_MF is similar to SSM/I and SSMIS winds.
Each wind product has distinct advantages. The Wind_LF is less affected by the atmosphere and rain, but is affected by 10.65 GHz RFI and sun glitter effects. The Wind_MF has a higher effective spatial resolution, is less affected by ice and land contamination, and is only slightly affected by sun glitter effects and RFI. The Wind_MF are a little noisier than the Wind_LF.
The daily, 3-day and monthly maps are stored in appropriate year and month subdirectories. The weekly data files are stored in the /weeks directory.
The file names have the following naming conventions:
| Time | Directory Path | File Name |
| Daily | [year]/[month]/ | fs_yyyymmddvV.v.gz |
| 3-Day | [year]/[month]/ | fs_yyyymmddvV.v_d3d.gz |
| Weekly | weeks/ | fs_yyyymmddvV.v.gz |
| Monthly | [year]/[month]/ | fs_yyyymmvV.v.gz |
Where "sat", "yyyy", "mm", "dd", and "V.v(Note minor version is ommited if 0)" stand for:
| fs | file specifier | f32 |
|
yyyy |
year | 2014, 2015 etc. |
| mm | month | 01 (Jan), 02 (Feb), etc. |
| dd | day | 01, 02, etc. |
| vv | version | V.v |
The center of the first cell of the 1440 column and 720 row map is at 0.125 E longitude and -89.875 latitude. The center of the second cell is 0.375 E longitude, -89.875 latitude. The data values fall between 0 and 255. Specific values have been reserved:
| 0 to 250 = | valid geophysical data |
| 251 = | missing SST or wind speed due to rain, or missing water vapor due to heavy rain |
| 252 = | sea ice |
| 253 = | observations exist, but are bad (not used in composite maps) |
| 254 = | no observations |
| 255 = | land mass |
Missing Data
There are gaps within these data. Missing data generally affect Daily and 3-Day products, but can also reduce the number of observations in Weekly and Monthly averages.
When browsing imagery, the navigation may skip dates with no data, or you may see a blank map stating that no data are available for that time.
Binary data files for dates with completely missing data are not produced; they will be absent from our FTP server.
Data gaps are generally due to missing data upstream from our processing facility, such as the instrument being turned off. Occasionally, there are delays in obtaining and/or processing recently recorded data; beyond several weeks, it is unlikely that missing data will become available.
Dates for which AMSR-E data are completely missing include:
| date range | # days |
| 2002.06.28 | 1 |
| 2002.07.30 - 2002.08.07 | 9 |
| 2002.09.13 - 2002.09.19 | 7 |
| 2003.10.30 - 2003.11.05 | 7 |
| 2004.11.19 | 1 |
| 2006.11.18 | 1 |
| 2007.11.28 | 1 |
| 2008 none | 0 |
| 2009 none | 0 |
| 2010.02.03 - 2010.02.04 | 2 |
| 2011 instrument stopped Oct 4th 2011 | 88 |
Dates for which AMSR-2 data are completely missing include:
| date range | # days |
| 2013.05.11 - 2013.05.13 | 3 |
Browse Images
Each daily, 3-day, weekly and monthly browse image map displays one geophysical parameter: Sea Surface Temperature (SST), 10 meter Surface Wind Speed (WSPD-LF), 10 meter Surface Wind Speed (WSPD-MF), Columnar Water Vapor (VAPOR), Cloud Liquid Water (CLOUD), or Rain Rate (RAIN). The daily maps display the daytime or nighttime satellite passes separately. The date of the data displayed is the UTC date when the data were collected. The scale for each map is located next to the map for reference. Though the valid data range (minimum to maximum) is given in the geophysical table above, the scale bars in the browse images are set to visually enhance the data and may vary.
There are many gaps within the AMSR-J data set. Please use the browse imagery or FTP site to determine specific availability.
Read Routines
Binary file read routines and verification files are available on our ftp server in the amsre/support directory. Routines are written in IDL, Matlab, Fortran and Python.
Validation
Validation of AMSR-2 products like all microwave ocean products from RSS undergo continual validation. We post important findings here.
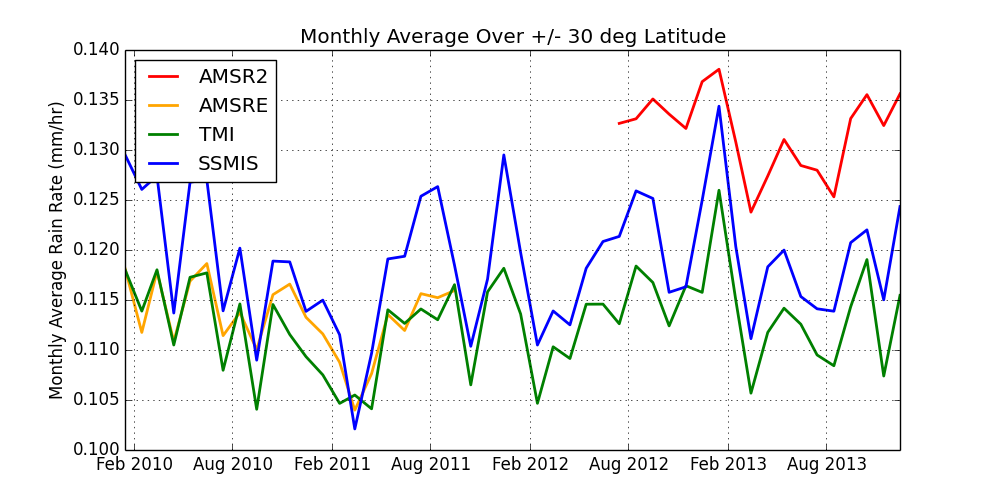
Rain Rates
AMSR-2 rain rates are higher in the tropics than other RSS satellite products. The figure below shows that the difference between AMSR-2 and SSMIS (F17) in the tropics is +9.9%. The difference between AMSR-2 rain rates and the 10-minute rain rates from the tropical buoy array is +8.3% using a 3-hour collocation radius. In the mid-latitudes, AMSR-2 rain rates are lower than SSMIS, leading to a zero overall global difference. The source of this latitude-dependent difference in AMSR-2 rain is currently under investigation as part of our “Complete Uncertainty Characterization of the DISCOVER Earth System Data Records” project.
Related Data
AMSR ocean products are also available from other sources. AMSR-E data are produced at the NASA Snow and Ice Data Center (NSIDC) using RSS processing algorithms. Visit NSIDC for data description and data access.
AMSR-J and AMSR-2 data are also available from the Japanese Space Agency (JAXA).
AMSR-2 data are available from the JPL PO.DAAC in the GHRSST L2p and L3u formats.
References
Hilburn, K. A. and F. J. Wentz, (2008), Intercalibrated passive microwave rain products from the Unified Microwave Ocean Retrieval Algorithm (UMORA), Journal of Climatology and Applied Meteorology, 47, 778-794.
Meissner, T., and F. J. Wentz, (2012), The emissivity of the ocean surface between 6 - 90 GHz over a large range of wind speeds and Earth incidence angles, IEEE TGRS, 50(8), 3004-3026.
Wentz, F. J., C. L. Gentemann and P. D. Ashcroft, (2003), On-orbit calibration of AMSR-E and the retrieval of ocean products, paper presented at 83rd AMS Annual Meeting, Long Beach, CA.
Wentz, F. J., C. L. Gentemann and K. A. Hilburn, (2005), Three years of ocean products from AMSR-E: Evaluation and applications, paper presented at Proceedings of the 2005 IEEE International Geoscience and Remote Sensing Symposium,Seoul, Korea.
Wentz, F. J. and T. Meissner, (2000), AMSR Ocean Algorithm, Version 2, report number 121599A-1, 66 pp., Remote Sensing Systems, Santa Rosa, CA.
Wentz, F. J. and T. Meissner, (2007), AMSR-E Ocean Algorithms; Supplement 1, report number 051707, 6 pp., Remote Sensing Systems, Santa Rosa, CA.
Acknowledgements
AMSR data are produced by Remote Sensing Systems and sponsored by NASA. We are grateful to JAXA for providing AMSR source data.
How to Cite These Data
Continued production of this data set requires support from NASA. We need you to be sure to cite these data when used in your publications so that we can demonstrate the value of this data set to the scientific community. Please include the following statement in the acknowledgement section of your paper:
"AMSR data are produced by Remote Sensing Systems and were sponsored by the NASA AMSR-E Science Team and the NASA Earth Science MEaSUREs Program. Data are available at www.remss.com. "
Data Citations:
AMSR-2 Daily:
Wentz, F.J., T. Meissner, C. Gentemann, K.A. Hilburn, J. Scott, 2021: RSS GCOM-W1 AMSR2 Daily Environmental Suite on 0.25 deg grid, Version 8.2, Remote Sensing Systems, Santa Rosa, CA, USA. Available at www.remss.com https://doi.org/10.56236/RSS-bq
AMSR-2 3-Day:
Wentz, F.J., T. Meissner, C. Gentemann, K.A. Hilburn, J. Scott, 2021: RSS GCOM-W1 AMSR2 3-Day Environmental Suite on 0.25 deg grid, Version 8.2, Remote Sensing Systems, Santa Rosa, CA, USA. Available at www.remss.com https://doi.org/10.56236/RSS-br
AMSR-2 Weekly:
Wentz, F.J., T. Meissner, C. Gentemann, K.A. Hilburn, J. Scott, 2021: RSS GCOM-W1 AMSR2 Weekly Environmental Suite on 0.25 deg grid, Version 8.2, Remote Sensing Systems, Santa Rosa, CA, USA. Available at www.remss.com https://doi.org/10.56236/RSS-bs
AMSR-2 Monthly:
Wentz, F.J., T. Meissner, C. Gentemann, K.A. Hilburn, J. Scott, 2021: RSS GCOM-W1 AMSR2 Monthly Environmental Suite on 0.25 deg grid, Version 8.2, Remote Sensing Systems, Santa Rosa, CA, USA. Available at www.remss.com https://doi.org/10.56236/RSS-bt
AMSR-E Daily:
Wentz, F.J., T. Meissner, C. Gentemann, M.Brewer, 2014: RSS AQUA AMSR-E Daily Environmental Suite on 0.25 deg grid, Version 7, Remote Sensing Systems, Santa Rosa, CA, USA. Available at www.remss.com https://doi.org/10.56236/RSS-bm
AMSR-E 3-Day:
Wentz, F.J., T. Meissner, C. Gentemann, M.Brewer, 2014: RSS AQUA AMSR-E 3-Day Environmental Suite on 0.25 deg grid, Version 7, Remote Sensing Systems, Santa Rosa, CA, USA. Available at www.remss.com https://doi.org/10.56236/RSS-bn
AMSR-E Weekly:
Wentz, F.J., T. Meissner, C. Gentemann, M.Brewer, 2014: RSS AQUA AMSR-E Weekly Environmental Suite on 0.25 deg grid, Version 7, Remote Sensing Systems, Santa Rosa, CA, USA. Available at www.remss.com https://doi.org/10.56236/RSS-bo
AMSR-E Monthly:
Wentz, F.J., T. Meissner, C. Gentemann, M.Brewer, 2014: RSS AQUA AMSR-E Monthly Environmental Suite on 0.25 deg grid, Version 7, Remote Sensing Systems, Santa Rosa, CA, USA. Available at www.remss.com https://doi.org/10.56236/RSS-bp
For AMSR on ADEOS-II (we call it AMSR-J): Wentz, F.J., L. Ricciardulli, 2007: Remote Sensing Systems MIDORI AMSR [indicate whether you used Daily, 3-Day, Weekly, or Monthly] Environmental Suite on 0.25 deg grid, Version 5 [indicate subset if used]. Remote Sensing Systems, Santa Rosa, CA. Available online at www.remss.com/missions/amsr. [Accessed dd mmm yyyy].