


Abstract
Quantifying diversity is of central importance for the study of structure, function and evolution of microbial communities. The estimation of microbial diversity has received renewed attention with the advent of large-scale metagenomic studies. Here, we consider what the diversity observed in a sample tells us about the diversity of the community being sampled. First, we argue that one cannot reliably estimate the absolute and relative number of microbial species present in a community without making unsupported assumptions about species abundance distributions. The reason for this is that sample data do not contain information about the number of rare species in the tail of species abundance distributions. We illustrate the difficulty in comparing species richness estimates by applying Chao's estimator of species richness to a set of in silico communities: they are ranked incorrectly in the presence of large numbers of rare species. Next, we extend our analysis to a general family of diversity metrics (‘Hill diversities'), and construct lower and upper estimates of diversity values consistent with the sample data. The theory generalizes Chao's estimator, which we retrieve as the lower estimate of species richness. We show that Shannon and Simpson diversity can be robustly estimated for the in silico communities. We analyze nine metagenomic data sets from a wide range of environments, and show that our findings are relevant for empirically-sampled communities. Hence, we recommend the use of Shannon and Simpson diversity rather than species richness in efforts to quantify and compare microbial diversity.
Keywords: Chao estimator, Hill diversities, metagenomics, Shannon diversity, Simpson diversity, species abundance distribution
Introduction
Species diversity is a crucial property of ecological communities: it is the primary descriptor of community structure, and it is generally believed to be a major determinant of the functioning and the dynamics of ecological communities (Wilson, 1999; Loreau et al., 2001; Ives and Carpenter, 2007; Loreau, 2010). Therefore, diversity measurement is often a first step in characterizing an ecological community (Brose et al., 2003; Magurran, 2004; Gotelli and Colwell, 2011). Because an exhaustive census of the community is usually not feasible, community diversity must be inferred from the diversity observed in a sample taken from the community. The inference problem can be difficult, especially when community diversity is believed to be very large (Engen, 1978; Bunge and Fitzpatrick, 1993; Mao and Colwell, 2005).
Diversity measurement is particularly challenging for microbial communities (Hughes et al., 2001; Bohannan and Hughes, 2003; Kemp and Aller, 2004; Schloss and Handelsman, 2005; Sloan et al., 2008; Bunge, 2009; Øvreås and Curtis, 2011). First, it should be recalled that there is no unambiguous way to define microbial ‘species' (Stackebrandt et al., 2002). Here we use the term species pragmatically to mean an operationally determined taxonomic unit (for example, 97% identity of 16S rRNA (Schloss and Handelsman, 2005)). However measured, the species diversity of microbial communities is usually much larger than that of communities of larger organisms. Moreover, the number of organisms in microbial communities is typically many orders of magnitude larger than the number of organisms in plant or animal communities (Whitman et al., 1998). This leads to severe sampling problems. Although metagenomic approaches allow for impressively large sample size (Huber et al., 2007; Roesch et al., 2007; Rusch et al., 2007), even these huge samples correspond to a tiny fraction of the community being sampled. Hence, for microbial community samples, community diversity is generally much larger than sample diversity. This disparity between community and sample leads to a challenge that we address here: how can microbial diversity be estimated robustly?
One popular approach to circumvent the sampling problem is to assume that the species abundance distribution of the community belongs to a specific family (for example, the family of lognormal distributions) (Curtis et al., 2002; Hong et al., 2006; Schloss and Handelsman, 2006; Quince et al., 2008). Such an assumption fills in the information about the community missing in the data and leads to precise diversity estimates. But the validity of the estimates depends crucially on the choice of the species abundance distribution family. This choice cannot be verified empirically because the sample data do not contain sufficient information about the community structure. In fact, many distribution families yield extrapolated community structures that are consistent with the sample data. Here we show that the extrapolation approach has intrinsic limitations.
Other methods for diversity estimation have been proposed. For example, proposals have been made to extrapolate the rarefaction curve beyond the actual sample size (Gotelli and Colwell, 2001; Colwell et al., 2004), or to assume a particular distribution for the community diversity over taxonomic levels (May, 1988; Mora et al., 2011). Eventually, also these methods are limited by the lack of information about the community structure in the sample data. Rather than filling this gap by unverifiable assumptions, here we ask what can (and cannot) be inferred from the sample data alone. An interesting step in this direction is given by the popular Chao estimator (Chao, 1984; Shen et al., 2003; Chao et al., 2009). Chao's estimate can be interpreted as a lower estimate of the species richness consistent with the data. We take the estimation strategy underlying Chao's estimator a step further, and construct lower and upper estimates for a general family of community diversities, including species richness, Shannon and Simpson diversity (Hill, 1973). The unification we propose here represents a robust approach to estimating microbial diversity in theory and in practice.
Materials and methods
Data sets
The data sets used in this paper were downloaded from the Supplementary Material of Quince et al., (2008). The abundance data used in Figure 1 correspond to 16S rDNA sequences obtained from a bacterial soil community (sample ‘Brazil' in (Roesch et al., 2007)). The abundance data used in Figure 5 correspond to 16S rDNA sequences obtained from a bacterial seawater community from the upper ocean (Rusch et al., 2007), from four bacterial soil communities (Roesch et al., 2007), and from bacterial and archaeal seawater communities from two hydrothermal vents (Huber et al., 2007) Rank-abundance curves of the data sets are shown in Supplementary Figure S3.
Figure 1.

Empirical sample data are consistent with very different communities. We consider the abundance data of a sample taken from a bacterial soil community (sample ‘Brazil' in (Roesch et al., 2007)). The sample consists of 26079 individuals belonging to 2880 species. We tried to reconstruct the community from which the sample was taken. Panels a–c show the rank-abundance curve of three such reconstructed communities. The first community (panel a, in red) has 104 species; the second community (panel b, in blue) has 105 species; the third community (panel c, in green) has 106 species. For each of the three reconstructions the community rank-abundance curve is an extension of the sample rank-abundance curve (in black). We claim that each of the three reconstructed communities is compatible with the sample data. This can be seen from the rarefaction curves in panel d: the rarefaction curve for the sample data (black line) coincides with the rarefaction curves for the reconstructed communities (red line with squares for community in panel a, blue line with x-marks for community in panel b, and green line with diamonds for community in panel c). Because the sample data are consistent with very different values of the community richness, the community richness cannot be estimated from the sample data. The colour reproduction of this figure is available on the ISME Journal online.
Rank-abundance curves
We represent the species abundance distribution of a community as a rank-abundance curve, that is, we arrange the species in decreasing order of community abundance, and plot species abundance as a function of species rank. We use logarithmic scales for both axes of the rank-abundance curves, so that a community with power-law abundance distribution is represented as a straight line (the slope is equal to the power-law exponent), see Figure 2a. We constructed the communities of Figure 1 by using a piecewise linear parametrization of the rank-abundance curve. Hence, the species abundance distributions consist of power-law segments with different exponents.
Figure 2.

Estimated species richness does not rank correctly communities. We generated three community abundance distributions, the rank-abundance curves of which are shown in panel a. Community C1 (red) has the smallest number of species; community C3 (green) has the largest number of species. The rarefaction curves of the three communities up to sample size 2 104 are shown in panel b. Based on the rarefaction data, one would conclude that community C1 is the most diverse and community C3 the least diverse. Hence, the ranking of the communities according to their observed diversity is inverted compared to the ranking according to their true diversity. This observation is confirmed when applying Chao's estimator to sample data. Community C1 is estimated to have 10 times more species than community C3, whereas in reality community C1 has 20 times less species than community C3. See Supplementary Table S1 for the numerical data of the communities. The colour reproduction of this figure is available on the ISME Journal online.
Rarefaction curves
We define Sm as the expected number of species in a sample of m individuals taken from the community (sampling with replacement). The rarefaction curve of the community is the plot of the number of species Sm as a function of the sample size m. It is important to distinguish the community rarefaction curve from the rarefaction curve estimated from sample data. For a sample of size M taken from the community, the part of the rarefaction curve corresponding to Sm with m⩽M can be estimated by subsampling the sample data. The same approach fails for the part of the rarefaction curve corresponding to Sm with m>M. In that case the rarefaction curve has to be extrapolated, introducing large estimation uncertainty. We studied two extreme extrapolation scenarios: one for the slowest (that is, smallest slope) and one for the fastest (that is, largest slope) increase of the rarefaction curve compatible with the sample data, see Figure 3.
Figure 3.

Extrapolating the rarefaction curve. The Hill diversity estimators  and
and  are based on reconstructions of the rarefaction curve Sm from sample data. For a sample of size M, the rarefaction curve Sm for m⩽M can be estimated by subsampling (red full line). If the sample size M is large, the estimator has small uncertainty. The rarefaction curve Sm for m>M can be estimated by extrapolating the sample data beyond the sample size M. Different extrapolation scenarios are compatible with the sample data. We consider two extreme scenarios (dashed lines). A lower estimate is obtained by assuming that unobserved species are approximately as rare as the rarest observed species. An upper estimate is obtained by assuming that unobserved species are represented in the community by one individual. The difference between the two extremes quantifies the uncertainty of the extrapolation, shown as the shaded region. The uncertainty increases rapidly for m>>M.
Hill diversities
The Hill diversities, defined in Equation (3), can be computed if the community abundances are known. If only sample data are available, Hill diversities have to be estimated. We consider sampling with replacement, and denote by M the sample size and by Fk the number of species sampled k times. We developed an estimation procedure that exploits the link between Hill diversities Dα and the rarefaction curve Sm. The lower estimate  of the rarefaction curve,
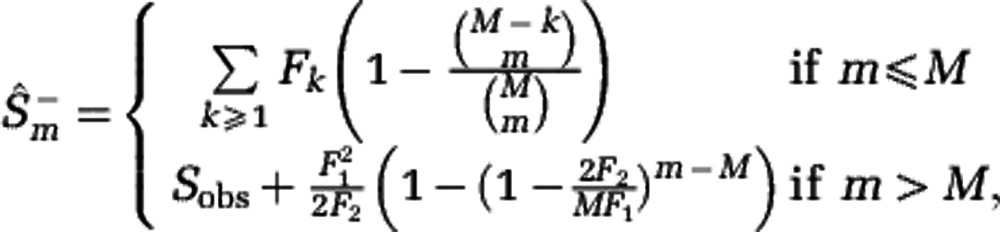 |
yields the lower estimate of the Hill diversity,
 |
where  denotes the gamma function. Similarly, the upper estimate of the rarefaction curve,
 |
with N the (estimated) community size, yields the upper estimate of the Hill diversity,
 |
The estimators (1) and (2) can be computed with the Matlab code in the Supplementary Information, and were used to generate upper and lower estimates of Hill diversities.
Results
Species richness cannot be estimated from sample data alone
We are interested in estimating the diversity of a community based on the composition of a sample taken from the community. Our approach is to reconstruct community structures, that is, species abundance distributions, from the sample data. For the example data set of Figure 1, we find that a wide range of communities are consistent with the sample data. The reconstructed communities have vastly different numbers of species, differing by two orders of magnitude, implying that estimating species richness is subject to large biases.
We claim that sample data is always consistent with very different community structures. To establish this claim we study the link between the rare species tail of the community and the sample data, summarized by the rarefaction curve. A computation in Supplementary Text S1 shows that the rarefaction curve up to sample size M is insensitive to the abundance distribution of species with relative abundance well below  . For concreteness we set a relative abundance threshold at
  , and we call the species with larger and smaller relative abundance than this threshold the ‘non-rare' and ‘rare' species, respectively. The computation shows that the rarefaction curves does not depend on the abundance distribution of the rare species. Changes in the rare species tail, such as increasing the number of rare species by several orders of magnitude (but keeping the total abundance of rare species constant), does not affect the sample data. As a consequence, estimating species richness is intrinsically problematic.
Note that we use a statistical definition of rarity, which depends on the sampling effort M; the set of rare species gets smaller when sampling gets deeper. This contrasts with the ecological concept of rarity, a community property independent of sample size (Pedrós-Alió, 2006; Sogin et al., 2006), see the Discussion section.
To further illustrate the theoretical result we reconsider the reconstructed communities of Figure 1. The communities have the same abundance distribution of the non-rare species. In each community, the set of rare species occupies 0.5% of the total community abundance, explaining why the corresponding rarefaction curves coincide, see Figure 1d. Nevertheless, the number of rare species differs by two orders of magnitude. Another example of in silico communities with very different rare species tails but with the same rarefaction curve is shown in Supplementary Figure S1.
We conclude that sample data do not allow us to distinguish communities with very different rare species tails. The insensitivity of the rarefaction curve to rare species implies that it is difficult or impossible to reliably estimate the community species richness from sample data alone.
Relative species richness cannot be estimated from sample data alone
We have shown that the number of species in a community cannot be reliably estimated from sample data. A related question is whether sample data can be used to rank different communities according to their number of species. In this section we show that this cannot be done without additional assumptions.
We present an explicit example to illustrate the use of sample data to rank communities, see Figure 2. We consider three communities, which differ widely in species richness: community C1 has 20 times fewer species than community C3. We construct the initial arcs of these rarefaction curves, see Figure 2b. Surprisingly, the rarefaction curves suggest that community C1 is the most diverse and community C3 the least diverse. We therefore expect that any estimator of species richness ranks the communities in the inverse order of their true species richness. Indeed, Chao's estimator predicts that community C1 has almost 10 times as many species as community C3 (see Supplementary Table S1; values are averaged over sample randomness).
To understand the incorrect ranking we take a closer look at the communities in Figure 2a. We explained, in the previous section, that sample data are insensitive to rare species. When we compare the number of non-rare species in the communities (species with relative abundance above 10−6), we find that community C1 has 15 times more non-rare species than community C3. This explains why the sample data suggest that community C1 is the most diverse. Community C1 has a large number of non-rare species combined with a relatively small number of rare species. In contrast, community C3 has a relatively small number of non-rare species combined with a very large number of rare species. This explains the discrepancy between true number of species, mainly determined by the rare species, and estimated number of species, determined by the non-rare species.
The example of Figure 2 indicates a general problem: relative species richness cannot be reliably estimated. The problem is due to the same mechanism as the one identified in the previous section. Sample data cannot be used to rank communities according to their number of species because sample data do not contain information about the number of rare species.
Some generalized diversities can be estimated from sample data alone
Although insensitive to rare species, sample data do contain information about the community structure. In this section we demonstrate that diversity indices that are weakly dependent on rare species can be estimated from sample data.
Diversity is a broader notion than species richness. Alternative definitions of diversity have been proposed, in which rare species contribute less than common species. These alternative diversities account not only for species richness but also for the evenness of the community structure. Examples are the Shannon diversity index (Shannon, 1948) and the Simpson diversity index (Simpson, 1949). Here we study a family of generalized diversities, the Hill diversities Dα (Hill, 1973) that includes these two examples as well as species richness as special cases. For a community consisting of S species with relative abundances p1, p2,…, pS, the Hill diversities are defined by
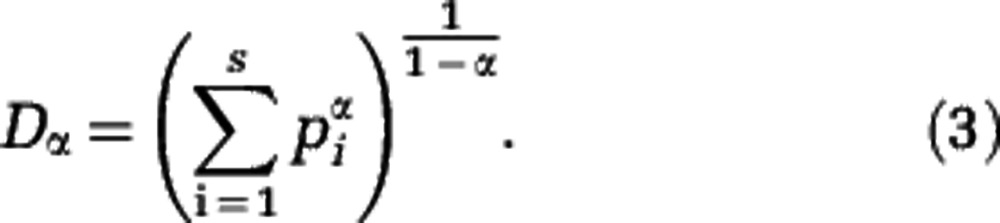 |
We obtain a Hill diversity for each value of the parameter α. For α=0 the species are weighted equally in the sum of Equation (3) (each term is equal to one), and D0=S, that is, D0 is equal to species richness. For α>0 the species are not weighted equally. Instead, a rare species contributes less than a common species. For larger values of α the weighting is more unequal, see Supplementary Text S2. As an extreme case, only the most abundant species contributes in the limit  . The Hill diversity of order 1 is related to the Shannon diversity index (note that Definition (3) should be understood as
  ) and the Hill diversity of order 2 is related to the Simpson concentration index. The Hill diversity for a community in which all S species have the same relative abundance
  is equal to Dα=S for any value of the parameter α. This indicates that any Hill diversity Dα can be considered as an effective number of species (Hill, 1973; Jost, 2006), which facilitates the interpretation of estimated diversity values and allows us to compare the estimation properties of different Hill diversities.
As α increases the Hill diversities are increasingly insensitive to the tail of rare species and are more strongly determined by the non-rare species, see Supplementary Figure S2. Hence, we expect that they are more accurately estimated from sample data. A mathematical link between the Hill diversities and the rarefaction curve further indicates which Hill diversities can be estimated from sample data. In Supplementary Text S3 we show that any Hill diversity Dα can be expressed in terms of the rarefaction curve. The Hill diversity D2 is related to the initial slope of the rarefaction curve (Lande et al., 2000). Thus, for α close to 2, the Hill diversity Dα depends on the part of the rarefaction curve for small sample size. For smaller α, the Hill diversity Dα depends on the rarefaction curve for increasingly large sample size. The Hill diversity D0 is equal to species richness, which can be obtained as the limit of the rarefaction curve for infinite sample size.
These observations have important implications for the diversity estimation problem. We suppose that sample data of size M are given, and we try to estimate the rarefaction curve at sample size m. The community rarefaction curve for sample sizes m⩽M can be estimated in an unbiased manner by subsampling the sample data, but for m>M the rarefaction curve can only be estimated based on extrapolation. This leads to increasingly biased estimates as m increases. Hence, we reach the following conclusions. On one hand, Hill diversities that depend on the initial part of the rarefaction curve, that is, Dα for α close to 2, can be estimated robustly. On the other hand, Hill diversities that depend on the part of the rarefaction curve for large sample size, that is, Dα for α close to 0, cannot be estimated robustly. We now seek to make this classification of community diversities more precise.
Estimators for Hill diversities
We have argued that the Hill diversities Dα with α close to 2 can be estimated accurately, and that the Hill diversities Dα with α close to 0 cannot be estimated accurately. In this section we introduce and study estimators for the set of Hill diversities Dα with 0⩽α⩽2.
We have shown that a wide variety of communities may be consistent with any given sample data. Here we look for two extreme members of this set of reconstructed communities. We construct a lower estimate of the diversity,  , by assuming that unobserved species are approximately as rare as the rarest observed species. We construct an upper estimate of the diversity,
  , by assuming that unobserved species are represented in the community by a single individual. We first extrapolate the rarefaction curve based on these assumptions, see Figure 3, and then use the extrapolated curves to calculate the Hill diversities. The detailed construction of the estimators
  and
and  is presented in Supplementary Texts S3, S4 and S5. A summary of the estimator formulas can be found in the Materials and methods section. We provide Matlab code to compute the estimators in the Supplementary Information.
Two properties follow directly from the definition of the estimators  and
and  , see Supplementary Text S5. First, the lower estimate
  for species richness is equal to Chao's estimator. Hence, the lower estimate
  generalizes Chao's estimator for Hill diversities Dα with α>0. Second, the estimators for Simpson diversity D2 coincide,
  . This corresponds to the existence of an unbiased, non-parametric estimator for the Simpson concentration index, and confirms that Simpson diversity D2 is particularly easy to estimate, even for small sample size M. Note that the lower estimate can be computed from the sample data alone, but the upper estimate also requires an estimate of the community size N.
In Figure 4 we apply the estimators  and
and  to sample data from an in silico community. For α>1 the lower and upper estimates almost coincide, so that the Hill diversities Dα with α>1, and in particular Simpson diversity D2, may be estimated with small error. This holds for any sample size M (as small as M=100) and any community size N. For α<1 the upper estimate increases steeply, so that the estimation uncertainty of the Hill diversities Dα with α small, and in particular species richness D0, is very large. This holds for any sample size M (as large as M=106) and any community size N much greater than M. The effect of sample size M and community size N is only pertinent for α close to 1. For these values of α the range between the lower and upper estimates narrows with increasing sample size M and decreasing community size N, so that increasingly accurate estimates are obtained for Shannon diversity D1.
Figure 4.

Estimated Hill diversities for in silico communities. We generated samples from a community with power-law abundance distribution (S=106, z=2) and evaluated the estimators  and
and  for the Hill diversity Dα. We consider three sample sizes M (in columns: M=102, 104, 106) and three community sizes N (in rows: N=1010, 1015, 1020). The shaded range between
  and
and  indicates the estimation uncertainty. The true Hill diversity Dα of the community is plotted in black. The Hill diversities between α=1 (Shannon) and α=2 (Simpson) are correctly estimated even for small sample size M. The estimates of Hill diversities less than α=1, including α=0 (species richness), are characterized by large uncertainty.
We observe the same behavior when applying the Hill diversity estimators to empirical sample data, see Figure 5. We applied the estimators to nine metagenomic data sets from a wide range of environments: soil samples at four locations (Roesch et al., 2007), a seawater sample from the upper ocean (Rusch et al., 2007) and seawater samples at two deep-sea vent locations (Huber et al., 2007). The estimators exhibit the same patterns as for the in silico community studied in Figure 4. The Hill diversities Dα for α⩾1, including Shannon and Simpson diversity, can be estimated reliably. For small α the estimation uncertainty is very large, that is, Hill diversities close to species richness cannot be estimated reliably. The dependence of the estimation accuracy on the (estimated) community size N is weak, see Supplementary Figure S4. These observations show that our analysis for in silico communities is relevant for real communities as well.
Figure 5.

Estimated Hill diversities for natural microbial communities. We observe the same behavior as for the in silico generated data sets of Figure 4: for α⩾1 the Hill diversity Dα can be estimated accurately; for α<1 the estimation of the Hill diversity Dα has large uncertainty. We used the same data sets as Quince et al., (2008): a seawater bacterial sample from the upper ocean (Rusch et al., 2007), soil bacterial samples at four locations: Brazil, Florida, Illinois and Canada (Roesch et al., 2007), and seawater samples from deep-sea vents at two locations: FS312 and FS396, separated into bacteria and archaea (Huber et al., 2007). The community size was set to N=1015 for illustration; results are robust to changes in community size (see Supplementary Figure S4).
Discussion
We have argued that the estimation of species richness is intrinsically problematic. We have provided evidence in three different but related ways. First, we have shown that it is possible to add a large number of rare species to the community without significantly affecting its statistical properties under fixed-size sampling, see Figure 1. As the number of added rare species can be large, the estimation uncertainty of the number of species is large as well. Second, we have discussed an exact relationship between the community rarefaction curve and the set of Hill diversities. Hill diversities close to Simpson's are based on the initial part of the rarefaction curve, which can be reliably interpolated from sample data. Hill diversities beyond Shannon's, and species richness in particular, depend on parts of the rarefaction curve orders of magnitude beyond the actual sample size, whose estimation requires unverifiable extrapolation. Third, we have constructed two estimators related to the Hill diversities, delimiting the range in which each true Hill diversity is expected to lie. This range is relatively narrow for diversities from Simpson's to Shannon's, but it diverges for diversities towards species richness, see Figures 4 and 5. Hence, the estimation uncertainty of species richness is intrinsically large.
We have also studied a weaker form of species richness estimation, namely, whether communities can be ranked according to species richness based on sample data. We have argued that also in this case the sample data are not sufficiently informative. The example shown in Figure 2 is interesting, because the community ranking based on estimated species richness, although completely different from the ranking based on true richness, is the same as the ranking based on true Simpson or Shannon diversity, see Supplementary Table S1. This observation can be understood intuitively. The insensitivity of the species richness estimator to the very rare species in the community is shared by the Simpson and Shannon diversity, but not by the community species richness. In fact, different diversity estimators often yield the same community ranking (Shaw et al., 2008). This should not be interpreted as an indication of the validity of the ranking for species richness; the ranking based on true species richness can be completely different. Communities should only be ranked according to community properties that can be estimated reliably.
The intrinsic problem of species richness estimation can be unlocked by introducing more information in the estimation procedure. Obviously, the reliability of the estimate crucially depends on the reliability of the additional information. For example, assuming a family of abundance distributions (for example, lognormal) can lead to species richness estimates with small uncertainty (Schloss and Handelsman, 2005; Hong et al., 2006; Quince et al., 2008). But both the estimate and the uncertainty are conditional on the assumed distribution family. In particular, assuming a species abundance distribution also fixes the rare species tail and, as we have argued, the sample data contain little information about the rare species tail. Hence, the choice of distribution family is arbitrary. Still, this choice strongly affects the species richness estimate. We believe this to be a serious problem for this approach to diversity estimation.
Other assumptions have been introduced to make diversity estimation manageable. Some regularity has been observed in the distribution of diversity over coarse taxonomic groups (Mora et al., 2011). This regularity can be assumed down to the species level to guide the estimation of species richness. Clearly, the approach depends crucially on the unverifiable validity of the extrapolation. More generally, this and other approaches attempt to reduce the wide range of diversity values consistent with the data to a single value. This implies that the reduction step is based on detailed information not contained in the sample data. Such an approach is necessarily very sensitive to the detailed assumptions, and therefore not robust.
Mao and Colwell (2005) pointed out that rare species pose a serious problem for estimating species richness. In this paper we have shown a practical way forward by quantifying the range of diversity values consistent with the data. The latter idea underlies our construction of lower and upper estimates of community diversity, and is also crucial for Chao's estimator of species richness (Chao, 1984). This estimator does not attempt to directly assess true species richness, but rather approximates the lowest species richness consistent with the sample data. In many practical cases this indirect estimation is the most informative claim that can be made about species richness.
Different studies have highlighted the role of rare species in microbial communities (Dykhuizen, 1998; Pedrós-Alió, 2006; Sogin et al., 2006; Pedrós-Alió, 2007; Huber et al., 2007; Gobet et al., 2010). We have argued that sample data contain limited information about the rare species tail of the community. For example, the total number of rare species cannot be estimated. However, an estimator for the relative abundance of unobserved species is available, see Supplementary Text S4. For the data sets we have analyzed the estimated relative abundance ranges from 0.1–5%, see Supplementary Table S2. These estimates depend on sample size. It might be more practical to use a notion of rarity that is independent of sample size. For example, we could call a species rare if its community abundance is below a certain threshold value (for example, relative abundance below 10−4). We plan to address the problem of estimating the relative abundance of rare species in a sample-independent fashion as part of future work.
In this paper we have only considered taxonomic diversity. Other notions of diversity such as functional and phylogenetic diversity are becoming increasingly popular (Horner-Devine and Bohannan, 2006; Lozupone and Knight, 2007; Green et al., 2008). Our study suggests that any diversity metrics that strongly depend on rare species will be difficult or impossible to estimate robustly. It is interesting to note that other measurement techniques for microbial diversity are confronted with limitations similar to those of the sample-based techniques discussed in this paper. The reassociation kinetics of community DNA are affected by community diversity (Torsvik et al., 1990; Gans et al., 2005), but it has been argued that not species richness, but Simpson and Shannon diversity can be estimated from the data (Haegeman et al., 2008). Fingerprinting techniques provide snapshots of the community structure (Fromin et al., 2002): in this context also, the estimation of species richness seems to be impossible for highly diverse communities (Loisel et al., 2006; Bent and Forney, 2008), but preliminary results indicate that accurate estimators can be constructed for Simpson diversity. Estimates of the total number of genes in a species, that is, the pan genome size, has been estimated from a small number of sample genomes (Tettelin et al., 2005), but it is has been argued that these estimates are not robust and that similarity-based metrics should be used instead (Kislyuk et al., 2011).
These findings together with those of this paper make a strong case for the versatility of generalized diversities for the analysis of microbial diversity estimation. They can be interpreted as effective number of species giving greater weight to common species (Hill, 1973; Jost, 2006), and have superior estimation properties compared with species richness. We recommend the use of Shannon and Simpson diversity to quantify and compare microbial taxonomic diversity.
Acknowledgments
Financial support for BH and JH was provided by the DISCO project from the French National Research Agency (ANR, project number AAP215-SYSCOMM-2009), and for BH, JH, JM and PN by an Alliance grant from the British Council and the French Foreign Affairs Ministry (project number 22732SJ). JSW holds a Career Award at the Scientific Interface from the Burroughs Wellcome Fund.
Footnotes
Supplementary Information accompanies the paper on The ISME Journal website (http://www.nature.com/ismej)
Supplementary Material
References
- Bent SJ, Forney LJ. The tragedy of the uncommon: understanding limitations in the analysis of microbial diversity. ISME J. 2008;2:689–695. doi: 10.1038/ismej.2008.44. [DOI] [PubMed] [Google Scholar]
- Bohannan BJM, Hughes JB. New approaches to analyzing microbial biodiversity data. Curr Opin Microbiol. 2003;6:282–287. doi: 10.1016/s1369-5274(03)00055-9. [DOI] [PubMed] [Google Scholar]
- Brose U, Martinez ND, Williams RJ. Estimating species richness: sensitivity to sample coverage and insensitivity to spatial patterns. Ecology. 2003;84:2364–2377. [Google Scholar]
- Bunge J.2009Statistical estimation of uncultivated microbial diversityIn: Epstein SS (ed)Uncultivated Microorganisms Springer-Verlag; 1–18. [Google Scholar]
- Bunge J, Fitzpatrick M. Estimating the number of species: a review. J Amer Statist Assoc. 1993;88:364–373. [Google Scholar]
- Chao A. Nonparametric estimation of the number of classes in a population. Scand J Statist. 1984;11:265–270. [Google Scholar]
- Chao A, Colwell RK, Lin CW, Gotelli NJ. Sufficient sampling for asymptotic minimum species richness estimators. Ecology. 2009;90:1125–1133. doi: 10.1890/07-2147.1. [DOI] [PubMed] [Google Scholar]
- Colwell RK, Mao CX, Chang J. Interpolating, extrapolating, and comparing incidence-based species accumulation curves. Ecology. 2004;85:2717–2727. [Google Scholar]
- Curtis TP, Sloan WT, Scannell JW. Estimating prokaryotic diversity and its limits. Proc Natl Acad Sci USA. 2002;99:10494–10499. doi: 10.1073/pnas.142680199. [DOI] [PMC free article] [PubMed] [Google Scholar]
- Dykhuizen DE. Santa Rosalia revisited: why are there so many species of bacteria. Antonie Van Leeuwenhoek. 1998;73:25–33. doi: 10.1023/a:1000665216662. [DOI] [PubMed] [Google Scholar]
- Engen S. Stochastic Abundance Models. Chapman & Hall; 1978. [Google Scholar]
- Fromin N, Hamelin J, Tarnawski S, Roesti D, Jourdain-Miserez K, Forestier N, et al. Statistical analysis of denaturing gel electrophoresis (DGE) fingerprinting patterns. Environ Microbiol. 2002;4:634–643. doi: 10.1046/j.1462-2920.2002.00358.x. [DOI] [PubMed] [Google Scholar]
- Gans J, Wolinsky M, Dunbar J. Computational improvements reveal great bacterial diversity and high metal toxicity in soil. Science. 2005;309:1387–1390. doi: 10.1126/science.1112665. [DOI] [PubMed] [Google Scholar]
- Gobet A, Quince C, Ramette A. Multivariate cutoff level analysis (MultiCoLA) of large community data sets. Nucl Acids Res. 2010;38:e155. doi: 10.1093/nar/gkq545. [DOI] [PMC free article] [PubMed] [Google Scholar]
- Gotelli NJ, Colwell RK. Quantifying biodiversity: Procedures and pitfalls in the measurement and comparison of species richness. Ecol Lett. 2001;4:379–391. [Google Scholar]
- Gotelli NJ, Colwell RK.2011Estimating species richnessIn: Magurran AE, McGill BJ (eds).Biological Diversity: Frontiers in Measurement and Assessment Oxford University Press; 39–54. [Google Scholar]
- Green JL, Bohannan BJM, Whitaker RJ. Microbial biogeography: from taxonomy to traits. Science. 2008;320:1039–1043. doi: 10.1126/science.1153475. [DOI] [PubMed] [Google Scholar]
- Haegeman B, Vanpeteghem D, Godon JJ, Hamelin J. DNA reassociation kinetics and diversity indices: richness is not rich enough. Oikos. 2008;117:177–181. [Google Scholar]
- Hill MO. Diversity and evenness: A unifying notation and its consequences. Ecology. 1973;54:427–432. [Google Scholar]
- Hong SH, Bunge J, Jeon SO, Epstein SS. Predicting microbial species richness. Proc Natl Acad Sci USA. 2006;103:117–122. doi: 10.1073/pnas.0507245102. [DOI] [PMC free article] [PubMed] [Google Scholar]
- Horner-Devine MC, Bohannan BJM. Phylogenetic clustering and overdispersion in bacterial communities. Ecology. 2006;87:S100–S108. doi: 10.1890/0012-9658(2006)87[100:pcaoib]2.0.co;2. [DOI] [PubMed] [Google Scholar]
- Huber JA, Welch DBM, Morrison HG, Huse SM, Neal PR, Butterfield DA, et al. Microbial population structures in the deep marine biosphere. Science. 2007;318:97–100. doi: 10.1126/science.1146689. [DOI] [PubMed] [Google Scholar]
- Hughes JB, Hellmann JJ, Ricketts TH, Bohannan BJM. Counting the uncountable: statistical approaches to estimating microbial diversity. Appl Environ Microbiol. 2001;67:4399–4406. doi: 10.1128/AEM.67.10.4399-4406.2001. [DOI] [PMC free article] [PubMed] [Google Scholar]
- Ives A, Carpenter S. Stability and diversity of ecosystems. Science. 2007;317:58–68. doi: 10.1126/science.1133258. [DOI] [PubMed] [Google Scholar]
- Jost L. Entropy and diversity. Oikos. 2006;113:363–375. [Google Scholar]
- Kemp P, Aller J. Bacterial diversity in aquatic and other environments: what 16S rDNA libraries can tell us. FEMS Microbiol Ecol. 2004;47:161–171. doi: 10.1016/S0168-6496(03)00257-5. [DOI] [PubMed] [Google Scholar]
- Kislyuk AO, Haegeman B, Bergman NH, Weitz JS. Genomic fluidity: an integrative view of gene diversity within microbial populations. BMC Genomics. 2011;12:32. doi: 10.1186/1471-2164-12-32. [DOI] [PMC free article] [PubMed] [Google Scholar]
- Lande R, DeVries PJ, Walla TR. When species accumulation curves intersect: implications for ranking diversity using small samples. Oikos. 2000;89:601–605. [Google Scholar]
- Loisel P, Harmand J, Zemb O, Latrille E, Lobry C, Delgenès JP, et al. Denaturing gradient electrophoresis (DGE) and single-strand conformation polymorphism (SSCP) molecular fingerprintings revisited by simulation and used as a tool to measure microbial diversity. Environ Microbiol. 2006;8:720–731. doi: 10.1111/j.1462-2920.2005.00950.x. [DOI] [PubMed] [Google Scholar]
- Loreau M. From Populations to Ecosystems: Theoretical Foundations for a New Ecological Synthesis. Princeton University Press; 2010. [Google Scholar]
- Loreau M, Naeem S, Inchausti P, Bengtsson J, Grime JP, Hector A, et al. Biodiversity and ecosystem functioning: Current knowledge and future challenges. Science. 2001;294:804–808. doi: 10.1126/science.1064088. [DOI] [PubMed] [Google Scholar]
- Lozupone CA, Knight R. Global patterns in bacterial diversity. Proc Natl Acad Sci USA. 2007;104:11436–11440. doi: 10.1073/pnas.0611525104. [DOI] [PMC free article] [PubMed] [Google Scholar]
- Magurran AE. Measuring Biological Diversity. Blackwell Publishing; 2004. [Google Scholar]
- Mao CX, Colwell RK. Estimation of species richness: Mixture models, the role of rare species, and inferential challenges. Ecology. 2005;86:1143–1153. [Google Scholar]
- May RM. How many species are there on earth. Science. 1988;241:1441–1449. doi: 10.1126/science.241.4872.1441. [DOI] [PubMed] [Google Scholar]
- Mora C, Tittensor DP, Adl S, Simpson AGB, Worm B. How many species are there on earth and in the ocean. PLoS Biol. 2011;9:e1001127. doi: 10.1371/journal.pbio.1001127. [DOI] [PMC free article] [PubMed] [Google Scholar]
- Øvreås L, Curtis TP.2011Microbial diversity and ecologyIn: Magurran AE, McGill BJ (eds)Biological Diversity: Frontiers in Measurement and Assessment Oxford University Press; 221–236. [Google Scholar]
- Pedrós-Alió C. Marine microbial diversity: can it be determined. Trends Microbiol. 2006;14:257–263. doi: 10.1016/j.tim.2006.04.007. [DOI] [PubMed] [Google Scholar]
- Pedrós-Alió C. Dipping into the rare biosphere. Science. 2007;315:192–193. doi: 10.1126/science.1135933. [DOI] [PubMed] [Google Scholar]
- Quince C, Curtis TP, Sloan WT. The rational exploration of microbial diversity. Isme J. 2008;2:997–1006. doi: 10.1038/ismej.2008.69. [DOI] [PubMed] [Google Scholar]
- Roesch LFW, Fulthorpe RR, Riva A, Casella G, Hadwin AKM, Kent AD, et al. Pyrosequencing enumerates and contrasts soil microbial diversity. ISME J. 2007;1:283–290. doi: 10.1038/ismej.2007.53. [DOI] [PMC free article] [PubMed] [Google Scholar]
- Rusch DB, Halpern AL, Sutton G, Heidelberg KB, Williamson S, Yooseph S, et al. The Sorcerer II Global Ocean Sampling expedition: Northwest Atlantic through Eastern Tropical Pacific. PLoS Biol. 2007;5:e77. doi: 10.1371/journal.pbio.0050077. [DOI] [PMC free article] [PubMed] [Google Scholar]
- Schloss PD, Handelsman J. Introducing DOTUR, a computer program for defining operational taxonomic units and estimating species richness. Appl Environ Microbiol. 2005;71:1501–1506. doi: 10.1128/AEM.71.3.1501-1506.2005. [DOI] [PMC free article] [PubMed] [Google Scholar]
- Schloss PD, Handelsman J. Toward a census of bacteria in soil. PLoS Comput Biol. 2006;2:e92. doi: 10.1371/journal.pcbi.0020092. [DOI] [PMC free article] [PubMed] [Google Scholar]
- Shannon CE. A mathematical theory of communication. Bell System Tech J. 1948;27:623–656. [Google Scholar]
- Shaw AK, Halpern AL, Beeson K, Tran B, Venter JC, Martiny JBH. It's all relative: ranking the diversity of aquatic bacterial communities. Environ Microbiol. 2008;10:2200–2210. doi: 10.1111/j.1462-2920.2008.01626.x. [DOI] [PubMed] [Google Scholar]
- Shen TJ, Chao A, Lin CF. Predicting the number of new species in further taxonomic sampling. Ecology. 2003;84:798–804. [Google Scholar]
- Simpson EH. Measurement of diversity. Nature. 1949;163:688. [Google Scholar]
- Sloan WT, Quince C, Curtis TP.2008The uncountablesIn: Zengler K (ed)Accessing Uncultivated Microorganisms: From the Environment to Organisms and Genomes and Back ASM Press; 35–54. [Google Scholar]
- Sogin ML, Morrison HG, Huber JA, Welch DM, Huse SM, Neal PR, et al. Microbial diversity in the deep sea and the underexplored ‘rare biosphere'. Proc Natl Acad Sci USA. 2006;103:12115–12120. doi: 10.1073/pnas.0605127103. [DOI] [PMC free article] [PubMed] [Google Scholar]
- Stackebrandt E, Frederiksen W, Garrity GM, Grimont PAD, K¨ampfer P, Maiden MCJ, et al. Report of the ad hoc committee for the re-evaluation of the species definition in bacteriology. Int J Syst Evol Microbiol. 2002;52:1043–1047. doi: 10.1099/00207713-52-3-1043. [DOI] [PubMed] [Google Scholar]
- Tettelin H, Masignani V, Cieslewicz MJ, Donati C, Medini D, Ward NL, et al. Genome analysis of multiple pathogenic isolates of Streptococcus agalactiae: Implications for the microbial ‘pan-genome'. Proc Natl Acad Sci USA. 2005;102:13950–13955. doi: 10.1073/pnas.0506758102. [DOI] [PMC free article] [PubMed] [Google Scholar]
- Torsvik V, Salte K, Sorheim R, Goksoyr J. Comparison of phenotypic diversity and DNA heterogeneity in a population of soil bacteria. Appl Environ Microbiol. 1990;56:776–781. doi: 10.1128/aem.56.3.776-781.1990. [DOI] [PMC free article] [PubMed] [Google Scholar]
- Whitman WB, Coleman DC, Wiebe WJ. Prokaryotes: the unseen majority. Proc Natl Acad Sci USA. 1998;95:6578–6583. doi: 10.1073/pnas.95.12.6578. [DOI] [PMC free article] [PubMed] [Google Scholar]
- Wilson EO. The Diversity of Life. W.W. Norton & Company; 1999. [Google Scholar]
Associated Data
This section collects any data citations, data availability statements, or supplementary materials included in this article.