[go: up one dir, main page]

Article

Gibberellin Inhibitors Molecules as a Safeguard against Secondary Growth in Garlic Plants

by
Iandra Rocha Barbosa
1,
Luciana de Paula Cruz
1,
Raissa Iêda Cavalcanti da Costa
2,
Bruno Henrique Rocha
2,
Vinícius Guimarães Nasser
3,
Geraldo Humberto Silva
4 and
Willian Rodrigues Macedo
5,*
1
Independent Researcher, Rio Paranaíba 38810-000, Brazil
2
Institute of Agricultural Science, Universidade Federal de Viçosa, Campus Rio Paranaíba, Rio Paranaíba 38810-000, Brazil
3
Diretoria de Pesquisa e Pós-graduação, Universidade Federal de Viçosa, Campus Rio Paranaíba, Rio Paranaíba 38810-000, Brazil
4
Institute of Exact Science, Universidade Federal de Viçosa, Campus Rio Paranaíba, Rio Paranaíba 38810-000, Brazil
5
Coordenadoria Especial de Ciências Biológicas e Agronômicas, Universidade Federal de Santa Catarina, Campus Curitibanos, Curitibanos 89520-000, Brazil
*
Author to whom correspondence should be addressed.
Crops 2024, 4(3), 379-399; https://doi.org/10.3390/crops4030027
Submission received: 30 June 2024 / Revised: 26 July 2024 / Accepted: 12 August 2024 / Published: 14 August 2024
Figure 1
<p>Garlic biometric parameters under controlled conditions: (<b>A</b>) plant height, (<b>B</b>) shoot dry matter, (<b>C</b>) secondary growth index, and (<b>D</b>) secondary growth in plants subjected to growth regulators. Treatments: 1 (control), 2 (deficit irrigation), 3 (ABA), 4 (trinexapac-ethyl), 5 (chlormequat chloride), and 6 (paclobutrazol) for 28 days. Minor letters indicate the comparison of the means within the same period by the <span class="html-italic">LSD test</span> (95%).</p> ">
Figure 2
<p>Garlic biometric parameters in the first field experiment (2020 growing season): (<b>A</b>) plant height (cm) at 53 DAP; (<b>B</b>) fresh matter of bulb (g); and (<b>C</b>) garlic secondary growth (%), subjected to treatments: deficit irrigation + trinexapac-ethyl (DI + TE); trinexapac-ethyl (TE); chlormequat chloride (CCC); paclobutrazol (PBZ); and additional treatment (deficit irrigation). Capital letters indicate differences among gibberellin inhibitors in the application times (two or three sprayings), and minor letters indicate differences among gibberellin inhibitors between application numbers (two or three sprayings) by the <span class="html-italic">SNK test</span> (5% significance). The symbol (*) above bars indicates differences that are significant by orthogonal contrasts (<span class="html-italic">t</span>-test), at a level of 5% significance.</p> ">
Figure 3
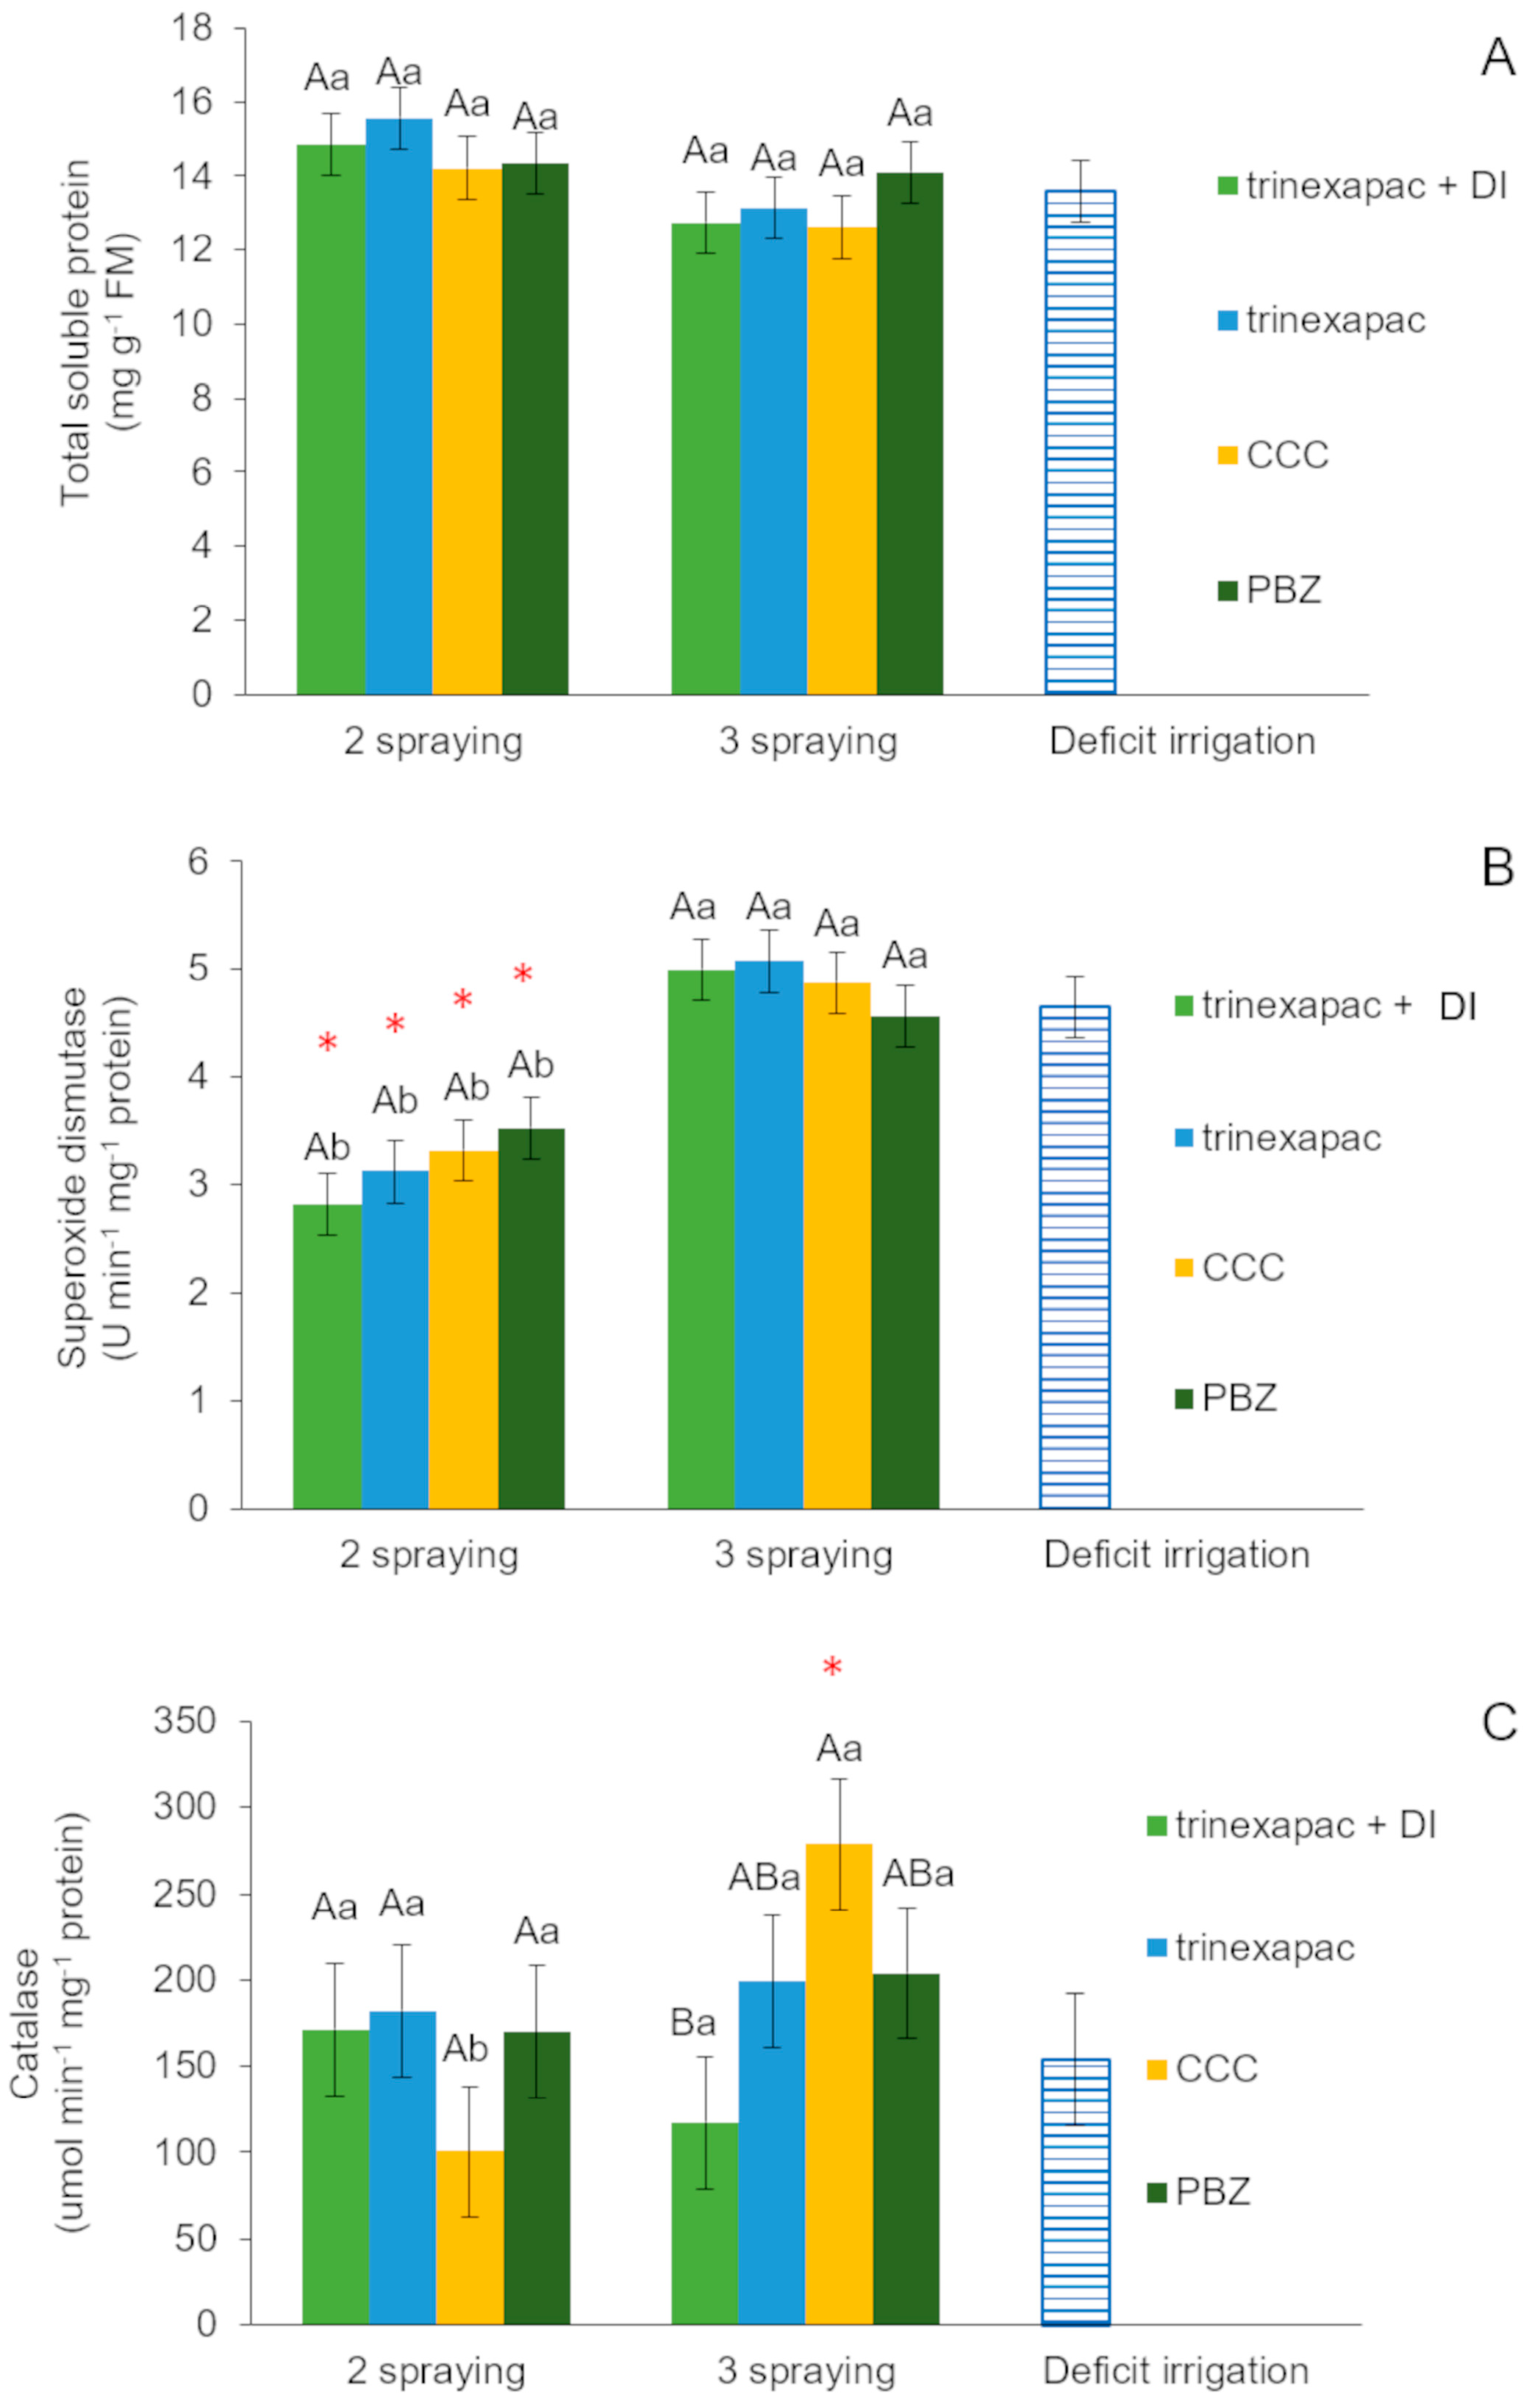
<p>Garlic biochemical parameters in the first field experiment (2020 growing season): (<b>A</b>) total soluble protein (mg g<sup>−1</sup> FM); (<b>B</b>) superoxide dismutase (U min<sup>−1</sup> mg<sup>−1</sup> protein); and (<b>C</b>) catalase (µmol min<sup>−1</sup> mg<sup>−1</sup> protein), subjected to treatments: deficit irrigation + trinexapac-ethyl (DI + TE); trinexapac-ethyl (TE); chlormequat chloride (CCC); paclobutrazol (PBZ); and additional treatment (deficit irrigation). Capital letters indicate differences among gibberellin inhibitors in the application times (two or three sprayings), and minor letters indicate differences among gibberellin inhibitors between application numbers (two or three sprayings) by the <span class="html-italic">SNK test</span> (5% significance). The symbol (*) above bars indicates differences that are significant by orthogonal contrasts (<span class="html-italic">t</span>-test), at a level of 5% significance.</p> ">
Figure 4
<p>Garlic gas exchange parameters in the first field experiment (2020 growing season): (<b>A</b>) Net CO<sub>2</sub> assimilation—<span class="html-italic">A</span> (μmol∙m<sup>−2</sup>∙s<sup>−1</sup>); (<b>B</b>) foliar transpiration—<span class="html-italic">E</span> (mmol∙m<sup>−2</sup>∙s<sup>−1</sup>); (<b>C</b>) intercellular CO<sub>2</sub> concentration—C<span class="html-italic">i</span> (Pa); (<b>D</b>) stomatal conductance—<span class="html-italic">gs</span> (mmol∙m<sup>−2</sup>∙s<sup>−1</sup>), subjected to treatments: deficit irrigation + trinexapac-ethyl (DI + TE); trinexapac-ethyl (TE); chlormequat chloride (CCC); paclobutrazol (PBZ); and additional treatment (deficit irrigation). Capital letters indicate differences among gibberellin inhibitors in the application times (two or three sprayings), and minor letters indicate differences among gibberellin inhibitors between application numbers (two or three sprayings) by the <span class="html-italic">SNK test</span> (5% significance). The symbol (*) above bars indicates differences that are significant by orthogonal contrasts (<span class="html-italic">t</span>-test), at a level of 5% significance.</p> ">
Figure 5
<p>Garlic production parameters in the first field experiment (2020 growing season): (<b>A</b>) garlic productivity (Kg of fresh matter per hectare); (<b>B</b>) garlic bulb class (2 sprayings); (<b>C</b>) garlic bulb class (3 sprayings), subjected to treatments: deficit irrigation + trinexapac-ethyl (DI + TE); trinexapac-ethyl (TE); chlormequat chloride (CCC); paclobutrazol (PBZ); and additional treatment (deficit irrigation). Capital letters indicate differences among gibberellin inhibitors in the application times (two or three sprayings), and minor letters indicate differences among gibberellin inhibitors between application numbers (two or three sprayings) by the <span class="html-italic">SNK test</span> (5% significance). The symbol (*) above bars indicates differences that are significant by orthogonal contrasts (<span class="html-italic">t</span>-test), at a level of 5% significance.</p> ">
Figure 6
<p>Garlic biometric parameters in the second field experiment (2023 growing season), where: (<b>A</b>) plant height (cm), at 50 DAP; (<b>B</b>) plant height (cm), at 57 DAP; and (<b>C</b>) garlic secondary growth (%), subjected to treatments: reference, trinexapac-ethyl (two sprayings), trinexapac-ethyl (three sprayings). Means were compared by the <span class="html-italic">SNK test</span> (5% significance). Averages followed by the same minor letter do not differ statistically by the <span class="html-italic">SNK test</span> (5% of significance).</p> ">
Figure 7
<p>Biochemical parameters in the second field experiment (2023 growing season), where: (<b>A</b>) total soluble protein (mg g<sup>−1</sup> FM); (<b>B</b>) superoxide dismutase (U min<sup>−1</sup> mg<sup>−1</sup> protein); and (<b>C</b>) catalase (µmol min<sup>−1</sup> mg<sup>−1</sup> protein), subjected to treatments: reference, trinexapac-ethyl (two sprayings), trinexapac-ethyl (three sprayings). Means were compared by the <span class="html-italic">SNK test</span> (5% significance). Averages followed by the same minor letter do not differ statistically by the <span class="html-italic">SNK test</span> (5% of significance).</p> ">
Figure 8
<p>Gas exchange parameters in the second field experiment (2023 growing season), where: (<b>A</b>) Net CO<sub>2</sub> assimilation—<span class="html-italic">A</span> (μmol∙m<sup>−2</sup>∙s<sup>−1</sup>); (<b>B</b>) foliar transpiration—<span class="html-italic">E</span> (mmol∙m<sup>−2</sup>∙s<sup>−1</sup>); (<b>C</b>) intercellular CO<sub>2</sub> concentration—C<span class="html-italic">i</span> (Pa); and (<b>D</b>) stomatal conductance—<span class="html-italic">gs</span> (mmol∙m<sup>−2</sup>∙s<sup>−1</sup>), subjected to treatments: reference, trinexapac-ethyl (two sprayings), trinexapac-ethyl (three sprayings). Means were compared by the <span class="html-italic">SNK test</span> (5% significance). Averages followed by the same minor letter do not differ statistically by the <span class="html-italic">SNK test</span> (5% of significance).</p> ">
Figure 9
<p>Garlic production parameters in the second field experiment (2023 growing season): (<b>A</b>) bulb production per area (unit per m<sup>−2</sup>); (<b>B</b>) garlic productivity (kg of fresh matter per hectare); (<b>C</b>) garlic bulb class, subjected to treatments: reference, trinexapac-ethyl (2 spraying), trinexapac-ethyl (three sprayings). Means were compared by the <span class="html-italic">SNK test</span> (5% significance). Averages followed by the same minor letter do not differ statistically by the <span class="html-italic">SNK test</span> (5% of significance).</p> ">
Review Reports Versions Notes

Abstract

:
Secondary growth in garlic depreciates its visual aspect and thereby renders the crop unviable for trade. Therefore, farmers commonly reduce fertilization and impose drought and oxidative stress caused by high-dose pesticides to reduce secondary growth in garlic plants. However, these procedures can be considered adverse, unhealthy, and environmentally inappropriate. To remedy this scenario, we investigated whether spraying growth inhibitors would prevent secondary growth in garlic plants. First, we evaluated the effects of abscisic acid, trinexapac-ethyl, chlormequat chloride, and paclobutrazol treatments on garlic plants grown in polyethylene tanks (250 m3). We then analyzed the effects of deficit irrigation combined with the application of trinexapac-ethyl (sprayed two or three times) and the application of trinexapac-ethyl, chlormequat chloride, or paclobutrazol alone (each sprayed two or three times) on garlic plants grown in the field, comparing them with the effects of deficit irrigation (control treatment) alone. The in-field experiment was replicated with the following treatments: control (deficit irrigation) and trinexapac-ethyl (sprayed two or three times) treatments. We analyzed the physiological, biometric, and production parameters affecting secondary growth in garlic plants. We observed that trinexapac-ethyl could efficiently regulate secondary growth without causing physiological disturbances in garlic plants. Our results provide valuable information that will contribute to the development of a sustainable technique to replace the current practices used by farmers to prevent secondary growth in garlic plants.

1. Introduction

Growing garlic in the tropical and subtropical biomes of Brazil requires specific crop management, such as artificial vernalization (or cold conditioning) of garlic cloves before planting [1,2] and the proper management of the fertilization and irrigation of plants during the plant phenological cycle [3]. In the first scenario, artificial vernalization is necessary to induce bulb formation in the noble garlic cultivars (up to 20 cloves per bulb). However, this procedure also induces secondary growth, a genetic-physiological disorder wherein cloves sprout prematurely [4], promoting unstandardized growth in garlic, which results in a garlic crop with low commercial value.
Secondary growth is one of the main causes of low garlic yields in tropical regions. This physiological disturbance can be characterized by the formation of leaves of lateral buds before they form the normal leaves constituting cloves (Supplementary Figure S1) [5].
A considerable number of horticulturists from the Cerrado biome have consolidated agricultural practices to reduce secondary growth, such as a reduction in the rate of nitrogen fertilization [6,7], diminished water supply during differentiation in the phenological cycle [8], and the promotion of abiotic stress through the foliar spraying of herbicides [9]. These practices help simulate abiotic stress conditions that favor the expression of signaling compounds involved in plant defense, particularly the expression of abscisic acid (ABA), an essential messenger of adaptive responses to abiotic stress [10]. Nonetheless, these practices seek to reduce secondary growth in garlic plants [11].
Nevertheless, these procedures can lead to a few negative features, e.g., low nitrogen availability during garlic bulb expansion [12]; water scarcity in garlic plants, thereby reducing the photosynthesis rate, fresh weight, and leaf water content [13]; and the induction of gene expression for encoding ABA biosynthetic and catabolic enzymes, heat shock proteins, and E3 ubiquitin ligase [14]. Additionally, the foliar spraying of herbicides as growth retardants is not fully efficient in controlling physiological disturbances [9], and the residues of these molecules can increase the risk of their persistence in the environment [15], leading to phytotoxicity in successive crops [16].
The uniform sprouting of garlic bulbs requires an adequate balance between the gibberellin (GA) and ABA contents [17]. According to Moon and Lee [18], high GA concentrations trigger significant secondary growth during garlic bulb formation. Therefore, active GAs are linked to secondary growth in garlic plants. Furthermore, GAs control the expression of zeatin riboside genes and the accumulation of total soluble proteins (TSPs) in the plant stalk and increase the levels of GA3, sucrose, and fructose at the stage of axillary bud outgrowth [19].
Thus, it appears that plant-growth-retardant compounds have the potential to regulate plant physiology, previously observed in garlic crops with cloves treated with paclobutrazol (PBZ, a GA biosynthesis inhibitor), resulting in the control of secondary growth [6]. Therefore, it is necessary to understand the in vivo activities of these formulations by analyzing their persistence, absorption, and translocation in plant tissues and verifying the absence of the harmful effects of growth inhibitors to ensure their use in horticulture [20].
Among these molecules capable of retarding plant growth, trinexapac-ethyl (TPE), (2-chloroethyl)trimethylammonium chloride (CCC), and paclobutrazol (PBZ) stand out, and both molecules act by inhibiting gibberellin biosynthesis [20]. In the agricultural scenario, it is known that ETP is largely applied to cereal crops to avoid plant lodging, consequently reduce plant height, strengthen stem structure, and thereby stabilize grain yield [21]. For CCC, Ram and colleagues [22] established garlic plants with characteristics more appropriate to the consumer and with gains in production when this regulator was applied at 1000 ppm. While for PBZ, Resende and Souza [23] proved it to be a growth inhibitor that significantly reduced secondary growth in garlic at a concentration of 1163 mg L−1.
In summary, there is an urgent need to develop new technologies with broad applications to control secondary growth in garlic crops. Therefore, in this study, we aimed to investigate the role of GA inhibitors in the modulation of secondary growth in garlic crops and to refine the best practices for mitigating this physiological disorder.

2. Materials and Methods

The study was conducted in two stages. First, we conducted an exploratory assay wherein plants were grown in polyethylene tanks with 250 dm3 of capacity to evaluate the most suitable treatments for remediating this physiological disturbance. In the second stage, we conducted two field experiments during the 2020 and 2023 growing seasons of garlic to analyze the potential of the use of growth inhibitors as potential crop management strategies and their impact on crop productivity.

2.1. First Experiment: Exploratory Analysis under Controlled Conditions

The experiments were carried out in the experimental sector of the Federal University of Viçosa–Campus Rio Paranaíba (19°11′39″ S; 46°14′37″ W) at an altitude of 1073 m from March to August 2018. Garlic cloves were vernalized in cold storage rooms, where bulbs were pre-conditioned for 10 days between 10 and 15 °C. After being subjected to artificial vernalization, the garlic cloves remained viable for 50 days at a temperature of 2.0 °C and 65% relative humidity. Of these vernalized cloves, 18 cloves of the variety Ito were selected and sown at 1 cm depth inside each polyethylene tank (250 dm3). These cloves were planted in two rows containing nine cloves each, with a spacing of 12 cm between rows and 9 cm between plants.
The polyethylene tanks were filled with a soil substrate based on clayey-textured Red Latosol soil. The substrate was amended with dolomitic limestone (28% CaO, 15% MgO, and an 80% neutralization potential ratio) at 207 g per polyethylene tank. The fertilization applied included single superphosphate (18% P2O5; 20% Ca) at 152.19 g per polyethylene tank, mono ammonium phosphate (10% N; 46% P2O5) at 35.80 g per polyethylene tank, and potassium chloride (60% K2O) at 12.62 g per polyethylene tank. Topdressing was carried out with Ca(NO3)2 (15% N; 19% Ca) at 12.25 g per polyethylene tank and H3BO3 (17% B) at 0.294 g per polyethylene tank, and during the differentiation of lateral buds [24] at 76 days after planting (DAP), it included Ca(NO3)2 (15% N; 19% Ca) at 25.72 g per polyethylene tank and purified mono ammonium phosphate (11% N; 60% P2O5) at 14.70 g per polyethylene tank.
At 45 DAP, before bulb differentiation [24], the plants were subjected to the following treatments: T1—plants subjected to continuous irrigation, with no application of growth inhibitors (to promote secondary growth); T2—plants were subjected to deficit irrigation (DI), i.e., irrigation restriction for 15 days (polyethylene tanks were covered using a lid made of transparent plastic to avoid wetting but allowing the photosynthetic radiation); T3—plants treated with a foliar spray of 1 × 10⁻⁶ M ABA (PhytoTech Labs, Lenexa, KS, USA); T4—plants treated with 0.5 mL∙m−2 Moddus® (Syngenta, São Paulo, SP, Brazil) (trinexapac-ethyl, TPE); T5—plants treated with 0.05 mL∙m−2 Tuval® (Tradecorp, Hortolândia, SP, Brazil) (chlormequat chloride, CCC); and T6—plants treated with 0.5 mL∙m−2 Cultar 250 SC® (Syngenta, Brazil) (PBZ). All treatments consisted of four replicates, totaling 24 experimental units.

Plant Biometry and Secondary Growth in Garlic

Shoot height was measured using a ruler at 52, 59, 66, and 80 DAP. For shoot dry matter assessment, a selected plant was harvested and segmented into shoot and root. A plant from each treatment group, with 4 replications, was collected, oven-dried (65 °C), and weighed after 72 h. At 105 DAP, all plants were removed from the polyethylene tanks, classified based on the presence or absence of secondary growth, and photographed.

2.2. Growing Season of 2020: Confirmatory Analysis in the Field

2.2.1. Experimental Environment and Treatments

The experiment was conducted at Sekita Farm, Rio Paranaíba, Minas Gerais (MG), Brazil (19°18′29.41″ S; 46°10′05.75″ W) at an altitude of 1133 m. Garlic bulbils (categorized as class 6 and 7 garlic, approximately 56 mm in diameter) were cultivated on 30 March 2020, and harvested on 25 July 2020, showing a phenological cycle of 117 days. The soil was classified as clayey Oxisol, and its chemical characteristics are listed in Supplementary Table S1. Plants in the control treatment were sprayed, as needed, with fungicides and insecticides to prevent diseases and pests, respectively.
Fertilization was performed during the crop cycle with a nitrogen–phosphorus–potassium (NPK) formulation consisting of 196.5 kg of N per ha, 1298 kg of P2O5 per ha, and 363 kg of K2O per ha (Supplementary Table S2) to achieve adequate plant growth and high productivity. The cultivar Ito was chosen because it is one of the most planted cultivars in Brazil. Field cropping was conducted in double rows, with a distance of 9 cm between plants and 12 cm between rows, and the distance between the double rows was 40 cm, which resulted in a population of 367,656 plants per hectare. Each plot had approximately 30 plants per plot in 0.8 m2 of area. The garlic cloves were sown to a depth of 1 cm.
In this experiment, we evaluated the following nine treatments: T1—DI + application of 0.0125 g∙m−2 of TPE (Syngenta, São Paulo, SP, Brazil), T2—application of 0.125 g∙m−2 of TPE (Syngenta, São Paulo, SP, Brazil), T3—application of 0.005 g m−2 of CCC (Tradecorp, Hortolândia, SP, Brazil), and T4—application of 0.0125 g∙m−2 of PBZ (Syngenta, São Paulo, SP, Brazil), wherein the doses of the GA inhibitors were applied two times each in the T1–T4 treatments (Table 1); T5—DI + application of 0.0125 g∙m−2 of TPE (Syngenta, São Paulo, SP, Brazil), T6—application of 0.125 g∙m−2 of TPE (Syngenta, São Paulo, SP, Brazil), T7—application of 0.005 g∙m−2 of CCC (Tradecorp, Hortolândia, SP, Brazil), and T8—application of 0.0125 g∙m−2 of PBZ (Syngenta, São Paulo, SP, Brazil), with the treatment doses applied three times each in the T5–T8 treatments (Table 1); and T9—DI as control treatment (not sprayed). This experiment reinforces the use of each growth regulator at distinct doses, depending on the treatments used in this assay. The treatment doses and their spraying schedules were adjusted based on the observations recorded in the first exploratory assay.
The first spraying in all treatments was carried out at 39 DAP at the bulb differentiation phase [24]. In the T1–T4 treatments, the second, i.e., the last, spraying was applied at 46 DAP, whereas in the treatments T5–T8, the second and third sprayings were applied at 44 and 49 DAP, respectively (Table 1). Spraying was performed with an electric sprayer of 9 L capacity (model 7015, Mundi, Lages, SC, Brazil) under constant pressure (3 bar). The treatment volume applied in the experiment was 10.0 mL∙m−2, and each experimental block had an area of 3.23 m2 (with 30 garlic plants).
During bulb differentiation, the center pivot irrigation systems were turned off between May 8 and 30, except on May 11 (3.23 mm) and June 1 (4.04 mm), with precipitation recorded on May 15, 17, 23, and 24. The mean values for the irrigation, rainfall, and temperature data recorded in the field assay conducted in the 2020 growing season of garlic during the experimental period covering the start of cultivation to harvest were recorded from March to July: 82 mm of mean irrigation; 282.81 of mean rainfall, and 20.5 °C of mean temperature. Furthermore, in treatments T2, T3, and T4, irrigation was conducted manually using a plastic watering kettle to maintain the field capacity of the garlic crops. To accomplish this task, the decision-making was carried out with the assistance of agricultural weather station monitoring (iCrop Technology, Uberlândia, MG, Brasil).

2.2.2. Plant Biometry

Approximately 72 h after the last spraying of the growth regulators at 49 DAP in blocks with two sprayings and 52 DAP in blocks with three sprayings, plant height increased after the differentiation phase of garlic cloves. Therefore, 16 plants from each treatment group were selected randomly at these stages, and plant height was measured from ground level to the apex of the leaves using a ruler.

2.2.3. Gas Exchange in Garlic Leaves

Leaf gas exchange measurements were performed at the same time points as those used for plant biometric analysis, i.e., 72 h after the last spraying of GA inhibitors at 49 and 52 DAP in blocks with two and three sprayings, respectively. The measurements were performed in the middle-third portion of each fully expanded leaf. The procedure was conducted from 9:00 a.m. to 11:00 a.m. with a portable infrared gas analyzer (LI-6400XT; LI-COR Inc., Lincoln, NE, USA) coupled with a modular fluorometer (LCF-40; LI-COR Inc., Lincoln, NE, USA) under the photosynthetically active radiation (PAR) of 1000 μmol∙m−2∙s−1, where we evaluated net CO2 assimilation, stomatal conductance, leaf transpiration, and intercellular CO2 concentration. In leaf gas exchange measurements, the reference CO2 levels ranged between 392 and 398 ppm, leaf temperature ranged from 22.8 to 23.1 °C, and atmospheric humidity ranged between 56.3 and 69.9%.

2.2.4. Total Soluble Protein Content and the Activities of Antioxidant Enzymes

The TSP content was determined using the Bradford method [25]. The reaction mix was prepared using 20 μL of the protein extract and added to 3.0 mL of Bradford’s reagent (LGC Biotecnologia, Cotia, SP, Brazil). The procedure was performed using a spectrophotometer at 595 nm, and the TSP content was calculated based on a standard curve prepared using bovine serum albumin. The results are expressed in milligrams of protein per gram of fresh matter.
Superoxide dismutase (SOD; EC 1.15. 1.1) activity was quantified as previously described [26], and the results are expressed in enzyme units per minute per milligram of TSP content. In addition, catalase (CAT; EC 1.11. 1.6) activity was determined using a previously described method [27], and the results are expressed in micromoles of CAT per minute per milligram of TSP content.

2.2.5. Secondary Growth Index and Garlic Production Parameters

At 117 DAP, at the beginning of leaf senescence, all plants in the experimental area were harvested, excluding those in the experimental border (0.36 m). After the bulbs were classified based on the presence or absence of secondary growth, the mean values were expressed in percentages (%). After the plants evaluated for secondary growth index were cut (eliminating the shoots and roots of garlic), only fresh garlic bulbs were maintained and later weighed to obtain the fresh weight of garlic bulbs and garlic productivity (kilograms of fresh matter per hectare). Garlic bulbs continue to be classified based on the greater transverse diameter of the bulb (mm) following the criteria published in Ordinance #242, 17 September 1992 [28] into class 3 (32–37 mm), class 4 (37–42 mm), class 5 (42–47 mm), class 6 (47–56 mm), and class 7 (>56 mm) garlic.

2.3. Growing Season of 2023: Confirmatory Analysis in the Field

2.3.1. Experimental Environment and Treatments

The bioassay was conducted at Glória Farm, Rio Paranaíba, MG, Brazil (19°11′09.1″ S; 46°10′23.7″ W) at 950 m altitude, wherein the cloves of the cultivar Ito, categorized as class 6 and 7 garlic (~56 mm in diameter), were sown on 5 April 2023 and harvested on 25 July 2023 with 111 days of phenological cycle. The soil was clayey Oxisol, and its chemical composition is presented in Supplementary Table S3. Diseases and pests were controlled by fungicide and insecticide spraying as needed.
Fertilization was performed during the crop cycle with an NPK formulation consisting of 356 kg of N per ha, 1616 kg of P2O5 per ha, and 471 kg of K2O per ha (Supplementary Table S4) to achieve adequate plant growth and high productivity. In the second experiment, the Ito cultivar was also used. Field cropping was conducted in double rows, with a distance of 8.5 cm between plants and 12 cm between rows, and the distance between the double rows was 55 cm. Each experimental unit had an area of 3 m × 2.4 m, which resulted in a population of 392,156 plants per hectare. Each plot had approximately 90 plants in 2.3 m2 of area. The cloves were sown at a depth of 1 cm.
In the field experiments conducted in 2023, we analyzed the following three treatments considered most promising based on the 2020 crop: T1—control treatment (Deficit Irrigation—DI; not sprayed), T2—DI associated with application of 0.125 g∙m−2 of TPE (Syngenta, São Paulo, SP, Brazil) (sprayed two times), and T3—DI associated with application of 0.125 g∙m−2 of TPE (Syngenta, São Paulo, SP, Brazil) (sprayed three times) (Table 2). The first application was performed before the differentiation phase of garlic cloves [24].
Irrigation was performed to reach a water depth of 360 mm during the cultivation period via a central pivot to efficiently meet the water demands of the crop. The mean values for the irrigation, rainfall, and temperature data recorded in the field assay conducted in the 2023 growing season of garlic during the experimental period covering the sowing of cloves to harvest were recorded from March to July: 253.5 mm of mean irrigation; 106.5 mm of mean rainfall, and 19.6 °C of mean temperature. In this assay, irrigation was not applied continuously and was suppressed during plant differentiation to avoid secondary growth in garlic.
The foliar spraying of the treatment doses of TPE was performed with the aid of an electric sprayer (Mundi 7015) with a capacity of 9 L under constant pressure (3 bar). The treatment volume used in the experiment was 10 mL∙m−2, and each experimental block had an area of 3.23 m2 (with 30 garlic plants).

2.3.2. Gas Exchange in Garlic Leaves

Leaf gas exchange measurements were performed 72 h after the last spraying of the growth inhibitors. The measurements were recorded between 9:00 and 11:00 a.m. in the middle third portion of fully expanded leaves. With the aid of the portable infrared gas analyzer (LI-6400XT; LI-COR Inc., Lincon, NE, USA) coupled with a modular fluorometer (LCF-40; LI-COR Inc., Lincon, NE, USA) under a PAR of 1000 μmol∙m−2∙s−1, we evaluated CO2 assimilation, stomatal conductance, leaf transpiration, and intercellular CO2 concentration. In leaf gas exchange measurements, the reference CO2 levels ranged between 402.7 and 415 ppm, leaf temperature ranged from 20.9 to 23.2 °C, and atmospheric humidity ranged between 47.5 and 54%.

2.3.3. Plant Biometry

At 148 h after the last spraying of the growth regulators, plant height was measured three times (50 and 57 DAP). Ten plants from each treatment group were selected randomly, and plant height (cm) was measured from the ground level to the apex of the leaves using a ruler.

2.3.4. Total Soluble Protein Content and the Activities of Antioxidant Enzymes

In the field experiments conducted in the 2023 growing season, we measured the TSP content [25] and the activities of the antioxidant enzymes SOD [26] and CAT [27] following the same protocols as those used in the 2020 growing season.

2.3.5. Secondary Growth Index and Garlic Production Parameters

All plants were harvested at 111 DAP, conditioned in raffia bags, and transported to the laboratory. Subsequently, the bulbs were classified based on the presence or absence of secondary growth, with the mean values expressed in percentages (%). The leaves and roots of these plants were removed to maintain only fresh garlic bulbs. Later, these bulbs were weighed to obtain the fresh weight of garlic bulbs and to estimate garlic productivity (kilograms of fresh matter per hectare). Garlic bulbs continue to be classified following the Brazilian classification system [28].

2.4. Statistical Analyses

The first experiment was arranged in a completely randomized block design with four replicates. The data were verified for normality and homogeneity of the variances and subjected to analysis of variance. The least significant difference test compared the means at 5% significance using SISVAR software, version 5.6 [29].
In the second experiment, a factorial design (2 × 4 + 1) with four replicates was used, where the values “2” and “4” represent the number of applications and the number of plant growth regulators used, respectively, and “1” represents an additional control treatment (without regulators). The results of the growth inhibitor treatments were compared using the Student–Newman–Keuls (SNK) test, and the results of the control treatment were compared with those of the growth inhibitor treatments using orthogonal contrasts (t-test). The mean values for the in-field analysis performed in the 2023 growing season were compared using the SNK test. All statistical analyses for the data obtained from the in-field experiments were performed using the spreadsheet program SPEED Stat [30], and the correlation analysis between garlic productivity and secondary growth was performed using Excel® software (Home & Student 2019). In the bulb category analysis, a descriptive approach was used to present the percentage of each class. All figures were plotted in Microsoft Excel® 2019.

3. Results

3.1. Exploratory Experiments

Shoot height (Figure 1) of plants grown in polyethylene tanks, measured at 52, 59, 66, and 80 DAP, was relatively more strongly affected in the DI treatment group than in the other treatment groups. In the DI treatment group, a significant reduction in shoot height was observed at 59, 66, and 80 DAP. Moreover, in the PBZ treatment group, reductions in shoot height were observed at 59 and 66 DAP. In contrast, in the control treatment group, remarkable vegetative shoot growth was observed at 52 and 66 DAP. However, no significant differences were observed between the other treatments. No differences in shoot dry mass were found (Figure 1) among all treatments in the first analysis at 52 DAP; however, under the DI treatment, relatively less accumulation of dry mass was recorded at 59, 66, and 80 DAP. The ABA treatment showed a significant reduction in shoot dry mass at 59 DAP; however, no significant differences were observed at 66 and 80 DAP. Regarding secondary growth (Figure 1) in garlic crops, adequate control of this genetic-physiological anomaly was observed in plants subjected to the DI treatment at 105 DAP. In addition, the TPE treatment resulted in a relatively low secondary growth index, whereas the performance efficiencies of the other treatments were poor, with the same results as those in the control treatment.

3.2. Confirmatory Experiments

3.2.1. First Field Experiment (2020 Growing Season)

The plant height of garlic was different between the treatments, as TPE sprayed two or three times, with or without DI, significantly inhibited the growth of garlic shoots, whereas spraying PBZ two or three times and CCC two times proved to be inefficient in shoot growth regulation (Figure 2). Moreover, the TPE treatment applied in two or three sprayings, either alone or in combination with DI, significantly reduced the fresh matter yield and secondary growth in garlic compared with that in the DI treatment (orthogonal contrast analysis). Additionally, the CCC treatment, applied two times, showed promise in controlling secondary growth (Figure 2).
The use of different plant growth regulators and variations in their spraying schedules did not result in differences in the TSP content of garlic in the GA inhibitor treatments compared with that in the control treatment, wherein garlic was grown under DI (Figure 3). However, when evaluating marginal means following previously described criteria [31], wherein the interpretation of factorial treatment effects is based on separate main effects (marginal means) without losing treatment information, the differences in the TSP content were meaningful, as two sprays led to a higher TSP content (mean = 14.74 A) than with three sprays (mean = 13.15 B). Among the antioxidant enzymes, the antioxidant activity of ascorbate peroxidase was not detectable in the spectrophotometric analysis. However, the use of different plant growth regulators and variations in their spraying schedules resulted in marked differences in the activities of SOD and CAT in the GA inhibitor treatments compared with those in the control treatment. The application of all GA inhibitors reduced the activity of SOD (when applied twice) compared with that in the control treatment (DI), with mean values less than those obtained when the same GA inhibitors were sprayed three times (Figure 3). In the CAT activity analysis, only the CCC treatment with three sprayings showed a higher value than that in the control treatment (DI), and the CCC treatment with three sprayings showed the lowest mean values for CAT activity among all treatments (Figure 3).
Further, in the leaf gas exchange analysis, we could verify that a reduction in CO2 assimilation occurred only in the TPE (sprayed three times) + DI treatment group compared with that in the conventional treatment group (DI alone). Similar results were observed for leaf transpiration and stomatal conductance; however, in the leaf transpiration analysis, the highest mean observed was for the TPE (sprayed two times) + DI treatment group. None of the treatments showed a significant difference in intercellular CO2 concentrations (Figure 4).
The estimated productivity of garlic in this experiment was associated with the potential effects of growth inhibitors. In the blocks subjected to two or three sprayings, the use of the TPE treatment alone or in combination with DI resulted in the lowest mean productivity when analyzed by orthogonal contrast (Figure 5). These treatments exhibited a trend similar to that observed in the analyses for plant height, fresh weight of garlic bulbs, and secondary growth in garlic (Figure 5).
Descriptive analysis revealed different bulb classifications based on the treatments and spraying schedules. The control (DI) treatment resulted in a smaller number of garlic classes (four); however, classes 6, 7, and 8 were observed to be the majority in the PBZ and ETP treatment groups (with two sprayings). The application of all growth regulators reduced the percentage of classes 6, 7, and 8 compared with that in the control (DI) treatment group.

3.2.2. Second Field Experiment (2023 Growing Season)

Plant growth was not altered after 7 and 14 days of the treatment applications (Figure 6) and remained constant even after the application of products capable of downregulating plant growth. There were no differences in secondary growth among the treatments; however, a linear decrease occurred when TPE was applied (Figure 6).
In the TSP content analysis, no significant changes were observed after the application of the treatments (Figure 7). However, modest increases in the mean values were observed for the TPE treatments (with two or three sprayings). An inverse response was observed in the plant antioxidant machinery. Both the TPE treatments applied in this experiment moderately reduced the activity of CAT compared with that in the control treatment. However, these differences were not statistically significant (Figure 7).
During the leaf gas exchange measurements after foliar spray treatments, no differences were observed in net CO2 assimilation rate (A), foliar transpiration (E), or stomatal conductance (gs) among the treatments (Figure 8). In contrast, both the TPE treatment groups (with two and three sprayings) showed significant increases in intercellular CO2 concentration (Ci) compared with that in the reference treatment group (Figure 8).
Garlic productivity in the 2023 season did not differ between the treatments (Figure 9). These results exhibit a trend similar to that observed in the biometric and biochemical analyses. However, we observed a negative correlation between secondary growth and productivity (Figure 9), which proves that the TPE treatment exhibits beneficial responses to physiological disturbances. Lastly, the descriptive approach adopted for determining garlic classes led to different classifications of garlic bulbs based on the treatments and spraying schedules, where the TPE treatment with two sprayings and the reference treatment presented similar results. In contrast, the TPE treatment with three sprayings resulted in the highest proportions of classes 6 and 7 and was the only treatment that resulted in class 8 garlic (Figure 9).

4. Discussion

Secondary growth (a similar term for tiller, lateral branch, or secondary plant) is an important physiological disorder in garlic recognized worldwide and already described in several countries, including China [19], Korea [32], and Brazil [9]. Proving to be a potential physiological process that affects different cultivars, countries, and farmers. Nevertheless, there are few studies on sustainable methodologies for controlling it. Therefore, we discuss potential ways to control secondary growth in garlic through the selection and application of plant growth regulators more qualified for this purpose.

4.1. First Experiment

In this study, we verified that DI induces morphophysiological changes, with a decrease in plant shoot height and dry mass. These results corroborate the detrimental effects of DI on leaf growth, cell division, leaf area index [33], and gasynthetic rate in garlic [13,33].
Garlic plants treated with GA inhibitors showed positive responses to the restriction in the height and dry mass of plant shoots compared with that in the control treatment, which presented the highest mean values for the height and dry matter of shoots in garlic plants. According to [34], plant growth regulators act on chemical signaling in plants with specific responses that promote or inhibit various cellular changes and affect plant tissue development. Different varieties of garlic exhibit different responses to water availability parameters [8], and the period under DI induces the physiological mechanisms of water regulation in tissues, indicating that DI is an appropriate tool to reduce secondary growth in plants; however, it causes physiological and biochemical damage to plants.
Considering that GAs directly impact vegetative and reproductive growth and vigor [17,34], we verified that GA inhibitors could efficiently control secondary growth in garlic. However, the distinct responses may be due to the different modes of action of the GA inhibitors used. Notably, CCC blocks the synthesis of ent-kaurene from geranylgeranyl diphosphate at stage 1 of GA biosynthesis, PBZ inhibits the oxidation of ent-kaurene to ent-kaurenoic acid at stage 2 of GA biosynthesis, and TPE inhibits 2-oxoglutarate-dependent dioxygenases at stage 3 [20].
In this study, among the treatments used to inhibit secondary growth in garlic, in addition to the water stress (DI) treatment, the TPE treatment emerged as a promising and efficient tool for controlling secondary growth. The secondary growth-regulating efficiency of TPE may be attributed to the production of some GA precursors because its activity is observed only in the last phase of the synthesis of this hormone. It has been reported [34] that the application of prohexadione-calcium reduces shoot and biomass growth but increases malondialdehyde content and the activity of peroxidases. These findings led us to infer that plant growth inhibitors such as prohexadione-calcium and TPE, which inhibit dioxygenases during stage 3 of GA biosynthesis, efficiently stabilize plant growth and potentially reduce secondary growth, as they act by inhibiting the plant growth hormone GA3. In contrast, the growth inhibitors acting at stages 1 and 2 of GA biosynthesis were ineffective in controlling secondary growth.

4.2. Field Experiments (2020 and 2023 Growing Seasons)

The key factors that stimulate secondary growth in garlic plants are excessive irrigation and high nitrogen fertilization [7], which can interfere with the biosynthesis of growth hormones such as GAs [35]. In contrast, low plant-available soil water capacity reduces GA content [31], and low nitrogen quantity downregulates GA biosynthesis in plants [36]. Therefore, field assays (2020 and 2023 crop seasons) were used to assess synthetic or natural molecules that act against the vigorous growth promoted by GAs.
Molecules with growth-inhibiting effects (GA antagonists) directly affect plant growth and production. However, their use in agriculture has been limited [37]. These compounds reduce shoot growth without modifying plant development patterns or causing phytotoxicity [20], an attribute highly desirable in horticulture [38]. In the experiments conducted in the 2020 growing season, we observed that plants subjected to the TPE treatment in combination with the water stress treatment (DI) showed reduced plant growth. In contrast, in the experiments conducted in 2023, we did not observe any differences in plant growth between any of the treatments.
The application of TPE effectively reduces growth in wheat plants [39,40] and height and stem diameter in soybean plants [37]. In contrast, antagonistic effects on growth restriction were observed with the use of CCC and PBZ, and we consider that the low efficiency of these two regulators was due to the doses applied and inadequate spraying time during the phenological stage.
Considering the standard practices of DI in garlic production, this method is ineffective in preventing secondary growth in the noble garlic cultivars grown in tropical regions. In contrast, applying GA inhibitors, particularly the use of TPE alone or in combination with DI, showed better results for secondary growth control. However, CCC and PBZ, the growth inhibitors targeting stages 1 and 2 of GA biosynthesis, respectively, were observed to be relatively less efficient in controlling secondary growth [20]. Our results demonstrate the efficiency and potential of TPE, which targets the last stage (stage 3) of GA biosynthesis, in restricting secondary growth in garlic plants.
In the second field assay, no differences in plant growth were observed among the treatments. However, we observed a tendency for a reduction in secondary growth when GA inhibitors were applied, particularly with the use of TPE, a chemically synthesized molecule that can saponify efficiently in an active acidic form and degrade rapidly [20]. Based on the results of this study, we propose that the inhibition of GA biosynthesis affects secondary growth in garlic and that physiological pathways that control the biosynthesis of this hormone in the final stages inside the cellular cytosol are highly efficient in controlling secondary growth. Therefore, TPE is a promising molecule that can efficiently reduce secondary growth in garlic.
Plants activate protective mechanisms in agroecosystems with soils having low plant-available water content to prevent damage caused by water stress [41]. In garlic crops, plant plasticity is marked based on the water supply, where bulbs with biomass are formed under favorable environments and bulb formation decreases under stressful environments [42]. Both field experiments showed no significant effects of TPE on the TSP content or the activity of CAT in garlic, indicating that treatment with growth inhibitors does not significantly affect plant metabolism.
Furthermore, it is essential to elucidate mechanisms that allow stable leaf gas exchange in garlic plants subjected to water restriction. In the field assay conducted in the 2020 growing season, no differences were observed in CO2 assimilation, leaf transpiration, stomatal conductance, or intercellular CO2 concentration among the treatments if plants were subjected to water restriction. The only exception was the TPE (sprayed three times) + DI treatment. In the 2023 field assay, both TPE treatments led to enhanced intercellular CO2 concentrations. High intercellular CO2 concentrations may indicate that the crucial CO2 substrate is available for CO2 assimilation [43]. Therefore, this result reflects an affirmative response of garlic plants to GA inhibitors, as these molecules do not induce greater damage than that resulting from a lack of water.
Evaluating clove essential oil (CEO) as a garlic growth inhibitor to avoid secondary growth, Nasser and colleagues [44] observed a reduction in the prevalence of secondary growth and split bulbs without affecting yield at 0.4%. Further, these authors found significant reductions on gas exchange parameters in plants treated with CEO 3 days after spraying, but at 7 days after spraying, this reduction in parameters was no longer observed, thus after 7 days, photosynthetic activity was restored in both treatments. Thereby, the plants seem to activate alternative pathways and quickly metabolize the compounds generated by the CEO stress without causing permanent damage to the crop or affecting garlic bulb production and quality.
In the garlic productivity analysis, in plants sprayed two times with the different GA inhibitors, the CCC treatment presented the highest and most significant mean productivity value; however, it did not differ from that of the reference treatment (DI). Similar responses were observed for plants subjected to three sprayings of different GA inhibitors. The reduction in garlic productivity after the TPE treatment may be linked to its harmful effects on root growth and may be correlated with slow shoot growth [45]. In the field assay conducted in the 2023 growing season, no differences were observed in garlic productivity among the treatments. However, the TPE treatment (with three sprayings) allowed for a mean productivity value superior to that in the reference treatment, indicating a negative correlation between secondary growth and crop productivity.
In the 2020 assay, the CCC treatment applied two or three times resulted in the production of a relatively more prominent garlic class (class 8) than that in the other treatments. Similar results were reported by another study [46], wherein a higher yield of bulbs with large diameters and fewer cloves per bulb than that in the control treatment was obtained when cloves were soaked in CCC, or leaves were sprayed twice with CCC. Regarding the fresh weight of bulbs, the TPE treatment applied twice, alone or in combination with the water restriction treatment (DI), proved detrimental to gains in garlic mass compared with that in the CCC treatment. The DI treatment reduced bulb size to class 4 garlic, the lowest size. In the field assay conducted in the 2023 growing season, the TPE treatment (applied three times) resulted in the best quality marketable garlic and was the only treatment producing class 8 garlic. These observations demonstrate an effective response of garlic plants to treatments with growth inhibitors, resulting in improved production parameters.

5. Conclusions

In this study, we performed an exploratory assay in a controlled environment, demonstrating the potential of TPE, a GA inhibitor, in controlling secondary growth in garlic. The in-field confirmatory assays performed in 2020 and 2023 further confirmed that TPE applied twice abruptly reduces secondary growth in garlic plants grown in the field. Therefore, we propose that the TPE treatment with two sprayings is the most optimal method for reducing secondary growth in garlic plants.
It was also observed that the plant growth regulators used in this study do not harm plant physiology, as indicated by the activities of the antioxidant enzymes and leaf gas exchange responses in the treated plants. In conclusion, GA biosynthesis inhibitors can be applied to garlic plants as an alternative to DI or high doses of pesticides to avoid secondary growth in garlic plants, thereby enhancing the quality and productivity of garlic crops.

Supplementary Materials

The following supporting information can be downloaded at: https://www.mdpi.com/article/10.3390/crops4030027/s1, Table S1: Soil physical-chemical attributes, Sekita Farm. Rio Paranaíba, MG, Brazil; Table S2: Soil fertilization during garlic growth, Sekita Farm. Rio Paranaíba, MG, Brazil, 2020; Table S3: Soil physical-chemical attributes, Glória Farm. Rio Paranaíba, MG, Brazil, 2023; Table S4: Soil fertilization during garlic growth, Glória Farm. Rio Paranaíba, MG, Brazil, 2023. Figure S1: Garlic bulb showing the secondary growth disturbance (bars = 1 cm).

Author Contributions

I.R.B., L.d.P.C., R.I.C.d.C., B.H.R. and V.G.N. wrote, conducted the experiments, and performed statistical analysis; G.H.S. wrote and reviewed the article and acted as co-adviser for the research; W.R.M. analyzed the data and conceived, supervised, wrote, and reviewed the article. All authors have read and agreed to the published version of the manuscript.

Funding

This research was funded by the Coordenação de Aperfeiçoamento de Pessoal de Nível Superior—CAPES (I.B.R., grant number 0001), the National Scientific and Technological Development Council—CNPq (W.R.M., grant number 303271/2021-3), and Minas Gerais State Research Support Foundation—FAPEMIG (grant number RED-00144-23 and grant number APQ-00184-21).

Data Availability Statement

The data for this research are available via request only due to the size of the data and the privacy of the secured storage location.

Acknowledgments

The authors thank Sekita Agronegócios and SES Agronegócios for lending the area to conduct the field assay.

Conflicts of Interest

The authors declare no conflicts of interest.

References

  1. Dufoo-Hurtado, M.D.; Huerta-Ocampo, J.Á.; Barrera-Pacheco, A.; de la Rosa, A.P.; Mercado-Silva, E.M. Low Temperature Conditioning of Garlic (Allium sativum L.) “Seed” Cloves Induces Alterations in Sprouts Proteome. Front. Plant Sci. 2015, 6, 332. [Google Scholar] [CrossRef] [PubMed]
  2. de Resende, J.T.V.; Morales, R.G.F.; Resende, F.V.; Faria, M.V.; de Souza, R.J.; Marchese, A. Garlic Vernalization and Planting Dates in Guarapuava. Hortic. Bras. 2011, 29, 193–198. [Google Scholar]
  3. Macêdo, F.S.; Sedoguchi, É.T.; de Souza, R.J.; de Carvalho, J.G. Produtividade de Alho Vernalizado Em Função de Fontes e Doses de Fósforo. Cienc. Rural 2011, 41, 379–383. [Google Scholar] [CrossRef]
  4. Bull, L.T.; Bertani, R.M.A.; Bôas, R.L.; Fernandes, D.M. Produção de Bulbos e Incidência de Pseudoperfilhamento Na Cultura Do Alho Vernalizado Em Função de Adubações Potássicas e Nitrogenadas. Bragantia 2002, 61, 247–255. [Google Scholar] [CrossRef]
  5. de Souza, R.J.; Casali, V.W.D. Pseudoperfilhamento: Uma Anormalidade Genético-Fisiológica Em Alho. Informe Agropecuário 1986, 12, 36–41. [Google Scholar]
  6. Resende, G.M.; Souza, R.J. Doses e Épocas de Aplicação de Nitrogênio Sobre a Produtividade e Características Comerciais de Alho. Hortic. Bras. 2001, 19, 126–129. [Google Scholar] [CrossRef]
  7. de Oliveira, J.T.; de Oliveira, R.A.; Puiatti, M.; Teodoro, P.; Montanari, R. Spatial Analysis and Mapping of the Effect of Irrigation and Nitrogen Application on Lateral Shoot Growing of Garlic. HortScience 2020, 55, 664–665. [Google Scholar] [CrossRef]
  8. Macêdo, F.S.; de Souza, R.J.; Pereira, G.M. Controle de Superbrotamento e Produtividade de Alho Vernalizado Sob Estresse Hídrico. Pesqui. Agropecu. Bras. 2006, 41, 629–635. [Google Scholar] [CrossRef]
  9. de Assis, R.P.; de Souza, D.C.; de Andrade Júnior, V.C.; Gonçalves, A.H.; de Souza, R.J. Secondary Growth Control in Garlic With Post Emergency Herbicides. J. Agric. Sci. 2019, 11, 67. [Google Scholar] [CrossRef]
  10. Wani, S.H.; Kumar, V.; Shriram, V.; Sah, S.K. Phytohormones and Their Metabolic Engineering for Abiotic Stress Tolerance in Crop Plants. Crop J. 2016, 4, 162–176. [Google Scholar] [CrossRef]
  11. Gabriel, A.; Resende, J.T.V.; Marodin, J.C.; de Matos, R.; Zeist, A.R.; Maciel, C.D.G. Estresse Químico Reduz Pseudoperfilhamento No Alho Vernalizado. Hortic. Bras. 2020, 38, 41–46. [Google Scholar] [CrossRef]
  12. Tadila, G.; Nigusie, D. Effect of Manure and Nitrogen Rates on Growth and Yield of Garlic (Allium sativum L.) at Haramaya, Eastern Ethiopia. J. Hortic. For. 2018, 10, 135–142. [Google Scholar] [CrossRef]
  13. Guo, H.Y.; Fan, Z.C. Effect of Soil Water Stress on Photosynthesis of Allium sativum L. Acta Agric. Sin. 1999, 26, 404–405. [Google Scholar]
  14. Zhou, X.; Condori-Apfata, J.A.; Liu, X.; Condori-Pacsi, S.J.; Valencia, M.V.; Zhang, C. Transcriptomic Changes Induced by Drought Stress in Hardneck Garlic during the Bolting/Bulbing Stage. Agronomy 2021, 11, 246. [Google Scholar] [CrossRef]
  15. Santos, E.A.; Correia, N.M.; Silva, J.R.M.; Velini, E.D.; Passos, A.B.R.J.; Durigan, J.C. Herbicide Detection in Groundwater in Córrego Rico-SP Watershed. Planta Daninha 2015, 33, 147–155. [Google Scholar] [CrossRef]
  16. Walperes, K.C.; dos Reis, M.R.; Carneiro, G.D.O.P.; Rocha, B.H.; de Carvalho Dias, R.; Melo, C.A.D.; Gonçalves, C.G. Residual de Metribuzin No Solo Sobre o Crescimento Do Alho, Cebola e Feijão. Rev. Bras. Herbic. 2015, 14, 64–72. [Google Scholar] [CrossRef]
  17. Rahman, M.H.; Haque, M.S.; Karim, M.A.; Ahmed, M. Effects of Gibberellic Acid (GA 3) on Breaking Dormancy in Garlic (Allium sativum L.). Int. J. Agric. Biol. 2006, 8, 63–65. [Google Scholar]
  18. Moon, W.; Lee, B.Y. Influences of Short Day Treatment on the Growth and Levels of Endogenous Growth Substances in Garlic Plants (Allium sativum L.). J. Korean Soc. Hortic. Sci. 1980, 21, 109–113. [Google Scholar]
  19. Liu, H.J.; Huang, C.; Tong, P.; Yang, X.; Cui, M.; Cheng, Z. Response of Axillary Bud Development in Garlic (Allium sativum L.) to Seed Cloves Soaked in Gibberellic Acid (GA3) Solution. J. Integr. Agric. 2020, 19, 1044–1054. [Google Scholar] [CrossRef]
  20. Rademacher, W. Growth Retardants: Effects on Gibberellin Bioproduction Synthesis and Other Metabolic Pathways. Annu. Rev. Plant Physiol. Plant Mol. Biol. 2000, 51, 501–531. [Google Scholar] [CrossRef]
  21. Subedi, M.; Karimi, R.; Wang, Z.; Graf, R.J.; Mohr, R.M.; O’donovan, J.T.; Brandt, S.; Beres, B.L.; Canada, A.-F. Winter Cereal Responses to Dose and Application Timing of Trinexapac-Ethyl. Crop Sci. 2021, 61, 2722–2732. [Google Scholar] [CrossRef]
  22. Ram, M.; Kumar, S.; Chopra, S.; Kumar, M.; Gupta, R.K. Effect of Exogenous Application of Phytohormones and Fungicides on Yield, Quality Storability and Economics of Garlic (Allium sativum L.). Veg. Sci. 2018, 45, 249–253. [Google Scholar] [CrossRef]
  23. de Resende, G.M.; de Souza, R.J. Efeito de Doses de Paclobutrazol Na Cultura Do Alho. Pesqui. Agropecu. Bras. 2002, 37, 637–641. [Google Scholar] [CrossRef]
  24. Lopez-Bellido, F.J.; Lopez-Bellido, R.J.; Muñoz-Romero, V.; Fernandez-Garcia, P.; Lopez-Bellido, L. New Phenological Growth Stages of Garlic (Allium sativum). Ann. Appl. Biol. 2016, 169, 423–439. [Google Scholar] [CrossRef]
  25. Bradford, M.M. A Rapid and Sensitive Method for the Quantitation of Microgram Quantities of Protein Utilizing the Principle of Protein-Dye Binding. Anal. Biochem. 1976, 72, 248–254. [Google Scholar] [CrossRef] [PubMed]
  26. Giannopolitis, C.; Reis, S. Superoxide Dismutases. I. Ocurrence in Higher Plants. Plant Physiol. 1977, 59, 309–314. [Google Scholar] [CrossRef]
  27. Havir, E.; McHale, N. Biochemical and Developmental Characterization of Multiple Forms of Catalase in Tobacco Leaves. Plant Physiol. 1987, 84, 450–455. [Google Scholar] [CrossRef]
  28. MAPA Sistema Integrado de Legislação. Available online: http://sistemasweb.agricultura.gov.br/sislegis/action/detalhaAto.do?method=visualizarAtoPortalMapa&chave=1429352813 (accessed on 3 March 2022).
  29. Ferreira, D.F. Sisvar: A Computer Statistical Analysis System. Cienc. Agrotecnol. 2011, 35, 1039–1042. [Google Scholar] [CrossRef]
  30. Carvalho, A.M.; Mendes, F.Q.; Mendes, F.Q.; de Fátima Tavares, L. SPEED Stat: A Free, Intuitive, and Minimalist Spreadsheet Program for Statistical Analyses of Experiments. Crop Breed. Appl. Biotechnol. 2020, 20, e327420312. [Google Scholar] [CrossRef]
  31. Piepho, H.P.; Edmondson, R.N. A Tutorial on the Statistical Analysis of Factorial Experiments with Qualitative and Quantitative Treatment Factor Levels. J. Agron. Crop Sci. 2018, 204, 429–455. [Google Scholar] [CrossRef]
  32. Choi, H.-S.; Yang, E.-Y.; Chae, W.-B.; Kwack, Y.-B.; Kim, H.-L. Effect of Soil Temperature, Seedtime, and Fertilization Rate on the Secondary Growth in the Cultivation of the Big Bulbils of Namdo Garlic (Allium sativum L.). J. Bio-Environ. Control 2009, 17, 454–459. [Google Scholar]
  33. Akbari, S.; Kafi, M.; Beidokhti, S.R. Effect of Drought Stress on Growth and Morphological Characteristics of Two Garlic (Allium sativum L.) Ecotypes in Different Planting Densities. J. Agroecol. 2017, 9, 559–574. [Google Scholar] [CrossRef]
  34. Ouzounidou, G.; Giannakoula, A.; Asfi, M.; Ilias, I. Differential Responses of Onion and Garlic against Plant Growth Regulators. Pak. J. Bot. 2011, 43, 2051–2057. [Google Scholar]
  35. Shohat, H.; Cheriker, H.; Kilambi, H.V.; Illouz Eliaz, N.; Blum, S.; Amsellem, Z.; Tarkowská, D.; Aharoni, A.; Eshed, Y.; Weiss, D. Inhibition of Gibberellin Accumulation by Water Deficiency Promotes Fast and Long-Term ‘Drought Avoidance’ Responses in Tomato. New Phytol. 2021, 232, 1985–1998. [Google Scholar] [CrossRef] [PubMed]
  36. Mu, X.; Chen, Q.; Wu, X.; Chen, F.; Yuan, L.; Mi, G. Gibberellins Synthesis Is Involved in the Reduction of Cell Flux and Elemental Growth Rate in Maize Leaf under Low Nitrogen Supply. Environ. Exp. Bot. 2018, 150, 198–208. [Google Scholar] [CrossRef]
  37. Linzmeyer Junior, R.; Guimarães, V.F.; dos Santos, D.; Bencke, M.H. Influência de Retardante Vegetal e Densidades de Plantas Sobre o Crescimento, Acamamento e Produtividade Da Soja. Acta Sci. Agron. 2008, 30, 373–379. [Google Scholar] [CrossRef]
  38. Rademacher, W. Growth Retardants: Biochemical Features and Applications in Horticulture. Acta Hortic. 1995, 394, 57–74. [Google Scholar] [CrossRef]
  39. Matysiak, K. Influence of Trinexapac-Ethyl on Growth and Development of Winter Wheat. J. Plant Prot. Res. 2006, 46, 133–143. [Google Scholar]
  40. de Cassia Felix Alvarez, R.; Crusciol, C.A.C.; Nascente, A.S. Produtividade de Arroz de Terras Altas Em Função de Reguladores de Crescimento. Rev. Ceres 2014, 61, 42–49. [Google Scholar] [CrossRef]
  41. Pisoschi, A.M.; Pop, A. The Role of Antioxidants in the Chemistry of Oxidative Stress: A Review. Eur. J. Med. Chem. 2015, 97, 55–74. [Google Scholar] [CrossRef]
  42. Sánchez-Virosta, Á.; Sadras, V.O.; Sánchez-Gómez, D. Phenotypic Plasticity in Relation to Inter-Cultivar Variation of Garlic (Allium sativum L.) Functional Performance and Yield-Stability in Response to Water Availability. Sci. Hortic. 2021, 285, 110128. [Google Scholar] [CrossRef]
  43. Tominaga, J.; Shimada, H.; Kawamitsu, Y. Direct Measurement of Intercellular CO2 Concentration in a Gas-Exchange System Resolves Overestimation Using the Standard Method. J. Exp. Bot. 2018, 69, 1981–1991. [Google Scholar] [CrossRef] [PubMed]
  44. Nasser, V.G.; Macedo, W.R.; Pinto, F.G.; da Silva, J.H.; Sekita, M.C.; Silva, G.H. Plant Growth Regulator from the Essential Oil of Syzygium aromaticum L. for Inhibition of Secondary Growth of Garlic Cultivated under Tropical Conditions. AgriEngineering 2024, 6, 1511–1524. [Google Scholar] [CrossRef]
  45. Mykhalska, L.M.; Makoveychuk, T.M.; Schwartau, V.V. View of Mode of Physiological Activity of Acylcyclohexadione Retardants. Biosyst. Divers. 2020, 28, 411–418. [Google Scholar] [CrossRef]
  46. Foda, S.A.; Saleh, H.H.; Shanein, A.H. Effect of Cycocel “chlormequat” on Garlic—World Vegetable Center. Agric. Res. Rev. 1979, 57, 171–177. [Google Scholar]
Figure 1. Garlic biometric parameters under controlled conditions: (A) plant height, (B) shoot dry matter, (C) secondary growth index, and (D) secondary growth in plants subjected to growth regulators. Treatments: 1 (control), 2 (deficit irrigation), 3 (ABA), 4 (trinexapac-ethyl), 5 (chlormequat chloride), and 6 (paclobutrazol) for 28 days. Minor letters indicate the comparison of the means within the same period by the LSD test (95%).
Crops 04 00027 g001
Figure 2. Garlic biometric parameters in the first field experiment (2020 growing season): (A) plant height (cm) at 53 DAP; (B) fresh matter of bulb (g); and (C) garlic secondary growth (%), subjected to treatments: deficit irrigation + trinexapac-ethyl (DI + TE); trinexapac-ethyl (TE); chlormequat chloride (CCC); paclobutrazol (PBZ); and additional treatment (deficit irrigation). Capital letters indicate differences among gibberellin inhibitors in the application times (two or three sprayings), and minor letters indicate differences among gibberellin inhibitors between application numbers (two or three sprayings) by the SNK test (5% significance). The symbol (*) above bars indicates differences that are significant by orthogonal contrasts (t-test), at a level of 5% significance.
Crops 04 00027 g002
Figure 3. Garlic biochemical parameters in the first field experiment (2020 growing season): (A) total soluble protein (mg g−1 FM); (B) superoxide dismutase (U min−1 mg−1 protein); and (C) catalase (µmol min−1 mg−1 protein), subjected to treatments: deficit irrigation + trinexapac-ethyl (DI + TE); trinexapac-ethyl (TE); chlormequat chloride (CCC); paclobutrazol (PBZ); and additional treatment (deficit irrigation). Capital letters indicate differences among gibberellin inhibitors in the application times (two or three sprayings), and minor letters indicate differences among gibberellin inhibitors between application numbers (two or three sprayings) by the SNK test (5% significance). The symbol (*) above bars indicates differences that are significant by orthogonal contrasts (t-test), at a level of 5% significance.
Crops 04 00027 g003
Figure 4. Garlic gas exchange parameters in the first field experiment (2020 growing season): (A) Net CO2 assimilation—A (μmol∙m−2∙s−1); (B) foliar transpiration—E (mmol∙m−2∙s−1); (C) intercellular CO2 concentration—Ci (Pa); (D) stomatal conductance—gs (mmol∙m−2∙s−1), subjected to treatments: deficit irrigation + trinexapac-ethyl (DI + TE); trinexapac-ethyl (TE); chlormequat chloride (CCC); paclobutrazol (PBZ); and additional treatment (deficit irrigation). Capital letters indicate differences among gibberellin inhibitors in the application times (two or three sprayings), and minor letters indicate differences among gibberellin inhibitors between application numbers (two or three sprayings) by the SNK test (5% significance). The symbol (*) above bars indicates differences that are significant by orthogonal contrasts (t-test), at a level of 5% significance.
Crops 04 00027 g004
Figure 5. Garlic production parameters in the first field experiment (2020 growing season): (A) garlic productivity (Kg of fresh matter per hectare); (B) garlic bulb class (2 sprayings); (C) garlic bulb class (3 sprayings), subjected to treatments: deficit irrigation + trinexapac-ethyl (DI + TE); trinexapac-ethyl (TE); chlormequat chloride (CCC); paclobutrazol (PBZ); and additional treatment (deficit irrigation). Capital letters indicate differences among gibberellin inhibitors in the application times (two or three sprayings), and minor letters indicate differences among gibberellin inhibitors between application numbers (two or three sprayings) by the SNK test (5% significance). The symbol (*) above bars indicates differences that are significant by orthogonal contrasts (t-test), at a level of 5% significance.
Crops 04 00027 g005
Figure 6. Garlic biometric parameters in the second field experiment (2023 growing season), where: (A) plant height (cm), at 50 DAP; (B) plant height (cm), at 57 DAP; and (C) garlic secondary growth (%), subjected to treatments: reference, trinexapac-ethyl (two sprayings), trinexapac-ethyl (three sprayings). Means were compared by the SNK test (5% significance). Averages followed by the same minor letter do not differ statistically by the SNK test (5% of significance).
Crops 04 00027 g006
Figure 7. Biochemical parameters in the second field experiment (2023 growing season), where: (A) total soluble protein (mg g−1 FM); (B) superoxide dismutase (U min−1 mg−1 protein); and (C) catalase (µmol min−1 mg−1 protein), subjected to treatments: reference, trinexapac-ethyl (two sprayings), trinexapac-ethyl (three sprayings). Means were compared by the SNK test (5% significance). Averages followed by the same minor letter do not differ statistically by the SNK test (5% of significance).
Crops 04 00027 g007
Figure 8. Gas exchange parameters in the second field experiment (2023 growing season), where: (A) Net CO2 assimilation—A (μmol∙m−2∙s−1); (B) foliar transpiration—E (mmol∙m−2∙s−1); (C) intercellular CO2 concentration—Ci (Pa); and (D) stomatal conductance—gs (mmol∙m−2∙s−1), subjected to treatments: reference, trinexapac-ethyl (two sprayings), trinexapac-ethyl (three sprayings). Means were compared by the SNK test (5% significance). Averages followed by the same minor letter do not differ statistically by the SNK test (5% of significance).
Crops 04 00027 g008
Figure 9. Garlic production parameters in the second field experiment (2023 growing season): (A) bulb production per area (unit per m−2); (B) garlic productivity (kg of fresh matter per hectare); (C) garlic bulb class, subjected to treatments: reference, trinexapac-ethyl (2 spraying), trinexapac-ethyl (three sprayings). Means were compared by the SNK test (5% significance). Averages followed by the same minor letter do not differ statistically by the SNK test (5% of significance).
Crops 04 00027 g009
Table 1. Application schedule of the spraying treatments, Rio Paranaíba, Minas Gerais, Brazil, 2020.
First SprayingSecond SprayingThird SprayingTreatments
Two sprayings8 May 2020
(39 DAP)
15 May2020
(46 DAP)
---T1–T4
Three sprayings8 May 2020
(39 DAP)
13 May 2020
(44 DAP)
18 May 2020
(49 DAP)
T5–T8
DAP, days after planting.
Table 2. Application schedule of spraying treatments, Rio Paranaíba, Minas Gerais, Brazil, 2023.
TreatmentsFirst SprayingSecond SprayingThird SprayingTreatments
Two sprayings15 Jun 2023
(40 DAP)
17 Jun 2023
(42 DAP)
---T1–T4
Three sprayings15 Jun 2023
(40 DAP)
17 Jun 2023
(42 DAP)
19 Jun 2023
(44 DAP)
T5–T8
DAP, days after planting.
Disclaimer/Publisher’s Note: The statements, opinions and data contained in all publications are solely those of the individual author(s) and contributor(s) and not of MDPI and/or the editor(s). MDPI and/or the editor(s) disclaim responsibility for any injury to people or property resulting from any ideas, methods, instructions or products referred to in the content.

