[go: up one dir, main page]

Next Issue
Volume 6, August
Previous Issue
Volume 6, June


Fire, Volume 6, Issue 7 (July 2023) – 36 articles

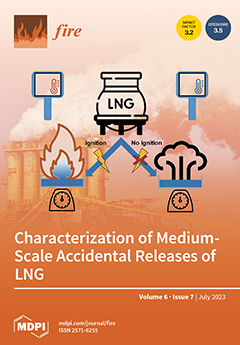
Cover Story (view full-size image): Considering the current spread of technologies implementing cryogenic solutions and their potential role in the energy transition framework, the characterization of reactive and non-reactive accidental releases of Liquefied Natural Gas (LNG) is paramount for the realization of robust and safe procedures and infrastructures. In this sense, an on-field experimental campaign collecting mass and temperature profiles as well as time evolution was presented and discussed in this study. View this paper
  • Issues are regarded as officially published after their release is announced to the table of contents alert mailing list.
  • You may sign up for e-mail alerts to receive table of contents of newly released issues.
  • PDF is the official format for papers published in both, html and pdf forms. To view the papers in pdf format, click on the "PDF Full-text" link, and use the free Adobe Reader to open them.
Order results
Result details
Section
Select all
Export citation of selected articles as:
14 pages, 4119 KiB  
Article
Study of Crack Generation and Expansion Behavior of Frame-Supported Float Glass after Heat Exposure
by Yanni Zhang, Luoxin Huang, Jun Deng, Zhichao Feng, Dan Yang, Xuemeng Liu and Shuai Zhang
Fire 2023, 6(7), 281; https://doi.org/10.3390/fire6070281 - 22 Jul 2023
Viewed by 1477
Abstract
Float glass installed with frame supports is broadly exploited in building construction. In a fire environment, the breakage of float glass significantly influences the dynamic development of the fire within the building space. The thermal rupture behavior of the frame-supported float glass subjected [...] Read more.
Float glass installed with frame supports is broadly exploited in building construction. In a fire environment, the breakage of float glass significantly influences the dynamic development of the fire within the building space. The thermal rupture behavior of the frame-supported float glass subjected to thermal loading is carefully examined using a self-built experimental system. The designed system is aimed at capturing crucial behavioral parameters. The experimental study reveals that the main reason for the breakage of the frame-supported float glass is the temperature difference on the glass surface, with a critical temperature difference of approximately 65 °C. The crack starts at the edge of the glass surface where the temperature difference is maximum and then rapidly expands. By intersecting the cracks, a crack island is configured, which is not dislodged under the stress of the supporting frame and the surrounding glass. A thermomechanical and micro-geometric model of the frame-supported float glass is developed based on the PFC2D program to show further the micro-crack expansion pattern of the frame-supported float glass under thermal loading. This scrutiny provides theoretical guidance for installing and using frame-supported float glass in construction projects and identifying fire evidence. Full article
(This article belongs to the Special Issue Glass at Elevated Temperatures and in Fire)
Show Figures

Figure 1

Figure 1
<p>The platform of the glass fire experiment.</p>
Full article ">Figure 2
<p>The thermocouple distribution on the float glass surface.</p>
Full article ">Figure 3
<p>The relationship between particles, heat source, and heat pipes in the PFC<sup>2D</sup>.</p>
Full article ">Figure 4
<p>The discrete element model of the float glass. (<b>a</b>) Physical model; (<b>b</b>) Discrete element model.</p>
Full article ">Figure 5
<p>Temperature distribution at the first break of the frame−supported float glass. (<b>a</b>) Average thermocouple temperature change on the fireward side of the glass (Left). (<b>b</b>) Average thermocouple temperature change on the backward side of the glass (Right) (<b>c</b>) Plots of the average temperature difference at each edge of the glass surface as a function of time (Left). (<b>d</b>) Variation in the surface and air temperatures of the float glass (Right).</p>
Full article ">Figure 5 Cont.
<p>Temperature distribution at the first break of the frame−supported float glass. (<b>a</b>) Average thermocouple temperature change on the fireward side of the glass (Left). (<b>b</b>) Average thermocouple temperature change on the backward side of the glass (Right) (<b>c</b>) Plots of the average temperature difference at each edge of the glass surface as a function of time (Left). (<b>d</b>) Variation in the surface and air temperatures of the float glass (Right).</p>
Full article ">Figure 6
<p>The crack extension and final shape of the frame-supported float glass, (<b>a</b>) Initial crack initiation, (<b>b</b>) Crack initiation location, (<b>c</b>) Crack extension direction and (<b>d</b>) Final crack pattern.</p>
Full article ">Figure 7
<p>The microcrack characteristics of the float glass acted upon by the thermal loading, (<b>a</b>) The number of cracks at 5270 steps is 688, (<b>b</b>) The number of cracks at 9269 steps is 1612, (<b>c</b>) The number of cracks at 10,271 steps is 2279, (<b>d</b>) The number of cracks at 14,279 steps is 3670, (<b>e</b>) The number of cracks at 25,301 steps is 3682, (<b>f</b>) The number of cracks at 57,932 steps is 3682, (<b>g</b>) The number of cracks at 105,410 steps is 3682 and (<b>h</b>) The number of cracks at 188,210 steps is 3682.</p>
Full article ">Figure 8
<p>Characteristics of the stress field of the float glass under the action of high-temperature loading, (<b>a</b>) Peak stress of 1.64 × 10<sup>5</sup> at 5270 steps, (<b>b</b>) Peak stress of 1.64 × 10<sup>6</sup> at 9269 steps, (<b>c</b>) Peak stress of 1.72 × 10<sup>6</sup> at 10,271 steps, (<b>d</b>) Peak stress of 2.04 × 10<sup>6</sup> at 14,279 steps, (<b>e</b>) Peak stress of 2.19 × 10<sup>6</sup> at 25,301 steps, (<b>f</b>) Peak stress of 2.0 × 10<sup>6</sup> at 57,932 steps, (<b>g</b>) Peak stress of 1.9 × 10<sup>5</sup> at 105,410 steps and (<b>h</b>) Peak stress of 2.65 × 10<sup>4</sup> at 188,210 steps.</p>
Full article ">Figure 9
<p>Characteristics of the microcracking as a function of the temperature.</p>
Full article ">Figure 10
<p>The microstructural characteristics of the microcracks in the float glass under high-temperature loading.</p>
Full article ">Figure 11
<p>The microcrack initiation and expansion mechanism in the float glass under high-temperature action.</p>
Full article ">
20 pages, 2227 KiB  
Article
Socio-Psychological, Economic and Environmental Effects of Forest Fires
by Stavros Kalogiannidis, Fotios Chatzitheodoridis, Dimitrios Kalfas, Christina Patitsa and Aristidis Papagrigoriou
Fire 2023, 6(7), 280; https://doi.org/10.3390/fire6070280 - 21 Jul 2023
Cited by 18 | Viewed by 5834
Abstract
One of the most common forest disturbances, fire, has a significant influence on the people, societies, economies, and environment of countries all over the world. This study explores the different environmental and socioeconomic effects of forest fires to establish priorities for countries in [...] Read more.
One of the most common forest disturbances, fire, has a significant influence on the people, societies, economies, and environment of countries all over the world. This study explores the different environmental and socioeconomic effects of forest fires to establish priorities for countries in battling and mitigating the harmful effects of forest fires based on data collected from 382 professionals working in Greece’s forestry and agriculture sectors. Secondary data, especially from Statista, were further utilized to enhance the analytical comparisons and conclusions of this study. Wildfires in Greece destroy agricultural land and greatly impact the rural economy and community. This study showed that forest fires have led to several economic costs, mainly affecting the incomes of different investors in the forest sector in Greece. It was revealed that the overall cost of a fire is determined by the direct and indirect expenditures as well as the price of fire control and preventative methods. Direct expenses are broken down into two categories: direct damage that occurs immediately and direct losses that are caused immediately after a fire. Governments should take the initiative to create and expand bilateral and/or multilateral cooperation and coordination, as well as exchange necessary financial resources, technology, and training, to reduce the effects of forest fires in a fragile international man-made and natural environment. Full article
(This article belongs to the Special Issue Firefighting Approaches and Extreme Wildfires)
Show Figures

Figure 1

Figure 1
<p>Most severe wildfires by number of fatalities worldwide from 1911. Data from the International Disaster Database, EM-DAT (2023).</p>
Full article ">Figure 2
<p>Social–economic and Environmental development.</p>
Full article ">Figure 3
<p>Area destroyed by forest fires (hectares) in Greece from 2006 to 2022. Data from the EFFIS—European Forest Fire Information System (2023).</p>
Full article ">Figure 4
<p>Area burned (hectares) by forest fires in European countries. Data from the EFFIS—European Forest Fire Information System (2023).</p>
Full article ">
17 pages, 18290 KiB  
Article
Forest Flame Detection in Unmanned Aerial Vehicle Imagery Based on YOLOv5
by Haiqing Liu, Heping Hu, Fang Zhou and Huaping Yuan
Fire 2023, 6(7), 279; https://doi.org/10.3390/fire6070279 - 19 Jul 2023
Cited by 8 | Viewed by 2337
Abstract
One of the major responsibilities for forest police is forest fire prevention and forecasting; therefore, accurate and timely fire detection is of great importance and significance. We compared several deep learning networks based on the You Only Look Once (YOLO) framework to detect [...] Read more.
One of the major responsibilities for forest police is forest fire prevention and forecasting; therefore, accurate and timely fire detection is of great importance and significance. We compared several deep learning networks based on the You Only Look Once (YOLO) framework to detect forest flames with the help of unmanned aerial vehicle (UAV) imagery. We used the open datasets of the Fire Luminosity Airborne-based Machine Learning Evaluation (FLAME) to train the YOLOv5 and its sub-versions, together with YOLOv3 and YOLOv4, under equal conditions. The results show that the YOLOv5n model can achieve a detection speed of 1.4 ms per frame, which is higher than that of all the other models. Furthermore, the algorithm achieves an average accuracy of 91.4%. Although this value is slightly lower than that of YOLOv5s, it achieves a trade-off between high accuracy and real-time. YOLOv5n achieved a good flame detection effect in the different forest scenes we set. It can detect small target flames on the ground, it can detect fires obscured by trees or disturbed by the environment (such as smoke), and it can also accurately distinguish targets that are similar to flames. Our future work will focus on improving the YOLOv5n model so that it can be deployed directly on UAV for truly real-time and high-precision forest flame detection. Our study provides a new solution to the early prevention of forest fires at small scales, helping forest police make timely and correct decisions. Full article
(This article belongs to the Special Issue Geospatial Data in Wildfire Management)
Show Figures

Figure 1

Figure 1
<p>The drone and the video camera used in the study.</p>
Full article ">Figure 2
<p>Mosaic augmentation.</p>
Full article ">Figure 3
<p>Cutout (filled with all zeros).</p>
Full article ">Figure 4
<p>Rectangular inference, where (<b>a</b>) is the previous practice, first scale the long side to the object size, and then add 0 to the short side; (<b>b</b>) is the practice result of YOLOv5, with the side length to be an integer multiple of the step size (32 by default).</p>
Full article ">Figure 5
<p>Overall architecture of YOLOv5.</p>
Full article ">Figure 6
<p>Structure and component of the Focus module.</p>
Full article ">Figure 7
<p>Structure and component of the CBL module.</p>
Full article ">Figure 8
<p>Structure and component of the CSP1_X module.</p>
Full article ">Figure 9
<p>Structure and component of the SPP module.</p>
Full article ">Figure 10
<p>Structure and component of the CSP2_X module.</p>
Full article ">Figure 11
<p>Flame detection evaluation with two IoUs: (<b>a</b>) IoU and (<b>b</b>) GIoU.</p>
Full article ">Figure 12
<p>Training results of YOLOv5n (<b>a</b>) and YOLOv5s (<b>b</b>) using training and validation set, respectively.</p>
Full article ">Figure 13
<p>PR curves of 9 YOLO models.</p>
Full article ">Figure 14
<p>Flame detection diagrams by using YOLOv5n model in different scenarios based on FLAME datasets, including: (<b>a</b>) multiple small object flames taken from high altitude, (<b>b</b>) flames obscured by trees, (<b>c</b>) flames disturbed by environment (mainly smoke), (<b>d</b>) a close-up shot of the flames. Rectangles delineate the location and size of the object, with numbers representing confidence.</p>
Full article ">Figure 15
<p>Flame detection with YOLOv5n model based on images from the Internet, including: (<b>a</b>) forest canopy flames, (<b>b</b>,<b>c</b>) woodland ground flames, (<b>d</b>,<b>e</b>) flame-like targets.</p>
Full article ">
9 pages, 1646 KiB  
Brief Report
A Pilot Study to Assess the Feasibility of Comparing Ultra-High Pressure to Low-Pressure Fire Suppression Systems for a Simulated Indirect Exterior Attack
by Elizabeth A. Sanli, Robert Brown and Derek Simmons
Fire 2023, 6(7), 278; https://doi.org/10.3390/fire6070278 - 19 Jul 2023
Viewed by 1201
Abstract
Financial and human resource challenges constrain firefighting in rural communities. This can limit the approaches that can be used in a given residential fire situation. Effective use of portable, lower-cost equipment that would require fewer personnel and less water could greatly benefit rural [...] Read more.
Financial and human resource challenges constrain firefighting in rural communities. This can limit the approaches that can be used in a given residential fire situation. Effective use of portable, lower-cost equipment that would require fewer personnel and less water could greatly benefit rural communities. This study was conducted to assess the feasibility of comparing ultra-high-pressure to low-pressure fire suppression systems at low flow rates. The conditions used simulated an indirect exterior attack through a window. A purpose-built burn room and standardized class A fires were used to compare ultra-high-pressure and low-pressure systems at low flow rates. Temperatures in the burn room were recorded for each condition in triplicate. While neither operating condition resulted in full extinguishment of the fire, the ultra-high-pressure trials saw decreases in the proportion of starting temperature that were faster and of greater magnitude than for the low-pressure trials. This compares with earlier research, simulating a transitional attack that saw similar patterns for temperature cooling but resulted in extinguishment. This preliminary testing provides evidence that the burn container and room, as well as instrumentation and fuel load configurations, are appropriate for more extensive testing of such equipment for exterior fire suppression. Full article
Show Figures

Figure 1

Figure 1
<p>Floor plan and instrumentation.</p>
Full article ">Figure 2
<p>Images showing the set-up of the fuel load in the burn room and the location of the GoPro cameras, thermocouple array, and fire fighters during a trial.</p>
Full article ">Figure 3
<p>Temperature, in degrees Celsius over water exposure time, for each of the four thermocouples during a representative test for each of UHP and LP conditions. T1 represents the lowest thermocouple, while T4 represents the highest thermocouple in the array.</p>
Full article ">Figure 4
<p>Median thermocouple array temperature over time with the start and stop of water flow for each of UHP trail 2 and LP trial 2 indicated.</p>
Full article ">Figure 5
<p>Median thermocouple array temperature over time.</p>
Full article ">
14 pages, 2638 KiB  
Article
Assessment of Burned Areas during the Pantanal Fire Crisis in 2020 Using Sentinel-2 Images
by Yosio Edemir Shimabukuro, Gabriel de Oliveira, Gabriel Pereira, Egidio Arai, Francielle Cardozo, Andeise Cerqueira Dutra and Guilherme Mataveli
Fire 2023, 6(7), 277; https://doi.org/10.3390/fire6070277 - 19 Jul 2023
Cited by 3 | Viewed by 26786
Abstract
The Pantanal biome—a tropical wetland area—has been suffering a prolonged drought that started in 2019 and peaked in 2020. This favored the occurrence of natural disasters and led to the 2020 Pantanal fire crisis. The purpose of this work was to map the [...] Read more.
The Pantanal biome—a tropical wetland area—has been suffering a prolonged drought that started in 2019 and peaked in 2020. This favored the occurrence of natural disasters and led to the 2020 Pantanal fire crisis. The purpose of this work was to map the burned area’s extent during this crisis in the Brazilian portion of the Pantanal biome using Sentinel-2 MSI images. The classification of the burned areas was performed using a machine learning algorithm (Random Forest) in the Google Earth Engine platform. Input variables in the algorithm were the percentiles 10, 25, 50, 75, and 90 of monthly (July to December) mosaics of the shade fraction, NDVI, and NBR images derived from Sentinel-2 MSI images. The results showed an overall accuracy of 95.9% and an estimate of 44,998 km2 burned in the Brazilian portion of the Pantanal, which resulted in severe ecosystem destruction and biodiversity loss in this biome. The burned area estimated in this work was higher than those estimated by the MCD64A1 (35,837 km2), Fire_cci (36,017 km2), GABAM (14,307 km2), and MapBiomas Fogo (23,372 km2) burned area products, which presented lower accuracies. These differences can be explained by the distinct datasets and methods used to obtain those estimates. The proposed approach based on Sentinel-2 images can potentially refine the burned area’s estimation at a regional scale and, consequently, improve the estimate of trace gases and aerosols associated with biomass burning, where global biomass burning inventories are widely known for having biases at a regional scale. Our study brings to light the necessity of developing approaches that aim to improve data and theory about the impacts of fire in regions critically sensitive to climate change, such as the Pantanal, in order to improve Earth systems models that forecast wetland–atmosphere interactions, and the role of these fires on current and future climate change over these regions. Full article
(This article belongs to the Special Issue Vegetation Fires in South America)
Show Figures

Figure 1

Figure 1
<p>Location of the Pantanal biome in South America. Base map is a Moderate Resolution Imaging Spectroradiometer (MODIS) sensor product MOD09A1 color composite R6G2B1 for the year 2019.</p>
Full article ">Figure 2
<p>Monthly RGB (B4-B3-B2) mosaics (Sentinel-2A and -B) before (July 2020) and after (August 2020 or November 2020) fires in two different areas, showing affected areas and representation of samples (red square).</p>
Full article ">Figure 3
<p>Annual burned area in the Brazilian Pantanal biome from 2003 to 2020 estimated using the products MapBiomas Fogo c1.0, GABAM, MCD64A1 c6.0, and Fire_cci v5.1. The year 2020 had the highest estimate during this time series for all the burned area products.</p>
Full article ">Figure 4
<p>Spatial distribution of the burned area mapped in the Brazilian Pantanal biome during the 2020 fire crisis using MSI sensor images onboard the Sentinel-2 satellites and the four burned area products analyzed in this study.</p>
Full article ">Figure 5
<p>Boxplot of the relative importance values (mean decrease impurity) of all predictive variables in the Random Forest model generated from each monthly classification. The black ‘+’ indicates the mean, the black line indicates the median, and the white dots indicate the maximum and minimum values. On the x-axis variables names the letter <span class="html-italic">P</span> means percentile.</p>
Full article ">
29 pages, 6165 KiB  
Article
Exploring and Testing Wildfire Risk Decision-Making in the Face of Deep Uncertainty
by Bart R. Johnson, Alan A. Ager, Cody R. Evers, David W. Hulse, Max Nielsen-Pincus, Timothy J. Sheehan and John P. Bolte
Fire 2023, 6(7), 276; https://doi.org/10.3390/fire6070276 - 18 Jul 2023
Cited by 2 | Viewed by 2161
Abstract
We integrated a mechanistic wildfire simulation system with an agent-based landscape change model to investigate the feedbacks among climate change, population growth, development, landowner decision-making, vegetative succession, and wildfire. Our goal was to develop an adaptable simulation platform for anticipating risk-mitigation tradeoffs in [...] Read more.
We integrated a mechanistic wildfire simulation system with an agent-based landscape change model to investigate the feedbacks among climate change, population growth, development, landowner decision-making, vegetative succession, and wildfire. Our goal was to develop an adaptable simulation platform for anticipating risk-mitigation tradeoffs in a fire-prone wildland–urban interface (WUI) facing conditions outside the bounds of experience. We describe how five social and ecological system (SES) submodels interact over time and space to generate highly variable alternative futures even within the same scenario as stochastic elements in simulated wildfire, succession, and landowner decisions create large sets of unique, path-dependent futures for analysis. We applied the modeling system to an 815 km2 study area in western Oregon at a sub-taxlot parcel grain and annual timestep, generating hundreds of alternative futures for 2007–2056 (50 years) to explore how WUI communities facing compound risks from increasing wildfire and expanding periurban development can situate and assess alternative risk management approaches in their localized SES context. The ability to link trends and uncertainties across many futures to processes and events that unfold in individual futures is central to the modeling system. By contrasting selected alternative futures, we illustrate how assessing simulated feedbacks between wildfire and other SES processes can identify tradeoffs and leverage points in fire-prone WUI landscapes. Assessments include a detailed “post-mortem” of a rare, extreme wildfire event, and uncovered, unexpected stabilizing feedbacks from treatment costs that reduced the effectiveness of agent responses to signs of increasing risk. Full article
Show Figures

Figure 1

Figure 1
<p>South Willamette study area in western Oregon. Like most WUIs in the Willamette Valley Ecoregion (<b>upper right</b>), the study area (<b>bottom</b>, white outline) occupies the transition zone from the flat agricultural valley floor (tan) to the forested foothills (green) and includes remnants of pre-Euro-American-settlement oak savanna and upland prairie (<b>bottom</b>), a top conservation priority.</p>
Full article ">Figure 2
<p>Wildfire submodel linkages within Envision coupled-systems model. (<b>A</b>) Couplings of wildfire, succession, and management within the vegetation system. (<b>B</b>) Couplings of vegetation system with other submodels of the complete modeling system. TSD = time since disturbance; TSM = time since management.</p>
Full article ">Figure 3
<p>Area burned by scenario and individual future for three management scenarios under the Low Climate (MIROC GCM) and Dispersed Development scenario. Each scenario combination was subjected to identical sets of 50-year fire lists across 50 replicate runs to create an “all-else-being-equal” test of scenario impacts on wildfire. (<b>A</b>) Area burned by scenario and run. Vertical lines show scenario averages. Dashed red line connects Hazard Reduction run (HAZ) with median area burned to its fire list counterparts for the No Management (NoM) and Restoration (RES) scenarios. (<b>B</b>) Average area burned by fire severity class across all 50 runs of each scenario. Error bars show +2 SE.</p>
Full article ">Figure 4
<p>Variability in wildfire severity and area burned within and among scenarios is driven by interactions of stochastic fire weather and ignitions with agent decision-making. Annual area burned by fire severity class is shown next to map of the 50-year fire footprint for each simulation run. From left to right (<b>A</b>–<b>C</b>): the minimum, median and maximum area burned in 50 replicate runs of the Hazard Reduction scenario, each using a different fire list. From middle top to bottom (<b>B</b>,<b>D</b>,<b>E</b>): comparable runs using the same fire list for the Hazard, Restoration, and No Management scenario. All runs shown conducted under the Low Climate and Dispersed Development scenarios. Year 1–50 = 2007–2057. Graphs show two-year fire totals for visual simplicity.</p>
Full article ">Figure 5
<p>Feedbacks from residences threatened by wildfire drive allocation of public funds for vegetation management. (<b>A</b>) Each year, wildfires of different sizes and severity can (<b>B</b>) threaten rural residences. Greater numbers of recently threatened residences shift the allocation of public funds from conservation-based restoration fuel treatments. (<b>C</b>) The area treated for restoration vs. fuel treatments reflects these changing priorities, influencing future wildfire and residential risk. Year 1–50 = 2007–2057. Run shown is HAZ-med from <a href="#fire-06-00276-f004" class="html-fig">Figure 4</a>.</p>
Full article ">Figure 6
<p>Need for retreatment drives increasing vegetation management costs over time. The area treated in projects using public incentive funds declined over time as retreatments increased the net cost/ha. The result of greater retreatment was that fewer projects generated profits and more generated losses, drawing down public funds. Examples of fuels treatments (in this scenario density thinning only) are from the HAZ-min and HAZ-max simulation runs, which were also used in <a href="#fire-06-00276-f004" class="html-fig">Figure 4</a> and <a href="#fire-06-00276-t003" class="html-table">Table 3</a>. Year 1–50 = 2007–2057.</p>
Full article ">
5 pages, 891 KiB  
Editorial
Novel Approaches and Techniques for Understanding Vegetation Fires in South America
by Guilherme Mataveli, Gabriel de Oliveira, Renata Libonati, Celso H. L. Silva-Junior and Liana O. Anderson
Fire 2023, 6(7), 275; https://doi.org/10.3390/fire6070275 - 14 Jul 2023
Viewed by 1288
Abstract
Vegetation fires represent a major disturbance in the tropics, with South America notable for having both fire-sensitive (e [...] Full article
(This article belongs to the Special Issue Vegetation Fires in South America)
Show Figures

Figure 1

Figure 1
<p>Yearly published articles identified between 1990 and 2022 after performing an advanced search with the terms “Fires” and “South America” in the Web of Science Core Collection database.</p>
Full article ">Figure 2
<p>Countries of the top 10 corresponding authors of articles published between 1990 and 2022 after performing an advanced search with the terms “Fires” and “South America” in the Web of Science Core Collection database.</p>
Full article ">
20 pages, 4831 KiB  
Article
Study of the Condition of Forest Fire Fighting Vehicles
by Filipe Silva, Jorge Raposo, José Torres Farinha, Hugo Raposo and Luís Reis
Fire 2023, 6(7), 274; https://doi.org/10.3390/fire6070274 - 13 Jul 2023
Viewed by 3797
Abstract
The Forest Fire Fighting Vehicle (FFFV) is one of the most important pieces of equipment in direct firefighting; therefore, its maintenance is strategic to guarantee high levels of reliability. The history of interventions is essential to support the increase in the quality of [...] Read more.
The Forest Fire Fighting Vehicle (FFFV) is one of the most important pieces of equipment in direct firefighting; therefore, its maintenance is strategic to guarantee high levels of reliability. The history of interventions is essential to support the increase in the quality of maintenance, namely with regard to the specificity of each equipment, in its actual operating conditions. In the absence of previous information, it is important to resort to complementary tools that allow for overcoming this gap where usually the knowledge of maintenance held by professionals and users is structuring and very helpful. In this perspective, data were collected from several fire brigades. The analysis and decisions were possible using fuzzy logic, following the Mamdani model and the centroid method for the defuzzification phase. Subsequently, a Failure Modes, Effects and Criticality Analysis (FMECA) was carried out to identify which would be the most severe failures, the possible cause of each failure and the respective maintenance action. Through the results obtained, it was possible to identify a set of elements of the FFFV where maintenance should pay additional attention so that the vehicle guarantees the desired levels of reliability and propose a maintenance program with added value compared to what is currently practised. Full article
Show Figures

Figure 1

Figure 1
<p>Portuguese Forest Fire Fighting Vehicle (source: Fátima’s FB).</p>
Full article ">Figure 2
<p>Excerpt of Technical checklist of a FFFV (source (given directly to the author): Fátima’s FB).</p>
Full article ">Figure 3
<p>Fuzzy sets for Severity (S).</p>
Full article ">Figure 4
<p>Fuzzy sets for Occurrence (O).</p>
Full article ">Figure 5
<p>Fuzzy sets for Detectability (D).</p>
Full article ">Figure 6
<p>Inference rules.</p>
Full article ">Figure 7
<p>Fuzzy sets for Criticality (RPN).</p>
Full article ">Figure 8
<p>Fuzzy logic software in MATLAB—Version 8.2 (R2013b).</p>
Full article ">Figure 9
<p>Calculation of RPN using fuzzy logic software.</p>
Full article ">Figure 10
<p>FMECA of the engine.</p>
Full article ">Figure 11
<p>Fuzzy analysis of the engine.</p>
Full article ">
22 pages, 8767 KiB  
Article
Performance-Based Evacuation Optimization for Teaching Building with Heterogeneous Populations: Simulation and Numerical Studies
by Lanyu Yang, Bailing Zhou and Tao Wu
Fire 2023, 6(7), 273; https://doi.org/10.3390/fire6070273 - 13 Jul 2023
Cited by 1 | Viewed by 1807
Abstract
Building evacuation safety has been one of the focal points of researchers, and there is a wealth of research findings for certain places (e.g., buildings with a high population density) or for particular research subjects (e.g., the physically challenged ethnic group). However, current [...] Read more.
Building evacuation safety has been one of the focal points of researchers, and there is a wealth of research findings for certain places (e.g., buildings with a high population density) or for particular research subjects (e.g., the physically challenged ethnic group). However, current publications are relatively rare in analyzing the features of physically impaired individuals in crowded places and their impact on the effectiveness of the whole evacuation process, including non-disabled people. Additionally, only such studies tend to concentrate on the behavioral characteristics of disabled people, which lack exploring and comparing evacuation optimization strategies and evaluation of comprehensive evacuation performance. This paper proposed a computer simulation-based method that combined horizontally phased evacuation and vertically phased evacuation, supplemented with the use of handicapped ramps and a reasonable arrangement of class locations, to achieve the optimal evacuation performance of a teaching building with special consideration of the heterogeneous population. And then, a simulated building model was constructed to test and compare the effectiveness and applicability of these approaches through 33 evacuation scenario studies. The results found that (1) component design can improve evacuation effectiveness, with the arrangement of ramps and the location of stair doors successfully reducing evacuation time by 12% and 6.6%, respectively; (2) a combination of two ramps and separate handicap access can decrease evacuation time by 18%; (3) the horizontal-phased evacuation approach drops evacuation time by 7.1%, but the vertical-phased evacuation strategy is not very efficient. When the two are successfully combined, evacuation time is further reduced to 9.2%; and (4) based on the above measures, the evacuation time can be finally shortened by 19% if the veteran teachers are concentrated in the classrooms on the lower floors. These obtained conclusions will provide significant reference and methodological support for the safe evacuation of other similar buildings with heterogeneous populations. Full article
Show Figures

Figure 1

Figure 1
<p>Building overview drawing.</p>
Full article ">Figure 2
<p>The floor layout of the teaching building.</p>
Full article ">Figure 3
<p>Fire development stage.</p>
Full article ">Figure 4
<p>Save evacuation.</p>
Full article ">Figure 5
<p>Abstract basis of the model construction.</p>
Full article ">Figure 6
<p>Side view of the 6-story teaching building.</p>
Full article ">Figure 7
<p>Scene diagrams.</p>
Full article ">Figure 8
<p>Section of the building from vertically phased evacuation scenarios.</p>
Full article ">Figure 9
<p>The research method and workflow of the simulation. (<b>a</b>) Staircase design; (<b>b</b>) Phased evacuation; (<b>c</b>) Ramp installation; (<b>d</b>) Emplacement.</p>
Full article ">Figure 10
<p>Classified analysis of scenario clusters.</p>
Full article ">Figure 11
<p>The evacuation times of NE, CD1, and CD2 scenarios.</p>
Full article ">Figure 12
<p>The evacuation scene of staircase 2 on the fifth floor. (<b>a</b>) NE, (<b>b</b>) CD1.</p>
Full article ">Figure 13
<p>The evacuation time in vertically phased evacuation scenarios.</p>
Full article ">Figure 14
<p>The accumulated usage in the staircase 2 on the fifth floor. (<b>a</b>) NE, (<b>b</b>) 236.</p>
Full article ">Figure 15
<p>The density of people in staircases.</p>
Full article ">Figure 16
<p>The evacuation times of NE, VPE(236), HPEA, and HPEB scenarios.</p>
Full article ">Figure 17
<p>The evacuation times of NE, HPEB, R1, R2, R3, and R4 scenarios.</p>
Full article ">Figure 18
<p>The evacuation times of NE, R4, ER1, and ER2 scenarios.</p>
Full article ">
21 pages, 4391 KiB  
Article
Modeling of Evaporation Rate for Peatland Fire Prevention Using Internet of Things (IoT) System
by Lu Li, Aduwati Sali, Nor Kamariah Noordin, Alyani Ismail, Fazirulhisyam Hashim, Mohd Fadlee A. Rasid, Marsyita Hanafi, Sheriza Mohd Razali, Nurizana Amir Aziz, Imas Sukaesih Sitanggang, Lailan Syaufina and Ati Dwi Nurhayati
Fire 2023, 6(7), 272; https://doi.org/10.3390/fire6070272 - 13 Jul 2023
Cited by 3 | Viewed by 3383
Abstract
Peatland refers to the peat soil and wetland biological environment growing on the surface. However, unexpected fires in peatlands frequently have brought severe greenhouse gas emissions and transboundary haze to Southeast Asia. To alleviate this issue, this paper first establishes an Internet of [...] Read more.
Peatland refers to the peat soil and wetland biological environment growing on the surface. However, unexpected fires in peatlands frequently have brought severe greenhouse gas emissions and transboundary haze to Southeast Asia. To alleviate this issue, this paper first establishes an Internet of Things (IoT) system for peatland monitoring and management in the Raja Musa Forest Reserve (RMFR) in Selangor, Malaysia, and proposes a more efficient and low-complexity model for calculating the Duff Moisture Code (DMC) in peatland forests using groundwater level (GWL) and relative humidity. The feasibility of the IoT system is verified by comparing its data with those published by Malaysian Meteorological Department (METMalaysia). The proposed Linear_DMC Model and Linear_Mixed_DMC Model are compared with the Canadian Fire Weather Index (FWI) model, and their performance is evaluated using IoT measurement data and actual values published by METMalaysia. The results show that the correlation between the measured data of the IoT system and the data from METMalaysia within the same duration is larger than 0.84, with a mean square error (MSE) of 2.56, and a correlation of 0.91 can be achieved between calculated DMC using the proposed model and actual values. This finding is of great significance for predicting peatland forest fires in the field and providing the basis for fire prevention and decision making to improve disaster prevention and reduction. Full article
Show Figures

Figure 1

Figure 1
<p>Peatland Distribution in RMFR (3°27′58″ N, 101°26′31″ E).</p>
Full article ">Figure 2
<p>Deployment Structure of The IoT System.</p>
Full article ">Figure 3
<p>Structure of the Canadian FWI System [<a href="#B33-fire-06-00272" class="html-bibr">33</a>].</p>
Full article ">Figure 4
<p>The Proposed Model Integrates GWL into FWI System.</p>
Full article ">Figure 5
<p>Curve Fitting of DMC, GWL, and Humidity of Linear_DMC Model.</p>
Full article ">Figure 6
<p>Curve Fitting of DMC, GWL, and Humidity of Linear_Mixed_DMC Model.</p>
Full article ">Figure 7
<p>Comparison of goodness of fit between different models. (<b>a</b>) Linear_DMC Model, (<b>b</b>) Linear_Mixed_DMC Model.</p>
Full article ">Figure 8
<p>Comparison of METMalaysia and IoT System in Rainfall.</p>
Full article ">Figure 9
<p>Comparison of METMalaysia and IoT System in Humidity.</p>
Full article ">Figure 10
<p>Comparison of METMalaysia and IoT System in Daily Maximum Temperature.</p>
Full article ">Figure 11
<p>Groundwater Level (GWL) Measured by IoT System.</p>
Full article ">Figure 12
<p>Using IoT System and METMalaysia Data to Calculate DMC Based on Canadian Model.</p>
Full article ">Figure 13
<p>Comparison Between Different Models and METMalaysia.</p>
Full article ">Figure 14
<p>Performance Comparison Between Different Models.</p>
Full article ">
23 pages, 6707 KiB  
Article
A Real-Time Pre-Response Experiment System for High-Rise Building Fires Based on the Internet of Things
by Haoyou Zhao, Zhaoyang Yu and Jinpeng Zhu
Fire 2023, 6(7), 271; https://doi.org/10.3390/fire6070271 - 9 Jul 2023
Cited by 1 | Viewed by 1829
Abstract
The primary objective of the current fire protection system in high-rise buildings is to extinguish fires in close proximity to the detectors. However, in the event of rapidly spreading fires, it is more effective to limit the transmission of fire and smoke. This [...] Read more.
The primary objective of the current fire protection system in high-rise buildings is to extinguish fires in close proximity to the detectors. However, in the event of rapidly spreading fires, it is more effective to limit the transmission of fire and smoke. This study aims to develop an IoT-based real-time pre-response system for high-rise building fires that is capable of limiting the spread of fire and smoke. The proposed system collects fire data from sensors and transmits them to a cloud computer for real-time analysis. Based on the analysis results, the cloud computer controls the actions of alarm devices, ventilation equipment, and fine water mist nozzles. The system can dynamically adjust the entire system’s behavior in real time by adopting pre-response measures to extinguish fires and limit the spread of fires and smoke. The system was tested on a simulation platform similar to actual high-rise buildings to evaluate its impact on fires and smoke. The results demonstrate the system’s effectiveness in extinguishing fires and suppressing the spread of fires and smoke. Full article
(This article belongs to the Special Issue Ensuring Safety against Fires in Overcrowded Urban Areas)
Show Figures

Figure 1

Figure 1
<p>Schematic diagram of abstracting high-rise buildings into network models.</p>
Full article ">Figure 2
<p>Long channel abstracted as a multi-node schematic diagram.</p>
Full article ">Figure 3
<p>Schematic diagram of heat release process.</p>
Full article ">Figure 4
<p>Visualization of high-rise buildings in graph theory model.</p>
Full article ">Figure 5
<p>Architectural visualization of 6 rooms on each floor of a 5-story building.</p>
Full article ">Figure 6
<p>System pre-response logic.</p>
Full article ">Figure 7
<p>Building class structure in simulation programs.</p>
Full article ">Figure 8
<p>Overall system structure.</p>
Full article ">Figure 9
<p>System topology diagram.</p>
Full article ">Figure 10
<p>System source code flowchart.</p>
Full article ">Figure 11
<p>Top-view schematic diagram of the model.</p>
Full article ">Figure 12
<p>Model appearance.</p>
Full article ">Figure 13
<p>Temperature curves of rooms and corridors with ignition over time under experimental conditions 8-12 and 8-13.</p>
Full article ">Figure 14
<p>Temperature curves of rooms and corridors with ignition over time under experimental conditions 10-1 and 10-2.</p>
Full article ">Figure 15
<p>Comparison of particle concentration, at the vertical channel outlet between experiments 8-12 and 8-13.</p>
Full article ">Figure 16
<p>Comparison of illuminance change curves between experiments 9-8 and 9-10.</p>
Full article ">Figure 17
<p>The situation of a constant light source in smoke.</p>
Full article ">Figure 18
<p>Screenshot of MariaDB database.</p>
Full article ">
13 pages, 4149 KiB  
Article
Study on the Image Processing Methods for a Flame Exposed to an Incense Smoke Environment
by Biao Sun, Weishan Zhang, Wei Wang and Danping Hao
Fire 2023, 6(7), 270; https://doi.org/10.3390/fire6070270 - 6 Jul 2023
Viewed by 1343
Abstract
Identification of flames to detect fires is hindered by the smoke generated from Chinese incense in traditional temples. Especially during holiday periods, smoke presents a large influence on the effectiveness of image-based flame identification. To have a deep understanding of the incense smoke [...] Read more.
Identification of flames to detect fires is hindered by the smoke generated from Chinese incense in traditional temples. Especially during holiday periods, smoke presents a large influence on the effectiveness of image-based flame identification. To have a deep understanding of the incense smoke impacting the flame outline, a series of tests were conducted to study the flame, varying incense smoke concentration and test time, respectively. It is found that when the flame is exposed to a thin incense smoke environment, nearly all the methods used for flame identification are effective. When the flame is surrounded by thick smoke, the flame image after treating by the self-adaptive image histogram equalization method is blurry. When the retinex algorithm is used for image treatment, the blue color near the flame is detected, which enlarges the flame area detection. The retinex algorithm can be used to obtain a clear flame outline even when the flame is exposed to a cloud of thick smoke. This is important for flame identification in the traditional Chinese temples where the thick smoke surrounds them, especially during national holiday periods. This work attempts to provide a potential method for flame identification and improve the safety level of historic buildings. Full article
Show Figures

Figure 1

Figure 1
<p>A description of incense smoke in a Chinese wooden historic building. (<a href="https://ishare.ifeng.com/c/s/7oSn9i9p0ZI" target="_blank">https://ishare.ifeng.com/c/s/7oSn9i9p0ZI</a>, accessed on 5 May 2023).</p>
Full article ">Figure 2
<p>The description of the experimental apparatus and flame shape.</p>
Full article ">Figure 3
<p>The descriptions of flame shape with the varying smoke concentration are listed as: (<b>a</b>) 0 min; (<b>b</b>) 3 min; (<b>c</b>) 6 min; (<b>d</b>) 9 min; (<b>e</b>) 12 min; (<b>f</b>) 15 min; (<b>g</b>) 18 min; (<b>h</b>) 21 min; (<b>i</b>) 24 min; (<b>j</b>) 27 min; (<b>k</b>) 30 min; (<b>l</b>) summary.</p>
Full article ">Figure 3 Cont.
<p>The descriptions of flame shape with the varying smoke concentration are listed as: (<b>a</b>) 0 min; (<b>b</b>) 3 min; (<b>c</b>) 6 min; (<b>d</b>) 9 min; (<b>e</b>) 12 min; (<b>f</b>) 15 min; (<b>g</b>) 18 min; (<b>h</b>) 21 min; (<b>i</b>) 24 min; (<b>j</b>) 27 min; (<b>k</b>) 30 min; (<b>l</b>) summary.</p>
Full article ">Figure 4
<p>The description of flame figure with varying smoke treatment methods at t = 6 min: (<b>a</b>) original figure; (<b>b</b>) dark channel prior; (<b>c</b>) a fuzzy function; (<b>d</b>) real-time polarimetric dehazing; (<b>e</b>) multi-scale retinex; (<b>f</b>) self-adaptive image histogram equalization algorithm; (<b>g</b>) automatic color equalization algorithm; (<b>h</b>) summary.</p>
Full article ">Figure 5
<p>The description of flame figure with varying smoke treatment methods at t = 27 min: (<b>a</b>) original figure; (<b>b</b>) dark channel prior; (<b>c</b>) a fuzzy function; (<b>d</b>) real-time polarimetric dehazing; (<b>e</b>) multi-scale retinex; (<b>f</b>) self-adaptive image histogram equalization algorithm; (<b>g</b>) automatic color equalization algorithm; (<b>h</b>) summary.</p>
Full article ">Figure 5 Cont.
<p>The description of flame figure with varying smoke treatment methods at t = 27 min: (<b>a</b>) original figure; (<b>b</b>) dark channel prior; (<b>c</b>) a fuzzy function; (<b>d</b>) real-time polarimetric dehazing; (<b>e</b>) multi-scale retinex; (<b>f</b>) self-adaptive image histogram equalization algorithm; (<b>g</b>) automatic color equalization algorithm; (<b>h</b>) summary.</p>
Full article ">
11 pages, 5702 KiB  
Article
Comparative Study of the Suppression Behavior and Fire-Extinguishing Mechanism of Compressed-Gas Aqueous Film-Forming Foam in Diesel Pool Fires
by Long Yan, Ning Wang, Jingjing Guan, Zheng Wei, Qiaowei Xiao and Zhisheng Xu
Fire 2023, 6(7), 269; https://doi.org/10.3390/fire6070269 - 6 Jul 2023
Cited by 4 | Viewed by 2379
Abstract
A compressed-gas fire extinguishing experiment was carried out to analyze the impact of gas-liquid flow ratio, liquid flow rate and driving pressure on the fire suppression efficiency of aqueous film-forming foam (AFFF) in a diesel pool fire, and a possible fire-extinguishing mechanism was [...] Read more.
A compressed-gas fire extinguishing experiment was carried out to analyze the impact of gas-liquid flow ratio, liquid flow rate and driving pressure on the fire suppression efficiency of aqueous film-forming foam (AFFF) in a diesel pool fire, and a possible fire-extinguishing mechanism was proposed. A fire suppression test showed that AFFF at a gas-liquid flow ratio of 16 between the range of 5 to 24 had the fastest fire-extinguishing temperature drop rate (16.67 °C/s), the shortest fire-extinguishing time, of 42 s, and the lowest foam solution consumption of 230 g, exhibiting the best fire suppression performance. Meanwhile, the fire suppression efficiency of AFFF improved with the augmentation of either liquid flow rate or system driving pressure. Based on fluid mechanics and combustion science, a foam fire-extinguishing mechanism was proposed to explain the influence of system parameters such as gas-liquid ratio, liquid flow rate and driving pressure on key combustion parameters such as temperature drop rate, evaporation rate and combustion rate, which can better illustrate the change in fire extinguishing performance. Full article
(This article belongs to the Special Issue Fire Prevention and Flame Retardant Materials)
Show Figures

Figure 1

Figure 1
<p>Diagram of fire extinguishing device (the data used in this paper were measured with the red thermocouple).</p>
Full article ">Figure 2
<p>Temperature variation curves of diesel pool fire with application of different gas-liquid flow ratios of AFFF.</p>
Full article ">Figure 3
<p>The flame extinction process of the foam with a gas-liquid flow ratio of 16.</p>
Full article ">Figure 4
<p>The flame extinction process of AFFF with different foam volume flow rates: (<b>a</b>) 20 L/h, (<b>b</b>) 40 L/h and (<b>c</b>) 60 L/h.</p>
Full article ">Figure 5
<p>The flame extinction process of AFFF with different system driving pressures: (<b>a</b>) 0.3 MPa, (<b>b</b>) 0.4 MPa and (<b>c</b>) 0.5 Mpa.</p>
Full article ">Figure 6
<p>Heat transfer diagram of fire-extinguishing process.</p>
Full article ">Figure 7
<p>Flame temperature variation in fire-extinguishing process at gas-liquid flow ratio of 16.</p>
Full article ">
19 pages, 318 KiB  
Concept Paper
Multiple Stories, Multiple Marginalities: The Labor-Intensive Forest and Fire Stewardship Workforce in Oregon
by Emily Jane Davis, Carl Wilmsen, Manuel A. Machado and Gianna M. Alessi
Fire 2023, 6(7), 268; https://doi.org/10.3390/fire6070268 - 6 Jul 2023
Cited by 2 | Viewed by 2191
Abstract
Latino/a/x workers perform labor-intensive forestry and fire stewardship work in the U.S. Pacific Northwest, but are not well recognized in research and practice about wildfire governance. This industry has pervasive issues of unsafe working conditions, inequitable wage practices, violations of worker rights, limited [...] Read more.
Latino/a/x workers perform labor-intensive forestry and fire stewardship work in the U.S. Pacific Northwest, but are not well recognized in research and practice about wildfire governance. This industry has pervasive issues of unsafe working conditions, inequitable wage practices, violations of worker rights, limited opportunity for advancement, and a lack of recognition and inclusion of workers in decision making. We draw on a literature review and practice-based knowledge to make this workforce’s history more visible, from its origins in lumber production and reforestation to expansion into forest and fire stewardship. We suggest a new conceptual framing of “multiple marginalities” that situates this workforce as simultaneously crucial to our future with wildfire and subject to structural, distributional, recognitional, and procedural inequities. We recommend new approaches to research and practice that can better examine and address these inequities, while also acknowledging the persistent and systemic nature of these challenges. These include participatory action research, lessons learned from research and advocacy related to farmworkers and incarcerated workers, and Cooperative Extension and education programs that are learner-centered and culturally appropriate. Multiple interventions of offering education and outreach, enforcing or reforming law, and changing policy and practice must all occur at multiple scales given the many drivers of these marginalities. Study and practice can contribute new knowledge to inform this and expand current conceptions of equity and environmental justice in the wildfire governance literature to become more inclusive of the forest and fire stewardship workforce. Full article
(This article belongs to the Special Issue Reimagining the Future of Living and Working with Fire)
26 pages, 13786 KiB  
Article
Unraveling the Effect of Fire Seasonality on Fire-Preferred Fuel Types and Dynamics in Alto Minho, Portugal (2000–2018)
by Emanuel Oliveira, Paulo M. Fernandes, David Barros and Nuno Guiomar
Fire 2023, 6(7), 267; https://doi.org/10.3390/fire6070267 - 6 Jul 2023
Cited by 2 | Viewed by 1971
Abstract
Socio-demographic changes in recent decades and fire policies centered on fire suppression have substantially diminished the ability to maintain low fuel loads at the landscape scale in marginal lands. Currently, shepherds face many barriers to the use of fire for restoring pastures in [...] Read more.
Socio-demographic changes in recent decades and fire policies centered on fire suppression have substantially diminished the ability to maintain low fuel loads at the landscape scale in marginal lands. Currently, shepherds face many barriers to the use of fire for restoring pastures in shrub-encroached communities. The restrictions imposed are based on the lack of knowledge of their impacts on the landscape. We aim to contribute to this clarification. Therefore, we used a dataset of burned areas in the Alto Minho region for seasonal and unseasonal (pastoral) fires. We conducted statistical and spatial analyses to characterize the fire regime (2001–2018), the distribution of fuel types and their dynamics, and the effects of fire on such changes. Unseasonal fires are smaller and spread in different spatial contexts. Fuel types characteristic of maritime pine and eucalypts are selected by seasonal fires and avoided by unseasonal fires which, in turn, showed high preference for heterogeneous mosaics of herbaceous and shrub vegetation. The area covered by fuel types of broadleaved and eucalypt forest stands increased between 2000 and 2018 at the expense of the fuel type corresponding to maritime pine stands. Results emphasize the role of seasonal fires and fire recurrence in these changes, and the weak effect of unseasonal fires. An increase in the maritime pine fuel type was observed only in areas burned by unseasonal fires, after excluding the areas overlapping with seasonal fires. Full article
(This article belongs to the Special Issue Fire Regimes and Ecosystem Resilience)
Show Figures

Figure 1

Figure 1
<p>Geographical context of the study area, Alto Minho: (<b>a</b>) Location of the study region in western Europe; (<b>b</b>) Administrative regions of mainland Portugal (NUTS II); (<b>c</b>) Municipalities in the study region. Source: Official Administrative Map of Portugal, Direção-Geral do Território—DGT 2020.</p>
Full article ">Figure 2
<p>Annual distribution of the fire patches (<b>a</b>) and the burned area (<b>b</b>). The yellow dots represent the percentage of the fire patches and the burned area by non-seasonal fires. NP-BA: total number of fire patches; FS-NP: number of patches of seasonal fires; NFS-NP: number of patches of non-seasonal fires; T-BA: burned area by all fires; FS-BA: burned area by seasonal fires; NFS-BA: burned area by non-seasonal fires.</p>
Full article ">Figure 3
<p>Spatial distribution of fire recurrence between 2001 and 2018 considering all fires (<b>a</b>), and the areas burned during the fire season (<b>b</b>) and outside the fire season (<b>c</b>).</p>
Full article ">Figure 4
<p>Violin plots with the distribution of fire size by individual fires between 2001 and 2018 during the fire season (FS) and outside the fire season (NFS) (burned area by individual fires is represented in log scale on the <span class="html-italic">y</span>-axis).</p>
Full article ">Figure 5
<p>Raincloud plots showing the distribution of fire patches and burned area by fire size classes considering the total number of events (<b>a</b>), the fire-season fires (<b>b</b>) and the non-seasonal fires (<b>c</b>).</p>
Full article ">Figure 6
<p>Spatial distribution of fuel types in 2000 (<b>a</b>) and in 2018 (<b>b</b>), and changes between 2000 and 2018 (<b>c</b>).</p>
Full article ">Figure 7
<p>Sankey diagram showing the main flows between 2000 and 2018 in the fuel types in the study region (see <a href="#fire-06-00267-t001" class="html-table">Table 1</a> for a brief description of the fuel types).</p>
Full article ">Figure 8
<p>Sankey diagram displaying the main flows between 2000 and 2018 in the fuel types affected by fires during the fire season (see <a href="#fire-06-00267-t001" class="html-table">Table 1</a> for a brief description of the fuel types).</p>
Full article ">Figure 9
<p>Sankey diagram displaying the main flows between 2000 and 2018 in the fuel types affected by non-seasonal fires (see <a href="#fire-06-00267-t001" class="html-table">Table 1</a> for a brief description of the fuel types).</p>
Full article ">Figure 10
<p>Contribution of the seasonal and non-seasonal fires to changes in fuel types in the burned areas between 2000 and 2018 in Alto Minho.</p>
Full article ">
27 pages, 35157 KiB  
Article
Underground Evacuation and Smoke Flow Simulation in Guangzhou International Financial City during Fire
by Longhui Liao, Hong Li, Pengyu Li, Xiaohua Bao, Chengyu Hong, Daochu Wang, Xiaofeng Xie, Jianhao Fan and Peichen Wu
Fire 2023, 6(7), 266; https://doi.org/10.3390/fire6070266 - 5 Jul 2023
Cited by 4 | Viewed by 1727
Abstract
The underground space in the Starting Area in the Guangzhou International Financial City is being developed to save resources and improve land benefits. However, high-density development has increased the likelihood of fires. Therefore, PyroSim and Pathfinder were used in this study to investigate [...] Read more.
The underground space in the Starting Area in the Guangzhou International Financial City is being developed to save resources and improve land benefits. However, high-density development has increased the likelihood of fires. Therefore, PyroSim and Pathfinder were used in this study to investigate the fire smoke flow and personnel evacuation in the underground space in the Starting Area. Firstly, the 2D temperature cloud map and the temperature and visibility recorded by sensor A over time of Zone I in the Starting Area were analyzed. Then, the 3D smoke diffusion, the 3D temperature diffusion map, and the value of thermocouple and smoke obscuration recorded by sensors of Zone II were analyzed. Next, smoke flow of Zones III to V in the Starting Area under different fire source positions was simulated. Finally, the personnel evacuation model was established to simulate the personnel flow rate and density. The simulation results show that the available safe evacuation time for people is 530 s when all the firefighting facilities fail and fire breaks out in Zone I. For large public spaces, the overall spread speed of fire is fast, which requires the use of the fire control system in time to control the spread of fire. Fortunately, the space of evacuation time is relatively sufficient; it only takes 143 s to evacuate personnel safely in Zone II, which is sufficient compared to the time for the fire to completely spread. Suggestions were made for fire safety management, such as evacuating personnel to the safety exits of other adjacent areas during a fire and installing linkage fire alarm systems in large public space s. Full article
Show Figures

Figure 1

Figure 1
<p>Geographical location map of the Guangzhou International Financial City.</p>
Full article ">Figure 2
<p>Schematic of the underground space in the Starting Area.</p>
Full article ">Figure 3
<p>BIM ichnography of the Starting Area in Guangzhou International Financial City.</p>
Full article ">Figure 4
<p>PyroSim model of Zone I: (<b>a</b>) ichnography; (<b>b</b>) three-dimensional diagram.</p>
Full article ">Figure 5
<p>PyroSim model of Zone II: (<b>a</b>) ichnography; (<b>b</b>) three-dimensional diagram.</p>
Full article ">Figure 6
<p>Public mezzanine in Zone I.</p>
Full article ">Figure 7
<p>2D temperature cloud map of fire in Zone I.</p>
Full article ">Figure 7 Cont.
<p>2D temperature cloud map of fire in Zone I.</p>
Full article ">Figure 7 Cont.
<p>2D temperature cloud map of fire in Zone I.</p>
Full article ">Figure 8
<p>Temperature and visibility recorded by sensor A in <a href="#fire-06-00266-f007" class="html-fig">Figure 7</a>.</p>
Full article ">Figure 9
<p>3D Smoke diffusion in Zone I.</p>
Full article ">Figure 10
<p>Locations of fire source and sprinklers in Zone II.</p>
Full article ">Figure 11
<p>3D view of temperature diffusion in Zone II: (<b>a</b>) 30 s; (<b>b</b>) 60 s; (<b>c</b>) 120 s; (<b>d</b>) 180 s.</p>
Full article ">Figure 11 Cont.
<p>3D view of temperature diffusion in Zone II: (<b>a</b>) 30 s; (<b>b</b>) 60 s; (<b>c</b>) 120 s; (<b>d</b>) 180 s.</p>
Full article ">Figure 12
<p>Sensor layout near the upper part of main passage.</p>
Full article ">Figure 13
<p>Sensor values near the upper part of main passage: (<b>a</b>) thermocouple; (<b>b</b>) smoke obscuration.</p>
Full article ">Figure 14
<p>Layout of sensors near Stair 1.</p>
Full article ">Figure 15
<p>Value of sensors near Stair 1: (<b>a</b>) thermocouple; (<b>b</b>) smoke obscuration.</p>
Full article ">Figure 15 Cont.
<p>Value of sensors near Stair 1: (<b>a</b>) thermocouple; (<b>b</b>) smoke obscuration.</p>
Full article ">Figure 16
<p>Sensor layout near Stair 2.</p>
Full article ">Figure 17
<p>Value of sensors near Stair 2: (<b>a</b>) thermocouple; (<b>b</b>) smoke obscuration.</p>
Full article ">Figure 18
<p>Sensor layout near Stair 3.</p>
Full article ">Figure 19
<p>Value of sensors near Stair 3: (<b>a</b>) thermocouple; (<b>b</b>) smoke obscuration.</p>
Full article ">Figure 19 Cont.
<p>Value of sensors near Stair 3: (<b>a</b>) thermocouple; (<b>b</b>) smoke obscuration.</p>
Full article ">Figure 20
<p>Zones III, IV, and V in Huacheng Avenue.</p>
Full article ">Figure 21
<p>Fire simulation of different fire sources on Huacheng Avenue: (<b>a</b>) shop of the first underground layer in Zone IV away from the exit; (<b>b</b>) shop of the first underground layer in Zone IV near the exit; (<b>c</b>) restaurant of the first underground layer in Zone III; (<b>d</b>) restaurant of the first underground layer in Zones IV; (<b>e</b>) generator room of the first underground layer in Zone IV; (<b>f</b>) air-conditioner room of the first underground layer in Zone V near the exit.</p>
Full article ">Figure 22
<p>Fire simulation of different fire sources on Zone IV: (<b>a</b>) waiting room (edge) of the bus station in the underground mezzanine; (<b>b</b>) waiting room (center) of the bus station in the underground mezzanine; (<b>c</b>) security checkpoint of the subway station in the first underground layer; (<b>d</b>) exit of the subway station in the first underground layer.</p>
Full article ">Figure 23
<p>Fire simulation of loops of the second underground layer in: (<b>a</b>) Zone IV; (<b>b</b>) Zone V.</p>
Full article ">Figure 24
<p>Personnel evacuation model.</p>
Full article ">Figure 25
<p>Evacuation simulation result at 4.9 s.</p>
Full article ">Figure 26
<p>Personnel flow rate at Exits 1 and 2.</p>
Full article ">Figure 27
<p>Evacuation simulation result at 18 s.</p>
Full article ">Figure 28
<p>Personnel flow rate at Exits 3 to 7.</p>
Full article ">Figure 29
<p>Evacuation simulation result at 36 s.</p>
Full article ">Figure 30
<p>Personnel flow rate at Exit 8.</p>
Full article ">Figure 31
<p>Evacuation simulation result at 60 s.</p>
Full article ">Figure 32
<p>Evacuation simulation result at 45 s.</p>
Full article ">Figure 33
<p>Evacuation simulation result at 58 s.</p>
Full article ">Figure 34
<p>Personnel flow rate at Exits 9 and 10.</p>
Full article ">Figure 35
<p>Evacuation simulation result at 148 s.</p>
Full article ">
15 pages, 1359 KiB  
Article
Effects of Fire Frequency Regimes on Flammability and Leaf Economics of Non-Graminoid Vegetation
by Arthur Lamounier Moura, Daniel Negreiros and Geraldo Wilson Fernandes
Fire 2023, 6(7), 265; https://doi.org/10.3390/fire6070265 - 4 Jul 2023
Cited by 1 | Viewed by 1962
Abstract
Fire is an ecological factor that strongly influences plant communities and functional traits. Communities respond differently to fire, either decreasing or increasing in flammability and resource acquisition strategies. This study aimed to investigate the influence of fire over traits associated with flammability and [...] Read more.
Fire is an ecological factor that strongly influences plant communities and functional traits. Communities respond differently to fire, either decreasing or increasing in flammability and resource acquisition strategies. This study aimed to investigate the influence of fire over traits associated with flammability and the plant economic spectrum in a stressful and infertile mountainous grassland located in the Espinhaço mountain range in Brazil. Non-graminoid plant species were sampled in 60 5 m × 5 m plots distributed in three fire frequency categories. We measured several traits related to flammability—leaf dry matter content (LDMC), twig dry matter content, leaf area, bark thickness, branching architecture, plant height, leaf toughness (LT), and specific leaf area (SLA). Traits responded differently to the increase in fire frequency. For instance, the LDMC and LT were lower while the SLA was higher at high fire frequencies, indicating a trend towards reduced heat release and fire residence time. This shift resulted in the dominance of plants with a relatively more acquisitive strategy. This study brings evidence that traits respond coordinately towards a reduction of flammability with the increase in fire frequency and are strong indicators of the filtering role that fire plays as a disturbance on rupestrian grassland vegetation. Full article
Show Figures

Figure 1

Figure 1
<p>Map of the study area in the District of Santana do Riacho, Minas Gerais, Brazil, where we sampled functional traits in the rupestrian grassland non-graminoid vegetation. Box <b>1</b> provides an overview of the study area within the state of Minas Gerais, Brazil, while Box <b>2</b> includes a more detailed representation of the study area and its fire frequency regimes. The green color in Box <b>2</b> represents areas with low fire frequency (more than four years of fire return interval), the yellow color represents areas under medium frequency (between two and three years of fire return interval), and, in red, the areas under high fire frequency (less than two years of fire return interval). This map was modified from the fire history reconstruction made by Alvarado et al., (2017) [<a href="#B45-fire-06-00265" class="html-bibr">45</a>]. The colored squares in Box <b>2</b> are shown in detail in boxes (<b>a</b>–<b>c</b>), where the sampling points are represented in geometric shapes (●, low-frequency; ■, medium-frequency; and ▲, high fire frequency).</p>
Full article ">Figure 2
<p>Set of traits measured in the most common rupestrian grasslands non-graminoid species, which together accounted for 70–80% of the total abundance in the sampling points of three fire frequency regimes (low, medium, and high). The traits are abbreviated as H (height), BR (branching architecture, LDMC (leaf dry matter content), TDMC (twig dry matter content), LA (leaf area), LT (leaf toughness), BT (bark thickness), and SLA (specific leaf area).</p>
Full article ">Figure 3
<p>Bar plots displaying the mean and standard error of functional traits in each fire frequency regime (low, medium, and high). (<b>a</b>) leaf dry matter content, (<b>b</b>) specific leaf area, (<b>c</b>) leaf toughness, (<b>d</b>) branching architecture. Fire frequency regimes with different letters indicate statistically significant differences at a probability level of &lt;0.05, based on Tukey’s HSD test.</p>
Full article ">
31 pages, 14821 KiB  
Article
The Role of Fuel Characteristics and Heat Release Formulations in Coupled Fire-Atmosphere Simulation
by Kasra Shamsaei, Timothy W. Juliano, Matthew Roberts, Hamed Ebrahimian, Neil P. Lareau, Eric Rowell and Branko Kosovic
Fire 2023, 6(7), 264; https://doi.org/10.3390/fire6070264 - 2 Jul 2023
Cited by 2 | Viewed by 1828
Abstract
In this study, we focus on the effects of fuel bed representation and fire heat and smoke distribution in a coupled fire-atmosphere simulation platform for two landscape-scale fires: the 2018 Camp Fire and the 2021 Caldor Fire. The fuel bed representation in the [...] Read more.
In this study, we focus on the effects of fuel bed representation and fire heat and smoke distribution in a coupled fire-atmosphere simulation platform for two landscape-scale fires: the 2018 Camp Fire and the 2021 Caldor Fire. The fuel bed representation in the coupled fire-atmosphere simulation platform WRF-Fire currently includes only surface fuels. Thus, we enhance the model by adding canopy fuel characteristics and heat release, for which a method to calculate the heat generated from canopy fuel consumption is developed and implemented in WRF-Fire. Furthermore, the current WRF-Fire heat and smoke distribution in the atmosphere is replaced with a heat-conserving Truncated Gaussian (TG) function and its effects are evaluated. The simulated fire perimeters of case studies are validated against semi-continuous, high-resolution fire perimeters derived from NEXRAD radar observations. Furthermore, simulated plumes of the two fire cases are compared to NEXRAD radar reflectivity observations, followed by buoyancy analysis using simulated temperature and vertical velocity fields. The results show that while the improved fuel bed and the TG heat release scheme have small effects on the simulated fire perimeters of the wind-driven Camp Fire, they affect the propagation direction of the plume-driven Caldor Fire, leading to better-matching fire perimeters with the observations. However, the improved fuel bed representation, together with the TG heat smoke release scheme, leads to a more realistic plume structure in comparison to the observations in both fires. The buoyancy analysis also depicts more realistic fire-induced temperature anomalies and atmospheric circulation when the fuel bed is improved. Full article
Show Figures

Figure 1

Figure 1
<p>(<b>a</b>) surface and (<b>b</b>) canopy fuel loads for the Camp Fire and (<b>c</b>) surface fuel and (<b>d</b>) canopy fuel loads for the Caldor Fire simulation domains. The white perimeters depict the NEXRAD-derived fire perimeters at the end of the considered period in this study. It should be noted that the contour ranges for the two fires are different.</p>
Full article ">Figure 2
<p>Fuel mass loss curves adopted from (blue dashed line) [<a href="#B51-fire-06-00264" class="html-bibr">51</a>] and (red dashed line) [<a href="#B53-fire-06-00264" class="html-bibr">53</a>], and (black solid line) the fitted curve presented in Equation (4).</p>
Full article ">Figure 3
<p>Example of the proportion of the flux divergences calculated for this study’s model setup using (blue) exponential decay and (red) Truncated Gaussian scheme.</p>
Full article ">Figure 4
<p>Snapshots of fire progression of the Camp Fire case studies: (blue) CampBase, (red) CampCan, (green) CampTGH1, and (magenta) CampTGH2. Abbreviations are based on <a href="#fire-06-00264-t001" class="html-table">Table 1</a>, and the black dashed line shows the location of the simulations vertical cross section of <a href="#sec3dot1dot2-fire-06-00264" class="html-sec">Section 3.1.2</a> and <a href="#sec3dot1dot3-fire-06-00264" class="html-sec">Section 3.1.3</a>. The maroon dashed line indicates the cross-section location of NEXRAD reflectivity in <a href="#sec3dot1dot2-fire-06-00264" class="html-sec">Section 3.1.2</a>. The radar-derived perimeters are shown with gray shading.</p>
Full article ">Figure 5
<p>Vertical cross sections of the normalized simulated smoke concentration for the Camp Fire (<b>a</b>) CampBase, (<b>b</b>) CampCan, (<b>c</b>) CampTGH1, and (<b>d</b>) CampTGH2 cases together with (<b>e</b>) normalized NEXRAD-observed reflectivity when the fire is located roughly at the same longitude. The brown shading shows the terrain. The gray line and the red circles show the burned area and the fire head, respectively. Abbreviations are based on <a href="#fire-06-00264-t001" class="html-table">Table 1</a>.</p>
Full article ">Figure 6
<p>Time height plots of the maximum normalized simulated smoke concentration over the simulation domain for the Camp Fire (<b>a</b>) CampBase, (<b>b</b>) CampCan, (<b>c</b>) CampTGH1, and (<b>d</b>) CampTGH2 cases together with the time height plot of (<b>e</b>) normalized NEXRAD-observed reflectivity. Abbreviations are based on <a href="#fire-06-00264-t001" class="html-table">Table 1</a>.</p>
Full article ">Figure 7
<p>Vertical cross sections of the simulated (shaded contour) vertical velocity (W) and (black contour lines) temperature (in K) for the Camp Fire (<b>a</b>) CampBase, (<b>b</b>) CampCan, (<b>c</b>) CampTGH1, and (<b>d</b>) CampTGH2 cases for the same timestamp as plume cross sections in <a href="#fire-06-00264-f005" class="html-fig">Figure 5</a>. Arrows show the wind speed and direction, and the brown shading shows the terrain. The gray line and the red circles show the burned area and the fire head, respectively. Abbreviations are based on <a href="#fire-06-00264-t001" class="html-table">Table 1</a>.</p>
Full article ">Figure 8
<p>Time height plots of the maximum simulated temperature (T) over the simulation domain for the Camp Fire (<b>a</b>) CampBase, (<b>b</b>) CampCan, (<b>c</b>) CampTGH1, and (<b>d</b>) CampTGH2 cases. Abbreviations are based on <a href="#fire-06-00264-t001" class="html-table">Table 1</a>.</p>
Full article ">Figure 9
<p>Time height plots of the maximum simulated updraft (W) over the simulation domain for the Camp Fire (<b>a</b>) CampBase, (<b>b</b>) CampCan, (<b>c</b>) CampTGH1, and (<b>d</b>) CampTGH2 cases. Abbreviations are based on <a href="#fire-06-00264-t001" class="html-table">Table 1</a>.</p>
Full article ">Figure 10
<p>Snapshots of fire progression of the Caldor Fire case studies. Abbreviations in the legend are based on <a href="#fire-06-00264-t001" class="html-table">Table 1</a>, and the black dashed line shows the location of the vertical cross section of <a href="#sec3dot2dot2-fire-06-00264" class="html-sec">Section 3.2.2</a>. The radar-driven perimeters are shown with gray shading.</p>
Full article ">Figure 11
<p>Vertical cross sections of the normalized simulated smoke concentration for the Caldor Fire (<b>a</b>) CalBase, (<b>b</b>) CalCan, (<b>c</b>) CalTGH1, and (<b>d</b>) CalTGH2 cases together with (<b>e</b>) normalized NEXRAD-observed reflectivity when the fire is located roughly at the same location. The brown shading shows the terrain. The gray line and the red circles show the burned area and the fire head, respectively. Abbreviations are based on <a href="#fire-06-00264-t001" class="html-table">Table 1</a>.</p>
Full article ">Figure 12
<p>Time height plots of the maximum normalized simulated smoke concentration over the simulation domain for the Caldor Fire (<b>a</b>) CalBase, (<b>b</b>) CalCan, (<b>c</b>) CalTGH1, and (<b>d</b>) CalTGH2 cases together with (<b>e</b>) time height plot of normalized NEXRAD-observed reflectivity. Abbreviations are based on <a href="#fire-06-00264-t001" class="html-table">Table 1</a>.</p>
Full article ">Figure 13
<p>Comparison of the burned area from the simulations and NEXRAD-derived fire perimeters for (<b>a</b>) Camp Fire and (<b>b</b>) Caldor Fire. Abbreviations are based on <a href="#fire-06-00264-t001" class="html-table">Table 1</a>.</p>
Full article ">
16 pages, 5689 KiB  
Article
Influence of High Temperature on the Physical and Mechanical Properties of Porous Limestone from Baku (Azerbaijan)
by Clara Jodry, Michael J. Heap, Kamal Bayramov, Gunel Alizada, Sona Rustamova and Sevinj Nabiyeva
Fire 2023, 6(7), 263; https://doi.org/10.3390/fire6070263 - 2 Jul 2023
Cited by 2 | Viewed by 1866
Abstract
Limestone is a popular building stone worldwide. In Baku in Azerbaijan, local limestones have been used in construction, including in the walled historic city centre (Old City, Icherisheher). Located in a seismically-active area, Baku is prone to post-earthquake fires that can damage buildings [...] Read more.
Limestone is a popular building stone worldwide. In Baku in Azerbaijan, local limestones have been used in construction, including in the walled historic city centre (Old City, Icherisheher). Located in a seismically-active area, Baku is prone to post-earthquake fires that can damage buildings and monuments. Here, we test the fire resistance of local limestone by measuring its physical (connected porosity, permeability, P-wave velocity, thermal properties) and mechanical (uniaxial compressive strength, Young’s modulus) properties before and after thermal-stressing to temperatures up to 600 °C. Our results show that connected porosity and permeability increase and that P-wave velocity, thermal conductivity, thermal diffusivity, specific heat capacity, uniaxial compressive strength, and Young’s modulus decrease as a function of increasing temperature. Microstructural analyses show that these changes are the result of thermal microcracking. Samples heated to 800 °C disintegrated due to the formation of portlandite following decarbonation. The data presented herein will assist damage assessments of limestone buildings and monuments in Baku following the unfortunate event of fire. Full article
Show Figures

Figure 1

Figure 1
<p>(<b>a</b>) Map of Azerbaijan showing neighbouring countries, and the location of the Absheron Peninsula, the Caucasus Mountains, and Baku (latitude and longitude of Baku: 40.4093° N, 49.8671° E). (<b>b</b>) Zoomed-in map of the Baku area showing the location of the quarry at Guzdak (red circle) and the Icherisheher.</p>
Full article ">Figure 2
<p>Photographs of limestone building materials in Icherisheher in Baku (location shown in <a href="#fire-06-00263-f001" class="html-fig">Figure 1</a>b). (<b>a</b>) The Maiden Tower monument (16.5 metres in diameter at the base). (<b>b</b>) The wall of an inner street (pencil for scale; pencil is 15 cm long). (<b>c</b>) Zoom in on one of the building blocks of an inner house wall (metal hooks are 10 cm long).</p>
Full article ">Figure 3
<p>Photograph of a 25 mm diameter core sample (<b>left</b>) and an optical microscope image of the studied limestone (<b>right</b>).</p>
Full article ">Figure 4
<p>(<b>a</b>) The cumulative proportion of grains as a function of equivalent grain diameter. The mean grain size (820 μm) is also shown on the panel. (<b>b</b>) The cumulative proportion of grains as a function of grain aspect ratio (the minor grain axis divided by the major grain axis). The mean aspect ratio (0.53) is also shown on the panel. The total number of grains analysed = 623.</p>
Full article ">Figure 5
<p>Photographs of an intact sample (<b>a</b>) and samples thermally stressed to 100 °C (<b>b</b>), 200 °C (<b>c</b>), 400 °C (<b>d</b>), and 600 °C (<b>e</b>).</p>
Full article ">Figure 6
<p>(<b>a</b>) Connected porosity as a function of thermal stressing temperature. (<b>b</b>) Permeability as a function of thermal stressing temperature. (<b>c</b>) P-wave velocity as a function of thermal stressing temperature. Panels (<b>d</b>–<b>f</b>) show the relative change in connected porosity, permeability, and P-wave velocity, respectively.</p>
Full article ">Figure 7
<p>(<b>a</b>) Thermal conductivity as a function of thermal stressing temperature. (<b>b</b>) Thermal diffusivity as a function of thermal stressing temperature. (<b>c</b>) Specific heat capacity as a function of thermal stressing temperature. Panels (<b>d</b>–<b>f</b>) show the relative change in thermal conductivity, thermal diffusivity, and specific heat capacity, respectively.</p>
Full article ">Figure 8
<p>(<b>a</b>) Uniaxial stress-strain curves for intact limestone and limestones thermally stressed to temperatures of 100, 200, 400, and 600 °C. (<b>b</b>) Uniaxial compressive strength as a function of thermal stressing temperature. (<b>c</b>) The relative change of uniaxial compressive strength (UCS) as a function of thermal stressing temperature. (<b>d</b>) Young’s modulus as a function of thermal stressing temperature. (<b>e</b>) The relative change of Young’s modulus as a function of thermal stressing temperature.</p>
Full article ">Figure 9
<p>Optical microscope images of samples, taken using reflected light, of the studied limestone exposed to 400 °C (<b>a</b>) and 600 °C (<b>b</b>).</p>
Full article ">Figure 10
<p>Connected porosity change (<b>a</b>), P-wave velocity change (<b>b</b>), permeability change (<b>c</b>), thermal conductivity change (<b>d</b>), uniaxial compressive strength (UCS) change (<b>e</b>), and Young’s modulus change (<b>f</b>) as a function of thermal stressing temperature. The panels show data from this study (black circles) and data from previously published studies (grey symbols, [<a href="#B6-fire-06-00263" class="html-bibr">6</a>,<a href="#B7-fire-06-00263" class="html-bibr">7</a>,<a href="#B8-fire-06-00263" class="html-bibr">8</a>,<a href="#B10-fire-06-00263" class="html-bibr">10</a>,<a href="#B11-fire-06-00263" class="html-bibr">11</a>,<a href="#B13-fire-06-00263" class="html-bibr">13</a>,<a href="#B14-fire-06-00263" class="html-bibr">14</a>]).</p>
Full article ">
15 pages, 3569 KiB  
Article
Spatial Structure of Lightning and Precipitation Associated with Lightning-Caused Wildfires in the Central to Eastern United States
by Brian Vant-Hull and William Koshak
Fire 2023, 6(7), 262; https://doi.org/10.3390/fire6070262 - 2 Jul 2023
Cited by 1 | Viewed by 2178
Abstract
The horizontal storm structure surrounding 92,512 lightning-ignited wildfires is examined in the mid to eastern sections of the United States from 2003 to 2015 using Vaisala’s National Lightning Detection Network (NLDN), NCEP’s Stage IV gauge-corrected radar precipitation mosaic, and the US Forest Service’s [...] Read more.
The horizontal storm structure surrounding 92,512 lightning-ignited wildfires is examined in the mid to eastern sections of the United States from 2003 to 2015 using Vaisala’s National Lightning Detection Network (NLDN), NCEP’s Stage IV gauge-corrected radar precipitation mosaic, and the US Forest Service’s Fire Occurrence Database. Though lightning flash density peaks strongly around fire ignitions on the instantaneous 1 km scale, on the hourly 10 km scale, both the lightning and precipitation peaks are typically offset from fire ignitions. Lightning density is higher, and precipitation is lower around ignition points compared to non-ignition points. The average spatial distribution of total lightning flashes around fire ignitions is symmetrical, while that of precipitation and positive flashes is not. Though regression is consistent with the claim that positive flashes have a stronger association with ignition than negative flashes, the statistical significance is ambiguous and is contradicted by an unchanging positive flash fraction in the vicinity of wildfires. Full article
Show Figures

Figure 1

Figure 1
<p>National Inter Agency Coordination regions (<b>a</b>) with rectangular approximations (<b>b</b>). The two-letter initials shown in (<b>b</b>) will be used throughout this report. The image (<b>a</b>) is adopted from the National Interagency Coordination Center Wildland Fire Summary and Statistics Annual Report, 2003. The total number of lightning ignitions (2002–2015) is listed below for each region.</p>
Full article ">Figure 2
<p>Temporal distribution of lightning flashes relative to reported day of fire ignition. (<b>a</b>) Distributions for the case of any number of storms during the 5-day period. (<b>b</b>) Distributions for the case of only one storm during the 5-day period. (<b>b</b>) is weighted by the same total flashes as (<b>a</b>).</p>
Full article ">Figure 3
<p>Flash density as a function of distance from fire ignitions, normalized by region. Colors correspond to the regions of <a href="#fire-06-00262-f001" class="html-fig">Figure 1</a>.</p>
Full article ">Figure 4
<p>Flash current characteristics. (<b>a</b>) Normalized distribution of flash currents, by region. (<b>b</b>) Fraction of total current that is positive as a function of distance from fire ignition, separated by region. (<b>c</b>) Current of negative flashes as a function of distance from fire ignition, separated by regions. (<b>d</b>) Current of positive flashes as a function of distance from ignition, separated by region.</p>
Full article ">Figure 5
<p>Lightning and precipitation in the vicinity of wildfire ignitions. The images represent the averages of values in a 5 × 5 grid, each bin 0.1 degree on a side. The fire ignition is located in the central point. All plots are normalized to their maximum. Statistics are from 72,411 fires.</p>
Full article ">Figure 6
<p>Comparing ignitions per flash for negative (<b>middle</b>) or positive (<b>right</b>) polarity. These are averages centered on each wildfire ignition. For context, the average ignition density is presented (<b>left</b>). All diagrams are normalized to their maximum.</p>
Full article ">Figure 7
<p>Plots of ignition density vs. flash density summed over each 5 × 5 0.1-degree grid centered on each ignition Left: plot of ignitions vs. ALL flashes. Right: Plot of observed ignitions vs. predicted ignitions from multivariable linear regression model based on positive and negative flash density. The R-squared values are adjusted to account for the number of predictor variables.</p>
Full article ">Figure 8
<p>Spatial patterns centered on lightning peaks not associated with ignitions (<b>left</b>) versus peaks with fires (<b>right</b>). Color normalization is relative to the highest value of each row. Images are based on 3,024,259 lightning peaks without fires and 37,325 lightning peaks with fires.</p>
Full article ">
19 pages, 1836 KiB  
Review
Meta-Narrative Review of Artificial Intelligence Applications in Fire Engineering with Special Focus on Heat Transfer through Building Elements
by Iasonas Bakas and Karolos J. Kontoleon
Fire 2023, 6(7), 261; https://doi.org/10.3390/fire6070261 - 2 Jul 2023
Viewed by 1501
Abstract
Artificial intelligence (AI), as a research and analysis method, has recently been gaining ground in the ever-evolving scientific field of fire engineering in buildings. Despite the initial delay in utilising machine learning and neural networks due to the shortfall of available computational power, [...] Read more.
Artificial intelligence (AI), as a research and analysis method, has recently been gaining ground in the ever-evolving scientific field of fire engineering in buildings. Despite the initial delay in utilising machine learning and neural networks due to the shortfall of available computational power, a review of cutting-edge scientific research demonstrates that scientists are now exploring and routinely incorporating such systems in their research processes. As such, a considerable volume of new research is being produced comprising applications of AI in fire engineering. These findings and research questions ought to be summarised, organised, and made accessible for further investigation and refinement. The present study aims to identify recent scientific publications relating to artificial intelligence applications in fire engineering, with particular focus on those tackling the issue of heat transfer through building elements. The method of the meta-narrative review, as implemented in the field of medical advancement research, is discussed, adapted, and finally utilised to weave a narrative that enables the reader to follow the most recent, influential, and impactful works. Efforts are made to uncover trends in the search for heat transfer models and properties under fire loading using AI. The review concludes with our thoughts on how future research can enrich the current findings on heat transfer in buildings exposed to fire actions and elevated temperatures. Full article
(This article belongs to the Special Issue Heat Transfer in Fire)
Show Figures

Figure 1

Figure 1
<p>Organogram of most commonly used AI algorithms grouped by training method [<a href="#B1-fire-06-00261" class="html-bibr">1</a>,<a href="#B10-fire-06-00261" class="html-bibr">10</a>].</p>
Full article ">Figure 2
<p>Flow chart of preparing and executing the present literature review article.</p>
Full article ">Figure 3
<p>Distribution of obtained and reviewed articles: (<b>a</b>) Primary research suitability assessment rates distributed in the three filtering phases described in the Methodology section; (<b>b</b>) Reviewed articles’ distribution according to the three research questions on which this review has been developed.</p>
Full article ">Figure 4
<p>Reviewed article distribution according to the research approach followed.</p>
Full article ">Figure 5
<p>Distribution of studies according to experimental data acquisition method.</p>
Full article ">
3 pages, 173 KiB  
Comment
Comment on Laming et al. The Curse of Conservation: Empirical Evidence Demonstrating That Changes in Land-Use Legislation Drove Catastrophic Bushfires in Southeast Australia. Fire 2022, 5, 175
by Michael Charles Feller
Fire 2023, 6(7), 260; https://doi.org/10.3390/fire6070260 - 30 Jun 2023
Viewed by 1822
Abstract
Laming et al. [...] Full article
31 pages, 5409 KiB  
Article
A New Perspective on Hydrogen Chloride Scavenging at High Temperatures for Reducing the Smoke Acidity of PVC Cables in Fires, IV: The Impact of Acid Scavengers at High Temperatures on Flame Retardance and Smoke Emission
by Iacopo Bassi, Francesca Delchiaro, Claudia Bandinelli, Laura Mazzocchetti, Elisabetta Salatelli and Gianluca Sarti
Fire 2023, 6(7), 259; https://doi.org/10.3390/fire6070259 - 30 Jun 2023
Cited by 3 | Viewed by 2193
Abstract
In PVC compounds, hydrogen chloride plays a fundamental role in ·H and ·OH radical trapping, lowering the flame energy during combustion. Furthermore, it yields actual Lewis acids promoting the cross-linking of the polyene sequences from PVC degradation and bringing a char layer, protecting [...] Read more.
In PVC compounds, hydrogen chloride plays a fundamental role in ·H and ·OH radical trapping, lowering the flame energy during combustion. Furthermore, it yields actual Lewis acids promoting the cross-linking of the polyene sequences from PVC degradation and bringing a char layer, protecting PVC items from flames. Therefore, PVC is inherently flame-retarded. However, plasticized PVC requires flame retardants and smoke suppressants to enhance fire performance. Low-smoke acidity PVC compounds have been developed to reduce the HCl emission during combustion and, therefore, the acidity of the smoke. They contain potent acid scavengers capable of acting at high temperatures. They react with hydrogen chloride in the condensed phase, making it unavailable in the gas and even in the condensed phase, compromising the reaction to fire and enhancing the smoke produced during the combustion. The effect of the sequestration of hydrogen chloride in PVC compounds for cables by potent acid scavengers is studied in this paper through measurements of oxygen index, heat release, and smoke production. It is noteworthy that the potent acid scavengers strongly affect parameters such as the oxygen index, the fire growth rate in cone calorimetry, the specific (total) heat capacity, and the specific heat of combustion of fuel gases in micro combustion calorimetry. In some formulations, acid scavengers reduce the oxygen index below the values of the formulations without flame retardants and double their fire growth rate. In fact, they neutralize the action of antimony trioxide and Lewis acid precursors commonly used as flame retardants and smoke suppressants in PVC items, making them prone to ignite, release smoke, and spread flame. A new generation of flame retardants and smoke suppressants is needed to keep together the low-smoke acidity and the fire performance in PVC items. Full article
(This article belongs to the Special Issue Cable and Electrical Fires)
Show Figures

Figure 1

Figure 1
<p>LOI of the formulations in <a href="#fire-06-00259-t001" class="html-table">Table 1</a>, REA1–REA9.</p>
Full article ">Figure 2
<p>LOI of the formulations in <a href="#fire-06-00259-t002" class="html-table">Table 2</a>, REAC0–REAC9.</p>
Full article ">Figure 3
<p>pHRR of the formulations in <a href="#fire-06-00259-t001" class="html-table">Table 1</a>, REA1–REA9.</p>
Full article ">Figure 4
<p>FIGRA of the formulations in <a href="#fire-06-00259-t001" class="html-table">Table 1</a>, REA1–REA9.</p>
Full article ">Figure 5
<p>THR of the formulations in <a href="#fire-06-00259-t001" class="html-table">Table 1</a>, REA1–REA9.</p>
Full article ">Figure 6
<p>THR (t) of the formulations in <a href="#fire-06-00259-t001" class="html-table">Table 1</a>, REA1–REA9.</p>
Full article ">Figure 7
<p>HRR (t) of the formulations in <a href="#fire-06-00259-t001" class="html-table">Table 1</a>, REA1–REA9.</p>
Full article ">Figure 8
<p>TSP of the formulation REA1–REA9.</p>
Full article ">Figure 9
<p>pHRR of the formulations REAC0–5.</p>
Full article ">Figure 10
<p>FIGRA of the formulations REAC0–5.</p>
Full article ">Figure 11
<p>THR of the formulations REAC0–5.</p>
Full article ">Figure 12
<p>TSP of the formulations REAC0–5.</p>
Full article ">Figure 13
<p>THR (t) of the formulations REAC0–5.</p>
Full article ">Figure 14
<p>HRR (t) of the formulations REAC0–5.</p>
Full article ">Figure 15
<p>TSP(t) of the formulations REAC0–5.</p>
Full article ">Figure 16
<p>Comparison between REA1 (no flame retardants), REA2 (3 phr of ATO, 90 phr CaCO<sub>3</sub>), and REA7 (3 phr of ATO and 90 phr of MDH).</p>
Full article ">Figure 17
<p>h<sub>c gas</sub> samples REA1–9. Blue column: total; orange: stage 1; grey: stage 2.</p>
Full article ">Figure 18
<p>Comparison of h<sub>c</sub> in REAC0–REAC5. Specifically, REAC4 contains an HCl scavenger, while REAC5 a trivial GCC.</p>
Full article ">Figure 19
<p>Comparison of h<sub>c gas</sub> in REAC0–REAC5. Specifically, REAC4 contains an HCl scavenger, while REAC5 a trivial GCC.</p>
Full article ">Figure 20
<p>Specific HRR of REAC0 (containing only Reaguard B−FR/9211), REAC4 (containing Reaguard B−FR/9211 and Winnofil S), and REAC5 (containing Reaguard B−FR/9211 and Atomfor S).</p>
Full article ">Figure 21
<p>Specific HRR of REAC0 (containing only Reaguard B−FR/9211), REAC1 (containing Reaguard B−FR/9211 and ATH), and REAC2 (containing Reaguard B−FR/9211 and MDH).</p>
Full article ">Scheme 1
<p>Left: REAC1 char residue; right: REAC2 char residue.</p>
Full article ">Figure A1
<p>A schematic diagram of the sample preparation.</p>
Full article ">Figure A2
<p>A schematic diagram of the testing process and main conditions.</p>
Full article ">
21 pages, 6553 KiB  
Technical Note
A Prediction Model for Smoke Spread Path in High Rise Building Fires Based on Graph Theory
by Haoyou Zhao, Zhaoyang Yu and Jinpeng Zhu
Fire 2023, 6(7), 258; https://doi.org/10.3390/fire6070258 - 30 Jun 2023
Cited by 3 | Viewed by 1820
Abstract
To satisfy the demand for rapid prediction of smoke transmission paths in high-rise building fires, a graph-based model was developed. The model represents a high-rise building as a Directed Acyclic Graph (DAG) grid model and employs computer simulation to determine the smoke transmission [...] Read more.
To satisfy the demand for rapid prediction of smoke transmission paths in high-rise building fires, a graph-based model was developed. The model represents a high-rise building as a Directed Acyclic Graph (DAG) grid model and employs computer simulation to determine the smoke transmission path and generate prediction results. The results were compared with those from similar simulations and were found to be consistent, indicating the feasibility and objective nature of the prediction results. Compared to other methods, this model has a shorter modeling time and can quickly provide prediction results. Furthermore, it can be applied to buildings of any structure, thus serving as a reference for smoke control design in high-rise building fire protection systems, particularly in cases involving complex internal structures. Full article
(This article belongs to the Special Issue Fire Detection and Public Safety)
Show Figures

Figure 1

Figure 1
<p>Ideal model overall structure.</p>
Full article ">Figure 2
<p>Internal structure of ideal model.</p>
Full article ">Figure 3
<p>Schematic diagram of representing high-rise buildings in network models.</p>
Full article ">Figure 4
<p>Floor numbering diagram.</p>
Full article ">Figure 5
<p>Schematic diagram of heat release process.</p>
Full article ">Figure 6
<p>Internal structure diagram of the experimental platform.</p>
Full article ">Figure 7
<p>Overall combination diagram of the experimental platform.</p>
Full article ">Figure 8
<p>Long channel represented as a single node schematic diagram.</p>
Full article ">Figure 9
<p>Long channel represented as a multi-node schematic diagram.</p>
Full article ">Figure 10
<p>Visualization of high-rise buildings in graph theory models.</p>
Full article ">Figure 11
<p>Architectural visualization of 6 rooms on each floor of a 5-story building.</p>
Full article ">Figure 12
<p>Comparison between <a href="#fire-06-00258-t004" class="html-table">Table 4</a> and <a href="#fire-06-00258-t007" class="html-table">Table 7</a>.</p>
Full article ">Figure 13
<p>Complex building overall structure.</p>
Full article ">Figure 14
<p>Complex internal structure of building.</p>
Full article ">Figure 15
<p>Comparison between <a href="#fire-06-00258-t010" class="html-table">Table 10</a> and <a href="#fire-06-00258-t011" class="html-table">Table 11</a>.</p>
Full article ">
14 pages, 3582 KiB  
Article
Characterization of Medium-Scale Accidental Releases of LNG
by Paolo Mocellin, Gianmaria Pio, Mattia Carboni, Francesco Pilo, Chiara Vianello and Ernesto Salzano
Fire 2023, 6(7), 257; https://doi.org/10.3390/fire6070257 - 30 Jun 2023
Cited by 1 | Viewed by 1752
Abstract
The need for sustainable energy sources has recently promoted the use of liquefied natural gas (LNG) as a low-carbon fuel. Although economic evaluations indicate the transportation of LNG as a convenient solution for long distances between markets and reservoirs, several concerns are still [...] Read more.
The need for sustainable energy sources has recently promoted the use of liquefied natural gas (LNG) as a low-carbon fuel. Although economic evaluations indicate the transportation of LNG as a convenient solution for long distances between markets and reservoirs, several concerns are still present regarding its safe use and transportation. The preliminary evaluations performed in this work indicate that credible releases deriving from real bunkering operations result in pools having a diameter smaller than 1 m, which has been poorly investigated so far. Hence, an experimental campaign devoted to the characterization of a medium-scale release of LNG was carried out either in the presence or absence of an ignition source. An evaporation rate of 0.005 kg s−1 m−2 was collected for the non-reactive scenario, whereas the measured burning rate was 0.100 kg s−1 m−2. The reduction factor of 20 demonstrates the inaccuracy in the commonly adopted assumption of equality between these values for the LNG pool. Flame morphology was characterized quantitatively and qualitatively, showing a maximum ratio between flame height and flame diameter equal to 2.5 and temperatures up to 1100 K in the proximity of the flame. Full article
(This article belongs to the Special Issue Advances in Pool Fire Dynamics)
Show Figures

Figure 1

Figure 1
<p>Overview of main parameters for the description of flame morphology on a picture representative of a pool fire produced in the experimental campaign conducted in this work.</p>
Full article ">Figure 2
<p>Evaporation of cryogenic liquid released in the atmosphere, as observed in Test A.</p>
Full article ">Figure 3
<p>Mass profile (<b>a</b>) and evaporation rate <math display="inline"><semantics><mrow><msubsup><mrow><mi>m</mi></mrow><mrow><mi>e</mi><mi>v</mi></mrow><mrow><mo>″</mo></mrow></msubsup></mrow></semantics></math> (<b>b</b>) with respect to time.</p>
Full article ">Figure 4
<p>Flame tilted by the wind as obtained during Test B.</p>
Full article ">Figure 5
<p>Vertical (<b>a</b>) and horizontal (<b>b</b>) temperature profiles as a function of time obtained during Test B.</p>
Full article ">Figure 6
<p>Infrared images collected during Test B. For the sake of comparison, temperature values collected by thermocouples were added. Values reported on the bottom right side of each panel refer to the points indicated by the green square located on the flame surface.</p>
Full article ">
23 pages, 11605 KiB  
Article
Performance-Based Fire-Protection Design of Public Amenities with Restrained Personnel Activities
by Xuejun Jia, Yongsheng Wang, Jingtao Chen, Ziqiang Fang, Kang Xia and He Wang
Fire 2023, 6(7), 256; https://doi.org/10.3390/fire6070256 - 29 Jun 2023
Viewed by 2049
Abstract
In this paper, performance-based fire-protection design is used for the fire-safety design of public amenities with restrained personnel activities. In these places, tourists’ activities are constrained in a limited space such as cockpit moving along the track. Since it is another typical scenario [...] Read more.
In this paper, performance-based fire-protection design is used for the fire-safety design of public amenities with restrained personnel activities. In these places, tourists’ activities are constrained in a limited space such as cockpit moving along the track. Since it is another typical scenario of fire-protection problem that cannot fully comply with the current mandatory codes and regulations, simulation analysis is used in order to ensure that such fire scenario could achieve performance objectives as expected. Firstly, corresponding fire-protection performance objectives, strategies and simplified evaluation criteria are brought forward in this paper. Then, through simulating the smoke flow in the fire using the computational fluid dynamics software FDS, the effectiveness of the smoke control strategy is verified. Meanwhile, the escaping environments of these fire scenes are analyzed. Further, the personnel evacuation simulation software (Pathfinder) is resorted to simulate the personnel emergency evacuation. The efficiency and the total time that consumed are obtained. Finally, by analyzing the similarities and differences of evacuation under different fire scenes, the fire and smoke spread in the riding area can be effectively controlled, and a safe evacuation environment can be provided for the evacuation of tourists. Full article
(This article belongs to the Special Issue Systemic Analysis Method Applied in Fire Safety)
Show Figures

Figure 1

Figure 1
<p>The fire lane setup.</p>
Full article ">Figure 2
<p>The designed fire compartments.</p>
Full article ">Figure 3
<p>Distribution of emergency exits. (<b>a</b>) First floor, (<b>b</b>) second floor.</p>
Full article ">Figure 3 Cont.
<p>Distribution of emergency exits. (<b>a</b>) First floor, (<b>b</b>) second floor.</p>
Full article ">Figure 4
<p>Evacuation route in Emergency Stop Procedure. (The number in rectangular mean the distance to the nearest exit).</p>
Full article ">Figure 5
<p>The typical pipeline-sucking-type fire detector.</p>
Full article ">Figure 6
<p>Timeline of personnel evacuation.</p>
Full article ">Figure 7
<p>Analysis model and result of detection time simulation. (<b>a</b>) Detection simulation model, (<b>b</b>) smoke concentration result of the simulation.</p>
Full article ">Figure 8
<p>Locations of fire resource.</p>
Full article ">Figure 9
<p>FDS models. (<b>a</b>) 1# fire scene, (<b>b</b>) 2# fire scene, (<b>c</b>) 3# fire scene, (<b>d</b>) 4# fire scene.</p>
Full article ">Figure 9 Cont.
<p>FDS models. (<b>a</b>) 1# fire scene, (<b>b</b>) 2# fire scene, (<b>c</b>) 3# fire scene, (<b>d</b>) 4# fire scene.</p>
Full article ">Figure 10
<p>Input fire heat release rate curve.</p>
Full article ">Figure 11
<p>The whole process of smoke spread.</p>
Full article ">Figure 12
<p>Temperature change in vertical section of fire resource center (upper limit 60 °C).</p>
Full article ">Figure 13
<p>Visibility change in vertical section of fire source center (upper limit 15 m).</p>
Full article ">Figure 14
<p>Distribution maps above the sightseeing area and 3.4 m above the ground. (<b>a</b>) The visibility, (<b>b</b>) the temperature.</p>
Full article ">Figure 15
<p>Personnel evacuation streamline.</p>
Full article ">Figure 16
<p>Distribution of evacuees. (<b>a</b>) Initial distribution, (<b>b</b>) distribution when evacuation finished.</p>
Full article ">
20 pages, 9771 KiB  
Article
Indoor Air Quality Sensor Utilization for Unwanted Fire Alarm Improvement in Studio-Type Apartments
by Han-bit Choi, Euy-hong Hwang and Don-mook Choi
Fire 2023, 6(7), 255; https://doi.org/10.3390/fire6070255 - 29 Jun 2023
Cited by 3 | Viewed by 1670
Abstract
Smoke detectors play a vital role in evacuation and safety during fire incidents, as they directly contribute to the reliability and accuracy of firefighting systems. However, if not installed properly, smoke detectors can trigger unwanted fire alarms (UWFAs), particularly in studio-type apartments. Therefore, [...] Read more.
Smoke detectors play a vital role in evacuation and safety during fire incidents, as they directly contribute to the reliability and accuracy of firefighting systems. However, if not installed properly, smoke detectors can trigger unwanted fire alarms (UWFAs), particularly in studio-type apartments. Therefore, this study aimed to develop a method for reducing UWFAs by addressing the challenges posed by cooking by-products in such environments. The proposed algorithm was validated through tests, considering relevant literature and standards, and utilizing indoor air quality sensors. Verification tests were conducted to enhance the accuracy of the algorithm. Based on the experimental results, cutoff values of 5 ppm for CO and 7000 μg/m3 for PM10.0 were proposed as criteria for identifying UWFAs caused by cooking by-products. Full article
(This article belongs to the Special Issue Fire Detection and Public Safety)
Show Figures

Figure 1

Figure 1
<p>Flowchart for study processes.</p>
Full article ">Figure 2
<p>Testbed room drawings and photograph. Test room (<b>a</b>) side view, (<b>b</b>) floor plan, and (<b>c</b>) photograph.</p>
Full article ">Figure 3
<p>Heating device and samples: (<b>a</b>) heating device; (<b>b</b>) thin-sliced pork belly; (<b>c</b>) mackerel and cooking oil.</p>
Full article ">Figure 4
<p>Measurement sensors: (<b>a</b>) optical density meter; (<b>b</b>) thermocouple; (<b>c</b>) manufacturer A (ASD); (<b>d</b>) manufacturer B (ASD); (<b>e</b>) manufacturer A (CSD) 15%; (<b>f</b>) manufacturer B (CSD) 15%; (<b>g</b>) indoor air quality sensor.</p>
Full article ">Figure 5
<p>Studio-type apartment testbed (<b>a</b>) side view; (<b>b</b>) floor plan, and (<b>c</b>) photographs.</p>
Full article ">Figure 6
<p>OPM with time measured by ODM for the (<b>a</b>) thin-sliced pork belly and (<b>b</b>) mackerel test.</p>
Full article ">Figure 7
<p>Pan temperature change by test.</p>
Full article ">Figure 8
<p>Comparison between ODM and ASD according to CSD and ASD activation time for the (<b>a</b>) thin-sliced pork belly and (<b>b</b>) mackerel tests.</p>
Full article ">Figure 9
<p>CO measurement results for the (<b>a</b>) thin-sliced pork belly and (<b>b</b>) mackerel tests.</p>
Full article ">Figure 10
<p>PM10.0 measurement results for the (<b>a</b>) thin-sliced pork belly and (<b>b</b>) mackerel tests.</p>
Full article ">Figure 11
<p>Comparison of the OPM and CO measurements: (<b>a</b>) ODM and CO; (<b>b</b>) ASD and CO; (<b>c</b>) OPM and CO combined results.</p>
Full article ">Figure 12
<p>Comparison of the OPM and PM10.0 measurements: (<b>a</b>) ODM and PM10.0; (<b>b</b>) ASD and PM10.0; (<b>c</b>) OPM and PM10.0 combined results.</p>
Full article ">Figure 13
<p>Proposed algorithm representing the relationship among OPM, CO, and PM10.0.</p>
Full article ">Figure 14
<p>THCP verification test results.</p>
Full article ">Figure 15
<p>CO verification test results: (<b>a</b>) comparison with the performance test results; (<b>b</b>) verification test results.</p>
Full article ">Figure 16
<p>PM10.0 verification test results: (<b>a</b>) comparison with the performance test results; (<b>b</b>) verification test results.</p>
Full article ">
18 pages, 7489 KiB  
Article
Mapping the Most Susceptible Regions to Fire in Portugal
by Tiago Ermitão, Patrícia Páscoa, Isabel Trigo, Catarina Alonso and Célia Gouveia
Fire 2023, 6(7), 254; https://doi.org/10.3390/fire6070254 - 29 Jun 2023
Cited by 5 | Viewed by 6128
Abstract
Mediterranean European countries, including Portugal, are considered fire-prone regions, being affected by fire events every summer. Nonetheless, Portugal has been recording large burned areas over the last 20 years, which are not only strongly associated with hot and dry conditions, but also with [...] Read more.
Mediterranean European countries, including Portugal, are considered fire-prone regions, being affected by fire events every summer. Nonetheless, Portugal has been recording large burned areas over the last 20 years, which are not only strongly associated with hot and dry conditions, but also with high fuel availability in the ecosystems. Due to recent catastrophic fire seasons, Portugal has been implementing preventive policies during the pre-fire season, which, in turn, can optimize combat strategies during the fire season. In this context, our study contributes to fire prevention by identifying the regions with the highest potential to burn. The application of a Principal Component Analysis (PCA) to a range of climatological, ecological, and biophysical variables, either provided by remote sensing or reanalysis products, and known to be linked with diverse fire-vulnerability factors, allows the objective identification of the regions with the highest susceptibility to burn. The central and southernmost areas of Portugal present a stronger signal in the PCA, suggesting a likely high exposure to future fire events. The fuel accumulation over several months, in conjunction with elevation and fire weather conditions, are the terms out of the retained PCs that can explain most of the variability. The quality assessment performed for the burned areas in 2022 showed that they occurred in highly susceptible areas, highlighting the usefulness of the proposed methodology. Full article
Show Figures

Figure 1

Figure 1
<p>(<b>a</b>) Elevation of Portugal, in metres high; (<b>b</b>) fire frequency at pixel-level between 2001 and 2021; (<b>c</b>) time without burn (TwB) in the period 2001–2021.</p>
Full article ">Figure 2
<p>(<b>a</b>) Sum of monthly <math display="inline"><semantics><mrow><msub><mrow><mi>GPP</mi></mrow><mrow><mi>ANOM</mi></mrow></msub></mrow></semantics></math> over the period 2001–2021; (<b>b</b>) linear trend of GPP between 2001 and 2021; (<b>c</b>) same as (<b>b</b>) but for NPP; (<b>d</b>) probability of occurrence of FWI classes ‘Very High’ and ‘Extreme’ between 1979 and 2021; (<b>e</b>) median Fire Released Energy, expressed in gigajoules, between 2004 and 2020; (<b>f</b>) Fire Risk Map between 2017 and 2021. These nine variables are the ones which are used to be used in the PCA.</p>
Full article ">Figure 3
<p>Spatial patterns of the probability of occurrence of Moderate (first line of panels), High (second line of panels), Very High (third line of panels), and Extreme (fourth line of panels) danger classes of FWI in Portugal during the last four decades.</p>
Full article ">Figure 4
<p>Spatial patterns of the first six PCs that explain about 84% of the total variance.</p>
Full article ">Figure 5
<p>Loading factors of the chosen six PCs that reveal the contribution of each variable to each PC. The explained variance of each PC is described on the legend.</p>
Full article ">Figure 6
<p>Distribution of land cover in Portugal, according to the categories previously defined (see <a href="#app1-fire-06-00254" class="html-app">Table S1</a> for classes classification) (left panel); distribution of the signal of the <math display="inline"><semantics><mrow><msub><mrow><mi>PC</mi></mrow><mrow><mi>REC</mi></mrow></msub></mrow></semantics></math>.</p>
Full article ">Figure 7
<p>Distribution of the land cover for each class of susceptibility.</p>
Full article ">Figure 8
<p>Spatial distribution of the <math display="inline"><semantics><mrow><msub><mrow><mi>PC</mi></mrow><mrow><mi>REC</mi></mrow></msub></mrow></semantics></math> (<b>top panels</b>) and land cover distribution (<b>middle panels</b>) over the top 5 largest burned areas of the fire season of 2022 (A1–A5); boxplots of the distribution of the <math display="inline"><semantics><mrow><msub><mrow><mi>PC</mi></mrow><mrow><mi>REC</mi></mrow></msub></mrow></semantics></math> signal over these areas and also over the rest of burned areas of 2022 (<b>bottom panels</b>). The whiskers of the boxplots represent the 1st and 99th percentiles. The circles represent the outliers.</p>
Full article ">
4 pages, 629 KiB  
Comment
Comment on Laming et al. The Curse of Conservation: Empirical Evidence Demonstrating That Changes in Land-Use Legislation Drove Catastrophic Bushfires in Southeast Australia. Fire 2022, 5, 175
by Ian Penna
Fire 2023, 6(7), 253; https://doi.org/10.3390/fire6070253 - 29 Jun 2023
Viewed by 1671
Abstract
In 1970, the Victorian state government in Australia established the Land Conservation Council (LCC) to study the state’s publicly-owned land and make recommendations for its use [...] Full article
Show Figures

Figure 1

Figure 1
<p>Balley Hooley Campground fire history 1960 to 1990 (DELWP 2022).</p>
Full article ">
14 pages, 3560 KiB  
Article
Silica Fume Enhances the Mechanical Strength of Alkali-Activated Slag/Fly Ash Pastes Subjected to Elevated Temperatures
by Weidong Dai and Yachao Wang
Fire 2023, 6(7), 252; https://doi.org/10.3390/fire6070252 - 27 Jun 2023
Cited by 3 | Viewed by 1446
Abstract
The fireproof design of geopolymers through adjusting multi-component metallurgical solid wastes has attracted increasing attention, due to their potential low carbon emission, cost effectiveness, and role in environmental conservation. Herein, the effects of silica fume (SF) on the microstructure and mechanical properties of [...] Read more.
The fireproof design of geopolymers through adjusting multi-component metallurgical solid wastes has attracted increasing attention, due to their potential low carbon emission, cost effectiveness, and role in environmental conservation. Herein, the effects of silica fume (SF) on the microstructure and mechanical properties of alkali-activated slag/FA (fly ash) pastes subjected to elevated temperatures (150, 500, 850, and 1200 °C) are investigated to clarify whether or not SF has a positive role in the mechanical strength of the slag/FA (slag/FA = 30:70, wt.%) geopolymer during building fires. The results show that the replacement of FA with 10 wt.% SF (silica fume) promotes the increasing pore volume with a diameter of 0.2~3 μm, leading to an increase in the compressive or flexural strength below 850 °C, “right shifts” of the endothermic peak, and uniform and compact fracture surfaces. Meanwhile, gehlenite and labradorite are generated after exposure above 850 °C. The bloating effect of the SF-containing sample occurs at 1200 °C, leading to a greater deformation due to the further restructuring of the amorphous geopolymer chain N–A–S–H or N–(Ca)–A–S–H composed of [SiO4]4− and [AlO4]5−. This paper explores an effective approach to improving geopolymers’ fireproof performance by adjusting the formulation of solid waste. Full article
(This article belongs to the Special Issue Fire Prevention and Flame Retardant Materials)
Show Figures

Figure 1

Figure 1
<p>XRD of sample including (<b>a</b>) slag/FA binders and (<b>b</b>) SF/slag/FA binders.</p>
Full article ">Figure 1 Cont.
<p>XRD of sample including (<b>a</b>) slag/FA binders and (<b>b</b>) SF/slag/FA binders.</p>
Full article ">Figure 2
<p>Mechanical strength of specimens subjected to high temperatures including (<b>a</b>) compressive strength and (<b>b</b>) flexural strength.</p>
Full article ">Figure 3
<p>Deformation of specimens after exposure to elevated temperatures, including (<b>a</b>) mass loss and (<b>b</b>) volume shrinkage.</p>
Full article ">Figure 4
<p>The surface appearance of specimens after heat treatment.</p>
Full article ">Figure 5
<p>SEM photos of binary slag/FA binders after heat treatment: (<b>a</b>) RT, (<b>b</b>) 150 °C, (<b>c</b>) 500 °C, (<b>d</b>) 850 °C, (<b>e</b>) 1200 °C.</p>
Full article ">Figure 6
<p>SEM photos of ternary SF/slag/FA binders after heat treatment: (<b>a</b>) RT, (<b>b</b>) 150 °C, (<b>c</b>) 500 °C, (<b>d</b>) 850 °C, (<b>e</b>) 1200 °C.</p>
Full article ">Figure 7
<p>TG/DTG and DSC of samples including (<b>a</b>) slag/FA paste, (<b>b</b>) SF/slag/FA paste, and (<b>c</b>) DSC.</p>
Full article ">Figure 7 Cont.
<p>TG/DTG and DSC of samples including (<b>a</b>) slag/FA paste, (<b>b</b>) SF/slag/FA paste, and (<b>c</b>) DSC.</p>
Full article ">Figure 8
<p>FTIR spectra of samples including (<b>a</b>) SF/slag/FA binder after 1200 °C exposure, (<b>b</b>) slag/FA binder after 1200 °C exposure, (<b>c</b>) slag/FA binder after 150 °C exposure, and (<b>d</b>) SF/slag/FA binder after 150 °C exposure.</p>
Full article ">
Previous Issue
Next Issue
Back to TopTop