[go: up one dir, main page]

Next Issue
Volume 8, December
Previous Issue
Volume 8, June


C, Volume 8, Issue 3 (September 2022) – 15 articles

Cover Story (view full-size image): 
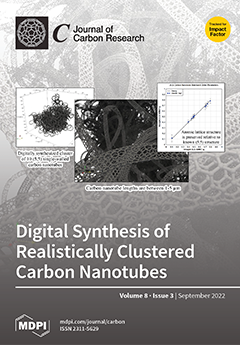
The empirical observation of dynamically evolving carbon nanotube (CNT) clusters is exceptionally difficult. A methodology is presented to characterize a large cluster of individual single-walled CNTs with atomic resolution, using hierarchical molecular dynamic simulations to create initial cluster topologies that further enables high-fidelity simulation-based research. The methodology does not rely upon physical nucleation to build individual CNTs, and thus mitigates considerable computational intensity while still preserving the spatial fidelity of the carbon nanotube shapes and behaviors. Qualitative agreement is shown compared to electron microscopy images, including the presence of physical defects in the nanotubes, such as buckling, crimping, and fusing. View this paper
  • Issues are regarded as officially published after their release is announced to the table of contents alert mailing list.
  • You may sign up for e-mail alerts to receive table of contents of newly released issues.
  • PDF is the official format for papers published in both, html and pdf forms. To view the papers in pdf format, click on the "PDF Full-text" link, and use the free Adobe Reader to open them.
Order results
Result details
Section
Select all
Export citation of selected articles as:
14 pages, 3975 KiB  
Article
Structural Evolution of Polyimide-Derived Carbon during Phosphoric Acid Activation
by Alexander M. Puziy, Olga I. Poddubnaya, Barbara Gawdzik, Magdalena Sobiesiak and Myroslav Sprynskyy
C 2022, 8(3), 47; https://doi.org/10.3390/c8030047 - 19 Sep 2022
Cited by 10 | Viewed by 2574
Abstract
Carbon adsorbents were obtained by carbonization of polyimide polymer with and without the presence of phosphoric acid at temperatures in the range of 400–1000 °C. Carbons produced in the presence of phosphoric acid have been demonstrated to contain up to 13.2% phosphorus. The [...] Read more.
Carbon adsorbents were obtained by carbonization of polyimide polymer with and without the presence of phosphoric acid at temperatures in the range of 400–1000 °C. Carbons produced in the presence of phosphoric acid have been demonstrated to contain up to 13.2% phosphorus. The structure of phosphorus-containing compounds was investigated by XPS and 31P MAS NMR methods. Deconvolution of the P 2p peak with variable binding energy showed the presence of only phosphates/polyphosphates. However, a low value of the O/P ratio is an indirect indication of the possible presence of phosphonates. A 31P MAS NMR study revealed the existence of several kinds of phosphates as well as a minor quantity (1–9%) of phosphonates. All discovered phosphorus-containing compounds are acidic and therefore give carbon the ability to absorb metal cations. The study of copper ion adsorption demonstrated that phosphorus-containing carbon shows a significant adsorption capability even in extremely acidic conditions. At pH 3–6, phosphorus-containing carbon may completely remove copper from the aqueous solution. Phosphorus-containing carbon has a higher adsorption capacity for copper ions than ion exchange resins with carboxyl or sulfo groups. Full article
(This article belongs to the Special Issue Carbons for Health and Environmental Protection)
Show Figures

Graphical abstract

Graphical abstract
Full article ">Figure 1
<p>The chemical formula of 4,4′-bis(maleimidodiphenyl) methane.</p>
Full article ">Figure 2
<p>Nitrogen adsorption-desorption isotherms: (<b>a</b>) and pore size distributions; and (<b>b</b>) for parent BM-DVB copolymer and carbons obtained by carbonization at 600 °C of polyimide copolymer in the presence of phosphoric acid (H<sub>3</sub>PO<sub>4</sub>) and without acid (Thermal).</p>
Full article ">Figure 3
<p>High-resolution X-ray photoelectron spectrum of C 1s peak of polyimide-derived carbon obtained with phosphoric acid at 800 °C.</p>
Full article ">Figure 4
<p>Temperature evolution of sp<sup>2</sup>-hybridized carbon content: (<b>a</b>) and π→π* shake-up signal (<b>b</b>) of polyimide-derived carbons obtained with (H<sub>3</sub>PO<sub>4</sub>-series) and without (Thermal-series) phosphoric acid at different temperatures.</p>
Full article ">Figure 5
<p>High-resolution X-ray photoelectron spectrum of P 2p peak of polyimide-derived carbon obtained with phosphoric acid at 800 °C (<b>a</b>) and temperature evolution of phosphorus content and atomic O/P ratio (<b>b</b>).</p>
Full article ">Figure 6
<p>P 2p 3/2 binding energies of different types of phosphorus-containing compounds. Data from NIST X-ray Photoelectron Spectroscopy Database [<a href="#B49-carbon-08-00047" class="html-bibr">49</a>].</p>
Full article ">Figure 7
<p><sup>31</sup>P MAS NMR spectra of polyimide-derived carbons obtained with phosphoric acid (H<sub>3</sub>PO<sub>4</sub>-series) at different temperatures (<b>a</b>) and deconvolution of <sup>31</sup>P MAS NMR spectrum of polyimide-derived carbon obtained with phosphoric acid at 600 °C (<b>b</b>).</p>
Full article ">Figure 8
<p>Chemical shift (<b>a</b>) and relative area (<b>b</b>) of deconvoluted components of <sup>31</sup>P MAS NMR spectra of polyimide-derived carbons obtained with phosphoric acid (H<sub>3</sub>PO<sub>4</sub>-series) at different temperatures.</p>
Full article ">Figure 9
<p>Proton-binding isotherms (<b>a</b>) and proton affinity distributions (<b>b</b>) for polyimide-derived carbons obtained with (H<sub>3</sub>PO<sub>4</sub> series) and without (Thermal series) phosphoric acid at 800 °C.</p>
Full article ">Figure 10
<p>Copper binding by polyimide-derived carbons obtained with (H<sub>3</sub>PO<sub>4</sub>-series) and without (Thermal-series) phosphoric acid at 800 °C. Copper binding by ion-exchange resins with carboxyl (KB-4) and sulfo groups (KU-23) is provided for comparison.</p>
Full article ">
15 pages, 4699 KiB  
Article
Brewer’s Spent Grain Biochar: Grinding Method Matters
by Arvind K. Bhakta, Youssef Snoussi, Mohamed El Garah, Souad Ammar and Mohamed M. Chehimi
C 2022, 8(3), 46; https://doi.org/10.3390/c8030046 - 15 Sep 2022
Cited by 8 | Viewed by 2941
Abstract
The present work is based on the principle of biomass waste valorization. Brewer’s spent grains (BSG) come from breweries as by-products. Their huge amount of production on an industrial scale should focus our attention on their valorization, which creates challenges as well as [...] Read more.
The present work is based on the principle of biomass waste valorization. Brewer’s spent grains (BSG) come from breweries as by-products. Their huge amount of production on an industrial scale should focus our attention on their valorization, which creates challenges as well as opportunities. One way to valorize BSG by-products is to convert them into biochar, a functional material with multiple potential applications. With an emphasis on sustainable development and the circular economy, in this work, we focused on a comparative study of the different mechanical processes of BSG grinding and their effect on the resulting biochar formed after pyrolysis. Home appliances such as blenders, coffee mills, and mortar and pestles were used for this purpose. FESEM images confirmed the successful creation of five different morphologies from the same BSG under the same pyrolysis conditions. Interestingly, a novel Chinese tea leaf egg-like biochar was also formed. It was found that a series of physical pretreatments of the biomass resulted in the reduced roughness of the biochar surface, i.e., they became smoother, thus negatively affecting the quality of the biochar. XRD revealed that the biomass physical treatments were also reflected in the crystallinity of some biochar. Via a Raman study, we witnessed the effect of mechanical pressure on the biomass for affecting the biochar features through pressure-induced modifications of the biomass’s internal structure. This induced enhanced biochar graphitization. This is a good example of the role of mechanochemistry. DSC revealed the thermochemical transformation of the five samples to be exothermic reactions. This study opens up an interesting possibility for the synthesis of biochar with controlled morphology, crystallinity, degree of graphitization, and heat capacity. Full article
(This article belongs to the Special Issue Advanced Carbon Based Nanomaterials)
Show Figures

Graphical abstract

Graphical abstract
Full article ">Figure 1
<p>Pictorial representation of the brewing industry, generation of BSGs and their valorization.</p>
Full article ">Figure 2
<p>Schematic representation of the procedure to create different samples from the same biomass.</p>
Full article ">Figure 3
<p>The photo of different textures of the biochar products formed.</p>
Full article ">Figure 4
<p>XPS survey spectra of (<b>a</b>) B-SPCM, (<b>b</b>) B-CM, (<b>c</b>) B-MP, (<b>d</b>) B-W, and (<b>e</b>) B-SP.</p>
Full article ">Figure 5
<p>XRD Patterns of B-SPCM, B-CM, B-MP, B-W, and B-SP.</p>
Full article ">Figure 6
<p>FESEM images of (<b>a</b>,<b>b</b>) B-SP and (<b>c</b>,<b>d</b>) B-SPCM.</p>
Full article ">Figure 7
<p>FESEM images of (<b>a</b>,<b>b</b>) B-CM, (<b>c</b>–<b>e</b>) B-MP, and (<b>f</b>–<b>h</b>) B-W.</p>
Full article ">Figure 8
<p>(<b>a</b>) FESEM image of B-MP, (<b>b</b>) EDX mapping of B-MP, (<b>c</b>) EDX spectrum of B-MP (inset: area showing the spectra on which spectrum 4 was performed). (NB: Three different areas were probed and the average composition (in at.%) was as follows: C = 35.0 ± 2.3, O = 39.6 ± 1.9, Na = 1.5 ± 0.8, Mg = 5.2 ± 0.3, Si = 2.7 ± 1.3, P = 11.0 ± 0.6, K= 0.6 ± 0.1, and Ca = 4.5 ± 0.5).</p>
Full article ">Figure 9
<p><b>(a–e)</b> Raman peak fitting and (<b>f</b>) D/G band intensity and band area ratio.</p>
Full article ">Figure 10
<p>(<b>a</b>) TGA, (<b>b</b>) DSC, and (<b>c</b>) DTG curve of different biochar samples.</p>
Full article ">
17 pages, 26314 KiB  
Article
Investigation of Electron Transfer Mechanistic Pathways of Ferrocene Derivatives in Droplet at Carbon Electrode
by Sidra Ayaz, Afzal Shah and Shamsa Munir
C 2022, 8(3), 45; https://doi.org/10.3390/c8030045 - 9 Sep 2022
Cited by 3 | Viewed by 2769
Abstract
The results of cyclic, differential pulse and square wave voltammetric studies of four ferrocene derivatives, i.e., 4-ferrocenyl-3-methyl aniline (FMA), 3-Chloro-4-ferrocenyl aniline (CFA), 4-ferrocenyl aniline (FA) and ferrocenyl benzoic acid (FBA) on carbon electrode, revealed that the redox behavior of these compounds is [...] Read more.
The results of cyclic, differential pulse and square wave voltammetric studies of four ferrocene derivatives, i.e., 4-ferrocenyl-3-methyl aniline (FMA), 3-Chloro-4-ferrocenyl aniline (CFA), 4-ferrocenyl aniline (FA) and ferrocenyl benzoic acid (FBA) on carbon electrode, revealed that the redox behavior of these compounds is sensitive to pH, concentration, scan number and scan rate. One electron, diffusion controlled, with a quasi-reversible redox signal displaying ferrocene/ferrocenium couple was observed for each of the studied ferrocenyl derivatives. Quasi-reversibility of this signal is evidenced by ∆Ep, Ia/Ic current ratio and ksh values. Another one electron and one proton irreversible oxidation signal was noticed in the voltammograms of these compounds except FBA. This signal corresponds to the electro-oxidation of the amine group and its irreversibility, as supported by ∆Ep, Ia/Ic current ratio and ksh values, is due to the influence of the electron donating nature of the amine group. A number of electrochemical parameters such as D, ksh, LOD and LOQ were evaluated for the targeted ferrocene derivatives. The obtained parameters are expected to provide insights into the redox mechanism for understanding their biochemical actions. The electrochemistry presented in this work is done using a unique environmentally benign and cost-effective droplet electrochemical approach. Full article
Show Figures

Graphical abstract

Graphical abstract
Full article ">Figure 1
<p>CVs of 2 mM ferrocene derivatives in pH 7 at 0.1 V/s.</p>
Full article ">Figure 2
<p>CVs of 2 mM FBA at different scan rates.</p>
Full article ">Figure 3
<p>Plot of log <span class="html-italic">I</span><sub>pa</sub> vs. log ν for (<b>A</b>) FBA (<b>B</b>) FA (<b>C</b>) CFA (<b>D</b>) FMA.</p>
Full article ">Figure 4
<p>CVs of FMA showing scan rates effect.</p>
Full article ">Figure 5
<p>(<b>A</b>) DPV of FBA obtained at 0.1 V/s in different pH media and (<b>B</b>) plot of <span class="html-italic">E</span><sub>pa</sub> vs. pH of FBA.</p>
Full article ">Figure 6
<p>(<b>A</b>) DPVs obtained at 0.1 V/s in different pH media and (<b>B</b>) plot of <span class="html-italic">E</span><sub>pa</sub> vs. pH of FMA.</p>
Full article ">Figure 7
<p>SWV indicating net, forward and reverse current for (<b>A</b>) FBA and (<b>B</b>) FA.</p>
Full article ">Figure 7 Cont.
<p>SWV indicating net, forward and reverse current for (<b>A</b>) FBA and (<b>B</b>) FA.</p>
Full article ">Figure 8
<p>SWV Consecutive scans of (<b>A</b>) FBA and (<b>B</b>) FMA without cleaning electrode.</p>
Full article ">Figure 8 Cont.
<p>SWV Consecutive scans of (<b>A</b>) FBA and (<b>B</b>) FMA without cleaning electrode.</p>
Full article ">Figure 9
<p>Concentration effect recorded in pH-7 at scan rate 0.1 V/s and inset plot of concentration (mM) vs. peak current (µA) for (<b>A</b>) FBA and (<b>B</b>) FA.</p>
Full article ">Figure 9 Cont.
<p>Concentration effect recorded in pH-7 at scan rate 0.1 V/s and inset plot of concentration (mM) vs. peak current (µA) for (<b>A</b>) FBA and (<b>B</b>) FA.</p>
Full article ">Scheme 1
<p>Structures and names of studied ferrocenyl derivatives.</p>
Full article ">Scheme 2
<p>Proposed redox mechanism of FBA at pH 3 to 10 for oxidation/reduction peak.</p>
Full article ">Scheme 3
<p>Proposed redox mechanism of 4-Ferrocenyl,3-methyl aniline (FMA).</p>
Full article ">
14 pages, 4311 KiB  
Article
Power Generation Characteristics of Polymer Electrolyte Fuel Cells Using Carbon Nanowalls as Catalyst Support Material
by Takayuki Ohta, Hiroaki Iwata, Mineo Hiramatsu, Hiroki Kondo and Masaru Hori
C 2022, 8(3), 44; https://doi.org/10.3390/c8030044 - 27 Aug 2022
Cited by 4 | Viewed by 2911
Abstract
We evaluated the power generation characteristics of a polymer electrolyte fuel cell (PEFC) composed of Pt-supported carbon nanowalls (CNWs) and a microporous layer (MPL) of carbon black on carbon paper (CP) as catalyst support materials. CNWs, standing vertically on highly crystallizing graphene sheets, [...] Read more.
We evaluated the power generation characteristics of a polymer electrolyte fuel cell (PEFC) composed of Pt-supported carbon nanowalls (CNWs) and a microporous layer (MPL) of carbon black on carbon paper (CP) as catalyst support materials. CNWs, standing vertically on highly crystallizing graphene sheets, were synthesized on an MPL/CP by plasma-enhanced chemical vapor deposition (PECVD) using inductively coupled plasma (ICP). Pt nanoparticles were supported on the CNW surface using the liquid-phase reduction method. The three types of voltage loss, namely those due to activated polarization, resistance polarization, and diffusion polarization, are discussed for the power generation characteristics of the PEFC using the Pt/CNWs/MPL/CP. The relationship between the height or gap area of the CNWs and the voltage loss of the PEFC is demonstrated, whereby the CNW height increased with the extension of growth time. The three-phase interface area increased with the increase in the CNW height, resulting in mitigation of the loss due to activated polarization. The gap area of the CNWs varied when changing the CH4/H2 gas ratio. The loss due to diffusion polarization was reduced by enlarging the gap area, due to the increased diffusion of fuel gas and discharge of water. The secondary growth of the CNWs caused the three-phase interface area to decrease as a result of platinum aggregation, impedance of the supply of ionomer dispersion solution to the bottom of the CNWs, and inhibition of fuel gas and water diffusion, which led to the loss of activated and diffuse polarizations. The voltage losses can be mitigated by increasing the height of CNWs while avoiding secondary growth. Full article
Show Figures

Graphical abstract

Graphical abstract
Full article ">Figure 1
<p>Schematic diagram of the ICP reactor.</p>
Full article ">Figure 2
<p>Schematic diagram of the single PEFC using CNWs.</p>
Full article ">Figure 3
<p>Height of CNW as a function of growth time.</p>
Full article ">Figure 4
<p>Cross-sectional view of the SEM images of the CNWs at a growth time of (<b>a</b>) 2 h, (<b>b</b>) 3 h, (<b>c</b>) 3.5 h, and (<b>d</b>) 4 h.</p>
Full article ">Figure 5
<p>Voltage–current density (V–J) curve of single PEFC cells of Pt/CNW/MPL/CP for various growth times of the CNWs.</p>
Full article ">Figure 6
<p>Activated polarization for various growth times.</p>
Full article ">Figure 7
<p>Resistance polarization for various growth times.</p>
Full article ">Figure 8
<p>Diffusion polarization for various growth times.</p>
Full article ">Figure 9
<p>(<b>a</b>,<b>c</b>) Plane view and (<b>b</b>,<b>d</b>) cross-sectional view of the SEM images of CNWs grown on MPL with (<b>a</b>,<b>b</b>) a small gap area (0.37 µm<sup>2</sup>) and (<b>c</b>,<b>d</b>) a large gap area (0.79 µm<sup>2</sup>).</p>
Full article ">Figure 10
<p>Voltage–current density (V–J) curve of single PEFC cells of Pt/CNWs/MPL/CP for different gap areas.</p>
Full article ">Figure 11
<p>Activated polarization for different gap areas.</p>
Full article ">Figure 12
<p>Diffusion polarization for different gap areas.</p>
Full article ">
11 pages, 1834 KiB  
Article
Laser-Induced Refractive Index Indicates the Concurrent Role of the Bio-Structuration Process in the Comparison with the Nano-Structuration One
by Natalia Kamanina, Svetlana Likhomanova and Yulia Zubtsova
C 2022, 8(3), 43; https://doi.org/10.3390/c8030043 - 26 Aug 2022
Cited by 2 | Viewed by 2005
Abstract
It should be remarked that the basic knowledge collected from complicated area of the structuration process of the organic materials, including the liquid crystal (LC) ones, useful for the optoelectronics and biomedicine, requires extending the types of the novel matrix model materials and [...] Read more.
It should be remarked that the basic knowledge collected from complicated area of the structuration process of the organic materials, including the liquid crystal (LC) ones, useful for the optoelectronics and biomedicine, requires extending the types of the novel matrix model materials and the class of the dopants, which can change the spectral and photorefractive features of the matrixes with good advantage. In the current paper the effect of the introduction of the bio-objects (based on DNA) and of the nano-objects (based on fullerenes, quantum dots, carbon nanotubes, shungites, graphenes) in the organic conjugated materials has been comparatively discussed. The influence of this process on the photorefractive features, namely on the laser-induced change of the refractive index, has been studied. The clear innovative tendency of the alternative using of the bio-objects together or instead of the nano-objects ones has been analyzed via considering of the modification of the spectral and non-linear optical characteristics. Full article
(This article belongs to the Special Issue Carbon Nanohybrids for Biomedical Applications)
Show Figures

Figure 1

Figure 1
<p>(<b>a</b>)—Possible qualitative model, which can visualize the charge transfer pathway change for the conjugated nano- and bio-objects-doped organics under the condition when inter-molecular CTC can dominate the intra-molecular one; (<b>b</b>)—Schematic diagram of possible charge transfer pathways depending on the arrangement of the introduced intermolecular acceptor relative to the intramolecular donor.</p>
Full article ">Figure 2
<p>The linear refractive index versus the wavelength for the nano-objects doped materials (dark curve), for the LC doped with the bio-objects doped based on the DNA (red curve).</p>
Full article ">Figure 3
<p>The place of the nano- and bio-objects doped materials among other classical systems with essential refractive features.</p>
Full article ">
17 pages, 4061 KiB  
Article
Structural Descriptors of Benzenoid Hydrocarbons: A Mismatch between the Estimates and Parity Effects in Helicenes
by Denis Sh. Sabirov, Ottorino Ori, Alina A. Tukhbatullina and Igor S. Shepelevich
C 2022, 8(3), 42; https://doi.org/10.3390/c8030042 - 25 Aug 2022
Cited by 5 | Viewed by 2302
Abstract
Benzenoid hydrocarbons have regular structures, attracting the opportunity to test the structural descriptors of their series. In the present study, we compared information entropy, Wiener indices, topological efficiencies, topological roundness, and symmetries of oligoacenes, phenacenes, and helicenes. We found and discussed the mismatches [...] Read more.
Benzenoid hydrocarbons have regular structures, attracting the opportunity to test the structural descriptors of their series. In the present study, we compared information entropy, Wiener indices, topological efficiencies, topological roundness, and symmetries of oligoacenes, phenacenes, and helicenes. We found and discussed the mismatches between the descriptors and the symmetry of benzenoids. Among the studied series, helicenes demonstrate the parity effect when the information entropy and topological roundness form saw-like functions depending on the number of the member, odd or even. According to our quantum chemical calculations, this parity effect has no consequences for such molecular properties as molecular polarizability and frontier molecular orbital energies. Further, we demonstrated that the changes in the structural descriptors upon the chemical reactions of benzenoids could be used for the numerical description of chemical processes. Interestingly, the view of the information entropy reaction profile is similar to the energy profiles of chemical reactions. Herewith, the intermediate chemical compounds have higher information entropy values compared with the initial and final compounds, which reminisce the activation barrier. Full article
(This article belongs to the Section Carbon Skeleton)
Show Figures

Graphical abstract

Graphical abstract
Full article ">Figure 1
<p>Benzenoid PAHs under study: addition patterns (<b>left</b>) and chemical models of the isomers with four benzene rings (<b>right</b>). Note that oligoacene and phenacene molecules are planar, whereas helicenes are not.</p>
Full article ">Figure 2
<p>Oligoacenes (<b>top</b>) and phenacenes (<b>bottom</b>) described as linear 1D graphs: carbon atoms correspond to the graph nodes. Nodes forming the unit cells are shown as circles. The selected unit cells are capable to build the lattices by translations only.</p>
Full article ">Figure 3
<p>Partition of the exemplifying benzenoid molecules over atom types (designated with italic Latin letters): tetracene (<b>a</b>), pentacene (<b>b</b>), chrysene (<b>c</b>), benzochrysene (<b>d</b>), [4]helicene (<b>e</b>), and [5]helicene (<b>f</b>). Herewith, compounds (<b>a</b>,<b>c</b>,<b>e</b>) are even members of the corresponding series; (<b>b</b>,<b>d</b>,<b>f</b>) are odd members.</p>
Full article ">Figure 4
<p>Dependence of information entropy (<span class="html-italic">h</span>) on the molecular size. Black, blue, and red colors correspond to oligoacenes, phenacenes, and helicenes, respectively.</p>
Full article ">Figure 5
<p>The [4]helicene (<b>a</b>) and [5]helicene (<b>b</b>) molecules with the <span class="html-italic">C</span><sub>2</sub> symmetry axes.</p>
Full article ">Figure 6
<p>Wiener index cubic polynomials for oligoacenes (a), phenacenes (b), and helicenes (c) as functions of the size (<span class="html-italic">N</span>).</p>
Full article ">Figure 7
<p>Topological roundness (<b>a</b>) and topological efficiency (<b>b</b>) in the helicene series.</p>
Full article ">Figure 8
<p>Initial, intermediate, and final benzenoids of the hexaphenylbenzene conversion to hexa-<span class="html-italic">peri</span>-coronene.</p>
Full article ">Figure 9
<p>The information entropy changes upon the stepwise conversion of hexaphenylbenzene to hexa-<span class="html-italic">peri</span>-coronene.</p>
Full article ">Figure 10
<p>Linear correlation between the Wiener index and the topological efficiency for the benzenoids formed upon the stepwise conversion of hexaphenylbenzene to hexa-<span class="html-italic">peri</span>-coronene.</p>
Full article ">Figure 11
<p>Size dependences for the frontier molecular orbital energies (<b>a</b>,<b>b</b>) and mean polarizability (<b>c</b>). The EHOMO and ELUMO values have been computed with the PBE/3ζ and ωB97X-D3/6-311G(d,p) methods (red and blue circles, respectively). The mean polarizabilities are obtained with PBE/3ζ. Numerical data associated with the plot can be found in the <a href="#app1-carbon-08-00042" class="html-app">Supplementary information</a>.</p>
Full article ">
18 pages, 2459 KiB  
Article
Effect of Porosity and Surface Chemistry on CO2 and CH4 Adsorption in S-Doped and S-/O-co-Doped Porous Carbons
by Snezana Reljic, Manuel Martinez-Escandell and Joaquin Silvestre-Albero
C 2022, 8(3), 41; https://doi.org/10.3390/c8030041 - 15 Aug 2022
Cited by 14 | Viewed by 3514
Abstract
The aim of this study was to determine the adsorption performance of a petroleum pitch-based activated carbon (PPAC1:3) before and after a post-treatment with H2S. In the first step, a microporous activated carbon (PPAC1:3) with a highly developed porous structure was [...] Read more.
The aim of this study was to determine the adsorption performance of a petroleum pitch-based activated carbon (PPAC1:3) before and after a post-treatment with H2S. In the first step, a microporous activated carbon (PPAC1:3) with a highly developed porous structure was produced through a chemical activation route with KOH. Afterward, the synthesized activated carbon was thermally treated yielding two different series of functionalized activated carbons: (i) a series of carbons were treated directly with H2S at elevated temperatures (600 °C and 800 °C), and (ii) a series of carbons were generated by combining an oxidation treatment with plasma followed by H2S treatment at elevated temperatures (600 °C and 800 °C). The chemical and structural characteristics of the S-doped and S-/O-co-doped porous carbons were investigated by means of different experimental techniques, such as XRD, RAMAN, FESEM, XPS, TPD, N2, and CO2 adsorption, and finally tested in CO2 and CH4 adsorption at atmospheric and high pressure. The functionalized porous carbons possessed specific surface areas of 2420–2690 m2/g, total pore volume of 1.05–1.18 cm3/g, and sulfur content up to 2.55 atom % (the sulfur content of the original carbon was 0.19%). After a careful analysis of the carbon dioxide and methane uptake at atmospheric (0.1 MPa) and high pressure (4 MPa), adsorption results confirm that the microporous structure is the main structural parameter defining the adsorption performance and, to a lower extent, the surface chemistry. Overall, a significant improvement in the total uptake can be appreciated after the H2S treatment. Full article
(This article belongs to the Special Issue Carbons for Health and Environmental Protection)
Show Figures

Figure 1

Figure 1
<p>(<b>a</b>,<b>b</b>) N<sub>2</sub> adsorption/desorption isotherms at −196 °C, (<b>c</b>,<b>d</b>) CO<sub>2</sub> isotherms at 0 °C for the different samples evaluated, and (<b>e</b>,<b>f</b>) pore size distribution after the application of the QSDFT method to the nitrogen adsorption data (slit-shaped pore model).</p>
Full article ">Figure 2
<p>FESEM images of activated carbon samples (<b>a</b>) PPAC1:3, (<b>b</b>) PPAC1:3800, (<b>c</b>) PPAC1:3P, (<b>d</b>) PPAC1:3P800.</p>
Full article ">Figure 3
<p>(<b>a</b>) XRD patterns and (<b>b</b>) Raman spectra for original and modified activated carbons.</p>
Full article ">Figure 4
<p>XPS spectra in the (<b>a</b>) overall survey, (<b>b</b>) C1s, (<b>c</b>) O1s, (<b>d</b>) N1s, and (<b>e</b>) S2p region for the samples PPAC1:3, PPAC1:3800, and PPAC1:3P800.</p>
Full article ">Figure 5
<p>Temperature-programmed decomposition (TPD) profiles for the representative samples.</p>
Full article ">Figure 6
<p>CO<sub>2</sub> adsorption isotherms measured at 0.1 MPa (<b>a</b>,<b>c</b>) and 4 MPa (<b>b</b>,<b>d</b>) and 25 °C.</p>
Full article ">Figure 7
<p>CH<sub>4</sub> adsorption isotherms measured at 0.1 MPa (<b>a</b>,<b>c</b>) and 4 MPa (<b>b</b>,<b>d</b>).</p>
Full article ">Figure 8
<p>Correlation between the textural parameters (BET surface area and micropore volume—V<sub>0</sub>) and the excess amount adsorbed for CO<sub>2</sub> at atmospheric and high pressure.</p>
Full article ">Figure 9
<p>Correlation between the textural parameters (BET surface area and micropore volume—V<sub>0</sub>) and the excess amount adsorbed for CH<sub>4</sub> at atmospheric and high pressure.</p>
Full article ">Figure 10
<p>Correlation between the amount of sulfur functional groups on the carbon surface (deduced from the XPS results) and the excess amount adsorbed for CH<sub>4</sub> and CO<sub>2</sub> at atmospheric and high pressure after normalization using the narrow micropore volume.</p>
Full article ">
13 pages, 2763 KiB  
Article
Amperometric Biosensor Based on Laccase Enzyme, Gold Nanoparticles, and Glutaraldehyde for the Determination of Dopamine in Biological and Environmental Samples
by Anderson M. Santos, Ademar Wong, Orlando Fatibello-Filho and Fernando C. Moraes
C 2022, 8(3), 40; https://doi.org/10.3390/c8030040 - 1 Aug 2022
Cited by 10 | Viewed by 2897
Abstract
The present work reports the development and application of an amperometric biosensor based on carbon paste electrode modified with laccase enzyme, glutaraldehyde, and gold nanoparticles (Lac-Glu-AuNPs/CPE) for the determination of the neurotransmitter dopamine (DA). The materials were characterized morphologically and chemically using scanning [...] Read more.
The present work reports the development and application of an amperometric biosensor based on carbon paste electrode modified with laccase enzyme, glutaraldehyde, and gold nanoparticles (Lac-Glu-AuNPs/CPE) for the determination of the neurotransmitter dopamine (DA). The materials were characterized morphologically and chemically using scanning electron microscopy (SEM), transmission electron microscopy (TEM), and cyclic voltammetry. Optimization studies were performed in order to determine the optimal amount of enzyme and pH level that can yield the best conditions of analysis. The application of the biosensor in optimal conditions using the amperometric technique yielded a linear concentration range of 8.0 × 10⁻⁷–6.2 × 10⁻⁵ mol L−1 with a limit of detection of 6.0 × 10⁻⁸ mol L−1. The proposed biosensor was successfully applied for the determination of DA in biological and environmental samples. In addition, the application of the biosensor for the conduct of electrochemical measurements showed that the sensing device has good repeatability and stability, and it does not suffer from matrix interference effects. The proposed biosensor exhibited an analytical signal of 85% after 10 days of consecutive use. Full article
(This article belongs to the Special Issue Carbon Nanohybrids for Biomedical Applications)
Show Figures

Figure 1

Figure 1
<p>Illustrative scheme showing the procedures involved in the preparation of the biosensor.</p>
Full article ">Figure 2
<p>FEG-SEM images of graphite (<b>A</b>), AuNPs-Gr (<b>B</b>), AuNPs (<b>C</b>), and the Lac-Glu-AuNPs/CPE biosensor (<b>D</b>). TEM image of (<b>E</b>) AuNPs and (<b>F</b>) corresponding histogram of AuNPs diameters.</p>
Full article ">Figure 3
<p>Cyclic voltammograms obtained from the application of (a) Lac-Glu-AuNPs/CPE, (b) AuNPs/CPE, and (c) CPE in 0.1 mol L<sup>−1</sup> phosphate buffer solution (pH 7.0) employed as supporting electrolyte in the absence (inserted) and presence of 1.0 × 10<sup>−4</sup> mol L<sup>−1</sup> DA; scan rate (<span class="html-italic">v</span>) = 50 mV s<sup>−1</sup>. Inserted: cyclic voltammogram in the absence of AD.</p>
Full article ">Figure 4
<p>Effect of the amount of (<b>A</b>) AuNPs, (<b>B</b>) enzyme and (<b>C</b>) glutaraldehyde on the biosensor response for 1.0 × 10<sup>−5</sup> mol L<sup>−1</sup> DA in 0.1 mol L<sup>−1</sup> phosphate buffer solution (pH = 7.0) at a potential of 0.3 V. (<b>D</b>) Effect of the applied potential of 0.25, 0.30 and 0.35 V on the biosensor response for 1.0 × 10<sup>−5</sup> mol L<sup>−1</sup> DA in 0.1 mol L<sup>−1</sup> phosphate buffer solution (pH = 7.0) and 10 mg mL<sup>−1</sup> laccase concentration. (<b>E</b>) pH effect on the biosensor response for a 2.0 × 10<sup>−5</sup> mol L<sup>−1</sup> DA in 0.1 mol L<sup>−1</sup> phosphate buffer at an applied potential (<span class="html-italic">E</span><sub>app</sub>) of 0.3 V and 10 mg mL<sup>−1</sup> laccase concentration (4 U by electrode).</p>
Full article ">Figure 5
<p>Amperograms obtained from the application of the Lac-Glu-AuNPs/CPE biosensor using 0.1 mol L<sup>−1</sup> phosphate buffer solution (pH 7.0) as supporting electrolyte in the presence of different concentrations of DA (8.0 × 10<sup>−7</sup>–6.2 × 10<sup>−5</sup> mol L<sup>−1</sup>), with <span class="html-italic">E</span><sub>apl</sub> of 0.3 V. Inset: corresponding analytical curves.</p>
Full article ">Figure 6
<p>Michaelis–Menten plot obtained from the successive addition of DA (<b>A</b>) and Lineweaver–Burk plot (<b>B</b>).</p>
Full article ">Figure 7
<p>Lac-Glu-AuNPs/CPE biosensor selectivity for a 2.0 × 10<sup>−5</sup> mol L<sup>−1</sup> DA concentration and 2.0 × 10<sup>−4</sup> mol L<sup>−1</sup> of the following concomitants: Cd<sup>2+</sup>, Pb<sup>2+</sup>, humic acid, urea, nimesulide, caffeine, glucose, uric acid and ascorbic acid.</p>
Full article ">Figure 8
<p>Corresponding histogram of the Lac-Glu-AuNPs/CPE sensor stability analysis for a period of 10 days (<span class="html-italic">n</span> = 3).</p>
Full article ">
11 pages, 5260 KiB  
Article
Stability of Carboxyl-Functionalized Carbon Nanotubes in Simulated Cement Pore Solution and Its Effect on the Compressive Strength and Porosity of Cement-Based Nanocomposites
by Laura Silvestro, Geannina Terezinha Dos Santos Lima, Artur Spat Ruviaro and Philippe Jean Paul Gleize
C 2022, 8(3), 39; https://doi.org/10.3390/c8030039 - 19 Jul 2022
Cited by 5 | Viewed by 2595
Abstract
The application of carbon nanotubes to produce cementitious composites has been extensively researched. However, the dispersion of this nanomaterial remains a technical limitation for its use. Thus, initially, this study assessed the stability of carboxyl-functionalized CNT on aqueous suspensions and simulated cement pore [...] Read more.
The application of carbon nanotubes to produce cementitious composites has been extensively researched. However, the dispersion of this nanomaterial remains a technical limitation for its use. Thus, initially, this study assessed the stability of carboxyl-functionalized CNT on aqueous suspensions and simulated cement pore solution for 6 h through UV–visible spectroscopy. Subsequently, a CNT content of 0.1% by cement weight was incorporated into the cement pastes, and the compressive strength after 7, 14, 28, and 91 days was evaluated. In addition, the porosity of the CNT cementitious composites at 28 days of hydration was investigated by mercury intrusion porosimetry (MIP), and the microstructure was evaluated via scanning electron microscopy (SEM). The simulated cement pore solution’s alkaline environment affects the CNT stability, progressively reducing the dispersed CNT concentration over time. CNT reduced the cementitious matrix pores < 50 nm by 8.5%; however, it resulted in an increase of 4.5% in pores > 50 nm. Thus, CNT incorporation did not significantly affect the compressive strength of cement pastes. SEM results also suggested a high porosity of CNT cementitious composites. The CNT agglomeration trend in an alkaline environment affected the CNT performance in cement-based nanocomposites. Full article
(This article belongs to the Collection Novel Applications of Carbon Nanotube-Based Materials)
Show Figures

Figure 1

Figure 1
<p>SEM image of CNTs at 100,000× magnification.</p>
Full article ">Figure 2
<p>Correlation between absorbance at 253 nm and CNT concentration.</p>
Full article ">Figure 3
<p>Stability of CNT dispersions in water and simulated cementitious pore solution after 6 h.</p>
Full article ">Figure 4
<p>Compressive strength of cement pastes after 7, 14, 28, and 91 days.</p>
Full article ">Figure 5
<p>Cumulative pore volume (<b>a</b>) and pore size distribution (<b>b</b>) of cement pastes after 28 days.</p>
Full article ">Figure 6
<p>SEM images of cement pastes after 28 days: (<b>a</b>) 0.0% CNT and (<b>b</b>) 0.1% CNT (1000× magnification).</p>
Full article ">
11 pages, 3455 KiB  
Article
Study of the Adsorption of Bacillus subtilis and Bacillus cereus Bacteria on Enterosorbent Obtained from Apricot Kernels
by Lucian Lupascu, Oleg Petuhov, Nina Timbaliuc and Tudor Lupascu
C 2022, 8(3), 38; https://doi.org/10.3390/c8030038 - 8 Jul 2022
Cited by 5 | Viewed by 2526
Abstract
This paper presents the results of scientific research on the structural parameters and the adsorption capacity of activated carbon obtained from apricot kernels (AC-A) in a fluidized layer. The obtained results highlight the fact that the described procedure allows obtaining a mesoporous carbon [...] Read more.
This paper presents the results of scientific research on the structural parameters and the adsorption capacity of activated carbon obtained from apricot kernels (AC-A) in a fluidized layer. The obtained results highlight the fact that the described procedure allows obtaining a mesoporous carbon adsorbent with increased adsorption capacities (SBET = 1424 m2/g) and with quality indices corresponding to the requirements of the carbon enterosorbents imposed by the European Pharmacopoeia Monograph. Adsorption kinetics studies of the bacteria Bacillus subtilis and Bacillus cereus have shown that the time to establish the adsorption equilibrium is 75–90 min. The adsorption of the mentioned bacteria on the carbon enterosorbent AC-A was studied depending on the temperature (26 and 36 °C) and pH of the solution (1.97–4.05). Scanning Electron Microscopy (SEM) showed that the immobilization of bacteria takes place on the outer surface of the carbon adsorbent due to the fact that the geometric dimensions of the bacteria are often larger than the macro diameter of the activated carbon pores. FTIR investigations also indicated the presence of bacteria on the surface of the activated carbon. Full article
(This article belongs to the Section Carbon Materials and Carbon Allotropes)
Show Figures

Figure 1

Figure 1
<p>Nitrogen adsorption–desorption isotherms (<b>a</b>) and pore volume distribution curves (<b>b</b>) for sample AC-A.</p>
Full article ">Figure 2
<p>Adsorption kinetics of <span class="html-italic">B. subtilis</span> and <span class="html-italic">B. cereus</span> bacteria on activated carbon AC-C.</p>
Full article ">Figure 3
<p>Adsorption isotherm of <span class="html-italic">B. subtilis</span> bacterium on AC-A enterosorbent.</p>
Full article ">Figure 4
<p>Adsorption isotherm of <span class="html-italic">Bacillus cereus</span> bacterium on AC-A enterosorbent.</p>
Full article ">Figure 5
<p>SEM images of the bacteria <span class="html-italic">Bacillus subtilis</span> and <span class="html-italic">Bacillus cereus</span> adsorbed on the enterosorbent CA-A at different magnification scales.</p>
Full article ">Figure 6
<p>FTIR spectra of <span class="html-italic">B</span>. <span class="html-italic">subtilis</span> and <span class="html-italic">B. cereus</span> bacteria adsorbed on the AC-A enterosorbent and the intact AC-A enterosorbent.</p>
Full article ">
14 pages, 12277 KiB  
Article
Bottom-Up Synthesis Strategies Enabling the Investigation of Metal Catalyst-Carbon Support Interactions
by Hamed Bateni, Prathamesh T. Prabhu, Hannah E. Gebur and Jean-Philippe Tessonnier
C 2022, 8(3), 37; https://doi.org/10.3390/c8030037 - 28 Jun 2022
Viewed by 2682
Abstract
The structural versatility and vibrant surface chemistry of carbon materials offer tremendous opportunities for tailoring the catalytic performance of supported metal nanoparticles through the modulation of interfacial metal-support interactions (MSI). MSI’s geometric and structural effects are well documented for these materials. However, other [...] Read more.
The structural versatility and vibrant surface chemistry of carbon materials offer tremendous opportunities for tailoring the catalytic performance of supported metal nanoparticles through the modulation of interfacial metal-support interactions (MSI). MSI’s geometric and structural effects are well documented for these materials. However, other potential support effects such as electronic metal-carbon interactions remain poorly understood. Such limitations are tied to constraints intrinsic to commonly available carbon materials such as activated carbon (e.g., microporosity) and the top-down approach that is often used for their synthesis. Nonetheless, it is crucial to understand the interplay between the structure, properties, and performance of carbon-supported metal catalysts to take steps toward rationalizing their design. The present study investigates promising and scalable bottom-up synthesis approaches, namely hydrothermal carbonization (HTC) and evaporation-induced self-assembly (EISA), that offer great flexibility for controlling the carbon structure. The opportunities and limitations of the methods are discussed with a particular focus on harnessing the power of oxygen functionalities. A remarkable production yield of 32.8% was achieved for mesoporous carbons synthesized via EISA. Moreover, these carbon materials present similar external surface areas of 316 ± 19 m2/g and average pore sizes of 10.0 ± 0.1 nm while offering flexibility to control the oxygen concentration in the range of 5–26 wt%. This study provides the cornerstone for future investigations of metal-carbon support interactions and the rational design of these catalysts. Full article
(This article belongs to the Collection Young Carbon Scientists)
Show Figures

Figure 1

Figure 1
<p>SEM images of HTC materials catalyzed using (<b>a</b>) hydrochloric acid, (<b>b</b>) formic acid, and (<b>c</b>) citric acid.</p>
Full article ">Figure 2
<p>Proposed structures for (<b>a</b>) as-synthesized HTC material and (<b>b</b>) mesoporous carbon from phenolic resin carbonized at 500 °C based on [<a href="#B25-carbon-08-00037" class="html-bibr">25</a>] and [<a href="#B26-carbon-08-00037" class="html-bibr">26</a>], respectively.</p>
Full article ">Figure 3
<p>Composition analysis of as-synthesized HTC and samples annealed at 200–800 °C showing a significant reduction in the oxygen content of the materials. Annealing was performed under a flow of nitrogen (200 mL/min) using a heat ramp of 10 °C/min and a dwell time of 1 h at the target temperature.</p>
Full article ">Figure 4
<p>SEM images of MC materials obtained from the carbonization of RF resin (EISA approach) showing the morphology and structure of these materials. (<b>a</b>) 5000× magnification image showing carbon aggregates; (<b>b</b>) 50,000× magnification image featuring meso- and macropores in the structure.</p>
Full article ">Figure 5
<p>Nitrogen physisorption analysis of MC-ox samples: (1) MC-ox, (2) MC-ox200, (3) MC-ox400, (4) MC-ox600, and (5) MC-ox800. (<b>a</b>) adsorption-desorption isotherms; offsets of 150, 275, 400, and 550 cm<sup>3</sup>/g were applied to the isotherms (2)–(5), respectively; (<b>b</b>) pore size distributions (PSD) calculated using the BJH model; a constant 0.4 cm<sup>3</sup>/g offset was applied between the PSDs.</p>
Full article ">Figure 6
<p>XPS analysis of the functionalized MC samples. (<b>a</b>) C1s spectra showing the peak deconvolution where defects (C1), graphitic sp<sup>2</sup> (C2), disordered carbon (C3), sp<sup>3</sup> (C4), C–O (C5), C=O (C6), O–C=O (C7) are considered in the fitting model (red dashed line shows the fit); (<b>b</b>) relative change in the composition of oxygen groups with increasing annealing temperature; (<b>c</b>) relative change in the composition of graphitic-sp<sup>2</sup>, defects, disordered, and sp<sup>3</sup> carbon (■ represent the change in the ratio of graphitic-sp<sup>2</sup>/sp<sup>3</sup> as a function of annealing temperature).</p>
Full article ">Figure 7
<p>TPD-MS analysis of functionalized MC samples: (<b>a</b>) CO<sub>2</sub> profile (carboxylic acid: red and blue, anhydride: green); (<b>b</b>) CO profile (blue: hydroxyl/epoxy, green: aldehyde, purple: anhydride, golden: phenol).</p>
Full article ">Figure 8
<p>TEM images of supported palladium catalysts obtained with the functionalized MC supports: (<b>a</b>) Pd/MC-ox200; (<b>b</b>) Pd/MC-ox400; (<b>c</b>) Pd/MC-ox600; (<b>d</b>) Pd/MC-ox800.</p>
Full article ">
21 pages, 3855 KiB  
Review
Hydrogen Storages Based on Graphene Nano-Flakes: Density Functional Theory Approach
by Hiroto Tachikawa
C 2022, 8(3), 36; https://doi.org/10.3390/c8030036 - 27 Jun 2022
Cited by 5 | Viewed by 2386
Abstract
Carbon materials such as graphene, carbon nanotubes, fullerene, and graphene nanoflakes (GNFs) are used for hydrogen storage. The doping of alkali metals to these materials generally increases the accumulation density of molecular hydrogen (H2). However, the reason why the doping enhances [...] Read more.
Carbon materials such as graphene, carbon nanotubes, fullerene, and graphene nanoflakes (GNFs) are used for hydrogen storage. The doping of alkali metals to these materials generally increases the accumulation density of molecular hydrogen (H2). However, the reason why the doping enhances the ability of the H2 storage of GNF is not clearly known, although there are some explanations. In addition, the information on the storage capacity of GNF is ambiguous. In the present review article, we introduce our recent theoretical studies on the interaction of GNF with H2 molecules carried out to elucidate the mechanism of hydrogen storage in alkali-doped GNFs. As alkali metals, lithium (Li), sodium (Na), and potassium (K) were examined, and the abilities of hydrogen storage were discussed. Next, the mechanism of Li-diffusion on GNF, which plays a crucial role in Li-battery, was presented. There are several unanswered questions. In particular, does lithium diffuse randomly on GNF? Or is there a specific diffusion path? We present our study, which elucidates the factors governing lithium diffusion on GNF. If the dominant factor is known, it is possible to arbitrarily control the diffusion path of lithium. This will lead to the development of highly functional battery materials. Finally, the molecular design of H adsorption–desorption reversible storage devices based on GNF will be introduced. Elucidating the mechanism of hydrogen storage, Li-diffusion on GNF, and molecular design of storage device is important in understanding the current molecular devices and provide a deeper insight into materials chemistry. Full article
(This article belongs to the Special Issue Carbon Materials for Physical and Chemical Hydrogen Storage)
Show Figures

Graphical abstract

Graphical abstract
Full article ">Figure 1
<p>The graphene nanoflakes used in the present calculations. GNF(<span class="html-italic">m</span>) is the graphene nanoflake composed of <span class="html-italic">m</span> benzene rings. GNF(7), GNF(19), and GNF(37) are coronene (C<sub>24</sub>H<sub>12</sub>), circumcoronene (C<sub>54</sub>H<sub>18</sub>), and circumcircumcoronene (C<sub>96</sub>H<sub>24</sub>), respectively.</p>
Full article ">Figure 2
<p>The optimized structures of the GNF(37)–Li(atom)–(H<sub>2</sub>)<span class="html-italic"><sub>n</sub></span> (<span class="html-italic">n</span> = 1, 2, 3, 4, 7, and 11). The calculations were performed at the CAM-B3LYP/6-311G(d,p) level. Reprinted with permission from [<a href="#B38-carbon-08-00036" class="html-bibr">38</a>]. Copyright 2019 American Chemical Society.</p>
Full article ">Figure 3
<p>The binding energies of H<sub>2</sub> to GNF(37)-Li and GNF(37)-Li<sup>+</sup> (per H<sub>2</sub> molecule) plotted as a function of the number of hydrogen molecules (<span class="html-italic">n</span>). The open squares represent the binding energies of H<sub>2</sub> to the Li atom without GNF, Li(H<sub>2</sub>)<span class="html-italic"><sub>n</sub></span>. Calculations were performed at the CAM-B3LYP/6-311G(d,p) level. Reprinted with permission from [<a href="#B38-carbon-08-00036" class="html-bibr">38</a>]. Copyright 2019 American Chemical Society.</p>
Full article ">Figure 4
<p>The optimized structures of GNF(37)–Na(atom)–(H<sub>2</sub>)<span class="html-italic"><sub>n</sub></span> (<span class="html-italic">n</span> = 1–6). The calculations were performed at the CAM-B3LYP/6-311G(d,p) level. Reprinted with permission from [<a href="#B39-carbon-08-00036" class="html-bibr">39</a>].</p>
Full article ">Figure 5
<p>The binding energies of H<sub>2</sub> to GNF(37)–Na and GNF(37)–Na<sup>+</sup> (per H<sub>2</sub> molecule) plotted as a function of the number of hydrogen molecules (<span class="html-italic">n</span>). Calculations were performed at the CAM-B3LYP/6-311G(d,p) level.</p>
Full article ">Figure 6
<p>The optimized structures of GNF(37)–K(atom)–(H<sub>2</sub>)<span class="html-italic"><sub>n</sub></span> (<span class="html-italic">n</span> = 1, 2, and 5–8). The calculations were performed at the CAM-B3LYP/6-311G(d,p) level.</p>
Full article ">Figure 7
<p>The binding energies of H<sub>2</sub> to GNF–M (per H<sub>2</sub> molecule) plotted as a function of <span class="html-italic">n</span> (M = Li, Li<sup>+</sup>, Na, Na<sup>+</sup>, and K<sup>+</sup>). Calculations for M = Li, Li<sup>+</sup>, Na, Na<sup>+</sup> were carried out at the CAM-B3LYP/6-311G(d,p) level and for M = K<sup>+</sup>, it was at the CAM-B3LYP/6-31G(d) level. Reprinted with permission from [<a href="#B39-carbon-08-00036" class="html-bibr">39</a>].</p>
Full article ">Figure 8
<p>(<b>A</b>) The potential energy curves for the diffusion of the Li<sup>+</sup> ion and Li atom along the points <b>a</b> → <b>b</b> path on the surface. The heights of the Li<sup>+</sup> ion and Li atom were set to 1.777 and 1.729 Å, respectively. Optimized transition state structures for the diffusion of the (<b>B</b>) Li<sup>+</sup> ion and (<b>C</b>) Li atom on GNF(37). The height (<span class="html-italic">h</span>) of Li is given in Å. All calculations were carried out at the CAM-B3LYP/6-311G(d,p) level of theory. Reprinted with permission from [<a href="#B41-carbon-08-00036" class="html-bibr">41</a>]. Copyright 2020 Elsevier.</p>
Full article ">Figure 9
<p>(<b>Left</b>) Sample trajectory of Li<sup>+</sup> on GNF at 300 K (dotted red curve), spatial distribution of HOMO of GNF–Li<sup>+</sup>, and the phases of HOMO (green and brown colors). (<b>Right</b>) A schematic illustration of the interaction of molecular orbitals between Li<sup>+</sup> and GNF during the diffusion. The trajectory calculation was carried out using the direct ab initio molecular dynamics (MD) method. The Li<sup>+</sup> ion diffuses along the node of HOMO of the GNF–Li<sup>+</sup> system. Reprinted with permission from [<a href="#B42-carbon-08-00036" class="html-bibr">42</a>]. Copyright 2006 American Chemical Society.</p>
Full article ">Figure 10
<p>The optimized structures of GNF(19)–Li<sup>+</sup>–(H<sub>2</sub>)<span class="html-italic"><sub>n</sub></span> (<span class="html-italic">n</span> = 3) in the (<b>upper</b>) binding state and (<b>lower</b>) transition state (TS) calculated at the CAM-B3LYP/6-311G(d,p) level. Bond distances are given in Å. Reprinted with permission from [<a href="#B38-carbon-08-00036" class="html-bibr">38</a>]. Copyright 2019 American Chemical Society.</p>
Full article ">Figure 11
<p>(<b>A</b>) The optimized structure of the GNF(7)-Mg<sup>2+</sup> calculated at the CAM-B3LYP/6-311G(d,p) level. Notation <span class="html-italic">h</span> means the height of Mg species from the GNF surface (in Å). (<b>B</b>) The binding energies of H<sub>2</sub> to GNF(7)–Mg<sup>2+</sup> and GNF(7)–Mg<sup>+</sup> (per H<sub>2</sub> molecule) plotted as a function of the number of H<sub>2</sub> molecules (<span class="html-italic">n</span>). Dashed lines indicate the binding energies of H<sub>2</sub> to GNF(37)–Mg<sup>m+</sup> (<span class="html-italic">m</span> = 1 and 2). Reprinted with permission from [<a href="#B45-carbon-08-00036" class="html-bibr">45</a>]. Copyright 2021 American Chemical Society.</p>
Full article ">Figure 12
<p>(<b>A</b>) Snapshots of GNF–Mg<sup>+</sup>–(H<sub>2</sub>)<sub>4</sub> following the electron capture of GNF–Mg<sup>2+</sup>–(H<sub>2</sub>)<sub>4</sub>. (<b>B</b>) Time evolution of potential energy of GNF–Mg<sup>+</sup>-(H<sub>2</sub>)<sub>4</sub>. Direct AIMD calculations were carried out at the CAM-B3LYP/6-31G(d) level. The initial geometry was taken from the optimized structure of GNF–Mg<sup>2+</sup>–(H<sub>2</sub>)<sub>4</sub> (CAM-B3LYP/6-31G(d) level). The distances and heights are in Å. Reprinted with permission from [<a href="#B45-carbon-08-00036" class="html-bibr">45</a>]. Copyright 2021 American Chemical Society.</p>
Full article ">Figure 13
<p>(<b>A</b>) The snapshots of the GNF–Mg<sup>2+</sup>–(H<sub>2</sub>)<sub>4</sub> following the hole capture of GNF–Mg<sup>+</sup>–(H<sub>2</sub>)<sub>4</sub>. (<b>B</b>) The time evolution of the potential energy of GNF–Mg<sup>2+</sup>–(H<sub>2</sub>)<sub>4</sub>. Direct AIMD calculations were carried out at the CAM-B3LYP/6-31G(d) level. The initial geometry was taken from one of the structures in the simulation of GNF–Mg<sup>+</sup>-(H<sub>2</sub>)<sub>4</sub> (indicated by “selected point” in <a href="#carbon-08-00036-f012" class="html-fig">Figure 12</a>). The distances and heights are in Å. Reprinted with permission from [<a href="#B45-carbon-08-00036" class="html-bibr">45</a>]. Copyright 2021 American Chemical Society.</p>
Full article ">Figure 14
<p>The conceptual diagram for a H<sub>2</sub> adsorption–desorption reversible molecular device.</p>
Full article ">
11 pages, 2918 KiB  
Article
Spark Desensitization of Nanothermites via the Addition of Highly Electro-Conductive Carbon Particles
by Pierre Gibot
C 2022, 8(3), 35; https://doi.org/10.3390/c8030035 - 23 Jun 2022
Cited by 1 | Viewed by 2150
Abstract
In the past decade, the formulation of spark-desensitized nanothermites has considerably advanced, making them safe to handle. When ignited, these materials reveal impressive properties such as high temperatures (>1000 °C), intense heat releases (>kJ/cm3), and sometimes gas generation. Unfortunately, these energetic [...] Read more.
In the past decade, the formulation of spark-desensitized nanothermites has considerably advanced, making them safe to handle. When ignited, these materials reveal impressive properties such as high temperatures (>1000 °C), intense heat releases (>kJ/cm3), and sometimes gas generation. Unfortunately, these energetic systems are systematically characterized by an extreme sensitivity to electrostatic discharges, which can cause accidental ignitions during preparation, handling, and transport. The present study examines the electrostatic discharge sensitivity response of an Al/WO3 energetic formulation doped with highly conductive carbon nanoparticles (Ketjenblack EC600JD). The results showed an increased threshold from <0.14 mJ to almost 40 mJ with 18.80 vol. % of KB EC600JD in the energetic mixture. The energetic material was also desensitized to friction stress with a threshold greater than 360 N, in contrast to a value of <4.9 N for an un-doped Al/WO3 energetic composite material. The reactive performance of the system (w/o Ketjenblack additive) was verified in open medium by means of an optical igniter. The heat release was determined by a calorimetric bomb and a decrease of 50% was recorded for the carbon-doped energetic system compared to the pristine Al/WO3 composition. Full article
Show Figures

Figure 1

Figure 1
<p>X-ray diffraction patterns of individual nanomaterials involved in Al/WO<sub>3</sub>/C energetic composites: (<b>A</b>) Al, (<b>B</b>) WO<sub>3</sub>, and (<b>C</b>) carbon (Ketjenblack EC-600JD).</p>
Full article ">Figure 2
<p>Raman spectrum of the carbon additive (Ketjenblack EC−600JD).</p>
Full article ">Figure 3
<p>Transmission electron microscopy images of (<b>A</b>,<b>D</b>) aluminum, (<b>B</b>,<b>E</b>) tungsten (VI) oxide, and (<b>C</b>,<b>F</b>) highly-conductive carbon nanopowders.</p>
Full article ">Figure 4
<p>Electrical conductivity and electrostatic discharge (ESD) sensitivity threshold of Al/WO<sub>3</sub>/C (C = Ketjenblack) as a function of C concentration (expressed in vol. %).</p>
Full article ">Figure 5
<p>Scanning electron microscopy views of the Al/WO3/carbon nanothermite (<b>A</b>) at high and (<b>B</b>) low magnification, with a concentration of 3 wt. % (6.05 vol. %) of carbon additive. Equivalence ratio Al/WO3 was fixed at 1.4. The down line shows the aluminum Al, tungsten W, and carbon C elemental mappings derived from (<b>B</b>) picture.</p>
Full article ">Figure 6
<p>Images extracted from the combustion videos of the Al/WO<sub>3</sub>/Ketjenblack energetic material: (<b>A</b>) free of carbon and (<b>B</b>) with 18.8 vol. % of carbon. The equivalence ratio (ϕ) between Al and WO<sub>3</sub> components was fixed at 1.4. The elapsed time between images was 1 ms and the white scale bar represents 20 mm.</p>
Full article ">
17 pages, 5184 KiB  
Article
Digital Synthesis of Realistically Clustered Carbon Nanotubes
by Bryan T. Susi and Jay F. Tu
C 2022, 8(3), 34; https://doi.org/10.3390/c8030034 - 22 Jun 2022
Cited by 4 | Viewed by 2864
Abstract
A computational approach for creating realistically structured carbon nanotubes is presented to enable more accurate and impactful multi-scale modeling and simulation techniques for nanotube research. Much of the published literature to date involving computational modeling of carbon nanotubes simplifies their structure as being [...] Read more.
A computational approach for creating realistically structured carbon nanotubes is presented to enable more accurate and impactful multi-scale modeling and simulation techniques for nanotube research. Much of the published literature to date involving computational modeling of carbon nanotubes simplifies their structure as being long and straight, and often existing as isolated individual nanotubes. However, imagery of nanotubes has shown over several decades that nanotubes agglomerate together and exhibit looping and curvature due both to inter- and intra-nanotube attraction. The research presented in this paper leverages multi-scale simulations consisting of a simple bead-spring model for initial nanotube relaxation followed by a differential geometry approach to create an atomic representation of carbon nanotubes, and then finalized with molecular dynamics simulations using the Tersoff potential model for carbon that allows dynamic bonding and cleavage. The result is atomically accurate representations of carbon nanotubes that exist as single nanotubes, or as clusters of multiple nanotubes. The presented approach is demonstrated using (5,5) single-walled carbon nanotubes. The synthesized nanotubes are shown to relax into the curving and looping structures observed in transmission or scanning electron microscopy, but also exhibit nano-scale defects due to buckling, crimping, and twisting that are resolved during the molecular dynamics simulations. These features locally compromise the desired strength characteristics of nanotubes and therefore the presented procedure will enable more accurate modeling and simulation of nanotubes in subsequent research by representing them less as the theoretically straight and independent entities, but as realistically imperfect. Full article
(This article belongs to the Collection Novel Applications of Carbon Nanotube-Based Materials)
Show Figures

Figure 1

Figure 1
<p>(<b>a</b>) A straight section of an atomically resolved (5,5) singled-walled carbon nanotube, and (<b>b</b>) a simplified coarse-grained model based on [<a href="#B21-carbon-08-00034" class="html-bibr">21</a>] that serves as the coarsest representation of the presented hierarchical modeling approach.</p>
Full article ">Figure 2
<p>(<b>a</b>) Orthographic view of a small section of a (5,5) SWNT, (<b>b</b>) Isolated view of two levels of concentric carbon rings that form a unit cell, colored by individual ring, and (<b>c</b>) View down the central axis of this straight example SWNT, where the central axis is denoted by the cross symbol.</p>
Full article ">Figure 3
<p>A three-dimensional space curve (red line) with consistently oriented finite frames along the curve. The red line is representative of the coarse-grained nanotube’s central axis and the consistency in the finite frames defined by planes spanned by vectors <math display="inline"><semantics> <mover accent="true"> <mi>N</mi> <mo>¯</mo> </mover> </semantics></math> and <math display="inline"><semantics> <mover accent="true"> <mi>B</mi> <mo>¯</mo> </mover> </semantics></math> normal to the curve’s tangent vector <math display="inline"><semantics> <mover accent="true"> <mi>T</mi> <mo>¯</mo> </mover> </semantics></math> is required to enforce the appropriate rotations and re-orientations of the atomic carbon rings for building the atomistic nanotubes.</p>
Full article ">Figure 4
<p>(<b>a</b>) Example of a cluster of random walk realizations for <span class="html-italic">N</span> = 10 nanotubes of varying lengths sampled from specifications provided by Carbon Solutions Inc. [<a href="#B35-carbon-08-00034" class="html-bibr">35</a>]. (<b>b</b>) Highly maligned and energetically unfavorable configuration shown in the magnified section.</p>
Full article ">Figure 5
<p>(<b>a</b>) TEM image from Liu et al. [<a href="#B19-carbon-08-00034" class="html-bibr">19</a>] (<b>b</b>) slice of the relaxed coarse-grained configuration from the present research, and (<b>c</b>) the energy relaxation from the canonical MD simulation of the bead spring filament system showing convergence in kinetic and potential energies.</p>
Full article ">Figure 6
<p>(<b>a</b>) Images of 4 carbon nanotubes differentiated by color from a large cluster on the order of 100 nm and (<b>b</b>) a close-up view of one representative loop to show atomistic resolution.</p>
Full article ">Figure 7
<p>100 nm cluster of 10 relaxed atomically resolved carbon nanotubes (<b>e</b>) with insets (<b>a</b>–<b>d</b>) showing greater detail from different locations in the cluster. Different colors denote individual carbon nanotubes.</p>
Full article ">Figure 8
<p>Transient records of the average kinetic (red, right axis) and average potential energy (black, left axis) for the 5-stage relaxation of the 100 nm cluster of 10 atomically resolved carbon nanotubes where the ensemble is noted graphically in concurrence with <a href="#carbon-08-00034-t003" class="html-table">Table 3</a>.</p>
Full article ">Figure 9
<p>Atomically resolved nanotubes exhibit features and interactions coarse-grained models under-represent. Examples shown here include (<b>a</b>) nanotube fracture, (<b>b</b>) bending-buckling, and (<b>c</b>) fusing.</p>
Full article ">
8 pages, 1623 KiB  
Article
Atmospheric Pressure Plasma-Jet Treatment of PAN-Nonwovens—Carbonization of Nanofiber Electrodes
by Andreas Hoffmann, Matthias Uhl, Maximilian Ceblin, Felix Rohrbach, Joachim Bansmann, Marcel Mallah, Holger Heuermann, Timo Jacob and Alexander J. C. Kuehne
C 2022, 8(3), 33; https://doi.org/10.3390/c8030033 - 22 Jun 2022
Cited by 3 | Viewed by 2869
Abstract
Carbon nanofibers are produced from dielectric polymer precursors such as polyacrylonitrile (PAN). Carbonized nanofiber nonwovens show high surface area and good electrical conductivity, rendering these fiber materials interesting for application as electrodes in batteries, fuel cells, and supercapacitors. However, thermal processing is slow [...] Read more.
Carbon nanofibers are produced from dielectric polymer precursors such as polyacrylonitrile (PAN). Carbonized nanofiber nonwovens show high surface area and good electrical conductivity, rendering these fiber materials interesting for application as electrodes in batteries, fuel cells, and supercapacitors. However, thermal processing is slow and costly, which is why new processing techniques have been explored for carbon fiber tows. Alternatives for the conversion of PAN-precursors into carbon fiber nonwovens are scarce. Here, we utilize an atmospheric pressure plasma jet to conduct carbonization of stabilized PAN nanofiber nonwovens. We explore the influence of various processing parameters on the conductivity and degree of carbonization of the converted nanofiber material. The precursor fibers are converted by plasma-jet treatment to carbon fiber nonwovens within seconds, by which they develop a rough surface making subsequent surface activation processes obsolete. The resulting carbon nanofiber nonwovens are applied as supercapacitor electrodes and examined by cyclic voltammetry and impedance spectroscopy. Nonwovens that are carbonized within 60 s show capacitances of up to 5 F g−1. Full article
Show Figures

Graphical abstract

Graphical abstract
Full article ">Figure 1
<p>(<b>a</b>) Photograph of the atmospheric plasma-jet carbonization apparatus. Red arrows in (<b>a</b>) indicate the individual components. (<b>b</b>) Photograph inside the treatment-chamber, during plasma-jet carbonization. (<b>c</b>) Illustration of the plasma-jet carbonization setup, with the distance <span class="html-italic">d</span> between the sample and the plasma-jet nozzle.</p>
Full article ">Figure 2
<p>(<b>a</b>) Photographs of stabilized PAN-nonwoven, after plasma jet treatment at various plasma jet nozzle—nonwoven distances. (<b>b</b>) Conductivities of the samples from a), measured for the center (black) and the edge (red) of the nonwoven. (<b>c</b>) C1s-XPS spectra of PAN nonwoven after stabilization at 280 °C, the central part of plasma jet treated nonwoven at d = 25 mm, the edge of a plasma jet treated nonwoven at d = 25 mm and PAN-nonwoven after carbonization at 1000 °C by convective heat.</p>
Full article ">Figure 3
<p>(<b>a</b>) Illustration of a two stepped plasma-jet carbonization, during which the nonwoven bend towards the plasma jet. (<b>b</b>) Photographs of the side-profile and (<b>c</b>) the top-profile of pristine, front carbonized and subsequently back-carbonized nonwoven. The scale bars indicate 10 mm.</p>
Full article ">Figure 4
<p>(<b>a</b>) Nyquist-plots with raw data points as hollow squares, fit as solid line and the used equivalent circuit in the inset, (<b>b</b>) cyclic voltammograms at 50 mV/s with the mass weighted current I and the electric potential vs. Ag-wire E and (<b>c</b>) specific capacitance C<sub>sp</sub> and internal resistance R<sub>int.</sub> of carbon nanofiber nonwoven, carbonized for various durations. (<b>d</b>) Close-up and wide-angle SEM-images of carbon-nanofiber nonwoven, carbonized for various plasma-jet exposure times. Red circles highlight breakage points of individual fibers. The scalebars indicate 2 µm (left row in <b>d</b>) and 20 µm (right row in <b>d</b>). Electrochemical measurements in (<b>a</b>–<b>c</b>) were conducted with the ionic liquid 1-Ethyl-3-methylimidazolium bis(trifluoromethylsulfonyl)imide, which was found to fully wet the nonwovens with a contact angle of 0°.</p>
Full article ">
Previous Issue
Next Issue
Back to TopTop