[go: up one dir, main page]

Next Issue
Volume 9, April
Previous Issue
Volume 8, December


Non-Coding RNA, Volume 9, Issue 1 (February 2023) – 16 articles

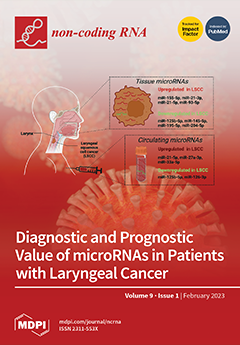
Cover Story (view full-size image): Laryngeal squamous cell cancer (LSCC) is one of the most common malignant tumors of head and neck region, with a poor survival rate as a consequence of advanced-stage diagnosis and high recurrence rate. The identification of effective diagnostic and prognostic biomarkers for LSCC is crucial to guide disease management and improve clinical outcomes. A dysregulated expression of small non-coding RNAs, including microRNAs (miRNAs), has been reported in many human cancers, including LSCC, and many miRNAs have been explored for their diagnostic and prognostic potential. Using the PRISMA protocol, we searched for original papers that were focused on miRNAs and LSCC. In this systematic review, we provide an overview of the current literature on the function and the potential diagnostic and prognostic role of tissue and circulating miRNAs in LSCC. View this paper
  • Issues are regarded as officially published after their release is announced to the table of contents alert mailing list.
  • You may sign up for e-mail alerts to receive table of contents of newly released issues.
  • PDF is the official format for papers published in both, html and pdf forms. To view the papers in pdf format, click on the "PDF Full-text" link, and use the free Adobe Reader to open them.
Order results
Result details
Section
Select all
Export citation of selected articles as:
19 pages, 985 KiB  
Review
Non-Coding RNA-Dependent Regulation of Mitochondrial Dynamics in Cancer Pathophysiology
by Maria Eugenia Gallo Cantafio, Roberta Torcasio, Giuseppe Viglietto and Nicola Amodio
Non-Coding RNA 2023, 9(1), 16; https://doi.org/10.3390/ncrna9010016 - 20 Feb 2023
Cited by 6 | Viewed by 3450
Abstract
Mitochondria are essential organelles which dynamically change their shape and number to adapt to various environmental signals in diverse physio-pathological contexts. Mitochondrial dynamics refers to the delicate balance between mitochondrial fission (or fragmentation) and fusion, that plays a pivotal role in maintaining mitochondrial [...] Read more.
Mitochondria are essential organelles which dynamically change their shape and number to adapt to various environmental signals in diverse physio-pathological contexts. Mitochondrial dynamics refers to the delicate balance between mitochondrial fission (or fragmentation) and fusion, that plays a pivotal role in maintaining mitochondrial homeostasis and quality control, impinging on other mitochondrial processes such as metabolism, apoptosis, mitophagy, and autophagy. In this review, we will discuss how dysregulated mitochondrial dynamics can affect different cancer hallmarks, significantly impacting tumor growth, survival, invasion, and chemoresistance. Special emphasis will be given to emerging non-coding RNA molecules targeting the main fusion/fission effectors, acting as novel relevant upstream regulators of the mitochondrial dynamics rheostat in a wide range of tumors. Full article
(This article belongs to the Section Clinical Applications of Non-Coding RNA)
Show Figures

Figure 1

Figure 1
<p>Mitochondrial dynamics machinery. Representative illustration of the mitochondrial fission and fusion events regulated by the main GTPase effector proteins. The fusion of outer mitochondrial membrane is regulated by Mfn1 and Mfn2, whereas the mitochondrial inner membrane fusion, mitochondrial cristae integrity, and remodeling are regulated by Opa1. Drp1 regulates mitochondrial fragmentation by its interaction with the fission receptors MFF, Fis1, MID49, and MID51. A fine balance of fission/fusion processes controls apoptosis, mitochondrial ROS (mtROS) production, autophagy, mitophagy, and mitochondrial metabolic pathways. The picture was created using BioRender software.</p>
Full article ">Figure 2
<p>Graphical overview of miRNAs and long non-coding RNAs regulating mitochondrial dynamics targets. Blunted arrow indicates negative regulation through 3′ UTR targeting, regular arrows indicate positive regulation of the mitochondrial target; dashed lines indicate non-canonical targeting. The picture was created using BioRender software.</p>
Full article ">
15 pages, 2129 KiB  
Article
Transcriptome-Wide Analysis of microRNA–mRNA Correlations in Tissue Identifies microRNA Targeting Determinants
by Juan Manuel Trinidad-Barnech, Rafael Sebastián Fort, Guillermo Trinidad Barnech, Beatriz Garat and María Ana Duhagon
Non-Coding RNA 2023, 9(1), 15; https://doi.org/10.3390/ncrna9010015 - 13 Feb 2023
Viewed by 2486
Abstract
MicroRNAs are small RNAs that regulate gene expression through complementary base pairing with their target mRNAs. A substantial understanding of microRNA target recognition and repression mechanisms has been reached using diverse empirical and bioinformatic approaches, primarily in vitro biochemical or cell culture perturbation [...] Read more.
MicroRNAs are small RNAs that regulate gene expression through complementary base pairing with their target mRNAs. A substantial understanding of microRNA target recognition and repression mechanisms has been reached using diverse empirical and bioinformatic approaches, primarily in vitro biochemical or cell culture perturbation settings. We sought to determine if rules of microRNA target efficacy could be inferred from extensive gene expression data of human tissues. A transcriptome-wide assessment of all the microRNA–mRNA canonical interactions’ efficacy was performed using a normalized Spearman correlation (Z-score) between the abundance of the transcripts in the PRAD-TCGA dataset tissues (RNA-seq mRNAs and small RNA-seq for microRNAs, 546 samples). Using the Z-score of correlation as a surrogate marker of microRNA target efficacy, we confirmed hallmarks of microRNAs, such as repression of their targets, the hierarchy of preference for gene regions (3′UTR > CDS > 5′UTR), and seed length (6 mer < 7 mer < 8 mer), as well as the contribution of the 3′-supplementary pairing at nucleotides 13–16 of the microRNA. Interactions mediated by 6 mer + supplementary showed similar inferred repression as 7 mer sites, suggesting that the 6 mer + supplementary sites may be relevant in vivo. However, aggregated 7 mer-A1 seeds appear more repressive than 7 mer-m8 seeds, while similar when pairing possibilities at the 3′-supplementary sites. We then examined the 3′-supplementary pairing using 39 microRNAs with Z-score-inferred repressive 3′-supplementary interactions. The approach was sensitive to the offset of the bridge between seed and 3′-supplementary pairing sites, and the pattern of offset-associated repression found supports previous findings. The 39 microRNAs with effective repressive 3′supplementary sites show low GC content at positions 13–16. Our study suggests that the transcriptome-wide analysis of microRNA–mRNA correlations may uncover hints of microRNA targeting determinants. Finally, we provide a bioinformatic tool to identify microRNA–mRNA candidate interactions based on the sequence complementarity of the seed and 3′-supplementary regions. Full article
(This article belongs to the Section Small Non-Coding RNA)
Show Figures

Graphical abstract

Graphical abstract
Full article ">Figure 1
<p>Data analysis pipeline.</p>
Full article ">Figure 2
<p>Repression of mRNA–target interactions with different pairing sites. (<b>A</b>) MicroRNA seed (6 mer, 7 mer-A1, 7 mer-m8, and 8 mer) and supplementary pairing sites (positions 13–16 of the microRNA). A in the sequences corresponds to Adenine and B corresponds to the other three nucleotides except for Adenine. (<b>B</b>) Heatmap of the average Z-score correlations between the 143 conserved microRNAs and their predicted target mRNAs using sole seed, discriminating the 5′UTR, CDS, and 3′UTR regions. (<b>C</b>) Circle matrix of the average Z-score correlations between the 143 conserved microRNAs and their predicted target mRNAs using native or random seed + supplementary interactions. Color scale represents the Z-score of microRNA–mRNA correlations while the diameter of the circles represents the log10(<span class="html-italic">p</span>-value) of the comparison between seed + supplementary with the sole seed interactions. −log 10 values of 2, 4, and 6 correspond to <span class="html-italic">p</span>-values of 0.001, 0.0001, and 0.000001, respectively.</p>
Full article ">Figure 3
<p>Contribution of the mRNA bridge length to the microRNA seed + 3′-supplementary site mediated repression. (<b>A</b>) Graphic representation of the architecture of the microRNA–mRNA interaction using 3′pairing. The bridge region is defined as the unpaired nucleotides from the end of the seed to the beginning of the 3′-supplementary region. Since microRNA–mRNA 3′-supplementary interaction occurs at positions 13–16 of the microRNA, 6 mer and 7 mer-m8 seeds have 5 and 4 nt microRNA bridges, respectively; thus, these mRNA bridge lengths mean no loop formation for the respective seeds and are denoted as “zero offset”. Positive offset values imply loop formation in the mRNA and negative offset values in the microRNA. (<b>B</b>) Analysis of bridge length effect on target repression using 3′-supplementary sites (Z-transformed score). The TCGA transcriptomes and the 143 total microRNAs included in this study as a control, the 39 microRNAs with repressive 3′-supplementary interactions using the native sequence and a random sequence (positions 13–16 of the microRNA), and a random group of 39 microRNAs with non-repressive 3′-supplementary sites conserving GC content of the native site. The region of the genes and the type of seeds analyzed are indicated in the left margin. The abscise axis indicates the offset length. The −log10(<span class="html-italic">p</span>-values) of the differences between each seed + suppl length and the respective sole seed interactions are indicated by the color intensity bar. S stands for “seed” and indicates the Z-score of sole seed interactions.</p>
Full article ">Figure 4
<p>Nucleotide composition of the microRNAs with repressive 3′-supplementary interactions. (<b>A</b>) Distribution of GC content along the positions of the microRNAs with the three repressive 3′-supplementary interactions indicated (colored) vs. the whole set of microRNAs analyzed (black). Fisher exact test was performed to compare each of the represented sites with the total 143 microRNAs (● &lt; 0.1, * &lt; 0.05, *** &lt; 0.001). (<b>B</b>–<b>E</b>) Base composition per microRNA nucleotide position. Seed types are represented by colors as indicated in (<b>A</b>) (<b>B</b>: All microRNAs, <b>C</b>: Blue/6 mer 3′UTR, <b>D</b>: Orange/7 mer-m8 3′UTR, and E: Green/6 mer CDS). Horizontal lines represent the ¼ frequency expected for a random nucleotide distribution.</p>
Full article ">
11 pages, 2586 KiB  
Article
LncRNA MALAT1 Regulates Hyperglycemia Induced EMT in Keratinocyte via miR-205
by Liping Zhang, George Chu-Chih Hung, Songmei Meng, Robin Evans and Junwang Xu
Non-Coding RNA 2023, 9(1), 14; https://doi.org/10.3390/ncrna9010014 - 11 Feb 2023
Cited by 3 | Viewed by 2068
Abstract
Epithelial-to-mesenchymal transition (EMT) is critical to cutaneous wound healing. When skin is injured, EMT activates and mobilizes keratinocytes toward the wound bed, therefore enabling re-epithelialization. This process becomes dysregulated in patients with diabetes mellitus (DM). Long non-coding RNAs (lncRNAs) regulate many biological processes. [...] Read more.
Epithelial-to-mesenchymal transition (EMT) is critical to cutaneous wound healing. When skin is injured, EMT activates and mobilizes keratinocytes toward the wound bed, therefore enabling re-epithelialization. This process becomes dysregulated in patients with diabetes mellitus (DM). Long non-coding RNAs (lncRNAs) regulate many biological processes. LncRNA-metastasis-associated lung adenocarcinoma transcript 1 (MALAT1) influences numerous cellular processes, including EMT. The objective of the current study is to explore the role of MALAT1 in hyperglycemia (HG)-induced EMT. The expression of MALAT1 was found to be significantly upregulated, while the expression of miR-205 was downregulated in diabetic wounds and high-glucose-treated HaCaT cells. The initiation of EMT in HaCaT cells from hyperglycemia was confirmed by a morphological change, the increased expression of CDH2, KRT10, and ACTA2, and the downregulation of CDH1. The knockdown of MALAT1 was achieved by transfecting a small interfering RNA (SiRNA). MALAT1 and miR-205 were found to modulate HG-induced EMT. MALAT1 silencing or miR-205 overexpression appears to attenuate hyperglycemia-induced EMT. Mechanistically, MALAT1 affects HG-induced EMT through binding to miR-205 and therefore inducing ZEB1, a critical transcription factor for EMT. In summary, lncRNA MALAT1 is involved in the hyperglycemia-induced EMT of human HaCaT cells. This provides a new perspective on the pathogenesis of diabetic wounds. Full article
(This article belongs to the Special Issue Non-coding RNA in the USA: Latest Advances and Perspectives)
Show Figures

Figure 1

Figure 1
<p>Induction of MALAT1 expression and reduction of miR-205 expression under diabetic condition. (<b>A</b>,<b>B</b>) Real-time qPCR analysis of MALAT1 and miR-205 gene expression in diabetic and non-diabetic mice wounds at day 3 (mean ± SD, n = 7 or 8 per group) after injury. (<b>C</b>,<b>D</b>) Real-time qPCR analysis of MALAT1 and miR-205 gene expression in human diabetic and non-diabetic skin (mean ± SD, n = 5 per group). ** <span class="html-italic">p</span> &lt; 0.01; *** <span class="html-italic">p</span> &lt; 0.001.</p>
Full article ">Figure 2
<p>Hyperglycemia induces MALAT1 and reduces miR-205 gene expression in HaCaT cells. Real-time qPCR analysis of MALAT1 (<b>A</b>) and miR-205 (<b>B</b>) gene expression in the RAW cells treated with high glucose (25 mM D-glucose) for 4 and 24 h (mean ± SD, n = 5 per group). * <span class="html-italic">p</span> &lt; 0.05, ** <span class="html-italic">p</span> &lt; 0.01.</p>
Full article ">Figure 3
<p>Hyperglycemia-induced EMT in HaCaT cells. HaCaT cells were treated with low (5 mM D-glucose) or high glucose (25 mM D-glucose) after overnight serum starvation. RNAs were isolated and the expressions of CDH1 (<b>A</b>), CDH2 (<b>B</b>), ACTA2 (<b>C</b>), KRT10 (<b>D</b>), and MMP9 (<b>E</b>) were determined by real-time qPCR. n = 3; mean ± SD; * <span class="html-italic">p</span> &lt; 0.05, ** <span class="html-italic">p</span> &lt; 0.01 compared with LG-untreated HaCaT cells.</p>
Full article ">Figure 4
<p>Knockdown of MALAT1 attenuates the hyperglycemia-induced EMT in HaCaT cells. HaCaT cells were transfected with MALAT1 SiRNA (Si-MALAT1) or negative control SiRNA (Si-Con) and were treated LG or HG. (<b>A</b>) The expressions of KRT10 were detected by immunofluorescence. (<b>B</b>). Quantitative analysis of number of K10-positive (K10 staining) per 20× field. (<b>C</b>,<b>D</b>). The expression level of EMT-related markers (ACTA2 and KRT10) was detected by RT-qPCR. Comparison was performed between LG, and HG, or HG treated with si-MALAT1. n = 5; mean ± SD; * <span class="html-italic">p</span> &lt; 0.05, ** <span class="html-italic">p</span> &lt; 0.01.</p>
Full article ">Figure 5
<p>Overexpression of miR-205 inhibits the hyperglycemia-induced EMT in HaCaT cells. HaCaT cells were treated with miR-205 mimic or control mimic. RNAs were isolated and the expressions of miR-205 (<b>A</b>), CDH1 (<b>B</b>), CDH2 (<b>C</b>), TAGLN (<b>D</b>), ACTA2 (<b>E</b>), KRT10 (<b>F</b>), ZEB1 (<b>G</b>), MALAT1 (<b>H</b>) and and ZEB1 (<b>I</b>) were determined by RT-qPCR. n = 3; mean ± SD. * <span class="html-italic">p</span> &lt; 0.05, ** <span class="html-italic">p</span> &lt; 0.01.</p>
Full article ">Figure 6
<p>Schematic representation of conclusions drawn from this study showing that MALAT1 regulated the development of EMT in diabetic wounds through the miR-205/ZEB1 pathway.</p>
Full article ">
11 pages, 1302 KiB  
Systematic Review
Circulating MicroRNAs as Specific Biomarkers in Atrial Fibrillation: A Meta-Analysis
by Antônio da Silva Menezes Junior, Lara Cristina Ferreira, Laura Júlia Valentim Barbosa, Daniela de Melo e Silva, Vera Aparecida Saddi and Antonio Márcio Teodoro Cordeiro Silva
Non-Coding RNA 2023, 9(1), 13; https://doi.org/10.3390/ncrna9010013 - 9 Feb 2023
Cited by 12 | Viewed by 2075
Abstract
Atrial fibrillation (AF) is the most frequently occurring supraventricular arrhythmia. Although microRNAs (miRNAs) have been associated with AF pathogenesis, standard protocols for quantifying and selecting specific miRNAs for clinical use as biomarkers should be optimized. In this study, we evaluated the clinical application [...] Read more.
Atrial fibrillation (AF) is the most frequently occurring supraventricular arrhythmia. Although microRNAs (miRNAs) have been associated with AF pathogenesis, standard protocols for quantifying and selecting specific miRNAs for clinical use as biomarkers should be optimized. In this study, we evaluated the clinical application of miRNAs as biomarkers for the prognosis and diagnosis of AF. Literature searches were conducted on PubMed, Cochrane Library, and EMBASE. We included prospective or retrospective observational studies that had been published as of 14 February 2022; our main objective was to analyze the relationship between circulating miRNAs and AF. The data were extracted using the descriptors “Atrial fibrillation AND miRNA”, “Atrial fibrillation AND diagnostic AND miRNA”, and “Atrial fibrillation AND prognosis AND miRNA”. No filters were applied for period delimitation, type of publication, or language. Studies using samples isolated from blood plasma and TaqMan and RT-qPCR for detecting and quantifying miRNAs were selected, and those that used atrial tissue samples were excluded. We identified 272 articles and excluded 102 duplicated articles. Two authors independently read the titles and abstracts of 170 out of 272 articles and selected 56 potential articles, 6 of which were selected for final review. Our analysis revealed a significant association between AF and miR-4798 [OR = 1.90 (95% CI 1.45–2.47)], AF and miRNA-133a [2.77 (2.73–2.82)], AF and miRNA-150 [3.77 (1.50–9.46); I2 = 70%], AF and miRNA-21 [2.23 (1.20–4.17); I2 = 99%], AF and hsa-miRNA4443 [2.32 (2.20–2.44)], and AF and miR-20a-5p [3.67 (1.42–9.49)]. The association between miRNAs and AF showed an OR of 2.51 [95% CI 1.99–3.16; I2 = 99%]. Our meta-analysis demonstrated that circulating miRNAs are potential biomarkers of AF, as they exhibit stable expression post–sample collection. In addition to regulating cellular processes, such as proliferation, differentiation, development, and cell death, miRNAs were found to be linked to arrhythmia development. Full article
(This article belongs to the Section Detection and Biomarkers of Non-Coding RNA)
Show Figures

Figure 1

Figure 1
<p>Flowchart showing the selection, inclusion, and exclusion of articles on circulating microRNAs as specific biomarkers in atrial fibrillation used for the meta-analysis.</p>
Full article ">Figure 2
<p>Association between miRNAs and AF.</p>
Full article ">Figure 3
<p>Risk of bias graph: review of authors’ judgments about each risk of bias item presented as percentages across all included studies.</p>
Full article ">Figure 4
<p>Risk of bias summary: review of authors’ judgments about each risk of bias item for each included study.</p>
Full article ">
22 pages, 1674 KiB  
Review
Functional Relevance of the Long Intergenic Non-Coding RNA Regulator of Reprogramming (Linc-ROR) in Cancer Proliferation, Metastasis, and Drug Resistance
by José A. Peña-Flores, Diego Enríquez-Espinoza, Daniela Muela-Campos, Alexis Álvarez-Ramírez, Angel Sáenz, Andrés A. Barraza-Gómez, Kenia Bravo, Marvin E. Estrada-Macías and Karla González-Alvarado
Non-Coding RNA 2023, 9(1), 12; https://doi.org/10.3390/ncrna9010012 - 31 Jan 2023
Cited by 4 | Viewed by 3291
Abstract
Cancer is responsible for more than 10 million deaths every year. Metastasis and drug resistance lead to a poor survival rate and are a major therapeutic challenge. Substantial evidence demonstrates that an increasing number of long non-coding RNAs are dysregulated in cancer, including [...] Read more.
Cancer is responsible for more than 10 million deaths every year. Metastasis and drug resistance lead to a poor survival rate and are a major therapeutic challenge. Substantial evidence demonstrates that an increasing number of long non-coding RNAs are dysregulated in cancer, including the long intergenic non-coding RNA, regulator of reprogramming (linc-ROR), which mostly exerts its role as an onco-lncRNA acting as a competing endogenous RNA that sequesters micro RNAs. Although the properties of linc-ROR in relation to some cancers have been reviewed in the past, active research appends evidence constantly to a better comprehension of the role of linc-ROR in different stages of cancer. Moreover, the molecular details and some recent papers have been omitted or partially reported, thus the importance of this review aimed to contribute to the up-to-date understanding of linc-ROR and its implication in cancer tumorigenesis, progression, metastasis, and chemoresistance. As the involvement of linc-ROR in cancer is elucidated, an improvement in diagnostic and prognostic tools could promote and advance in targeted and specific therapies in precision oncology. Full article
Show Figures

Figure 1

Figure 1
<p>Overview of the molecular mechanisms by which linc-ROR participates in cancer proliferation and progression.</p>
Full article ">Figure 2
<p>Overview of the molecular landscape by which linc-ROR participates in EMT, cancer invasion and metastasis.</p>
Full article ">Figure 3
<p>Overview of the molecular mechanisms by which linc-ROR participates in cancer drug resistance.</p>
Full article ">
11 pages, 1770 KiB  
Article
miRinGO: Prediction of Biological Processes Indirectly Targeted by Human microRNAs
by Mohammed Sayed and Juw Won Park
Non-Coding RNA 2023, 9(1), 11; https://doi.org/10.3390/ncrna9010011 - 22 Jan 2023
Cited by 4 | Viewed by 2519
Abstract
MicroRNAs (miRNAs) are small non-coding RNAs that are known for their role in the post-transcriptional regulation of target genes. Typically, their functions are predicted by first identifying their target genes and then finding biological processes enriched in these targets. Current tools for miRNA [...] Read more.
MicroRNAs (miRNAs) are small non-coding RNAs that are known for their role in the post-transcriptional regulation of target genes. Typically, their functions are predicted by first identifying their target genes and then finding biological processes enriched in these targets. Current tools for miRNA functional analysis use only genes with physical binding sites as their targets and exclude other genes that are indirectly targeted transcriptionally through transcription factors. Here, we introduce a method to predict gene ontology (GO) annotations indirectly targeted by microRNAs. The proposed method resulted in better performance in predicting known miRNA-GO term associations compared to the canonical approach. To facilitate miRNA GO enrichment analysis, we developed an R Shiny application, miRinGO, that is freely available online at GitHub. Full article
(This article belongs to the Special Issue Methods and Tools in RNA Biology)
Show Figures

Figure 1

Figure 1
<p>miRNAs can indirectly target biological pathways through transcriptions factors.</p>
Full article ">Figure 2
<p>Pipeline of our miRNA GO enrichment analysis tool.</p>
Full article ">Figure 3
<p>Comparison of indirect targeting with direct targeting (** represents <span class="html-italic">p</span>-value &lt; 0.01).</p>
Full article ">Figure 4
<p>Effect of number of miRNA targets on miRNA GO enrichment analysis. Error bars represent one standard error.</p>
Full article ">Figure 5
<p>Comparison of TF density in development-related GO terms vs. all other terms.</p>
Full article ">Figure 6
<p>User interface of miRinGO R shiny application. (<b>A</b>) input parameters; (<b>B</b>) Table with miRNA GO enrichment analysis; (<b>C</b>) Bar plot and word cloud summarizing the top enriched GO terms.</p>
Full article ">
15 pages, 1944 KiB  
Review
Computational Methods to Study DNA:DNA:RNA Triplex Formation by lncRNAs
by Timothy Warwick, Ralf P. Brandes and Matthias S. Leisegang
Non-Coding RNA 2023, 9(1), 10; https://doi.org/10.3390/ncrna9010010 - 21 Jan 2023
Cited by 11 | Viewed by 3741
Abstract
Long non-coding RNAs (lncRNAs) impact cell function via numerous mechanisms. In the nucleus, interactions between lncRNAs and DNA and the consequent formation of non-canonical nucleic acid structures seems to be particularly relevant. Along with interactions between single-stranded RNA (ssRNA) and single-stranded DNA (ssDNA), [...] Read more.
Long non-coding RNAs (lncRNAs) impact cell function via numerous mechanisms. In the nucleus, interactions between lncRNAs and DNA and the consequent formation of non-canonical nucleic acid structures seems to be particularly relevant. Along with interactions between single-stranded RNA (ssRNA) and single-stranded DNA (ssDNA), such as R-loops, ssRNA can also interact with double-stranded DNA (dsDNA) to form DNA:DNA:RNA triplexes. A major challenge in the study of DNA:DNA:RNA triplexes is the identification of the precise RNA component interacting with specific regions of the dsDNA. As this is a crucial step towards understanding lncRNA function, there exist several computational methods designed to predict these sequences. This review summarises the recent progress in the prediction of triplex formation and highlights important DNA:DNA:RNA triplexes. In particular, different prediction tools (Triplexator, LongTarget, TRIPLEXES, Triplex Domain Finder, TriplexFFP, TriplexAligner and Fasim-LongTarget) will be discussed and their use exemplified by selected lncRNAs, whose DNA:DNA:RNA triplex forming potential was validated experimentally. Collectively, these tools revealed that DNA:DNA:RNA triplexes are likely to be numerous and make important contributions to gene expression regulation. Full article
(This article belongs to the Special Issue Methods and Tools in RNA Biology)
Show Figures

Figure 1

Figure 1
<p>Overview of DNA:DNA:RNA triple helix formation (<b>A</b>) Schematic of DNA:DNA:RNA triple helix formation between double-stranded DNA and single-stranded RNA. (<b>B</b>,<b>C</b>) Canonical Watson–Crick and Hoogsteen (red) base pairings which permit the formation of DNA:DNA:RNA triple helices. (<b>D</b>) Putative mechanisms by which DNA:DNA:RNA triple helix formation permits the control of gene expression via interactions with gene loci and transcription factors.</p>
Full article ">Figure 2
<p>Computational tools used to predict the formation of DNA:DNA:RNA triple helices (<b>A</b>) Schematic representing the implementation of <span class="html-italic">Triplexator</span>. <span class="html-italic">Triplexator</span> classifies putative triplex-forming sequences in RNA (triplex-forming oligonucleotides, TFOs) and DNA (triplex target sites, TTSs) sequences prior to predicting potential interactions. <b>(B)</b> Implementation of <span class="html-italic">LongTarget. LongTarget</span> implements observed in vitro DNA:DNA:RNA base triplets to generate candidate triplex-forming RNA sequences. Local alignment is used to classify subsequences of user-input RNA as triplex-forming regions. (<b>C</b>) Workflow of <span class="html-italic">TRIPLEXES</span> and <span class="html-italic">Triplex Domain Finder. TRIPLEXES</span> classifies potential triplex-forming subsequences of input DNA and RNA (DNA-binding domains, DBDs). <span class="html-italic">Triplex Domain Finder</span> detects the statistical enrichment of predicted triplex formation between an input RNA and set of DNA regions versus appropriate background regions. (<b>D</b>) Training of the convolutional neural networks (CNNs) used in <span class="html-italic">TriplexFPP.</span> Known triplex-forming RNAs along with enriched RNA and DNA regions of triplex-sequencing data are used to train classifiers of triplex-forming RNA or DNA. (<b>E</b>) The development of <span class="html-italic">TriplexAligner. TriplexAligner</span> implements probabilistic RNA–DNA base pairings learned by expectation–maximisation (EM) from enriched triplexRNA and triplexDNA motifs detected in triplex-sequencing data as scoring matrices in local alignment between RNA and DNA sequences. Results are stratified using Karlin–Altschul statistics. (<b>F</b>) The workflow of <span class="html-italic">Fasim-LongTarget</span>, which enhances the computational performance of <span class="html-italic">LongTarget</span> through the use of SIMD (single instruction, multiple data) parallel processing of local alignments.</p>
Full article ">Figure 3
<p>DNA:DNA:RNA triplex interactions and their proposed mechanisms of action (<b>A</b>) Triplex formation in <span class="html-italic">cis</span> by the lncRNA <span class="html-italic">KHPS1.</span> Through interactions with the transcription factors p300/CBP and E2F1, <span class="html-italic">KHPS1</span> enhances the transcription <span class="html-italic">SPHK1</span>. (<b>B</b>) Binding of the antisense lncRNA PARTICLE at the promoter of its sense gene. The transcription of the gene <span class="html-italic">MAT2A</span> is downregulated by <span class="html-italic">PARTICLE</span>-associated transcription factors. (<b>C</b>) Triplex formation by <span class="html-italic">MEG3</span> at a distal enhancer of the gene <span class="html-italic">TGFBR1</span>. This leads to the downregulation of gene expression, potentially via the actions of the polycomb repressive complex 2 (PRC2) complex which interacts with the <span class="html-italic">MEG3</span> transcript. (<b>D</b>) Formation of a DNA:DNA:RNA triple helix at the promoter of <span class="html-italic">IFNB1</span> by the lncRNA <span class="html-italic">lnc-MxA</span> upon viral infection. This results in the interruption of the binding of the transcription factors p65 and LSD1 to the region, thereby preventing upregulation of the target gene. (<b>E</b>) Association between <span class="html-italic">REG1CP</span> and the DNA helicase FANCJ at a distal promoter site of <span class="html-italic">REG3B</span>. This interaction permits DNA unwinding and gene upregulation by the glucocorticoid receptor. (<b>F</b>) Triplex formation by lncRNA <span class="html-italic">Fendrr</span>. Through interactions with the chromatin modifiers PRC2 and MLL, <span class="html-italic">Fendrr</span> facilitates the decoration of target genes such as <span class="html-italic">Foxf1</span> with repressive marks H3K27me3 and H3K4me3. This leads to the repression of <span class="html-italic">Fendrr</span> target genes. (<b>G</b>) Binding of the lncRNA <span class="html-italic">KCNQ1OT1</span> in conjunction with its protein interaction partners HP1 and DNMT leads to genome-wide repression of transposable element transcription via H3K9me3 decoration and DNA methylation. (<b>H</b>) The lncRNA <span class="html-italic">SARRAH</span> forms DNA:DNA:RNA triple helices at multiple loci. It activates transcription via recruitment of the transcription factors p300 and CRIP2, which deposit H3K27ac at target loci. (<b>I</b>) DNA:DNA:RNA triplex formation by the lncRNA HIF1α-AS1 at specific gene loci represses target gene transcription by the recruitment of members of the HUSH complex. This leads to the formation of repressive chromatin at target loci and results in the downregulation of target genes such as <span class="html-italic">EPHA2</span> and <span class="html-italic">ADM</span>.</p>
Full article ">
25 pages, 1139 KiB  
Systematic Review
Diagnostic and Prognostic Value of microRNAs in Patients with Laryngeal Cancer: A Systematic Review
by Elisabetta Broseghini, Daria Maria Filippini, Laura Fabbri, Roberta Leonardi, Andi Abeshi, Davide Dal Molin, Matteo Fermi, Manuela Ferracin and Ignacio Javier Fernandez
Non-Coding RNA 2023, 9(1), 9; https://doi.org/10.3390/ncrna9010009 - 19 Jan 2023
Cited by 4 | Viewed by 3088
Abstract
Laryngeal squamous cell cancer (LSCC) is one of the most common malignant tumors of the head and neck region, with a poor survival rate (5-year overall survival 50–80%) as a consequence of an advanced-stage diagnosis and high recurrence rate. Tobacco smoking and alcohol [...] Read more.
Laryngeal squamous cell cancer (LSCC) is one of the most common malignant tumors of the head and neck region, with a poor survival rate (5-year overall survival 50–80%) as a consequence of an advanced-stage diagnosis and high recurrence rate. Tobacco smoking and alcohol abuse are the main risk factors of LSCC development. An early diagnosis of LSCC, a prompt detection of recurrence and a more precise monitoring of the efficacy of different treatment modalities are currently needed to reduce the mortality. Therefore, the identification of effective diagnostic and prognostic biomarkers for LSCC is crucial to guide disease management and improve clinical outcomes. In the past years, a dysregulated expression of small non-coding RNAs, including microRNAs (miRNAs), has been reported in many human cancers, including LSCC, and many miRNAs have been explored for their diagnostic and prognostic potential and proposed as biomarkers. We searched electronic databases for original papers that were focused on miRNAs and LSCC, using the Preferred Reporting Items for Systematic Reviews and Meta-Analyses (PRISMA) protocol. According to the outcome, 566 articles were initially screened, of which 177 studies were selected and included in the analysis. In this systematic review, we provide an overview of the current literature on the function and the potential diagnostic and prognostic role of tissue and circulating miRNAs in LSCC. Full article
(This article belongs to the Special Issue Women’s Special Issue Series: Noncoding RNAs and Diseases)
Show Figures

Graphical abstract

Graphical abstract
Full article ">Figure 1
<p>Flow chart showing the steps of the systematic review of the literature. Of 566 papers, 177 original papers were selected in this systematic review. For functional analysis, a further screening was performed and 59 original papers were obtained.</p>
Full article ">
2 pages, 169 KiB  
Editorial
Acknowledgment to the Reviewers of Non-Coding RNA in 2022
by Non-Coding RNA Editorial Office
Non-Coding RNA 2023, 9(1), 8; https://doi.org/10.3390/ncrna9010008 - 13 Jan 2023
Viewed by 1190
Abstract
High-quality academic publishing is built on rigorous peer review [...] Full article
17 pages, 14020 KiB  
Article
A Novel Cis-Regulatory lncRNA, Kalnc2, Downregulates Kalrn Protein-Coding Transcripts in Mouse Neuronal Cells
by Muneesh Pal, Divya Chaubey, Mohit Tanwar and Beena Pillai
Non-Coding RNA 2023, 9(1), 7; https://doi.org/10.3390/ncrna9010007 - 13 Jan 2023
Cited by 1 | Viewed by 2751
Abstract
The KALRN gene encodes several multi-domain protein isoforms that localize to neuronal synapses, conferring the ability to grow and retract dendritic spines and shaping axonal outgrowth, dendrite morphology, and dendritic spine re-modeling. The KALRN genomic locus is implicated in several neurodevelopmental and neuropsychiatric [...] Read more.
The KALRN gene encodes several multi-domain protein isoforms that localize to neuronal synapses, conferring the ability to grow and retract dendritic spines and shaping axonal outgrowth, dendrite morphology, and dendritic spine re-modeling. The KALRN genomic locus is implicated in several neurodevelopmental and neuropsychiatric diseases, including autism, schizophrenia, bipolar disease, and intellectual disability. We have previously shown that a novel brain-specific long non-coding RNA (lncRNA) arising from the 5′ end of the kalrna gene, called durga, regulates neuronal morphology in zebrafish. Here, we characterized mammalian Kalrn loci, annotating and experimentally validating multiple novel non-coding RNAs, including linear and circular variants. Comparing the mouse and human loci, we show that certain non-coding RNAs and Kalrn protein-coding isoforms arising from the locus show similar expression dynamics during development. In humans, mice, and zebrafish, the 5′ end of the Kalrn locus gives rise to a chromatin-associated lncRNA that is present in adult ovaries, besides being expressed during brain development and enriched in certain regions of the adult brain. Ectopic expression of this lncRNA led to the downregulation of all the major Kalrn mRNA isoforms. We propose that this lncRNA arising from the 5′ end of the Kalrn locus is functionally the mammalian ortholog of zebrafish lncRNA durga. Full article
(This article belongs to the Section Long Non-Coding RNA)
Show Figures

Figure 1

Figure 1
<p>Schematic illustration and coding potential prediction of mouse <span class="html-italic">Kalrn</span> gene locus noncoding transcripts. (<b>A</b>) A schematic illustration of mouse <span class="html-italic">Kalrn</span> long noncoding transcripts (lncRNAs) was made according to the Ensembl database; blue: coding transcripts, green: processed transcripts, red: retained introns, black: circular RNA. Noncoding (NC) transcripts were named in the 5′ end (corresponding to the quantitatively major 5′ end called ‘C’) to 3′ end direction from <span class="html-italic">Kalnc1</span> to <span class="html-italic">Kalnc7</span>. (<b>B</b>) Coding potential was measured by CPAT software [<a href="#B26-ncrna-09-00007" class="html-bibr">26</a>]. Transcript flags, or transcript support level (TSL), are a method to highlight the well-supported and poorly-supported transcript models. The method relies on the primary data that can support full-length transcript structure: mRNA and EST alignment supplied by UCSC and Ensembl. TSL1—all splice junctions of the transcript are supported by at least one non-suspect mRNA. TSL2—the best supporting mRNA is flagged as the suspect, or the support is from multiple ESTs; TSL3—the only support is from a single EST; TSL4—the best supporting EST is flagged as the suspect; and TSL5—no single transcript supports the model structure. (<b>C</b>) Nuclear/cytoplasmic localization of <span class="html-italic">Kalnc1</span>, <span class="html-italic">3</span>, <span class="html-italic">4</span>, <span class="html-italic">6</span> and <span class="html-italic">7</span>. NRT; “No reverse transcriptase” control to rule out trace DNA contamination.</p>
Full article ">Figure 1 Cont.
<p>Schematic illustration and coding potential prediction of mouse <span class="html-italic">Kalrn</span> gene locus noncoding transcripts. (<b>A</b>) A schematic illustration of mouse <span class="html-italic">Kalrn</span> long noncoding transcripts (lncRNAs) was made according to the Ensembl database; blue: coding transcripts, green: processed transcripts, red: retained introns, black: circular RNA. Noncoding (NC) transcripts were named in the 5′ end (corresponding to the quantitatively major 5′ end called ‘C’) to 3′ end direction from <span class="html-italic">Kalnc1</span> to <span class="html-italic">Kalnc7</span>. (<b>B</b>) Coding potential was measured by CPAT software [<a href="#B26-ncrna-09-00007" class="html-bibr">26</a>]. Transcript flags, or transcript support level (TSL), are a method to highlight the well-supported and poorly-supported transcript models. The method relies on the primary data that can support full-length transcript structure: mRNA and EST alignment supplied by UCSC and Ensembl. TSL1—all splice junctions of the transcript are supported by at least one non-suspect mRNA. TSL2—the best supporting mRNA is flagged as the suspect, or the support is from multiple ESTs; TSL3—the only support is from a single EST; TSL4—the best supporting EST is flagged as the suspect; and TSL5—no single transcript supports the model structure. (<b>C</b>) Nuclear/cytoplasmic localization of <span class="html-italic">Kalnc1</span>, <span class="html-italic">3</span>, <span class="html-italic">4</span>, <span class="html-italic">6</span> and <span class="html-italic">7</span>. NRT; “No reverse transcriptase” control to rule out trace DNA contamination.</p>
Full article ">Figure 2
<p><span class="html-italic">Kalrn</span> locus lncRNAs are brain-enriched. (<b>A</b>) Representative images of endpoint RT-PCR showing expression of <span class="html-italic">Kalrn</span> loclncRNAs: <span class="html-italic">Kalnc1</span> (155 bps), <span class="html-italic">Kalnc2</span> (131 bps), <span class="html-italic">Kalnc3</span> (112 bps), <span class="html-italic">Kalnc4</span> (376 bps), <span class="html-italic">Kalnc5</span> (142 bps), <span class="html-italic">Kalnc6</span> (138 bps), <span class="html-italic">Kalnc7</span> (295 bps); pan <span class="html-italic">Kalrn</span> (157 bps), <span class="html-italic">mmu_circ_0000686</span> (217 bps), and <span class="html-italic">Gapdh</span> (75 bps) in (<b>a</b>–<b>j</b>) respectively in the whole brain, cerebrum, cerebellum, spinal cord, ovary, liver, and heart. (<b>B</b>) Schematic illustration of the circular RNA mmu_circ_0000686 at mouse <span class="html-italic">Kalrn</span> locus. (<b>C</b>) Relative expression of <span class="html-italic">Kalrn</span> locus lncRNAs was measured in mouse cortex and hippocampus at different time points (P1, P3, P5, P18, P21, 1 M, and 4 M) by qRT-PCR. (Data are shown as mean (SD), <span class="html-italic">N</span> = 3 biological replicates; <span class="html-italic">n</span> = 3 technical replicates). (<b>D</b>) A heatmap of mouse datasets associated with schizophrenia (black label), addiction (orange label), epilepsy (blue label), and autism (magenta label). Each row represents protein-coding (top panel) or non-coding (bottom panel) transcripts arising from the <span class="html-italic">Kalrn</span> locus. Labels include ID of GEO datasets.</p>
Full article ">Figure 3
<p><span class="html-italic">Kalnc2</span> is enriched in the nuclear fraction. (<b>A</b>–<b>C</b>) <span class="html-italic">Kalnc2</span> expression was measured along with <span class="html-italic">Gapdh</span> (a cytoplasmic marker) and <span class="html-italic">Malat1</span> (a nuclear marker) in cellular fractions at (<b>A</b>) DIV0 (days in vitro culture), (<b>B</b>) DIV15 primary cortical neurons, and (<b>C</b>) N2A cells by qRT-PCR. (<b>D</b>) Endpoint PCR of <span class="html-italic">Kalnc2</span> in cellular fractions of N2A (Neuro2A) cells and primary cortical neurons. NRT (No reverse transcriptase control), NTC (No template control), and DIV (Days of in vitro culture). (Data are shown as mean ± SD; <span class="html-italic">N</span> = 3 biological replicates; <span class="html-italic">n</span> = 3 technical replicates; <span class="html-italic">t</span>-test, ** <span class="html-italic">p</span> &lt; 0.01; *** <span class="html-italic">p</span> &lt; 0.001).</p>
Full article ">Figure 4
<p><span class="html-italic">Kalnc2</span> expression is similar to that of Kal9 and Kal12, but opposite to Kal7. (<b>A</b>–<b>G</b>) Bright field images of mouse neural stem cell differentiation and maturation in neurons. (<b>A</b>) DIV0, (<b>B</b>) DIV3, (<b>C</b>) DIV7, (<b>D</b>) DIV11, (<b>E</b>) DIV15, (<b>F</b>) DIV21, and (<b>G</b>) DIV28; scale bare 100 µm. (<b>H</b>) Endpoint PCR for <span class="html-italic">Kalnc2</span> (110 bps) and <span class="html-italic">Kalrn</span> major coding transcripts: Kal7 (127 bps), Kal9 (125 bp) and Kal12 (140 bps) at different DIVs (DIV0, DIV3, DIV11, DIV15, DIV21 and DIV28). (<b>I</b>–<b>L</b>) Kal7, Kal9, Kal12, and <span class="html-italic">Kalnc2</span> expressions were measured at DIV0, DIV3, DIV11, DIV15, and DIV21. DIV (Days of in vitro culture). (Data are shown as mean ± SD; <span class="html-italic">N</span> = 3 biological replicates; <span class="html-italic">n</span> = 3 technical replicates; <span class="html-italic">t</span>-test, * <span class="html-italic">p</span> &lt; 0.05; ** <span class="html-italic">p</span> &lt; 0.01; *** <span class="html-italic">p</span> &lt; 0.001).</p>
Full article ">Figure 5
<p>The expression of circular RNA decreases, as cortical neurons mature. (<b>A</b>,<b>B</b>) Circular RNA expression was measured at DIV0, DIV3, DIV7, DIV11, DIV15, and DIV21 with respect to <span class="html-italic">Gapdh</span> by quantitative RT-PCR. DIV (days of in vitro culture). (Data are shown as mean ± SD; <span class="html-italic">N</span> = 3 biological replicates; <span class="html-italic">n</span> = 3 technical replicates; <span class="html-italic">t</span>-test, * <span class="html-italic">p</span> &lt; 0.05).</p>
Full article ">Figure 6
<p><span class="html-italic">hsKALNC2</span> is exclusively expressed in brain tissues. (<b>A</b>) Expression of <span class="html-italic">KALNC2</span> (119 bp) and <span class="html-italic">KALRN</span> (238 bp) in human tissue RNA panel, available commercially (<b>B</b>) Subcellular fractionation of SH-SY5Y cells using <span class="html-italic">RNA18S, MALAT1</span>, and <span class="html-italic">RNA45S</span> as cytoplasmic, nucleoplasmic, and chromatin markers, respectively. (<b>C</b>) Expression of <span class="html-italic">KALNC2</span> and <span class="html-italic">KALRN</span> in SH-SY5Y cells normalized to <span class="html-italic">GAPDH</span> expression. (Data are shown as mean ± SD; <span class="html-italic">N</span> = 3 biological replicates; <span class="html-italic">n</span> = 3 technical replicates; <span class="html-italic">t</span>-test, * <span class="html-italic">p</span> &lt; 0.05; ** <span class="html-italic">p</span> &lt; 0.01; *** <span class="html-italic">p</span> &lt; 0.001).</p>
Full article ">Figure 7
<p><span class="html-italic">Kalnc2</span> overexpression in N2A cells downregulates major <span class="html-italic">Kalrn</span> transcript expression. (<b>A</b>,<b>C</b>) A schematic of a bidirectional promoter plasmid containing <span class="html-italic">Kalnc2</span> and an RFP tag. (<b>B</b>,<b>D</b>) <span class="html-italic">Kalnc2</span> sense and antisense overexpressed RFP-positive cells, respectively. (<b>E</b>–<b>H</b>) Expression of <span class="html-italic">Kalnc2</span>, Kal7, Kal9, and Kal12, respectively, normalized by <span class="html-italic">Gapdh</span> in sense and antisense conditions (Data are shown as mean ± SD; <span class="html-italic">N</span> = 3 biological replicates; <span class="html-italic">n</span> = 3 technical replicates; <span class="html-italic">t</span>-test, * <span class="html-italic">p</span> &lt; 0.05).</p>
Full article ">Figure 7 Cont.
<p><span class="html-italic">Kalnc2</span> overexpression in N2A cells downregulates major <span class="html-italic">Kalrn</span> transcript expression. (<b>A</b>,<b>C</b>) A schematic of a bidirectional promoter plasmid containing <span class="html-italic">Kalnc2</span> and an RFP tag. (<b>B</b>,<b>D</b>) <span class="html-italic">Kalnc2</span> sense and antisense overexpressed RFP-positive cells, respectively. (<b>E</b>–<b>H</b>) Expression of <span class="html-italic">Kalnc2</span>, Kal7, Kal9, and Kal12, respectively, normalized by <span class="html-italic">Gapdh</span> in sense and antisense conditions (Data are shown as mean ± SD; <span class="html-italic">N</span> = 3 biological replicates; <span class="html-italic">n</span> = 3 technical replicates; <span class="html-italic">t</span>-test, * <span class="html-italic">p</span> &lt; 0.05).</p>
Full article ">
11 pages, 2279 KiB  
Communication
Long Non-Coding RNA Expression in Alpha-1 Antitrypsin Deficient Monocytes Pre- and Post-AAT Augmentation Therapy
by Stephen G. J. Smith and Catherine M. Greene
Non-Coding RNA 2023, 9(1), 6; https://doi.org/10.3390/ncrna9010006 - 10 Jan 2023
Cited by 2 | Viewed by 1673
Abstract
Long non-coding RNAs (lncRNAs) regulate gene expression. Their expression in alpha-1 antitrypsin (AAT) deficiency has not been investigated. Treatment of AAT deficiency involves infusion of plasma-purified AAT and this augmentation therapy has previously been shown to alter microRNA expression in monocytes of AAT-deficient [...] Read more.
Long non-coding RNAs (lncRNAs) regulate gene expression. Their expression in alpha-1 antitrypsin (AAT) deficiency has not been investigated. Treatment of AAT deficiency involves infusion of plasma-purified AAT and this augmentation therapy has previously been shown to alter microRNA expression in monocytes of AAT-deficient (ZZ) individuals. Here, we assess the effect of AAT augmentation therapy on the lncRNA expression profile in ZZ monocytes. Peripheral blood monocytes were isolated from ZZ individuals pre (Day 0)- and post (Day 2)-AAT augmentation therapy. Arraystar lncRNA microarray profiling was performed; a total of 17,761 lncRNAs were detectable across all samples. The array identified 7509 lncRNAs with differential expression post-augmentation therapy, 3084 were increased and 4425 were decreased (fold change ≥ 2). Expression of many of these lncRNAs were similarly altered in ZZ monocytes treated ex vivo with 27.5 μM AAT for 4 h. These properties may contribute to the manifold effects of AAT augmentation therapy. Full article
(This article belongs to the Special Issue Women’s Special Issue Series: Noncoding RNAs and Diseases)
Show Figures

Figure 1

Figure 1
<p>Ten most highly up- and downregulated lncRNAs in monocytes of AAT-deficient patients receiving AAT therapy versus monocytes of AAT-deficient patients not receiving AAT therapy.</p>
Full article ">Figure 2
<p>Scatter plots of lncRNA expression variation between (<b>A</b>) ZZ monocytes isolated 48 h post-AAT augmentation therapy (Day 2, Y axis) array and ZZ monocytes from untreated individuals (Day 0, X axis), and (<b>B</b>) ZZ monocytes treated ex vivo with 27.5 μM AAT for 4 h (ZZ_AAT, Y axis) and untreated control ZZ monocytes (ZZ_Ctrl, X axis). The outer green lines represent ±2.0 fold difference between the two compared samples.</p>
Full article ">Figure 2 Cont.
<p>Scatter plots of lncRNA expression variation between (<b>A</b>) ZZ monocytes isolated 48 h post-AAT augmentation therapy (Day 2, Y axis) array and ZZ monocytes from untreated individuals (Day 0, X axis), and (<b>B</b>) ZZ monocytes treated ex vivo with 27.5 μM AAT for 4 h (ZZ_AAT, Y axis) and untreated control ZZ monocytes (ZZ_Ctrl, X axis). The outer green lines represent ±2.0 fold difference between the two compared samples.</p>
Full article ">Figure 3
<p>Ten most highly up- and downregulated lncRNAs in AAT-deficient monocytes treated ex vivo with AAT versus those not treated ex vivo with AAT.</p>
Full article ">Figure 4
<p>Venn diagram of in vivo and ex vivo differentially expressed lncRNAs. (<b>A</b>) Upregulated and (<b>B</b>) downregulated lncRNAs in ZZ monocytes isolated 48 h post-AAT augmentation therapy (In vivo) and ZZ monocytes treated ex vivo with 27.5 μM AAT for 4 h (Ex vivo).</p>
Full article ">Figure 5
<p>Dot plots of the gene ratio values of the top 10 pathway identifiers used in KEGG. (<b>A</b>,<b>B</b>) Upregulated and (<b>C</b>,<b>D</b>) downregulated pathways in ZZ monocytes isolated 48 h post-AAT augmentation therapy (<b>A</b>,<b>C</b>) and ZZ monocytes treated ex vivo with 27.5 μM AAT for 4 h (<b>B</b>,<b>D</b>).</p>
Full article ">
17 pages, 3328 KiB  
Article
Epigenetic Regulation of HIV-1 Sense and Antisense Transcription in Response to Latency-Reversing Agents
by Rui Li, Isabella Caico, Ziyan Xu, Mohammad Shameel Iqbal and Fabio Romerio
Non-Coding RNA 2023, 9(1), 5; https://doi.org/10.3390/ncrna9010005 - 10 Jan 2023
Cited by 6 | Viewed by 2769
Abstract
Nucleosomes positioned on the HIV-1 5′ long terminal repeat (LTR) regulate sense transcription as well as the establishment and maintenance of latency. A negative-sense promoter (NSP) in the 3′ LTR expresses antisense transcripts with coding and non-coding activities. Previous studies identified cis-acting [...] Read more.
Nucleosomes positioned on the HIV-1 5′ long terminal repeat (LTR) regulate sense transcription as well as the establishment and maintenance of latency. A negative-sense promoter (NSP) in the 3′ LTR expresses antisense transcripts with coding and non-coding activities. Previous studies identified cis-acting elements that modulate NSP activity. Here, we used the two chronically infected T cell lines, ACH-2 and J1.1, to investigate epigenetic regulation of NSP activity. We found that histones H3 and H4 are present on the 3′ LTR in both cell lines. Following treatment with histone deacetylase inhibitors (HDACi), the levels of H3K27Ac increased and histone occupancy declined. HDACi treatment also led to increased levels of RNA polymerase II (RNPII) at NSP, and antisense transcription was induced with similar kinetics and to a similar extent as 5′ LTR-driven sense transcription. We also detected H3K9me2 and H3K27me3 on NSP, along with the enzymes responsible for these epigenetic marks, namely G9a and EZH2, respectively. Treatment with their respective inhibitors had little or no effect on RNPII occupancy at the two LTRs, but it induced both sense and antisense transcription. Moreover, the increased expression of antisense transcripts in response to treatment with a panel of eleven latency-reversing agents closely paralleled and was often greater than the effect on sense transcripts. Thus, HIV-1 sense and antisense RNA expression are both regulated via acetylation and methylation of lysine 9 and 27 on histone H3. Since HIV-1 antisense transcripts act as non-coding RNAs promoting epigenetic silencing of the 5′ LTR, our results suggest that the limited efficacy of latency-reversing agents in the context of ‘shock and kill’ cure strategies may be due to concurrent induction of antisense transcripts thwarting their effect on sense transcription. Full article
Show Figures

Figure 1

Figure 1
<p>Presence of a nucleosome on the U3 region of the HIV-1 3′ LTR. (<b>A</b>) Schematic representation of the HIV-1 5′ and 3′ LTR showing the location of the three primer sets to assess the presence of histones H3 and H4 (total levels and modified residues) in ChIP assays; (<b>B</b>–<b>E</b>) Detection of histones H3 and H4 at Nuc-0, Nuc-1, nef-3LTR and GAPDH in ACH-2 (<b>B</b>,<b>C</b>) and in J1.1 (<b>D</b>,<b>E</b>) cells in DMSO− and SAHA−treated cells (open and black bars, respectively). Data show average and standard deviation (SD) of 2–4 independent experiments. To determine statistically significant differences, data were analyzed with Student’s <span class="html-italic">t</span>-test (unpaired, non-parametric). *, <span class="html-italic">p</span> &lt; 0.05; **, <span class="html-italic">p</span> &lt; 0.005; ns, not significant.</p>
Full article ">Figure 2
<p>Acetylation of lysine 9 and 27 on histone H3 at the HIV-1 3′ LTR. Detection of histone H3 acetylated at lysine 9 (H3K9Ac; (<b>A</b>,<b>D</b>)) and lysine 27 (H3K27Ac; (<b>B</b>,<b>E</b>)) at Nuc-0, Nuc-1, and 3′ LTR (nef-3LTR) in untreated and SAHA-treated (open and black bars, respectively) ACH-2 and J1.1 cells (top and bottom panels, respectively). Presence of histone deacetylase 1 (HDAC1) at Nuc-0, Nuc-1, and 3′ LTR (nef-3LTR) in DMSO- and SAHA-treated (open and black bars, respectively) ACH-2 and J1.1 cells ((<b>C</b>) and (<b>F</b>), respectively). Data show average and standard deviation (SD) of 2–4 independent experiments. To determine statistically significant differences, data were analyzed with Student’s <span class="html-italic">t</span>-test (unpaired, non-parametric). *, <span class="html-italic">p</span> &lt; 0.05; **, <span class="html-italic">p</span> &lt; 0.005; ***, <span class="html-italic">p</span> &lt; 0.0005; ns, not significant.</p>
Full article ">Figure 3
<p>Dimethylation of lysine 9 on histone H3 at the 5′ and 3′ LTRs. (<b>A,C</b>) Detection of H3K9me2 at Nuc-0, Nuc-1, and 3′ LTR (nef-3LTR) in untreated and BIX-01294-treated (open and black bars, respectively) ACH-2 and J1.1 cells (top and bottom panels, respectively). (<b>B</b>,<b>D</b>) Presence of histone methyltransferase, G9a at Nuc-0, Nuc-1, and 3′ LTR (nef-3LTR) in DMSO- and SAHA-treated (open and black bars, respectively) ACH-2 and J1.1 cells (top and bottom panels, respectively). Data show average and standard deviation (SD) of 2–4 independent experiments. To determine statistically significant differences, data were analyzed with Student’s <span class="html-italic">t</span>-test (unpaired, non-parametric). *, <span class="html-italic">p</span> &lt; 0.05; ns, not significant.</p>
Full article ">Figure 4
<p>Trimethylation of lysine 27 on histone H3 at the 5′ and 3′ LTRs. (<b>A</b>,<b>C</b>) Detection of H3K27me3 at Nuc-0, Nuc-1, and 3′ LTR (nef-3LTR) in untreated and EPZ-6438-treated (open and black bars, respectively) ACH-2 and J1.1 cells (top and bottom panels, respectively). (<b>B</b>,<b>D</b>) Presence of histone methyltransferase, EZH2 at Nuc-0, Nuc-1, and 3′ LTR (nef-3LTR) in DMSO- and SAHA-treated (open and black bars, respectively) ACH-2 and J1.1 cells (top and bottom panels, respectively). Data show average and standard deviation (SD) of 2–4 independent experiments. To determine statistically significant differences, data were analyzed with Student’s <span class="html-italic">t</span>-test (unpaired, non-parametric). *, <span class="html-italic">p</span> &lt; 0.05; ns, not significant.</p>
Full article ">Figure 5
<p>Recruitment of RNPII at Nuc-0, Nuc-1 and 3′LTR (nef-3LTR) following treatment with SAHA (<b>A</b>,<b>D</b>), BIX-01294 (<b>B</b>,<b>E</b>), and EPZ-6438 (<b>C</b>,<b>F</b>) in ACH-2 and J1.1 cells (top and bottom panels, respectively). DMSO- and inhibitor-treated samples are shown with open and black bars, respectively. Data show average and standard deviation (SD) of 2–4 independent experiments. To determine statistically significant differences, data were analyzed with Student’s <span class="html-italic">t</span>-test (unpaired, non-parametric). *, <span class="html-italic">p</span> &lt; 0.05; ns, not significant.</p>
Full article ">Figure 6
<p>Time course of 5′ LTR-driven (open bars) and 3′ LTR-driven (black bars) transcription in ACH-2 (<b>A</b>) and J1.1 cells (<b>B</b>) following treatment with HDACi. Cells were treated with SAHA and sampled at multiple time points over 24 h. Sense and antisense RNA levels were measured by strand-specific RT-qPCR and expressed as fold induction over the levels at 0 h post-stimulation. Data show average and standard deviation (SD) of 2–4 independent experiments.</p>
Full article ">Figure 7
<p>Induction of sense and antisense HIV-1 transcription in ACH-2 (<b>A</b>) and J1.1 cells (<b>B</b>) following treatment with multiple LRAs. Cells were treated with 11 different compounds at three different concentrations for 24 h (except for BIX-01294 and EPZ-6438, which were used for 3 days). As positive controls we used PMA. Sense and antisense RNA levels were measured by strand-specific RT-qPCR and expressed as fold induction over DMSO-treated controls. Data show average and standard deviation (SD) of 2–4 independent experiments. The black horizontal dotted line indicates the 2-fold induction threshold over mock-treated samples. The red vertical dotted lines separate treatment with increasing doses of each LRA. Prostr, prostratin; AZD, AZD5582; 5-Aza, 5-Azacytidine; Pano, Panobinostat; VPA, valproic acid; TSA, trichostatin A; BIX, BIX-01294; EPZ, EPZ-6438.</p>
Full article ">
18 pages, 1819 KiB  
Article
Deciphering the Role of microRNA Mediated Regulation of Coronin 1C in Glioblastoma Development and Metastasis
by Denis Mustafov, Emmanouil Karteris and Maria Braoudaki
Non-Coding RNA 2023, 9(1), 4; https://doi.org/10.3390/ncrna9010004 - 4 Jan 2023
Cited by 4 | Viewed by 3121
Abstract
Glioblastoma multiforme (GBM) is a highly heterogenic and malignant brain tumour with a median survival of 15 months. The initial identification of primary glioblastomas is often challenging. Coronin 1C (CORO1C) is a key player in actin rearrangement and cofilin dynamics, as well as [...] Read more.
Glioblastoma multiforme (GBM) is a highly heterogenic and malignant brain tumour with a median survival of 15 months. The initial identification of primary glioblastomas is often challenging. Coronin 1C (CORO1C) is a key player in actin rearrangement and cofilin dynamics, as well as enhancing the processes of neurite overgrowth and migration of brain tumour cells. Different bioinformatic databases were accessed to measure CORO1C expression at the mRNA and protein level in normal and malignant brains. CORO1C expression was observed in brain regions which have retained high synaptic plasticity and myelination properties. CORO1C was also expressed mainly within the hippocampus formation, including the Cornu Ammonis (CA) fields: CA1–CA4. Higher expression was also noticed in paediatric GBM in comparison to their adult counterparts. Pediatric cell populations were observed to have an increased log2 expression of CORO1C. Furthermore, 62 miRNAs were found to target the CORO1C gene. Of these, hsa-miR-34a-5p, hsa-miR-512-3p, hsa-miR-136-5p, hsa-miR-206, hsa-miR-128-3p, and hsa-miR-21-5p have shown to act as tumour suppressors or oncomiRs in different neoplasms, including GBM. The elevated expression of CORO1C in high grade metastatic brain malignancies, including GBM, suggests that this protein could have a clinical utility as a biomarker linked to an unfavorable outcome. Full article
(This article belongs to the Topic MicroRNA: Mechanisms of Action, Physio-Pathological Implications, and Disease Biomarkers)
(This article belongs to the Section Small Non-Coding RNA)
Show Figures

Graphical abstract

Graphical abstract
Full article ">Figure 1
<p>Detection of <span class="html-italic">CORO1C</span> mRNA across normal tissue types and brain [<a href="#B28-ncrna-09-00004" class="html-bibr">28</a>,<a href="#B29-ncrna-09-00004" class="html-bibr">29</a>]. (<b>a</b>) The Human Protein Atlas database was incorporated to examine the detection of <span class="html-italic">CORO1C</span> mRNA expression within different tissue types. Higher expression was observed within smooth muscle tissue, endometrium, urinary bladder, adipose, and lung tissues. (<b>b</b>) The average distribution of <span class="html-italic">CORO1C</span> mRNA throughout the brain demonstrated that the protein was highly expressed in the white matter, medulla oblongata, and hippocampal formation regions of the brain. (<b>c</b>) Single-cell cluster analysis obtained from normal brain tissue demonstrated high expression of <span class="html-italic">CORO1C</span> amongst neuronal cells, oligodendrocytes, oligodendrocyte precursor cells, and microglial cells.</p>
Full article ">Figure 2
<p>Heatmaps of log2 expression values of six patients obtained from microarrays experiments (Allen brain atlas). The Allen brain atlas database revealed that CORO1C is highly expressed within the hippocampal formation and myelencephalon regions of the brain [<a href="#B30-ncrna-09-00004" class="html-bibr">30</a>].</p>
Full article ">Figure 3
<p>Expression of <span class="html-italic">CORO1C</span> in various cancerous tissues. (<b>a</b>) <span class="html-italic">CORO1C</span> expression across 17 cancer types revealed that the gene was highly expressed in head and neck cancer, gliomas, and melanomas. ( <b>b</b>) <span class="html-italic">CORO1C</span> was significantly upregulated in GBM tumour samples (red) in comparison to normal brain tissue (grey) (One way ANOVA, * <span class="html-italic">p</span> &lt; 0.01).</p>
Full article ">Figure 4
<p>UALCAN comparative analysis of the expression of CORO1C within adult and paediatric glioblastoma patients. (<b>a</b>) Significantly high total protein levels of CORO1C were observed in all age groups compared to a normalised sample, except age group 81–100 years (normal versus age 21–40 years, <span class="html-italic">p</span> &lt; 6.015973 × 10<sup>−3</sup>; normal versus age 41–60 years, <span class="html-italic">p</span> &lt; 4.724525 × 10<sup>−4</sup>; normal versus age 61–80 years, <span class="html-italic">p</span> &lt; 1.753039 × 10<sup>−3</sup>). (<b>b</b>) CORO1C expression was higher in age groups 0–9 years, 10–19 years, and 20–29 years in comparison to their counterparts at age ≥ 30 years of age. However, there was no statistical significance of expression between the different age groups. (<b>c</b>) Neurofibroma, chondroma, schwannoma, PHGG, and DIPG showed highest expression levels of CORO1C. Neurofibromas had significantly higher expression of CORO1C in comparison to PHGG (<span class="html-italic">p</span> &lt; 3.217085 × 10<sup>−2</sup>). PLGG, DIPG, CRANIO, PTEN, ES, DNT, and CPP subtypes have significantly lower expressions of CORO1C in comparison to PHGG (PLGG versus PHGG, <span class="html-italic">p</span> &lt; 2.50863678369934 × 10<sup>−7</sup>; DIPG versus PHGG <span class="html-italic">p</span> &lt; 3.535811 × 10<sup>−3</sup>; CRANIO versus PHGG <span class="html-italic">p</span> &lt; 5.516405 × 10<sup>−3</sup>; PTEN versus PHGG <span class="html-italic">p</span> &lt; 2.994696 × 10<sup>−3</sup>; ES versus PHGG <span class="html-italic">p</span> &lt; 5.98540311685281 × 10<sup>−8</sup>; DNT versus PHGG <span class="html-italic">p</span> &lt; 1.163218 × 10<sup>−2</sup>; CPP versus PHGG <span class="html-italic">p</span> &lt; 1.75021275936207 × 10<sup>−18</sup>).</p>
Full article ">Figure 5
<p>Single-cell analysis of glioblastoma cell clusters from paediatric and adult patients. (<b>a</b>) tSNE heatmap showed CORO1C expression within the left half of the malignant cell cluster (blue), almost exclusively across the macrophage cluster (red) and centre of the oligodendrocyte cell cluster (green). Little or no expression was observed within the T-cell cluster (purple). (<b>b</b>) Expression of CORO1C within the paediatric cluster (blue) was higher, ranging between log2 of 6 and log2 of 8, when compared to cells from the adult cluster (red). (<b>c</b>) Expression of CORO1C within astrocyte like (AC-like), oligodendrocyte precursor cells (OPC-like), mesenchymal like (MES-like), and neural-progenitor-like cells (NPC-like) demonstrated global expression across all cellular states with NPC-like state showing slightly higher expression of the protein (&gt;log2 of 6).</p>
Full article ">Figure 6
<p>miRNA gene targets for <span class="html-italic">CORO1C</span> and physical interactions of <span class="html-italic">CORO1C</span> and other genes. Venn diagram incorporating miRSystem, TargetScan, miRWalk, and ENCORI databases. In total, 62 miRNAs were found to overlap between the 4 miRNA analysis tools (2.6%). Of these, miR-133-3p, hsa-miR-206, and miR-128-3p have been shown to be associated with <span class="html-italic">CORO1C</span> gene expression in different types of neoplasms.</p>
Full article ">
14 pages, 2492 KiB  
Article
Activity-Dependent Non-Coding RNA MAPK Interactome of the Human Epileptic Brain
by Allison Kirchner, Fabien Dachet, Leonard Lipovich and Jeffrey A. Loeb
Non-Coding RNA 2023, 9(1), 3; https://doi.org/10.3390/ncrna9010003 - 4 Jan 2023
Cited by 5 | Viewed by 2434
Abstract
The human brain has evolved to have extraordinary capabilities, enabling complex behaviors. The uniqueness of the human brain is increasingly posited to be due in part to the functions of primate-specific, including human-specific, long non-coding RNA (lncRNA) genes, systemically less conserved than protein-coding [...] Read more.
The human brain has evolved to have extraordinary capabilities, enabling complex behaviors. The uniqueness of the human brain is increasingly posited to be due in part to the functions of primate-specific, including human-specific, long non-coding RNA (lncRNA) genes, systemically less conserved than protein-coding genes in evolution. Patients who have surgery for drug-resistant epilepsy are subjected to extensive electrical recordings of the brain tissue that is subsequently removed in order to treat their epilepsy. Precise localization of brain tissues with distinct electrical properties offers a rare opportunity to explore the effects of brain activity on gene expression. Here, we identified 231 co-regulated, activity-dependent lncRNAs within the human MAPK signaling cascade. Six lncRNAs, four of which were antisense to known protein-coding genes, were further examined because of their high expression and potential impact on the disease phenotype. Using a model of repeated depolarizations in human neuronal-like cells (Sh-SY5Y), we show that five out of six lncRNAs were electrical activity-dependent, with three of four antisense lncRNAs having reciprocal expression patterns relative to their protein-coding gene partners. Some were directly regulated by MAPK signaling, while others effectively downregulated the expression of the protein-coding genes encoded on the opposite strands of their genomic loci. These lncRNAs, therefore, likely contribute to highly evolved and primate-specific human brain regulatory functions that could be therapeutically modulated to treat epilepsy. Full article
Show Figures

Figure 1

Figure 1
<p>MAPK-pathway signaling genes and specific lncRNAs are co-differentially expressed in an activity-dependent fashion in human epileptic brain tissues. Gene clustering of microarray results from seven patients with neocortical epilepsy demonstrates that certain lncRNAs (green) have significantly similar expression patterns to the MAPK-pathway signaling genes (red). Each node (green, red or magenta circles) corresponds to a gene and each link between nodes correspond to a Pearson correlation p-value <span class="html-italic">p</span> &lt; 0.00001 (R &gt; 0.9, 14 samples), indicating that the closer two linked nodes are to each other, the more closely their expression patterns resemble each other. LncRNAs of interest (magenta) were identified and subsequently labeled. (<b>A</b>) Clustering of MAPK-pathway signaling genes with upregulated lncRNAs shows 231 significantly upregulated lncRNA and 42 MAPK signaling genes with a similar expression pattern (fold change &gt; 1.3, false discovery rate &lt; 5%). (<b>B</b>) Clustering of MAPK-pathway signaling genes with downregulated lncRNAs shows that the MAPK-pathway signaling genes does not cluster with the down regulated lncRNAs..</p>
Full article ">Figure 2
<p>qPCR of human epileptic neocortical tissue samples confirms the differential expression of lncRNAs. Within each patient, brain regions that were previously identified as having high epileptic signaling (High Spike) or low epileptic signaling (Low Spike), were compared. Five of the six lncRNAs demonstrated increased expression in areas of high epileptic spiking activity, including a 3.7-fold increase in BC028229, a seven-fold increase in AK023739 (* <span class="html-italic">p</span> &lt; 0.05, one-sample <span class="html-italic">t</span>-test, <span class="html-italic">n</span> = 4), a two-fold increase in AL83303, a three-fold increase in CR615000, and a 1.2-fold increase in BC039550. No change in expression was observed for the lncRNA BC018494.</p>
Full article ">Figure 3
<p>Variability in activity-dependent lncRNA induction. (<b>A</b>) Repeated KCl-induced depolarizations were used to model activity-dependent signaling in vitro. qPCR was performed to measure RNA expression at the specified time points. All results are displayed as fold change in comparison to time-matched controls. (<b>B</b>) EGR1 increases with activity at four- and eight-hours following depolarization. (<b>C</b>) BC028229 shows a steady increase in activity-dependent expression reaching three-fold by 24 hours (* <span class="html-italic">p</span> &lt; 0.05, two-way ANOVA, <span class="html-italic">n</span> = 3, DF = 6), (<b>D</b>) BC018494 increases expression by three-fold at eight hours (<span class="html-italic">p</span> = 0.12, two-way ANOVA, <span class="html-italic">n</span> = 3, DF = 6), (<b>E</b>) AK023739 increases 4.5-fold at eight hours (*** <span class="html-italic">p</span> = &lt;0.001, two-way ANOVA, <span class="html-italic">n</span> = 3, DF = 6), (<b>F</b>) AL83303 does not change, (<b>G</b>) CR61500 has a two-fold increase at four hours (* <span class="html-italic">p</span> &lt; 0.05, **** <span class="html-italic">p</span> &lt; 0.0001, two-way ANOVA, <span class="html-italic">n</span> = 3, DF = 6), and (<b>H</b>) BC039550 has a three-fold increase at eight hours (* <span class="html-italic">p</span> &lt; 0.05, two-way ANOVA, <span class="html-italic">n</span> = 3, DF = 6).</p>
Full article ">Figure 4
<p>MAPK signaling modulates AK023739 expression following cell depolarization. 10 M PD18 significantly reduced the activity-dependent expression of AK023730 following 100mM KCl depolarization at four hours via qPCR (* <span class="html-italic">p</span> &lt; 0.05, one sample <span class="html-italic">t</span>-test, <span class="html-italic">n</span> = 4) Results are displayed as fold change, comparing depolarization with MEK inhibition to depolarization with vehicle control, but had variable effects on the other lncRNAs. The decrease in EGR1 expression was included as an internal control.</p>
Full article ">Figure 5
<p>Sense-antisense coding/non-coding gene pairs demonstrate reciprocal expression patterns after repeated depolarizations. (<b>A</b>) Repeated KCl depolarizations in the Sh-SY5Y cells resulted in significantly different expressions of BC028229 and BTG3 at 24 hours (<span class="html-italic">p</span> = 0.06, two-way ANOVA, <span class="html-italic">n</span> = 3, DF = 14), (<b>B</b>) BC018494 and IQCA1 at 24 h (** <span class="html-italic">p</span> &lt; 0.01, two-way ANOVA, <span class="html-italic">n</span> = 3, DF = 14), and (<b>C</b>) AK023739 and HECW2 at four, eight, and 24 h (**** <span class="html-italic">p</span> &lt; 0.0001, two-way ANOVA, <span class="html-italic">n</span> = 3, DF = 14). All results are displayed as fold changes in comparison to time matched control. (<b>D</b>) CR615000 and ERAP1 demonstrate similar patterns of expression with no significant changes between the two expression patterns.</p>
Full article ">Figure 6
<p>Antisense lncRNAs negatively modulate the expression of their overlapping protein-coding genes in vitro. (<b>A</b>) siRNA knockdown of BC028229 in Sh-SY5Y cells results in a significant decrease in BC028229 (* <span class="html-italic">p</span> &lt; 0.05 one sample <span class="html-italic">t</span>-test, <span class="html-italic">n</span> = 4) and an increase in the expression of BTG3 mRNA via qPCR and (<b>B</b>) an increase in the expression of BTG3 protein via Western blot (<span class="html-italic">p</span> = 0.12, one sample <span class="html-italic">t</span>-test, <span class="html-italic">n</span> = 4). (<b>C</b>) siRNA knockdown of AK023739 results in a decrease in AK023739 and (<b>D</b>) an increase in the expression of HECW2 protein, as shown by Western blot (<span class="html-italic">p</span> = 0.12, one sample <span class="html-italic">t</span>-test, <span class="html-italic">n</span> = 4). (<b>E</b>) Knockdown of BC018494 results in a significant decrease in BC018494 (<span class="html-italic">p</span> &lt; 0.05, one sample <span class="html-italic">t</span>-test, <span class="html-italic">n</span> = 3) and an increase in the expression of IQCA1 mRNA, as shown byqPCR (mean = 3.27, <span class="html-italic">p</span> = 0.25, one sample <span class="html-italic">t</span>-test, <span class="html-italic">n</span> = 3). (<b>F</b>) CR61500 knockdown results in no significant changes in ERAP1 expression. All results are a fold change in comparison to mock transfection control.</p>
Full article ">
15 pages, 3780 KiB  
Article
High Throughput FISH Screening Identifies Small Molecules That Modulate Oncogenic lncRNA MALAT1 via GSK3B and hnRNPs
by Nina Zablowsky, Lydia Farack, Sven Rofall, Jan Kramer, Hanna Meyer, Duy Nguyen, Alexander K. C. Ulrich, Benjamin Bader and Patrick Steigemann
Non-Coding RNA 2023, 9(1), 2; https://doi.org/10.3390/ncrna9010002 - 3 Jan 2023
Cited by 2 | Viewed by 3802
Abstract
Traditionally, small molecule-based drug discovery has mainly focused on proteins as the drug target. Opening RNA as an additional target space for small molecules offers the possibility to therapeutically modulate disease-driving non-coding RNA targets as well as mRNA of otherwise undruggable protein targets. [...] Read more.
Traditionally, small molecule-based drug discovery has mainly focused on proteins as the drug target. Opening RNA as an additional target space for small molecules offers the possibility to therapeutically modulate disease-driving non-coding RNA targets as well as mRNA of otherwise undruggable protein targets. MALAT1 is a highly conserved long-noncoding RNA whose overexpression correlates with poor overall patient survival in some cancers. We report here a fluorescence in-situ hybridization-based high-content imaging screen to identify small molecules that modulate the oncogenic lncRNA MALAT1 in a cellular setting. From a library of FDA approved drugs and known bioactive molecules, we identified two compounds, including Niclosamide, an FDA-approved drug, that lead to a rapid decrease of MALAT1 nuclear levels with good potency. Mode-of-action studies suggest a novel cellular regulatory pathway that impacts MALAT1 lncRNA nuclear levels by GSK3B activation and the involvement of the RNA modulating family of heterogenous nuclear ribonucleoproteins (hnRNPs). This study is the basis for the identification of novel targets that lead to a reduction of the oncogenic lncRNA MALAT1 in a cancer setting. Full article
(This article belongs to the Section Long Non-Coding RNA)
Show Figures

Figure 1

Figure 1
<p>(<b>A</b>): Hela stained for MALAT1 lncRNA by fluorescence in-situ hybridization after treatment with transcription inhibitor Triptolide various times. Nuclei are stained by Hoechst. (<b>B</b>): Hela stained for c-myc mRNA by fluorescence in-situ hybridization after treatment with transcription inhibitor Triptolide various times. Nuclei are stained by Hoechst. Quantification of nuclear MALAT1 staining or c-myc granules per cell shown on the right. Bars show mean with SD. Scale bar ~10 µm.</p>
Full article ">Figure 2
<p>(<b>A</b>): Scatter blot showing robust Z-scores for MALAT1 nuclear staining intensity reduction on the <span class="html-italic">x</span>-axis and c-myc granule per cell count reduction on the <span class="html-italic">y</span>-axis. Compounds with a robust Z-score below −3 for MALAT1 and above −3 for c-myc are considered as hits (in green), compounds with robust Z-scores below −3 for c-myc granule per cell reduction were considered as false positive hits (red). (<b>B</b>): Scatter blot showing robust Z-scores for MALAT1 nuclear staining intensity reduction on the <span class="html-italic">x</span>-axis and reduction in nuclear counts (i.e., number of viable cells) on the <span class="html-italic">y</span>-axis. Compounds with robust Z-scores below −3 for nuclear counts were considered as toxic hits (purple).</p>
Full article ">Figure 3
<p>(<b>A</b>): Hela stained for MALAT1 lncRNA by fluorescence in-situ hybridization after treatment with DMSO control or HTS hits at 10 µM and 2 h incubation time. Nuclei are stained by Hoechst. Scale bar ~10 µm. (<b>B</b>): Quantification of nuclear MALAT1 staining compared with pre-fixed cells after 2 h compound addition. Highly significant effects compared to each pre-fixed control are detected for four of the compounds. Bars show mean with SD. **** <span class="html-italic">p</span> value &lt; 0.0001; * <span class="html-italic">p</span> value &lt; 0.1; ns = not significant. (<b>C</b>): Quantification of nuclear MALAT1 staining after co-treatment with 10 µM of the transcription inhibitor Triptolide and 10 µM of HTS hits. Data normalized to Triptolide/DMSO control (1). Bars show mean with SD.</p>
Full article ">Figure 4
<p>(<b>A</b>): EC50 determination of Niclosamide and Tyrphostin 9 for nuclear MALAT1 staining reduction after 2h incubation. Data normalized to DMSO control (0). (<b>B</b>): MALAT1 RNA expression levels relative to DMSO control. GAPDH was used as normalization control. Mean +/− SEM (n = 6). *** <span class="html-italic">p</span> value &lt; 0.001; ** <span class="html-italic">p</span> value &lt; 0.01.</p>
Full article ">Figure 5
<p>(<b>A</b>): Niclosamide and Tyrphostin 9 lead to nuclear translocation of GSK3B. Example pictures (6 h incubation) and quantification of GSK3B nuclear to cytoplasmic levels. Bars show mean with SD. *** <span class="html-italic">p</span> value &lt; 0.001, **** <span class="html-italic">p</span> value &lt; 0.0001, nuclei are stained by Hoechst, IF against GSK3B. One results from two independent experiments with similar outcomes shown. (<b>B</b>): Hela stained for MALAT1 lncRNA by fluorescence in-situ hybridization after 72 h siRNA against the indicated target followed by 2 h treatment with DMSO control or HTS hits at 10 µM. Nuclei are stained by Hoechst. Quantification of nuclear MALAT1 staining after siRNA and compound treatment. GSK3B knockdown significantly prevents compound induced reduction of nuclear MALAT1 staining intensity. Bars show mean with SD. **** <span class="html-italic">p</span> value &lt; 0.0001. Scale bars ~10 µm.</p>
Full article ">Figure 6
<p>(<b>A</b>): Quantification of nuclear MALAT1 staining after siRNA and compound treatment. GSK3B but not b-Catenin or CREB knockdown significantly prevents compound induced reduction of nuclear MALAT1 staining intensity. Bars show mean with SD. (<b>B</b>): Hela stained for MALAT1 lncRNA by fluorescence in-situ hybridization after 72 h siRNA against the indicated target followed by 2 h treatment with DMSO control or HTS hits at 10 µM. Nuclei are stained by Hoechst. Scale bar ~10 µm. Quantification of nuclear MALAT1 staining after siRNA and compound treatment. GSK3B as well as to a lower extent hnRNPC and hnRNPK knockdown significantly prevent compound induced reduction of nuclear MALAT1 staining intensity. Bars show mean with SD. **** <span class="html-italic">p</span> value &lt; 0.0001; * <span class="html-italic">p</span> value &lt; 0.1; ns = not significant.</p>
Full article ">Figure 7
<p>Hela stained for NEAT1 lncRNA by fluorescence in-situ hybridization after 72 h siRNA against the indicated target followed by 2 h treatment with DMSO control or HTS hits at 10 µM. Nuclei are stained by Hoechst. Scale bar ~10 µm. Quantification of nuclear NEAT1 staining after siRNA and compound treatment. GSK3B and hnRNPC knockdown significantly prevent compound induced reduction of nuclear NEAT1 staining intensity. Bars show mean with SD. **** <span class="html-italic">p</span> value &lt; 0.0001; * <span class="html-italic">p</span> value &lt; 0.1; ns = not significant.</p>
Full article ">Figure 8
<p>(<b>A</b>): Time course of MALAT1 nuclear intensity decrease and (<b>B</b>). effect on nuclear numbers. Hela cells were treated with DMSO or 10 µM Niclosamide and MALAT1 was stained by FISH. Nuclear MALAT1 levels and number of nuclei per well were determined. Mean of n = 4 per condition and timepoint with SD as error bars.</p>
Full article ">
20 pages, 1993 KiB  
Review
FLVCR1-AS1 and FBXL19-AS1: Two Putative lncRNA Candidates in Multiple Human Cancers
by Mohsen Sheykhhasan, Hamid Tanzadehpanah, Amirhossein Ahmadieh Yazdi, Hanie Mahaki, Reihaneh Seyedebrahimi, Mohammad Akbari, Hamed Manoochehri, Naser Kalhor and Paola Dama
Non-Coding RNA 2023, 9(1), 1; https://doi.org/10.3390/ncrna9010001 - 22 Dec 2022
Cited by 9 | Viewed by 2784
Abstract
(1) Background: Mounting evidence supports the idea that one of the most critical agents in controlling gene expression could be long non-coding RNAs (lncRNAs). Upregulation of lncRNA is observed in the different processes related to pathologies, such as tumor occurrence and development. Among [...] Read more.
(1) Background: Mounting evidence supports the idea that one of the most critical agents in controlling gene expression could be long non-coding RNAs (lncRNAs). Upregulation of lncRNA is observed in the different processes related to pathologies, such as tumor occurrence and development. Among the crescent number of lncRNAs discovered, FLVCR1-AS1 and FBXL19-AS1 have been identified as oncogenes in many cancer progression and prognosis types, including cholangiocarcinoma, gastric cancer, glioma and glioblastoma, hepatocellular carcinoma, lung cancer, ovarian cancer, breast cancer, colorectal cancer, and osteosarcoma. Therefore, abnormal FBXL19-AS1 and FLVCR1-AS1 expression affect a variety of cellular activities, including metastasis, aggressiveness, and proliferation; (2) Methods: This study was searched via PubMed and Google Scholar databases until May 2022; (3) Results: FLVCR1-AS1 and FBXL19-AS1 participate in tumorigenesis and have an active role in impacting several signaling pathways that regulate cell proliferation, migration, invasion, metastasis, and EMT; (4) Conclusions: Our review focuses on the possible molecular mechanisms in a variety of cancers regulated by FLVCR1-AS1 and FBXL19-AS1. It is not surprising that there has been significant interest in the possibility that these lncRNAs might be used as biomarkers for diagnosis or as a target to improve a broader range of cancers in the future. Full article
(This article belongs to the Special Issue The Importance of Non-coding RNAs in Epithelial Cancers)
Show Figures

Figure 1

Figure 1
<p>Genomic location of FLVCR1-AS1.</p>
Full article ">Figure 2
<p>Genomic location of FBXL19-AS1.</p>
Full article ">Figure 3
<p>The gene expression of FLVCR1-AS1 profile across all tumor samples and paired normal tissues.</p>
Full article ">Figure 4
<p>The gene expression of FBXL19-AS1 profile across all tumor samples and paired normal tissues.</p>
Full article ">Figure 5
<p>Underling molecular mechanisms of FLVCR1-AS1.</p>
Full article ">Figure 6
<p>Underling molecular mechanisms of FBXL19-AS1.</p>
Full article ">
Previous Issue
Next Issue
Back to TopTop