[go: up one dir, main page]

Next Issue
Volume 10, September
Previous Issue
Volume 10, July


Risks, Volume 10, Issue 8 (August 2022) – 25 articles

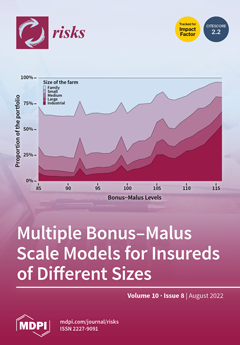
Cover Story (view full-size image): How to consider the a priori risks in experience-rating models has been questioned in the actuarial community for a long time. Classic past-claim-rating models normalize the past experience of those insured before applying claim penalties. Despite the quality of predictions of the BMS models, this experience-rating model could appear unfair to many of those insured and regulators because it does not recognize the initial risk of the insured. In this paper, we propose the creation of different BMSs for each type of insured using recursive partitioning methods. We apply this approach to real data for the farm insurance product of a major Canadian insurance company with widely varying sizes of those insured. View this paper
  • Issues are regarded as officially published after their release is announced to the table of contents alert mailing list.
  • You may sign up for e-mail alerts to receive table of contents of newly released issues.
  • PDF is the official format for papers published in both, html and pdf forms. To view the papers in pdf format, click on the "PDF Full-text" link, and use the free Adobe Reader to open them.
Order results
Result details
Select all
Export citation of selected articles as:
10 pages, 856 KiB  
Article
Understanding of Macro Factors That Affect Yield of Government Bonds
by Ekaterina Koroleva and Maxim Kopeykin
Risks 2022, 10(8), 166; https://doi.org/10.3390/risks10080166 - 18 Aug 2022
Cited by 3 | Viewed by 7271
Abstract
Government bonds are one of the safest and most attractive instruments in the investment portfolio for private investors and investment funds. Although bonds are perceived as an alternative to bank deposits, a number of macroeconomic factors influence their yield. The goal of the [...] Read more.
Government bonds are one of the safest and most attractive instruments in the investment portfolio for private investors and investment funds. Although bonds are perceived as an alternative to bank deposits, a number of macroeconomic factors influence their yield. The goal of the research is to investigate the relationship between macroeconomic factors and the yield of government bonds. We use regression models on a dataset of 22 countries with post-industrial economics for ten years. The main criteria for selecting countries are membership in the Organization for Economic Cooperation and Development and inclusion in the Top-25 countries on the competitiveness index. The results revealed a negative association between the yield of government bonds and gold. Moreover, we indicate a positive association between the yield of government bonds and the following indicators—inflation, oil prices, and GDP per capita. In the case of the influence of population savings and the uncertainty index, we obtain inconclusive results. The study contributes to ongoing research in the field of financial management with respect to investigating determinants of the yield of government bonds. Full article
(This article belongs to the Special Issue Risk Analysis and Management in the Digital and Innovation Economy)
Show Figures

Figure 1

Figure 1
<p>The conceptual model of research.</p>
Full article ">Figure 2
<p>The results of multiple linear regression for the 1st model, including whole analysed macro factors.</p>
Full article ">Figure 3
<p>The results of Shapiro–Wilk W test.</p>
Full article ">Figure 4
<p>The results of Breusch–Pagan test.</p>
Full article ">
26 pages, 4114 KiB  
Article
Information Security Risk Assessment Using Situational Awareness Frameworks and Application Tools
by Nungky Awang Chandra, Kalamullah Ramli, Anak Agung Putri Ratna and Teddy Surya Gunawan
Risks 2022, 10(8), 165; https://doi.org/10.3390/risks10080165 - 17 Aug 2022
Cited by 9 | Viewed by 5902
Abstract
This paper describes the development of situational awareness models and applications to assess cybersecurity risks based on Annex ISO 27001:2013. The risk assessment method used is the direct testing method, namely audit, exercise and penetration testing. The risk assessment of this study is [...] Read more.
This paper describes the development of situational awareness models and applications to assess cybersecurity risks based on Annex ISO 27001:2013. The risk assessment method used is the direct testing method, namely audit, exercise and penetration testing. The risk assessment of this study is classified into three levels, namely high, medium and low. A high-risk value is an unacceptable risk value. Meanwhile, low and medium risk values can be categorized as acceptable risk values. The results of a network security case study with security performance index indicators based on the percentage of compliance with ISO 27001:2013 annex controls and the value of the risk level of the findings of the three test methods showed that testing with the audit method was 38.29% with a moderate and high-risk level. While the test results with the tabletop exercise method are 75% with low and moderate risk levels. On the other hand, the results with the penetration test method are 16.66%, with moderate and high-risk levels. Test results with unacceptable risk values or high-risk corrective actions are taken through an application. Finally, corrective actions have been verified to prove there is an increase in cyber resilience and security. Full article
Show Figures

Figure 1

Figure 1
<p>Three Levels of Situational Awareness (<a href="#B29-risks-10-00165" class="html-bibr">Jiang et al. 2022</a>).</p>
Full article ">Figure 2
<p>Risk Management Process of ISO 27005 (<a href="#B24-risks-10-00165" class="html-bibr">ISO 27005:2018 2018</a>).</p>
Full article ">Figure 3
<p>Research Position within the ISO 27005 Framework.</p>
Full article ">Figure 4
<p>Penetration Testing Stages (<a href="#B17-risks-10-00165" class="html-bibr">Ghanem and Chen 2020</a>).</p>
Full article ">Figure 5
<p>New Model of The Risk Treatment Plan Testing Framework with The Situational Awareness Model (Novelty).</p>
Full article ">Figure 6
<p>Relationship Between the Risk Treatment Plan Testing Method and Risk Finding.</p>
Full article ">Figure 7
<p>The Risk Management Flow Chart’s Scope of the Risk Treatment Plan Testing Architecture System.</p>
Full article ">Figure 8
<p>Data Flow Diagram Level 0.</p>
Full article ">Figure 9
<p>Data Flow Diagram of the Level 1 Testing Using Audit, Exercise and Penetration Testing.</p>
Full article ">Figure 10
<p>Class Diagram of Risk Treatment Plan Control Test Applications.</p>
Full article ">Figure 11
<p>Application Features for Monitoring and Evaluating Risk Treatment Plan Controls.</p>
Full article ">Figure 12
<p>Visual Monitoring of Risk Control Treatment Plan of Audit Results.</p>
Full article ">Figure 13
<p>Visual Monitoring of Risk Control Treatment Plan of Tabletop Exercise Results.</p>
Full article ">Figure 14
<p>Visual Monitoring of Risk Control Treatment Plan of Penetration Testing Results.</p>
Full article ">
18 pages, 460 KiB  
Article
Time Restrictions on Life Annuity Benefits: Portfolio Risk Profiles
by Annamaria Olivieri and Ermanno Pitacco
Risks 2022, 10(8), 164; https://doi.org/10.3390/risks10080164 - 12 Aug 2022
Viewed by 1834
Abstract
Due to the increasing interest in several markets in life annuity products with a guaranteed periodic benefit, the back-side effects of some features that may prove to be critical either for the provider or the customer should be better understood. In this research, [...] Read more.
Due to the increasing interest in several markets in life annuity products with a guaranteed periodic benefit, the back-side effects of some features that may prove to be critical either for the provider or the customer should be better understood. In this research, we focus on the time frames defined by the policy conditions of life annuities. While the payment phase coincides with the post-retirement period in the traditional annuity product, arrangements with alternative time frames are being offered in the market. Time restrictions, in particular, could be welcomed both by customers and providers, as they result in a reduction in expected costs and equivalence premiums. However, due to the different impact of longevity risk on different age ranges, time restrictions could increase risks to the provider, at least in relative terms. On the other hand, time restrictions reduce the duration of the provider’s liability, which should therefore be less exposed to financial risk. We focus on this issue, examining the probability distribution of the total portfolio payout resulting from alternative time frames for life annuity arrangements, first addressing longevity risk only, and then including also financial risk. The discussion is developed in view of understanding whether a reduction in the equivalence premium implied by time restrictions should be matched by higher premium loading and required capital rates. Full article
(This article belongs to the Special Issue Longevity Risk Modelling and Management)
Show Figures

Figure 1

Figure 1
<p>Policy time frames and benefit payment time frames.</p>
Full article ">Figure 2
<p>Benefit payment restrictions in relation to the individuals’ lifetime distribution.</p>
Full article ">
26 pages, 865 KiB  
Article
Risks of Entrepreneurship amid the COVID-19 Crisis
by Tatiana N. Litvinova
Risks 2022, 10(8), 163; https://doi.org/10.3390/risks10080163 - 11 Aug 2022
Cited by 8 | Viewed by 2571
Abstract
The COVID-19 crisis is unique in that it is caused by a pandemic and has created a special context for entrepreneurship in 2020. The motivation for this study is, firstly, to concretise and accurately quantify the impacts of the pandemic on entrepreneurship. Secondly, [...] Read more.
The COVID-19 crisis is unique in that it is caused by a pandemic and has created a special context for entrepreneurship in 2020. The motivation for this study is, firstly, to concretise and accurately quantify the impacts of the pandemic on entrepreneurship. Secondly, to clearly identify the specific business risks emerging or intensifying in the context of the pandemic; and thirdly, to distinguish between the impact of the economic crisis and the pandemic on entrepreneurship. This paper aims at studying the risks of entrepreneurship amid the COVID-19 pandemic and crisis. The paper’s sample consists of the top 10 countries that are leaders by the COVID-19 case rate in the world, starting 22 October 2020 up to 22 February 2022. The method of trend analysis is used to find and quantitatively measure the manifestations of the pandemic (case rate and mortality) on the entrepreneurial risks. Economic and mathematical modelling, with the help of correlation and regression analysis, showed that healthcare factors—the COVID-19 case rate and mortality—are not the key reasons for high entrepreneurial risks in 2020 and have a small influence on them. This paper’s contribution to the literature consists in specifying the cause-and-effect links between the COVID-19 pandemic and crisis and entrepreneurial risks. The theoretical significance of the results obtained consists in their proving the uniqueness of the COVID-19 crisis from the position of entrepreneurial risks. The paper’s originality consists in specifying the influence of the COVID-19 pandemic on entrepreneurial risks, explaining—thoroughly and in detail—the essence of these risks, and opening possibilities for highly-effective risk management. Full article
(This article belongs to the Special Issue The COVID-19 Crisis: Datasets and Data Analysis to Reduce Risks)
Show Figures

Figure 1

Figure 1
<p>Concept of the research and literature gaps. Source: developed and compiled by the author.</p>
Full article ">Figure 2
<p>Rate of economic growth of countries of the sample in 2020, %. Source: calculated and compiled by the author based on the <a href="#B27-risks-10-00163" class="html-bibr">International Monetary Fund</a> (<a href="#B27-risks-10-00163" class="html-bibr">2022</a>).</p>
Full article ">
21 pages, 3704 KiB  
Article
Factors of Risk Analysis for IoT Systems
by Roberto Andrade, Iván Ortiz-Garcés, Xavier Tintin and Gabriel Llumiquinga
Risks 2022, 10(8), 162; https://doi.org/10.3390/risks10080162 - 10 Aug 2022
Cited by 6 | Viewed by 2840
Abstract
The increasing rate at which IoT technologies are being developed has enabled smarter and innovative solutions in the sectors of health, energy, transportation, etc. Unfortunately, some inherent characteristics of these technologies are compromised to attack. Naturally, risk analysis emerges, as it is one [...] Read more.
The increasing rate at which IoT technologies are being developed has enabled smarter and innovative solutions in the sectors of health, energy, transportation, etc. Unfortunately, some inherent characteristics of these technologies are compromised to attack. Naturally, risk analysis emerges, as it is one of many steps to provide a reliable security strategy. However, the methodologies of any risk analysis must first adapt to the dynamics of the IoT system. This article seeks to shed light on whatever factors are part of an IoT system and thus contribute to security risks, IoT device vulnerabilities, susceptibility due to the application domain, attack surfaces, and interdependence as a product of the interconnection between IoT devices. Consequently, the importance of these factors in any risk evaluation is highlighted, especially the interdependence generated by IoT systems, which can cause the generation of an uncontrollable cascade of effects that can occur under certain conditions of any systematic risk event. Full article
Show Figures

Figure 1

Figure 1
<p>Number of companies affected versus severity of loss (source: WEF (<a href="#B8-risks-10-00162" class="html-bibr">European Systemic Risk Board 2022</a>)).</p>
Full article ">Figure 2
<p>Proposed multilayered architecture of an IoT system.</p>
Full article ">Figure 3
<p>Model for security risk management in IoT context.</p>
Full article ">Figure 4
<p>Three charts illustrate in the concept of impact tolerance and absorptive capacity (<b>a</b>) a shock being absorbed (<b>b</b>) and disruptions with different rates of impact amplification (<b>c</b>). Source: WEF (<a href="#B8-risks-10-00162" class="html-bibr">European Systemic Risk Board 2022</a>).</p>
Full article ">Figure 5
<p>Scheme of an actual or hypothetical test targeted to probe the system’s response to a hypothetical but possible scenario.</p>
Full article ">Figure 6
<p>A Bayesian network consisting of various factors (vulnerability, susceptibility, attack surface, and interdependency) that have potential to impact the economic, social, and environmental domains.</p>
Full article ">Figure 7
<p>This is a figure. Schemes follow the same formatting.</p>
Full article ">Figure 8
<p>Correlation of a set of variables indicating that the null hypothesis should not be rejected since the financial risk calculation model followed the normal distribution. ** high correlation; *** very high correlation.</p>
Full article ">Figure 9
<p>The percentage in the range absorption capacity relates directly to the risk value and is related to the response given in the event of the security incident.</p>
Full article ">Figure 10
<p>Disruptions with different rates of impact amplification.</p>
Full article ">
38 pages, 1607 KiB  
Article
A New Mortality Framework to Identify Trends and Structural Changes in Mortality Improvement and Its Application in Forecasting
by Wanying Fu, Barry R. Smith, Patrick Brewer and Sean Droms
Risks 2022, 10(8), 161; https://doi.org/10.3390/risks10080161 - 10 Aug 2022
Cited by 1 | Viewed by 1730
Abstract
We construct a new age-specific mortality framework and implement an exemplar (DLGC) that provides an excellent fit to data from various countries and across long time periods while also providing accurate mortality forecasts by projecting parameters with ARIMA models. The model parameters have [...] Read more.
We construct a new age-specific mortality framework and implement an exemplar (DLGC) that provides an excellent fit to data from various countries and across long time periods while also providing accurate mortality forecasts by projecting parameters with ARIMA models. The model parameters have clear and reasonable interpretations that, after fitting, show stable time trends that react to major world mortality events. These trends are similar for countries with similar life-expectancies and capture mortality improvement, mortality structural change, and mortality compression over time. The parameter time plots can also be used to improve forecasting accuracy by suggesting training data periods and appropriate stochastic assumptions for parameters over time. We also give a quantitative analysis on what factors contribute to increased life expectancy and gender mortality differences during different age periods. Full article
Show Figures

Figure 1

Figure 1
<p>RUS male 2014 death rate forecasting of DLGC and the logit-binomial Lee–Carter model.</p>
Full article ">Figure 2
<p>USA male 2019 death rate forecasting log value of DLGC and the logit-binomial Lee-Carter model.</p>
Full article ">Figure 3
<p>(<b>a</b>) The log of infant mortality <span class="html-italic">A</span> for females from 1959 to 2013 across HLE countries. (<b>b</b>) The log of infant mortality <span class="html-italic">A</span> for females from 1959 to 2013 across ILE countries.</p>
Full article ">Figure 4
<p>(<b>a</b>) The log of infant mortality <span class="html-italic">A</span> in France, male vs. female. (<b>b</b>) The log of infant mortality <span class="html-italic">A</span> in Switzerland, male vs. female.</p>
Full article ">Figure 5
<p>Comparison of B between Japan and the USA.</p>
Full article ">Figure 6
<p>(<b>a</b>) Decline in mortality during childhood, i.e., <span class="html-italic">C</span>, across HLE countries. (<b>b</b>) Decline in mortality during childhood, i.e., <span class="html-italic">C</span>, across ILE countries. (<b>c</b>) Decline in mortality during childhood, i.e., <span class="html-italic">C</span>, for France civilian population, male vs. female.</p>
Full article ">Figure 7
<p>(<b>a</b>) The log of the limiting teenage mortality <math display="inline"><semantics> <msub> <mi>T</mi> <mi>m</mi> </msub> </semantics></math> for Switzerland, male vs. female. (<b>b</b>) The log of the limiting teenage mortality <math display="inline"><semantics> <msub> <mi>T</mi> <mi>m</mi> </msub> </semantics></math> for Ukraine, male vs. female.</p>
Full article ">Figure 8
<p>(<b>a</b>) Limiting old age mortality <span class="html-italic">g</span> across HLE countries. (<b>b</b>) Limiting old age mortality <span class="html-italic">g</span> across ILE countries.</p>
Full article ">Figure 9
<p>(<b>a</b>) Age <math display="inline"><semantics> <msub> <mi>M</mi> <mn>1</mn> </msub> </semantics></math> of fastest increase in senescent mortality across HLE countries. (<b>b</b>) Age <math display="inline"><semantics> <msub> <mi>M</mi> <mn>1</mn> </msub> </semantics></math> of fastest increase in senescent mortality across ILE countries.</p>
Full article ">Figure 10
<p>Limiting old age mortality <span class="html-italic">g</span> for France civilian females during 1816 to 2018.</p>
Full article ">Figure 11
<p>(<b>a</b>) The age of fastest growth of the mortality acceleration factor across HLE countries. (<b>b</b>) The age of fastest growth of the mortality acceleration factor across ILE countries.</p>
Full article ">Figure 12
<p>(<b>a</b>) Level <math display="inline"><semantics> <msub> <mi>β</mi> <mn>3</mn> </msub> </semantics></math> of the mortality acceleration factor at old ages across HLE countries. (<b>b</b>) Level <math display="inline"><semantics> <msub> <mi>β</mi> <mn>3</mn> </msub> </semantics></math> of the mortality acceleration factor at old ages across ILE countries.</p>
Full article ">Figure 13
<p>(<b>a</b>) Mortality deceleration level <math display="inline"><semantics> <msub> <mi>a</mi> <mn>1</mn> </msub> </semantics></math> before age 65 across HLE countries. (<b>b</b>) Mortality deceleration level <math display="inline"><semantics> <msub> <mi>a</mi> <mn>1</mn> </msub> </semantics></math> before age 65 across ILE countries. (<b>c</b>) Mortality deceleration level <math display="inline"><semantics> <msub> <mi>a</mi> <mn>1</mn> </msub> </semantics></math> before age 65 for France, male vs. female.</p>
Full article ">Figure 14
<p>(<b>a</b>) Mortality deceleration factor between ages 65 and 85 for Russia, male vs. female. (<b>b</b>) Mortality deceleration factor between ages 65 and 85 for Ukraine, male vs. female.</p>
Full article ">Figure 15
<p>(<b>a</b>) The modal age <span class="html-italic">M</span> for females in HLE countries. (<b>b</b>) The modal age <span class="html-italic">M</span> for females in ILE countries.</p>
Full article ">Figure 16
<p>(<b>a</b>) The limiting teenage mortality <math display="inline"><semantics> <msub> <mi>T</mi> <mi>m</mi> </msub> </semantics></math> for Switzerland, male vs. female. (<b>b</b>) The limiting teenage mortality <math display="inline"><semantics> <msub> <mi>T</mi> <mi>m</mi> </msub> </semantics></math> for France total population, male vs. female.</p>
Full article ">Figure 17
<p>(<b>a</b>) The log of limiting teenage mortality <math display="inline"><semantics> <msub> <mi>T</mi> <mi>m</mi> </msub> </semantics></math> in France. (<b>b</b>) The log of limiting teenage mortality <math display="inline"><semantics> <msub> <mi>T</mi> <mi>m</mi> </msub> </semantics></math> in Japan. (<b>c</b>) The log of limiting teenage mortality <math display="inline"><semantics> <msub> <mi>T</mi> <mi>m</mi> </msub> </semantics></math> in Switzerland. (<b>d</b>) The log of limiting teenage mortality <math display="inline"><semantics> <msub> <mi>T</mi> <mi>m</mi> </msub> </semantics></math> in the USA. (<b>e</b>) The log of limiting teenage mortality <math display="inline"><semantics> <msub> <mi>T</mi> <mi>m</mi> </msub> </semantics></math> in Russia. (<b>f</b>) The log of limiting teenage mortality <math display="inline"><semantics> <msub> <mi>T</mi> <mi>m</mi> </msub> </semantics></math> in Ukraine.</p>
Full article ">Figure 17 Cont.
<p>(<b>a</b>) The log of limiting teenage mortality <math display="inline"><semantics> <msub> <mi>T</mi> <mi>m</mi> </msub> </semantics></math> in France. (<b>b</b>) The log of limiting teenage mortality <math display="inline"><semantics> <msub> <mi>T</mi> <mi>m</mi> </msub> </semantics></math> in Japan. (<b>c</b>) The log of limiting teenage mortality <math display="inline"><semantics> <msub> <mi>T</mi> <mi>m</mi> </msub> </semantics></math> in Switzerland. (<b>d</b>) The log of limiting teenage mortality <math display="inline"><semantics> <msub> <mi>T</mi> <mi>m</mi> </msub> </semantics></math> in the USA. (<b>e</b>) The log of limiting teenage mortality <math display="inline"><semantics> <msub> <mi>T</mi> <mi>m</mi> </msub> </semantics></math> in Russia. (<b>f</b>) The log of limiting teenage mortality <math display="inline"><semantics> <msub> <mi>T</mi> <mi>m</mi> </msub> </semantics></math> in Ukraine.</p>
Full article ">Figure 18
<p>(<b>a</b>) The log of mortality deceleration factor <math display="inline"><semantics> <msub> <mi>a</mi> <mn>1</mn> </msub> </semantics></math> before age 65 in in France. (<b>b</b>) The log of mortality deceleration factor <math display="inline"><semantics> <msub> <mi>a</mi> <mn>1</mn> </msub> </semantics></math> before age 65 in in Japan. (<b>c</b>) The log of mortality deceleration factor <math display="inline"><semantics> <msub> <mi>a</mi> <mn>1</mn> </msub> </semantics></math> before age 65 in in Switzerland. (<b>d</b>) The log of mortality deceleration factor <math display="inline"><semantics> <msub> <mi>a</mi> <mn>1</mn> </msub> </semantics></math> before age 65 in in the USA. (<b>e</b>) The log of mortality deceleration factor <math display="inline"><semantics> <msub> <mi>a</mi> <mn>1</mn> </msub> </semantics></math> before age 65 in in Russia. (<b>f</b>) The log of mortality deceleration factor <math display="inline"><semantics> <msub> <mi>a</mi> <mn>1</mn> </msub> </semantics></math> before age 65 in in Ukraine.</p>
Full article ">
32 pages, 844 KiB  
Article
Optimal Liquidation, Acquisition and Market Making Problems in HFT under Hawkes Models for LOB
by Ana Roldan Contreras and Anatoliy Swishchuk
Risks 2022, 10(8), 160; https://doi.org/10.3390/risks10080160 - 9 Aug 2022
Cited by 1 | Viewed by 2385
Abstract
The present paper is focused on the solution of optimal control problems such as optimal acquisition, optimal liquidation, and market making in relation to the high-frequency trading market. We have modeled optimal control problems with the price approximated by the diffusion process for [...] Read more.
The present paper is focused on the solution of optimal control problems such as optimal acquisition, optimal liquidation, and market making in relation to the high-frequency trading market. We have modeled optimal control problems with the price approximated by the diffusion process for the general compound Hawkes process (GCHP), using results from the work of Swishchuk and Huffman. These problems have been solvedusing a price process incorporating the unique characteristics of the GCHP. The GCHP was designed to reflect important characteristics of the behaviour of real-world price processes such as the dependence on the previous process and jumping features. In these models, the agent maximizes their own utility or value function by solving the Hamilton–Jacobi–Bellman (HJB) equation and designing a strategy for asset trading. The optimal solutions are expressed in terms of parameters describing the arrival rates and the midprice process from the price process, modeled as a GCHP, allowing such characteristics to influence the optimization process, aiming towards the attainment of a more general solution. Implementations of the obtained results were carried out using real LOBster data. Full article
(This article belongs to the Special Issue Stochastic Modeling and Computational Statistics in Finance)
Show Figures

Figure 1

Figure 1
<p>Apple stock price, Amazon stock price, and Google stock price. The three figure above show the the observed stock price on 21 June 2012, from LOBster data. (<b>a</b>) Apple stock price; (<b>b</b>) Amazon stock price; (<b>c</b>) Google stock price.</p>
Full article ">Figure 2
<p>Optimal liquidation inventory and optimal liquidation strategy for Apple stocks. (<b>a</b>) the inventory calculated with Equation (<a href="#FD33-risks-10-00160" class="html-disp-formula">33</a>), using the parameters in <a href="#risks-10-00160-t002" class="html-table">Table 2</a>. (<b>b</b>) the optimal liquidation value calculated with Equation (<a href="#FD34-risks-10-00160" class="html-disp-formula">34</a>), using the parameters in <a href="#risks-10-00160-t002" class="html-table">Table 2</a>.</p>
Full article ">Figure 3
<p>Optimal liquidation inventory and optimal liquidation strategy for Amazon stocks. (<b>a</b>) the inventory calculated using Equation (<a href="#FD33-risks-10-00160" class="html-disp-formula">33</a>), using the parameters in <a href="#risks-10-00160-t003" class="html-table">Table 3</a>. (<b>b</b>) the optimal liquidation value calculated using Equation (<a href="#FD34-risks-10-00160" class="html-disp-formula">34</a>), using the parameters in <a href="#risks-10-00160-t003" class="html-table">Table 3</a>.</p>
Full article ">Figure 4
<p>Optimal liquidation inventory and optimal liquidation strategy for Google stocks. (<b>a</b>) the inventory calculated using Equation (<a href="#FD33-risks-10-00160" class="html-disp-formula">33</a>), using the parameters in <a href="#risks-10-00160-t004" class="html-table">Table 4</a>. (<b>b</b>) the optimal liquidation value calculated using Equation (<a href="#FD34-risks-10-00160" class="html-disp-formula">34</a>), using the parameters in <a href="#risks-10-00160-t004" class="html-table">Table 4</a>.</p>
Full article ">Figure 5
<p>Optimal acquisition inventory and optimal acquisition strategy for Apple stocks. (<b>a</b>) the inventory calculated with Equation (<a href="#FD56-risks-10-00160" class="html-disp-formula">56</a>), using the parameters in <a href="#risks-10-00160-t005" class="html-table">Table 5</a>. (<b>b</b>) the optimal acquisition value calculated with Equation (<a href="#FD57-risks-10-00160" class="html-disp-formula">57</a>), using the parameters in <a href="#risks-10-00160-t005" class="html-table">Table 5</a>.</p>
Full article ">Figure 6
<p>Optimal acquisition inventory and optimal acquisition strategy for Amazon stocks. (<b>a</b>) the inventory calculated with Equation (<a href="#FD56-risks-10-00160" class="html-disp-formula">56</a>), using the parameters in <a href="#risks-10-00160-t006" class="html-table">Table 6</a>. (<b>b</b>) the optimal acquisition value calculated with Equation (<a href="#FD57-risks-10-00160" class="html-disp-formula">57</a>), using the parameters in <a href="#risks-10-00160-t006" class="html-table">Table 6</a>.</p>
Full article ">Figure 7
<p>Optimal acquisition inventory and optimal acquisition strategy for Google stocks. (<b>a</b>) the inventory calculated with Equation (<a href="#FD56-risks-10-00160" class="html-disp-formula">56</a>), using the parameters in <a href="#risks-10-00160-t007" class="html-table">Table 7</a>. (<b>b</b>) the optimal acquisition value calculated with Equation (<a href="#FD57-risks-10-00160" class="html-disp-formula">57</a>), using the parameters in <a href="#risks-10-00160-t007" class="html-table">Table 7</a>.</p>
Full article ">Figure 8
<p>Agent’s optimal depth for selling LOs and Agent’s optimal depth for buying LOs for Apple stocks. (<b>a</b>) the agent’s optimal depth calculated with Equation (<a href="#FD94-risks-10-00160" class="html-disp-formula">94</a>), using the parameters in <a href="#risks-10-00160-t008" class="html-table">Table 8</a> at time zero. (<b>b</b>) the agent’s optimal depth calculated with Equation (<a href="#FD94-risks-10-00160" class="html-disp-formula">94</a>), using the parameters in <a href="#risks-10-00160-t008" class="html-table">Table 8</a> in 3 dimensions. (<b>c</b>) the agent’s optimal depth calculated with Equation (<a href="#FD95-risks-10-00160" class="html-disp-formula">95</a>), using the parameters in <a href="#risks-10-00160-t008" class="html-table">Table 8</a> at time zero. (<b>d</b>) the agent’s optimal depth calculated with Equation (<a href="#FD95-risks-10-00160" class="html-disp-formula">95</a>), using the parameters in <a href="#risks-10-00160-t008" class="html-table">Table 8</a> in 3 dimensions.</p>
Full article ">Figure 9
<p>Agent’s optimal depth for selling LOs and agent’s optimal depth for buying LOs for Amazon stocks. (<b>a</b>) agent’s optimal depth calculated with Equation (<a href="#FD94-risks-10-00160" class="html-disp-formula">94</a>), using the parameters in <a href="#risks-10-00160-t009" class="html-table">Table 9</a> at time zero. (<b>b</b>) agent’s optimal depth calculated with Equation (<a href="#FD94-risks-10-00160" class="html-disp-formula">94</a>), using the parameters in <a href="#risks-10-00160-t009" class="html-table">Table 9</a> in 3 dimensions. (<b>c</b>) agent’s optimal depth calculated with Equation (<a href="#FD95-risks-10-00160" class="html-disp-formula">95</a>), using the parameters in <a href="#risks-10-00160-t009" class="html-table">Table 9</a> at time zero. (<b>d</b>) agent’s optimal depth calculated with Equation (<a href="#FD95-risks-10-00160" class="html-disp-formula">95</a>), using the parameters in <a href="#risks-10-00160-t009" class="html-table">Table 9</a> in 3 dimensions.</p>
Full article ">Figure 10
<p>Agent’s optimal depth for selling LOs and agent’s optimal depth for buying LOs for Google stocks. (<b>a</b>) agent’s optimal depth calculated with Equation (<a href="#FD94-risks-10-00160" class="html-disp-formula">94</a>), using the parameters in <a href="#risks-10-00160-t010" class="html-table">Table 10</a> at time zero. (<b>b</b>) agent’s optimal depth calculated with Equation (<a href="#FD94-risks-10-00160" class="html-disp-formula">94</a>), using the parameters in <a href="#risks-10-00160-t010" class="html-table">Table 10</a> in 3 dimensions. (<b>c</b>) agent’s optimal depth calculated with Equation (<a href="#FD95-risks-10-00160" class="html-disp-formula">95</a>), using the parameters in <a href="#risks-10-00160-t010" class="html-table">Table 10</a> at time zero. (<b>d</b>) agent’s optimal depth calculated with Equation (<a href="#FD95-risks-10-00160" class="html-disp-formula">95</a>), using the parameters in <a href="#risks-10-00160-t010" class="html-table">Table 10</a> in 3 dimensions.</p>
Full article ">
13 pages, 403 KiB  
Article
Investor Segments by Perceived Project Risk and Their Characteristics Based on Primary Research Results
by Mónika Garai-Fodor, Tibor Pál Szemere and Ágnes Csiszárik-Kocsir
Risks 2022, 10(8), 159; https://doi.org/10.3390/risks10080159 - 4 Aug 2022
Cited by 8 | Viewed by 2036
Abstract
Our research focuses on investment initiatives. The perceived risks are analysed from the consumer’s viewpoint, i.e., the client’s perspective, from the standpoint of the project. In the literature, there are several risk interpretations and classifications. We assumed it could be interesting and valuable [...] Read more.
Our research focuses on investment initiatives. The perceived risks are analysed from the consumer’s viewpoint, i.e., the client’s perspective, from the standpoint of the project. In the literature, there are several risk interpretations and classifications. We assumed it could be interesting and valuable to approach investment projects from a consumer-oriented viewpoint, considering that the perceived and consumer-identified set of risks is a major determinant of the outcome of a decision. In addition to relevant secondary sources, we also present partial results of our primary research project. A pre-tested, standardised online questionnaire was employed in the primary study, using a snowball sampling approach generating 1545 evaluable questionnaires. As a result of the research, we were able to segment the customer (investor) target groups into various categories depending on the perceived project risk. We have established the orientation directions along which these segments may well be meaningfully described in terms of perceived investment risk concerns and socio-demographic characteristics that influence cluster membership. In our opinion, the findings may be a useful source of information for investment project developers looking to identify consumer groups based on risk perception and build project solutions for them. Full article
(This article belongs to the Special Issue Quantitative Risk Management in Agribusiness)
13 pages, 1580 KiB  
Article
Predicting Co-Movement of Banking Stocks Using Orthogonal GARCH
by Apriani Dorkas Rambu Atahau, Robiyanto Robiyanto and Andrian Dolfriandra Huruta
Risks 2022, 10(8), 158; https://doi.org/10.3390/risks10080158 - 2 Aug 2022
Cited by 2 | Viewed by 1817
Abstract
This study investigates the application of orthogonal generalized auto-regressive conditional heteroscedasticity (OGARCH) in predicting the co-movement of banking sector stocks in Indonesia. All state-owned banking sector stocks in Indonesia were studied using daily data from January 2013 to December 2019. The findings indicate [...] Read more.
This study investigates the application of orthogonal generalized auto-regressive conditional heteroscedasticity (OGARCH) in predicting the co-movement of banking sector stocks in Indonesia. All state-owned banking sector stocks in Indonesia were studied using daily data from January 2013 to December 2019. The findings indicate that the OGARCH method can simplify the covariance matrix. Most state-owned banking stocks in the banking sector have a similar principal component influencing their conditional variance. Nonetheless, one stock has different principal components. The findings imply that combining the state-owned banking stocks with different principal components effectively reduces the risk of state-owned banking stock portfolios. Full article
Show Figures

Figure 1

Figure 1
<p>Research flow diagram.</p>
Full article ">Figure 2
<p>Scree plot and eigenvalue cumulative proportion.</p>
Full article ">Figure 3
<p>Multiple graphs for IRFs.</p>
Full article ">Figure 4
<p>Combined graphs for IRFs.</p>
Full article ">
19 pages, 425 KiB  
Article
Impact of Capital Structure on Profitability: Panel Data Evidence of the Telecom Industry in the United States
by Houshang Habibniya, Suzan Dsouza, Mustafa Raza Rabbani, Nishad Nawaz and Rezart Demiraj
Risks 2022, 10(8), 157; https://doi.org/10.3390/risks10080157 - 2 Aug 2022
Cited by 17 | Viewed by 7390
Abstract
Debt finance, when considered a source of finance, always leads to financial risk; however, it is also considered a source of increased profitability in the normal business scenario. It has always been challenging to find the correct debt equity combination. In the discussed [...] Read more.
Debt finance, when considered a source of finance, always leads to financial risk; however, it is also considered a source of increased profitability in the normal business scenario. It has always been challenging to find the correct debt equity combination. In the discussed sample of the telecom industry in the USA, an abnormally high total liability-to-total assets ratio was observed. Thus, it is inclined to investigate the capital structure (CapSt) effect on firms’ profitability. By taking annual data of the telecom industry from 2012 to 2020 in the USA, unbalanced cross-sectional data (panel data) comprising 421 firm-year observations for 72 firms were studied using pooled panel regression, univariate analysis, correlation, and descriptive statistics models. We decided to test the impact of CapSt (Total Liabilities to Total Assets (TLsTAs) and Total Equity to Total Assets (TETAs)) on the profitability (Return on Assets (ROA) and Return on Equity (ROE)) of firms in the telecommunication industry in the USA. The results reveal that the ratio of TLsTAs has a significant impact on ROA, and TETAs has a significant impact on ROA. However, TLsTAs and TETAs have no impact on ROE. Full article
27 pages, 586 KiB  
Article
Probability Density of Lognormal Fractional SABR Model
by Jiro Akahori, Xiaoming Song and Tai-Ho Wang
Risks 2022, 10(8), 156; https://doi.org/10.3390/risks10080156 - 2 Aug 2022
Cited by 1 | Viewed by 1809
Abstract
Instantaneous volatility of logarithmic return in the lognormal fractional SABR model is driven by the exponentiation of a correlated fractional Brownian motion. Due to the mixed nature of driving Brownian and fractional Brownian motions, probability density for such a model is less studied [...] Read more.
Instantaneous volatility of logarithmic return in the lognormal fractional SABR model is driven by the exponentiation of a correlated fractional Brownian motion. Due to the mixed nature of driving Brownian and fractional Brownian motions, probability density for such a model is less studied in the literature. We show in this paper a bridge representation for the joint density of the lognormal fractional SABR model in a Fourier space. Evaluating the bridge representation along a properly chosen deterministic path yields a small time asymptotic expansion to the leading order for the probability density of the fractional SABR model. A direct generalization of the representation of joint density often leads to a heuristic derivation of the large deviations principle for joint density in a small time. Approximation of implied volatility is readily obtained by applying the Laplace asymptotic formula to the call or put prices and comparing coefficients. Full article
Show Figures

Figure 1

Figure 1
<p>The contour plots. Parameters <math display="inline"><semantics> <mrow> <mi>ρ</mi> <mo>=</mo> <mo>−</mo> <mn>0.7</mn> </mrow> </semantics></math>, <math display="inline"><semantics> <mrow> <mi>ν</mi> <mo>=</mo> <mn>1</mn> </mrow> </semantics></math>, <math display="inline"><semantics> <mrow> <msub> <mi>y</mi> <mn>0</mn> </msub> <mo>=</mo> <mn>1</mn> </mrow> </semantics></math>, <math display="inline"><semantics> <mrow> <mi>t</mi> <mo>=</mo> <mn>0.5</mn> </mrow> </semantics></math>. <math display="inline"><semantics> <mrow> <mi>H</mi> <mo>=</mo> <mn>0.75</mn> </mrow> </semantics></math> on the <b>right</b>; <math display="inline"><semantics> <mrow> <mi>H</mi> <mo>=</mo> <mn>0.25</mn> </mrow> </semantics></math>, on the <b>left</b>.</p>
Full article ">Figure 2
<p>The plot on the <b>left</b> shows the approximate implied volatility curves versus logmoneyness with time to expiry <math display="inline"><semantics> <mrow> <mi>t</mi> <mo>=</mo> <mn>1</mn> </mrow> </semantics></math> produced by (<a href="#FD20-risks-10-00156" class="html-disp-formula">20</a>) (in blue) the SABR Formula (<a href="#FD3-risks-10-00156" class="html-disp-formula">3</a>) (in red). Parameters are set as <math display="inline"><semantics> <mrow> <mi>ρ</mi> <mo>=</mo> <mo>−</mo> <mn>0.06867</mn> </mrow> </semantics></math>, <math display="inline"><semantics> <mrow> <mi>ν</mi> <mo>=</mo> <mn>0.5778</mn> </mrow> </semantics></math>, <math display="inline"><semantics> <mrow> <msub> <mi>a</mi> <mn>0</mn> </msub> <mo>=</mo> <mn>0.13927</mn> </mrow> </semantics></math>. The plot on the <b>right</b> shows the difference between the two curves.</p>
Full article ">Figure 3
<p>The implied volatility curves for <math display="inline"><semantics> <mrow> <mi>t</mi> <mo>=</mo> <mn>0.01</mn> </mrow> </semantics></math> on the <b>left</b>, <math display="inline"><semantics> <mrow> <mi>t</mi> <mo>=</mo> <mn>1</mn> </mrow> </semantics></math> on the <b>right</b>. Parameters are set as <math display="inline"><semantics> <mrow> <mi>ρ</mi> <mo>=</mo> <mo>−</mo> <mn>0.06867</mn> </mrow> </semantics></math>, <math display="inline"><semantics> <mrow> <mi>ν</mi> <mo>=</mo> <mn>0.5778</mn> </mrow> </semantics></math>, <math display="inline"><semantics> <mrow> <msub> <mi>a</mi> <mn>0</mn> </msub> <mo>=</mo> <mn>0.13927</mn> </mrow> </semantics></math>. <math display="inline"><semantics> <mrow> <mi>H</mi> <mo>=</mo> <mn>0.1</mn> </mrow> </semantics></math> in red, <math display="inline"><semantics> <mrow> <mi>H</mi> <mo>=</mo> <mn>0.3</mn> </mrow> </semantics></math> in orange, <math display="inline"><semantics> <mrow> <mi>H</mi> <mo>=</mo> <mfrac> <mn>1</mn> <mn>2</mn> </mfrac> </mrow> </semantics></math> in green, <math display="inline"><semantics> <mrow> <mi>H</mi> <mo>=</mo> <mn>0.7</mn> </mrow> </semantics></math> in blue, <math display="inline"><semantics> <mrow> <mi>H</mi> <mo>=</mo> <mn>0.9</mn> </mrow> </semantics></math> in purple.</p>
Full article ">
16 pages, 647 KiB  
Review
How Do Life Insurers Respond to a Prolonged Low Interest Rate Environment? A Literature Review
by Wilaiporn Suwanmalai and Simon Zaby
Risks 2022, 10(8), 155; https://doi.org/10.3390/risks10080155 - 2 Aug 2022
Cited by 2 | Viewed by 4091
Abstract
Life insurers, whose contractual liabilities include providing minimum guaranteed interest rates to policyholders, are significantly affected by persistently low interest rates. Hence, this study reviews the literature on the prolonged low interest rate environment and its impact on the life insurance industry, incorporating [...] Read more.
Life insurers, whose contractual liabilities include providing minimum guaranteed interest rates to policyholders, are significantly affected by persistently low interest rates. Hence, this study reviews the literature on the prolonged low interest rate environment and its impact on the life insurance industry, incorporating multiple perspectives and practices in different countries. The effect of low interest rates on life insurance products depends on the sensitivity of the interest rate of each product type and the level of minimum interest rate guarantee. In addition, their impacts on the valuation of life insurance companies depend on shifts in the valuation interest rate, which is used to discount the present value of future benefits, as well as the financial and solvency issues faced by insurers. Overall, the literature suggests that insurers need both short- and long-term solutions to respond to a prolonged low interest rate environment. Full article
Show Figures

Figure 1

Figure 1
<p>Historical US Interest Rates (adapted from <a href="#B38-risks-10-00155" class="html-bibr">Trading Economics 2022</a>).</p>
Full article ">Figure 2
<p>Customers’ Life Cycle Needs (adapted from <a href="#B17-risks-10-00155" class="html-bibr">Focarelli 2015</a>).</p>
Full article ">
25 pages, 646 KiB  
Article
Robust Classification via Support Vector Machines
by Alexandru V. Asimit, Ioannis Kyriakou, Simone Santoni, Salvatore Scognamiglio and Rui Zhu
Risks 2022, 10(8), 154; https://doi.org/10.3390/risks10080154 - 1 Aug 2022
Cited by 3 | Viewed by 2814
Abstract
Classification models are very sensitive to data uncertainty, and finding robust classifiers that are less sensitive to data uncertainty has raised great interest in the machine learning literature. This paper aims to construct robust support vector machine classifiers under feature data uncertainty via [...] Read more.
Classification models are very sensitive to data uncertainty, and finding robust classifiers that are less sensitive to data uncertainty has raised great interest in the machine learning literature. This paper aims to construct robust support vector machine classifiers under feature data uncertainty via two probabilistic arguments. The first classifier, Single Perturbation, reduces the local effect of data uncertainty with respect to one given feature and acts as a local test that could confirm or refute the presence of significant data uncertainty for that particular feature. The second classifier, Extreme Empirical Loss, aims to reduce the aggregate effect of data uncertainty with respect to all features, which is possible via a trade-off between the number of prediction model violations and the size of these violations. Both methodologies are computationally efficient and our extensive numerical investigation highlights the advantages and possible limitations of the two robust classifiers on synthetic and real-life insurance claims and mortgage lending data, but also the fairness of an automatized decision based on our classifier. Full article
(This article belongs to the Special Issue Data Science in Insurance)
Show Figures

Figure 1

Figure 1
<p>Classification boundaries for five SVM classifiers if DU is induced by (<b>a</b>) normal distribution, (<b>b</b>) Student’s <span class="html-italic">t</span> distribution with 5 degrees of freedom and (<b>c</b>) Student’s <span class="html-italic">t</span> distribution with 1 degree of freedom.</p>
Full article ">Figure 1 Cont.
<p>Classification boundaries for five SVM classifiers if DU is induced by (<b>a</b>) normal distribution, (<b>b</b>) Student’s <span class="html-italic">t</span> distribution with 5 degrees of freedom and (<b>c</b>) Student’s <span class="html-italic">t</span> distribution with 1 degree of freedom.</p>
Full article ">Figure 2
<p>ME loan amount deviations from the population mean based on full data and sub-populations with low/high minority and low/high income percentages.</p>
Full article ">Figure 3
<p>VT loan amount deviations from the population mean based on full data and sub-populations with low/high minority and low/high income percentages.</p>
Full article ">
8 pages, 351 KiB  
Article
A Comparison of Macaulay Approximations
by Stefanos C. Orfanos
Risks 2022, 10(8), 153; https://doi.org/10.3390/risks10080153 - 29 Jul 2022
Cited by 1 | Viewed by 2038
Abstract
We discuss several known formulas that use the Macaulay duration and convexity of commonly used cash flow streams to approximate their net present value, and compare them with a new approximation formula that involves hyperbolic functions. Our objective is to assess the reliability [...] Read more.
We discuss several known formulas that use the Macaulay duration and convexity of commonly used cash flow streams to approximate their net present value, and compare them with a new approximation formula that involves hyperbolic functions. Our objective is to assess the reliability of each approximation formula under different scenarios. The results in this note should be of interest to actuarial candidates and educators as well as analysts working in all areas of actuarial practice. Full article
(This article belongs to the Special Issue Actuarial Mathematics and Risk Management)
16 pages, 510 KiB  
Article
Multiple Bonus–Malus Scale Models for Insureds of Different Sizes
by Jean-Philippe Boucher
Risks 2022, 10(8), 152; https://doi.org/10.3390/risks10080152 - 28 Jul 2022
Cited by 3 | Viewed by 1814
Abstract
How to consider the a priori risks in experience-rating models has been questioned in the actuarial community for a long time. Classic past-claim-rating models, such as the Buhlmann–Straub credibility model, normalize the past experience of each insured before applying claim penalties. On the [...] Read more.
How to consider the a priori risks in experience-rating models has been questioned in the actuarial community for a long time. Classic past-claim-rating models, such as the Buhlmann–Straub credibility model, normalize the past experience of each insured before applying claim penalties. On the other hand, classic Bonus–Malus Scales (BMS) models generate the same surcharges and the same discounts for all insureds because the transition rules within the class system do not depend on the a priori risk. Despite the quality of prediction of the BMS models, this experience-rating model could appear unfair to many insureds and regulators because it does not recognize the initial risk of the insured. In this paper, we propose the creation of different BMSs for each type of insured using recursive partitioning methods. We apply this approach to real data for the farm insurance product of a major Canadian insurance company with widely varying sizes of insureds. Because the a priori risk can change over time, a study of the possible transitions between different BMS models is also performed. Full article
(This article belongs to the Special Issue Data Science in Insurance)
Show Figures

Figure 1

Figure 1
<p>Insureds with claim experience, with and without limits <math display="inline"><semantics> <mrow> <msub> <mo>ℓ</mo> <mrow> <mi>m</mi> <mi>i</mi> <mi>n</mi> </mrow> </msub> <mo>,</mo> <msub> <mo>ℓ</mo> <mrow> <mi>m</mi> <mi>a</mi> <mi>x</mi> </mrow> </msub> </mrow> </semantics></math>.</p>
Full article ">Figure 2
<p>Distribution of the number of items by contract.</p>
Full article ">Figure 3
<p>Average number of insured items by BMS level (<b>left</b>) and average BMS level by number of insured items (<b>right</b>).</p>
Full article ">Figure 4
<p>Recursive partitioning by the number of insured items.</p>
Full article ">Figure 5
<p>Mean of all covariates used by groups (dashed line for the mean of the whole portfolio).</p>
Full article ">Figure 6
<p>Proportion of each group within BMS levels for the BMS model.</p>
Full article ">Figure 7
<p>Distribution of the BMS relativities for each group (<b>left</b>: original BMS, <b>right</b>: BMS by group).</p>
Full article ">Figure 8
<p>Relativity impact of the transition from one group to another.</p>
Full article ">
14 pages, 2645 KiB  
Article
An Efficient Method for Pricing Analysis Based on Neural Networks
by Yaser Ahmad Arabyat, Ahmad Ali AlZubi, Dyala M. Aldebei and Samerra’a Ziad Al-oqaily
Risks 2022, 10(8), 151; https://doi.org/10.3390/risks10080151 - 28 Jul 2022
Cited by 3 | Viewed by 2047
Abstract
The revolution in neural networks is a significant technological shift. It has an impact on not only all aspects of production and life, but also economic research. Neural networks have not only been a significant tool for economic study in recent years, but [...] Read more.
The revolution in neural networks is a significant technological shift. It has an impact on not only all aspects of production and life, but also economic research. Neural networks have not only been a significant tool for economic study in recent years, but have also become an important topic of economics research, resulting in a large body of literature. The stock market is an important part of the country’s economic development, as well as our daily lives. Large dimensions and multiple collinearity characterize the stock index data. To minimize the number of dimensions in the data, multiple collinearity should be removed, and the stock price can then be forecast. To begin, a deep autoencoder based on the Restricted Boltzmann machine is built to encode high-dimensional input into low-dimensional space. Then, using a BP neural network, a regression model is created between low-dimensional coding sequence and stock price. The deep autoencoder’s capacity to extract this feature is superior to that of principal component analysis and factor analysis, according to the findings of the experiments. Utilizing the coded data, the proposed model can lower the computational cost and achieve higher prediction accuracy than using the original high-dimensional data. Full article
(This article belongs to the Special Issue Data Analysis for Risk Management – Economics, Finance and Business)
Show Figures

Figure 1

Figure 1
<p>Autoencoder structure.</p>
Full article ">Figure 2
<p>The structure of a DAE.</p>
Full article ">Figure 3
<p>Proposed model based on RBM.</p>
Full article ">Figure 4
<p>RBM model structure diagram.</p>
Full article ">Figure 5
<p>Illustration of BP neural network architecture.</p>
Full article ">Figure 6
<p>Coding sequence of stock data after dimensionality reduction.</p>
Full article ">Figure 7
<p>The results of predicting stock prices with different coding sequences.</p>
Full article ">
23 pages, 2042 KiB  
Article
The Determinant of Sukuk Rating: Agency Theory and Asymmetry Theory Perspectives
by Bedjo Santoso, Widodo Widodo, Muhammad Taufiq Akbar, Khaliq Ahmad and Rahmat Heru Setianto
Risks 2022, 10(8), 150; https://doi.org/10.3390/risks10080150 - 27 Jul 2022
Cited by 1 | Viewed by 3470
Abstract
This research aims to develop a determinant variable of the Sukuk rating derived from agency and asymmetry theories. This research is essential because Sukuk or Islamic Bonds is needed in Indonesia, with 85% of its population out of 320 million people being Muslim. [...] Read more.
This research aims to develop a determinant variable of the Sukuk rating derived from agency and asymmetry theories. This research is essential because Sukuk or Islamic Bonds is needed in Indonesia, with 85% of its population out of 320 million people being Muslim. Many studies on the determinants of Sukuk ratings have been conducted and are still trending research. However, they are rarely observed from the perspective of agency and asymmetry theories, which are the basis for the relationship between principals and investors. The relationship produces three primary variables in the Sukuk rating determinants, namely financial disclosure quality (FDQ), accounting-based risks (ABRs), and earnings management (EM). This research used 570 panel annual reports from 2018 to 2020 and involved 190 firm-issued Sukuk. Meanwhile, the variables’ reflection used several indicators. SEM (structural equation modeling) was used for the statistical analysis with the help of PLS—primarily smart PLS version. The results exposed that FDQ, ABRs, and EM derived from the two theories are affected significantly by the determinant of the Sukuk rating. In comparison, earnings management successfully moderates the FDQ and Sukuk rating variables but fails to moderate the ABRs to the Sukuk rating. The conclusion also revealed that these relationship theories are fundamental in developing the Sukuk rating. However, the variables should be more complex for future research. With significant results, the agency and asymmetry theories proxied by three variables can explain the Sukuk rating. Accordingly, these theories are relevant as approaches in determining important factors of the Sukuk rating. Full article
Show Figures

Figure 1

Figure 1
<p>Theoretical Models; the Relationship among <span class="html-italic">Sukuk</span> Ratings and Asymmetry, Agency, and Signaling Theories.</p>
Full article ">Figure 2
<p>Theoretical Framework: Determinant of <span class="html-italic">Sukuk</span> Rating with Earnings Management as an Intervening Variable.</p>
Full article ">Figure 3
<p>Outer and Inner Model.</p>
Full article ">Figure 4
<p>Sobel Test Result of FDQ → Earnings Management → <span class="html-italic">Sukuk</span> Rating. Source: Sobel Test Output, available online: <a href="https://www.danielsoper.com/statcalc/calculator.aspx?id=31" target="_blank">https://www.danielsoper.com/statcalc/calculator.aspx?id=31</a>, accessed on 5 January 2022.</p>
Full article ">Figure 5
<p>Sobel Test Result ABRs → Earnings Management → <span class="html-italic">Sukuk</span> Rating. Source: Sobel Test Output, available online: <a href="https://www.danielsoper.com/statcalc/calculator.aspx?id=31" target="_blank">https://www.danielsoper.com/statcalc/calculator.aspx?id=31</a>, accessed on 5 January 2022.</p>
Full article ">Figure 6
<p>The Empirical Research Model.</p>
Full article ">
13 pages, 599 KiB  
Article
Accounting Beta as an Indicator of Risk Measurement: The Case of the Casablanca Stock Exchange
by Anouar Faiteh and Mohammed Rachid Aasri
Risks 2022, 10(8), 149; https://doi.org/10.3390/risks10080149 - 26 Jul 2022
Cited by 7 | Viewed by 3153
Abstract
The problem of determining the cost of equity is crucial to the development of organizations. It is an essential means of calculating value creation. The financial literature has proposed several models for estimating the cost of equity, such as the capital asset pricing [...] Read more.
The problem of determining the cost of equity is crucial to the development of organizations. It is an essential means of calculating value creation. The financial literature has proposed several models for estimating the cost of equity, such as the capital asset pricing model (CAPM). However, this model is only used for listed companies, and cannot be used for unlisted companies. To remedy this situation, alternative measures of the cost of equity have emerged, such as accounting beta. The main objective of this research was to explore the relationship between market beta and accounting beta calculated using ROA, ROE and net income to demonstrate the ability of accounting beta to measure risk for unlisted companies. To carry out this study, we exploited data from a sample of 49 companies listed on the Casablanca Stock Exchange during the period of 2015–2019. We used panel data econometrics to empirically test the research hypotheses. The results show that the accounting beta calculated using ROA and ROE significantly represents the market beta and is a satisfactory solution to calculate the cost of equity of unlisted firms. The results of the study contribute to the existing literature on the cost of capital by reinforcing the role of accounting beta as a solution for determining the cost of equity and therefore the creation of value for the organization. Full article
Show Figures

Figure 1

Figure 1
<p>Estimating approaches of the cost of capital for unlisted companies.</p>
Full article ">
23 pages, 648 KiB  
Article
Pricing Energy Derivatives in Markets Driven by Tempered Stable and CGMY Processes of Ornstein–Uhlenbeck Type
by Piergiacomo Sabino
Risks 2022, 10(8), 148; https://doi.org/10.3390/risks10080148 - 26 Jul 2022
Cited by 4 | Viewed by 1724
Abstract
In this study, we consider the pricing of energy derivatives when the evolution of spot prices follows a tempered stable or a CGMY-driven Ornstein–Uhlenbeck process. To this end, we first calculate the characteristic function of the transition law of such processes in closed [...] Read more.
In this study, we consider the pricing of energy derivatives when the evolution of spot prices follows a tempered stable or a CGMY-driven Ornstein–Uhlenbeck process. To this end, we first calculate the characteristic function of the transition law of such processes in closed form. This result is instrumental for the derivation of nonarbitrage conditions such that the spot dynamics is consistent with the forward curve. Moreover, we also conceive efficient algorithms for the exact simulation of the skeleton of such processes and propose a novel procedure when they coincide with compound Poisson processes of Ornstein–Uhlenbeck type. We illustrate the applicability of the theoretical findings and the simulation algorithms in the context of pricing different contracts, namely strips of daily call options, Asian options with European style and swing options. Full article
Show Figures

Figure 1

Figure 1
<p>Call option values calculated with FFT and MC with <math display="inline"><semantics> <mrow> <mi>N</mi> <mo>=</mo> <msup> <mn>10</mn> <mn>5</mn> </msup> </mrow> </semantics></math>, <math display="inline"><semantics> <mrow> <mrow> <mo>(</mo> <mi>b</mi> <mo>,</mo> <msub> <mi>β</mi> <mi>p</mi> </msub> <mo>,</mo> <msub> <mi>β</mi> <mi>n</mi> </msub> <mo>,</mo> <msub> <mi>c</mi> <mi>p</mi> </msub> <mo>,</mo> <msub> <mi>c</mi> <mi>n</mi> </msub> <mo>)</mo> </mrow> <mo>=</mo> <mrow> <mo>(</mo> <mn>0.1</mn> <mo>,</mo> <mn>2.5</mn> <mo>,</mo> <mn>3.5</mn> <mo>,</mo> <mn>0.5</mn> <mo>,</mo> <mn>1</mn> <mo>)</mo> </mrow> </mrow> </semantics></math>, <math display="inline"><semantics> <mrow> <msub> <mi>α</mi> <mi>p</mi> </msub> <mo>=</mo> <msub> <mi>α</mi> <mi>n</mi> </msub> <mo>=</mo> <mn>0.5</mn> </mrow> </semantics></math>, <math display="inline"><semantics> <mrow> <mi>K</mi> <mo>=</mo> <mn>20</mn> </mrow> </semantics></math>. (<b>a</b>) Effect on the strike; (<b>b</b>) <math display="inline"><semantics> <mrow> <msub> <mi>c</mi> <mi>m</mi> </msub> <mrow> <mo>(</mo> <mi>K</mi> <mo>,</mo> <msub> <mi>t</mi> <mi>m</mi> </msub> <mo>)</mo> </mrow> <mo>,</mo> <mi>m</mi> <mo>=</mo> <mn>1</mn> <mo>,</mo> <mo>⋯</mo> <mo>,</mo> <mn>30</mn> </mrow> </semantics></math>.</p>
Full article ">Figure 2
<p>Day-ahead PSV prices.</p>
Full article ">Figure 3
<p>Detrending.</p>
Full article ">Figure 4
<p>Sample trajectories of OU-CGMY processes with <math display="inline"><semantics> <mrow> <mfenced separators="" open="(" close=")"> <mi>b</mi> <mo>,</mo> <mi>C</mi> <mo>,</mo> <mi>G</mi> <mo>,</mo> <mi>M</mi> </mfenced> <mo>=</mo> <mfenced separators="" open="(" close=")"> <mn>75.26</mn> <mo>,</mo> <mn>4.401</mn> <mo>,</mo> <mn>3.382</mn> <mo>,</mo> <mn>3.300</mn> </mfenced> </mrow> </semantics></math> and <math display="inline"><semantics> <mrow> <mi>Y</mi> <mo>∈</mo> <mo>{</mo> <mn>0.3</mn> <mo>,</mo> <mn>0.5</mn> <mo>,</mo> <mn>0.73</mn> <mo>,</mo> <mn>0.9</mn> <mo>}</mo> </mrow> </semantics></math>.</p>
Full article ">Figure 5
<p>Sample trajectories of OU-CGMY processes with <math display="inline"><semantics> <mrow> <mfenced separators="" open="(" close=")"> <mi>b</mi> <mo>,</mo> <mi>C</mi> <mo>,</mo> <mi>G</mi> <mo>,</mo> <mi>M</mi> </mfenced> <mo>=</mo> <mfenced separators="" open="(" close=")"> <mn>10</mn> <mo>,</mo> <mn>10</mn> <mo>,</mo> <mn>1.75</mn> <mo>,</mo> <mn>1.25</mn> </mfenced> </mrow> </semantics></math> and <math display="inline"><semantics> <mrow> <mi>Y</mi> <mo>∈</mo> <mo>{</mo> <mo>−</mo> <mn>0.3</mn> <mo>,</mo> <mo>−</mo> <mn>0.5</mn> <mo>,</mo> <mo>−</mo> <mn>0.7</mn> <mo>,</mo> <mo>−</mo> <mn>0.9</mn> <mo>}</mo> </mrow> </semantics></math>.</p>
Full article ">
24 pages, 4936 KiB  
Article
A New Fourier Approach under the Lee-Carter Model for Incorporating Time-Varying Age Patterns of Structural Changes
by Sixian Tang, Jackie Li and Leonie Tickle
Risks 2022, 10(8), 147; https://doi.org/10.3390/risks10080147 - 25 Jul 2022
Viewed by 1995
Abstract
The prediction of future mortality improvements is of substantial importance for areas such as population projection, government welfare policies, pension planning and annuity pricing. The Lee-Carter model is one of the widely applied mortality models proposed to capture and predict the trend in [...] Read more.
The prediction of future mortality improvements is of substantial importance for areas such as population projection, government welfare policies, pension planning and annuity pricing. The Lee-Carter model is one of the widely applied mortality models proposed to capture and predict the trend in mortality reductions. However, some studies have identified the presence of structural changes in historical mortality data, which makes the forecasting performance of mortality models sensitive to the calibration period. Although some attention has been paid to investigating the time or period effects of structural shifts, the potential time-varying age patterns are often overlooked. This paper proposes a new approach that applies a Fourier series with time-varying parameters to the age sensitivity factor in the Lee-Carter model to study the evolution of age effects. Since modelling the age effects is separated from modelling the period effects, the proposed model can incorporate these two sources of structural changes into mortality predictions. Our backtesting results suggest that structural shifts are present not only in the Lee-Carter mortality index over time, but also in the sensitivity to those time variations at different ages. Full article
(This article belongs to the Special Issue Risks: Feature Papers 2022)
Show Figures

Figure 1

Figure 1
<p>Age sensitivity factors under the Lee-Carter model estimated from sequential subsamples with a fixed sample size.</p>
Full article ">Figure 2
<p>Modelling process of Fourier parameters for the age sensitivity factors.</p>
Full article ">Figure 3
<p>Age sensitivity factors under the Lee-Carter model estimated from sequential subperiods (using the same set of mortality level and mortality index parameters). The legend <math display="inline"><semantics> <mrow> <mi>b</mi> <mrow> <mo>[</mo> <mrow> <mi>x</mi> <mo>,</mo> <mi>t</mi> </mrow> <mo>]</mo> </mrow> </mrow> </semantics></math> refers to the age response <math display="inline"><semantics> <mrow> <msub> <mi>β</mi> <mi>x</mi> </msub> </mrow> </semantics></math> calibrated on a subperiod ending in year <math display="inline"><semantics> <mi>t</mi> </semantics></math>.</p>
Full article ">Figure 4
<p>Curves of <math display="inline"><semantics> <mrow> <mi>sin</mi> <mrow> <mo>(</mo> <mrow> <mi>x</mi> <mo>+</mo> <msubsup> <mi>P</mi> <mi>t</mi> <mrow> <mrow> <mo>(</mo> <mi>i</mi> <mo>)</mo> </mrow> </mrow> </msubsup> </mrow> <mo>)</mo> </mrow> </mrow> </semantics></math> for different phase values. The left (right) column indicates possible shapes for the Fourier series before (after) the splitting age. The parts on the left of the two black dashed (vertical) lines in the left and right plots denote the shape of a quarter and half of a complete cycle, respectively.</p>
Full article ">Figure 5
<p>Estimated (solid lines) and fitted (dashed lines) age sensitivity factor under the Lee-Carter model estimated from the latest 24-year subperiod. The blue (red) lines refer to fitted values using the Fourier (cubic-spline) method.</p>
Full article ">Figure 6
<p>Observed (blue lines) and projected (black lines) life expectancy at birth (<math display="inline"><semantics> <mrow> <msub> <mi>e</mi> <mn>0</mn> </msub> </mrow> </semantics></math>), calibrated on mortality data from the whole sample period. The solid lines correspond to forecasts under the original Lee-Carter model. The dashed and dotted lines refer to projections from the Fourier Lee-Carter model and cubic Lee-Carter model, respectively.</p>
Full article ">Figure 7
<p>Observed values (solid lines), projected values (dotted lines) and 95% prediction intervals (dashed lines) of life expectancies at birth (top panel) and age 60 (bottom panel), calibrated on years 1950–2001. The blue lines correspond to the projections from the original Lee-Carter model, and the red (grey) lines refer to the projections from the Fourier (cubic) Lee-Carter model.</p>
Full article ">Figure 8
<p>Parameter estimates of mortality index <math display="inline"><semantics> <mrow> <msub> <mi>k</mi> <mi>t</mi> </msub> </mrow> </semantics></math> under the original Lee-Carter model for the United Kingdom, calibrated on years 1950–2001. The red dashed line is based on two random walk processes connected at a breakpoint. The blue dashed line is based on a single random walk process over the whole fitting period.</p>
Full article ">Figure 9
<p>Observed values (solid lines), projected values (dotted lines), and 95% prediction intervals (dashed lines) of life expectancies at ages 0 (panel (<b>a</b>)) and 60 (panel (<b>b</b>)) for the United Kingdom, calibrated on years 1950–2001.</p>
Full article ">Figure 10
<p>Observed values (solid lines), projected values (dotted lines) and 95% prediction intervals (dashed lines) of life expectancies at birth (top panel) and age 60 (bottom panel), calibrated on years 1950-2001. The blue lines correspond to the projections from the original Lee-Carter model, and the red (grey) lines refer to the projections from the Fourier (cubic) Lee-Carter model. The mortality index is modelled as piecewise RWD.</p>
Full article ">Figure A1
<p>Age sensitivity factors under the Lee-Carter model estimated from sequential subperiods with different fixed lengths. The legend <math display="inline"><semantics> <mrow> <mi>b</mi> <mrow> <mo>[</mo> <mrow> <mi>x</mi> <mo>,</mo> <mi>t</mi> </mrow> <mo>]</mo> </mrow> </mrow> </semantics></math> refers to the age response <math display="inline"><semantics> <mrow> <msub> <mi>β</mi> <mi>x</mi> </msub> </mrow> </semantics></math> calibrated on a subperiod ending in year <math display="inline"><semantics> <mi>t</mi> </semantics></math>, <math display="inline"><semantics> <mrow> <mi>t</mi> <mo> </mo> <mi>e</mi> <mi>n</mi> <mi>d</mi> </mrow> </semantics></math> refers to the ending year of the entire sample period.</p>
Full article ">Figure A1 Cont.
<p>Age sensitivity factors under the Lee-Carter model estimated from sequential subperiods with different fixed lengths. The legend <math display="inline"><semantics> <mrow> <mi>b</mi> <mrow> <mo>[</mo> <mrow> <mi>x</mi> <mo>,</mo> <mi>t</mi> </mrow> <mo>]</mo> </mrow> </mrow> </semantics></math> refers to the age response <math display="inline"><semantics> <mrow> <msub> <mi>β</mi> <mi>x</mi> </msub> </mrow> </semantics></math> calibrated on a subperiod ending in year <math display="inline"><semantics> <mi>t</mi> </semantics></math>, <math display="inline"><semantics> <mrow> <mi>t</mi> <mo> </mo> <mi>e</mi> <mi>n</mi> <mi>d</mi> </mrow> </semantics></math> refers to the ending year of the entire sample period.</p>
Full article ">
11 pages, 373 KiB  
Article
The Credit Risk Problem—A Developing Country Case Study
by Doris Fejza, Dritan Nace and Orjada Kulla
Risks 2022, 10(8), 146; https://doi.org/10.3390/risks10080146 - 22 Jul 2022
Cited by 1 | Viewed by 3017
Abstract
Crediting represents one of the biggest risks faced by the banking sector, and especially by commercial banks. In the literature, there have been a number of studies concerning credit risk management, often involving credit scoring systems making use of machine learning (ML) techniques. [...] Read more.
Crediting represents one of the biggest risks faced by the banking sector, and especially by commercial banks. In the literature, there have been a number of studies concerning credit risk management, often involving credit scoring systems making use of machine learning (ML) techniques. However, the specificity of individual banks’ datasets means that choosing the techniques best suited to the needs of a given bank is far from straightforward. This study was motivated by the need by Credins Bank in Tirana for a reliable customer credit scoring tool suitable for use with that bank’s specific dataset. The dataset in question presents two substantial difficulties: first, a high degree of imbalance, and second, a high level of bias together with a low level of confidence in the recorded data. These shortcomings are largely due to the relatively young age of the private banking system in Albania, which did not exist as such until the early 2000s. They are shortcomings not encountered in the more conventional datasets that feature in the literature. The present study therefore has a real contribution to make to the existing corpus of research on credit scoring. The first important question to be addressed is the level of imbalance. In practice, the proportion of good customers may be many times that of bad customers, making the impact of unbalanced data on classification models an important element to be considered. The second question relates to bias or incompleteness in customer information in emerging and developing countries, where economies tend to function with a large amount of informality. Our objective in this study was identifying the most appropriate ML methods to handle Credins Bank’s specific dataset, and the various tests that we performed for this purpose yielded abundant numerical results. Our overall finding on the strength of these results was that this kind of dataset can best be dealt with using balanced random forest methods. Full article
Show Figures

Figure 1

Figure 1
<p>Distribution of good and bad customers with a least squares fuzzy SVM model.</p>
Full article ">Figure 2
<p>Distribution of good and bad customers with a balanced random forest model.</p>
Full article ">
15 pages, 796 KiB  
Article
Chain Reaction of Behavioral Bias and Risky Investment Decision in Indonesian Nascent Investors
by Rika Dwi Ayu Parmitasari, Alim Syariati and Sumarlin
Risks 2022, 10(8), 145; https://doi.org/10.3390/risks10080145 - 22 Jul 2022
Cited by 8 | Viewed by 2835
Abstract
Early investors possess unique sets of decision-making characteristics. They are more open to experience and eager to face risks. However, to the best of the authors’ knowledge, the discussions of nascent investors upon making the investment decision and its eroding biases were still [...] Read more.
Early investors possess unique sets of decision-making characteristics. They are more open to experience and eager to face risks. However, to the best of the authors’ knowledge, the discussions of nascent investors upon making the investment decision and its eroding biases were still elusive. The vital role of emotion as a bias in decision making was also inadequately addressed. This study enhanced behavioral finance knowledge by examining emotion’s role in regulating the illusion of control, overconfidence, and investors’ decision making. In total, 456 initial investors in Indonesia participated in online questionnaires, forming the data for covariance-based structural model analysis. This study found that emotion significantly increased the illusion of control, but not overconfidence or decision making, contrary to the bulk of previous studies. The illusion of control exhibited a substantial significant effect of as much as 86.4% toward overconfidence, followed by a considerable increase in decision making. The results of our study also pointed to the unique chain effects of biases affecting the decision-making process of nascent investors in the emerging market. This finding implied they possessed a unique bias mechanism in constructing their decision. Full article
Show Figures

Figure 1

Figure 1
<p>The Path Model (Source: Lisrel output).</p>
Full article ">
24 pages, 1278 KiB  
Article
Bivariate Copula Trees for Gross Loss Aggregation with Positively Dependent Risks
by Rafał Wójcik and Charlie Wusuo Liu
Risks 2022, 10(8), 144; https://doi.org/10.3390/risks10080144 - 22 Jul 2022
Viewed by 3373
Abstract
We propose several numerical algorithms to compute the distribution of gross loss in a positively dependent catastrophe insurance portfolio. Hierarchical risk aggregation is performed using bivariate copula trees. Six common parametric copula families are studied. At every branching node, the distribution of a [...] Read more.
We propose several numerical algorithms to compute the distribution of gross loss in a positively dependent catastrophe insurance portfolio. Hierarchical risk aggregation is performed using bivariate copula trees. Six common parametric copula families are studied. At every branching node, the distribution of a sum of risks is obtained by discrete copula convolution. This approach is compared to approximation by a weighted average of independent and comonotonic distributions. The weight is a measure of positive dependence through variance of the aggregate risk. During gross loss accumulation, the marginals are distorted by application of insurance financial terms, and the value of the mixing weight is impacted. To accelerate computations, we capture this effect using the ratio of standard deviations of pre-term and post-term risks, followed by covariance scaling. We test the performance of our algorithms using three examples of complex insurance portfolios subject to hurricane and earthquake catastrophes. Full article
Show Figures

Figure 1

Figure 1
<p>Examples of typical supermodular functions used in catastrophe insurance loss aggregation. Red surface represents <math display="inline"><semantics> <mrow> <mi>g</mi> <mrow> <mo>(</mo> <msub> <mi>x</mi> <mn>1</mn> </msub> <mo>,</mo> <msub> <mi>x</mi> <mn>2</mn> </msub> <mo>)</mo> </mrow> <mo>=</mo> <msub> <mi>x</mi> <mn>1</mn> </msub> <mo>+</mo> <msub> <mi>x</mi> <mn>2</mn> </msub> </mrow> </semantics></math>. Plotted in blue are (<b>A</b>) <math display="inline"><semantics> <mrow> <mi>g</mi> <mrow> <mo>(</mo> <msub> <mi>x</mi> <mn>1</mn> </msub> <mo>,</mo> <msub> <mi>x</mi> <mn>2</mn> </msub> <mo>)</mo> </mrow> <mo>=</mo> <msub> <mrow> <mo>(</mo> <msub> <mi>x</mi> <mn>1</mn> </msub> <mo>+</mo> <msub> <mi>x</mi> <mn>2</mn> </msub> <mo>,</mo> <mn>3</mn> <mo>)</mo> </mrow> <mo>+</mo> </msub> </mrow> </semantics></math>, (<b>B</b>) <math display="inline"><semantics> <mrow> <mi>g</mi> <mrow> <mo>(</mo> <msub> <mi>x</mi> <mn>1</mn> </msub> <mo>,</mo> <msub> <mi>x</mi> <mn>2</mn> </msub> <mo>)</mo> </mrow> <mo>=</mo> <mo movablelimits="true" form="prefix">min</mo> <mrow> <mo>(</mo> <msub> <mrow> <mo>(</mo> <msub> <mi>x</mi> <mn>1</mn> </msub> <mo>−</mo> <mn>3</mn> <mo>)</mo> </mrow> <mo>+</mo> </msub> <mo>,</mo> <mn>5</mn> <mo>)</mo> </mrow> <mo>+</mo> <mo movablelimits="true" form="prefix">min</mo> <mrow> <mo>(</mo> <msub> <mrow> <mo>(</mo> <msub> <mi>x</mi> <mn>2</mn> </msub> <mo>−</mo> <mn>3</mn> <mo>)</mo> </mrow> <mo>+</mo> </msub> <mo>,</mo> <mn>5</mn> <mo>)</mo> </mrow> </mrow> </semantics></math> and (<b>C</b>) <math display="inline"><semantics> <mrow> <mi>g</mi> <mrow> <mo>(</mo> <msub> <mi>x</mi> <mn>1</mn> </msub> <mo>,</mo> <msub> <mi>x</mi> <mn>2</mn> </msub> <mo>)</mo> </mrow> <mo>=</mo> <msub> <mrow> <mo>(</mo> <mo movablelimits="true" form="prefix">min</mo> <mrow> <mo>(</mo> <msub> <mi>x</mi> <mn>1</mn> </msub> <mo>,</mo> <mn>3</mn> <mo>)</mo> </mrow> <mo>+</mo> <mo movablelimits="true" form="prefix">min</mo> <mrow> <mo>(</mo> <msub> <mi>x</mi> <mn>2</mn> </msub> <mo>,</mo> <mn>2</mn> <mo>)</mo> </mrow> <mo>,</mo> <mn>2</mn> <mo>)</mo> </mrow> <mo>+</mo> </msub> </mrow> </semantics></math>.</p>
Full article ">Figure 2
<p>Computing the sum of three risks using direct aggregation tree (<b>A</b>–<b>C</b>) and hierarchical aggregation tree with sequential topology (<b>D</b>–<b>G</b>) from ground-up loss perspective (left column) and gross loss perspective (middle and right columns). The branching nodes of hierarchical trees (black dots) represent summation of the incoming pairs of individual and/or cumulative risks. For gross loss perspective, transformation nodes (white dots) represent application of the financial terms <math display="inline"><semantics> <mrow> <mi>ϕ</mi> <mo>,</mo> <mi>ψ</mi> </mrow> </semantics></math> to individual and/or cumulative risks.</p>
Full article ">Figure 3
<p>An example of stop-loss order preservation under truncation transform. Here, <span class="html-italic">X</span> and <span class="html-italic">Y</span> are random variables with discrete marginals <math display="inline"><semantics> <msub> <mi>p</mi> <mi>X</mi> </msub> </semantics></math> and <math display="inline"><semantics> <msub> <mi>p</mi> <mi>Y</mi> </msub> </semantics></math> in (<b>A</b>,<b>B</b>), respectively. The distribution <math display="inline"><semantics> <msub> <mi>p</mi> <msup> <mi>S</mi> <mo>⊥</mo> </msup> </msub> </semantics></math> of the independent sum <math display="inline"><semantics> <mrow> <msup> <mi>S</mi> <mo>⊥</mo> </msup> <mo>=</mo> <msup> <mi>X</mi> <mo>⊥</mo> </msup> <mo>+</mo> <msup> <mi>Y</mi> <mo>⊥</mo> </msup> </mrow> </semantics></math> in (<b>C</b>) is obtained by discrete convolution (Algorithm A1 in <a href="#B50-risks-10-00144" class="html-bibr">Wójcik et al. 2019</a>), while the distribution <math display="inline"><semantics> <msub> <mi>p</mi> <msup> <mi>S</mi> <mo>+</mo> </msup> </msub> </semantics></math> of the comonotonic sum <math display="inline"><semantics> <mrow> <msup> <mi>S</mi> <mo>+</mo> </msup> <mo>=</mo> <msup> <mi>X</mi> <mo>+</mo> </msup> <mo>+</mo> <msup> <mi>Y</mi> <mo>+</mo> </msup> </mrow> </semantics></math> in (<b>D</b>) is computed using numerical quantile addition (Algorithm 6 in <a href="#B50-risks-10-00144" class="html-bibr">Wójcik et al. 2019</a>). The dashed vertical lines represent the truncation transform bounds <math display="inline"><semantics> <mrow> <mi>a</mi> <mo>=</mo> <mn>0.5</mn> </mrow> </semantics></math> and <math display="inline"><semantics> <mrow> <mi>b</mi> <mo>=</mo> <mn>1.75</mn> </mrow> </semantics></math>. In (<b>E</b>), the alignment of the corresponding cdfs <math display="inline"><semantics> <msub> <mi>P</mi> <msup> <mi>S</mi> <mo>⊥</mo> </msup> </msub> </semantics></math> and <math display="inline"><semantics> <msub> <mi>P</mi> <msup> <mi>S</mi> <mo>+</mo> </msup> </msub> </semantics></math> shows that <math display="inline"><semantics> <mrow> <msub> <mi>P</mi> <msup> <mi>S</mi> <mo>⊥</mo> </msup> </msub> <mrow> <mo>(</mo> <mi>b</mi> <mo>)</mo> </mrow> <mo>&gt;</mo> <msub> <mi>P</mi> <msup> <mi>S</mi> <mo>+</mo> </msup> </msub> <mrow> <mo>(</mo> <mi>b</mi> <mo>)</mo> </mrow> </mrow> </semantics></math> for <math display="inline"><semantics> <mrow> <mi>b</mi> <mo>=</mo> <mn>1.75</mn> </mrow> </semantics></math>, so (<a href="#FD29-risks-10-00144" class="html-disp-formula">29</a>) holds. This, together with the necessary condition (<a href="#FD28-risks-10-00144" class="html-disp-formula">28</a>), implies that the truncated cdfs in (<b>F</b>,<b>G</b>) characterize the stop-loss order <math display="inline"><semantics> <mrow> <msup> <mi>S</mi> <mo>⊥</mo> </msup> <mrow> <mo>(</mo> <mi>a</mi> <mo>,</mo> <mi>b</mi> <mo>)</mo> </mrow> <msub> <mo>≤</mo> <mrow> <mi>s</mi> <mi>l</mi> </mrow> </msub> <msup> <mi>S</mi> <mo>+</mo> </msup> <mrow> <mo>(</mo> <mi>a</mi> <mo>,</mo> <mi>b</mi> <mo>)</mo> </mrow> </mrow> </semantics></math>. In (<b>H</b>), the binary decision whether the necessary condition is true or false is plotted as a function of the truncation bounds <math display="inline"><semantics> <mrow> <mn>0</mn> <mo>≤</mo> <mi>a</mi> <mo>&lt;</mo> <mi>b</mi> <mo>≤</mo> <mn>2</mn> </mrow> </semantics></math>. The means <math display="inline"><semantics> <msub> <mi>μ</mi> <mrow> <msup> <mi>S</mi> <mo>⊥</mo> </msup> <mrow> <mo>(</mo> <mi>a</mi> <mo>,</mo> <mi>b</mi> <mo>)</mo> </mrow> </mrow> </msub> </semantics></math>, <math display="inline"><semantics> <msub> <mi>μ</mi> <mrow> <msup> <mi>S</mi> <mo>+</mo> </msup> <mrow> <mo>(</mo> <mi>a</mi> <mo>,</mo> <mi>b</mi> <mo>)</mo> </mrow> </mrow> </msub> </semantics></math> characterize the independent and comonotonic sums after application of the truncation transform. The red region is where the necessary condition holds. The black dot represents the actual truncation bounds used throughout this example. The impermissible region where <math display="inline"><semantics> <mrow> <mi>b</mi> <mo>&lt;</mo> <mi>a</mi> </mrow> </semantics></math> is plotted in grey.</p>
Full article ">Figure 4
<p>Three generic summation nodes: (<b>A</b>) ground-up node, (<b>B</b>) gross loss node and (<b>C</b>) back-allocated version of the gross loss node.</p>
Full article ">Figure 5
<p>Special cases of copula distributions: (<b>A</b>) the independence copula <math display="inline"><semantics> <mrow> <mi>C</mi> <mo>(</mo> <mi>u</mi> <mo>,</mo> <mi>v</mi> <mo>)</mo> <mo>=</mo> <mi>u</mi> <mi>v</mi> </mrow> </semantics></math>, (<b>B</b>) the comonotonicity copula <math display="inline"><semantics> <mrow> <mi>C</mi> <mo>(</mo> <mi>u</mi> <mo>,</mo> <mi>v</mi> <mo>)</mo> <mo>=</mo> <mo movablelimits="true" form="prefix">min</mo> <mrow> <mo>(</mo> <mi>u</mi> <mo>,</mo> <mi>v</mi> <mo>)</mo> </mrow> </mrow> </semantics></math> and (<b>C</b>) Fréchet copula <math display="inline"><semantics> <mrow> <mi>C</mi> <mo>(</mo> <mi>u</mi> <mo>,</mo> <mi>v</mi> <mo>)</mo> <mo>=</mo> <mo>(</mo> <mn>1</mn> <mo>−</mo> <mi>w</mi> <mo>)</mo> <mspace width="0.166667em"/> <mi>u</mi> <mi>v</mi> <mo>+</mo> <mi>w</mi> <mspace width="0.166667em"/> <mo movablelimits="true" form="prefix">min</mo> <mrow> <mo>(</mo> <mi>u</mi> <mo>,</mo> <mi>v</mi> <mo>)</mo> </mrow> </mrow> </semantics></math> for <math display="inline"><semantics> <mrow> <mi>w</mi> <mo>=</mo> <mn>0.5</mn> </mrow> </semantics></math>.</p>
Full article ">Figure 6
<p>Illustration of the copula decomposition: (<b>A</b>) Joe copula in <a href="#risks-10-00144-t001" class="html-table">Table 1</a> with <math display="inline"><semantics> <mrow> <mi>θ</mi> <mo>=</mo> <mn>0.07</mn> </mrow> </semantics></math> discretized on 11 × 11 grid, (<b>B</b>) Fréchet decomposition of Joe copula, (<b>C</b>) the bivariate pmf <math display="inline"><semantics> <msub> <mi>p</mi> <mrow> <mi>X</mi> <mo>,</mo> <mi>Y</mi> </mrow> </msub> </semantics></math> obtained by combining the discretized <math display="inline"><semantics> <mrow> <mi>G</mi> <mi>a</mi> <mi>m</mi> <mi>m</mi> <mi>a</mi> <mo>(</mo> <mn>5</mn> <mo>,</mo> <mn>1</mn> <mo>)</mo> </mrow> </semantics></math> marginals <math display="inline"><semantics> <msub> <mi>p</mi> <mi>X</mi> </msub> </semantics></math> and <math display="inline"><semantics> <msub> <mi>p</mi> <mi>Y</mi> </msub> </semantics></math> (black bars) using the discretized Joe copula and (<b>D</b>) Fréchet decomposition of <math display="inline"><semantics> <msub> <mi>p</mi> <mrow> <mi>X</mi> <mo>,</mo> <mi>Y</mi> </mrow> </msub> </semantics></math>.</p>
Full article ">Figure 7
<p>Actual (relative) execution time in nanoseconds for computing <math display="inline"><semantics> <msub> <mi>p</mi> <mrow> <msub> <mi>ϕ</mi> <mi>X</mi> </msub> <mrow> <mo>(</mo> <mi>X</mi> <mo>)</mo> </mrow> <mo>+</mo> <msub> <mi>ϕ</mi> <mi>Y</mi> </msub> <mrow> <mo>(</mo> <mi>Y</mi> <mo>)</mo> </mrow> </mrow> </msub> </semantics></math>. Here, the support of <span class="html-italic">X</span> is <math display="inline"><semantics> <mrow> <mi>Ran</mi> <mspace width="0.277778em"/> <mi>X</mi> <mo>=</mo> <mo>{</mo> <mn>0</mn> <mo>,</mo> <mn>0.1429</mn> <mo>,</mo> </mrow> </semantics></math><math display="inline"><semantics> <mrow> <mn>0.2857</mn> <mo>,</mo> </mrow> </semantics></math><math display="inline"><semantics> <mrow> <mn>0.4286</mn> <mo>,</mo> </mrow> </semantics></math><math display="inline"><semantics> <mrow> <mn>0.5714</mn> <mo>,</mo> </mrow> </semantics></math><math display="inline"><semantics> <mrow> <mn>0.7143</mn> <mo>,</mo> </mrow> </semantics></math><math display="inline"><semantics> <mrow> <mn>0.8571</mn> <mo>,</mo> </mrow> </semantics></math><math display="inline"><semantics> <mrow> <mn>1</mn> <mo>}</mo> </mrow> </semantics></math>, and the support of <span class="html-italic">Y</span> is <math display="inline"><semantics> <mrow> <mi>Ran</mi> <mspace width="0.277778em"/> <mi>Y</mi> <mo>=</mo> <mo>{</mo> <mn>0</mn> <mo>,</mo> </mrow> </semantics></math><math display="inline"><semantics> <mrow> <mn>0.1429</mn> <mo>,</mo> </mrow> </semantics></math><math display="inline"><semantics> <mrow> <mn>0.2857</mn> <mo>,</mo> </mrow> </semantics></math><math display="inline"><semantics> <mrow> <mn>0.4286</mn> <mo>,</mo> </mrow> </semantics></math><math display="inline"><semantics> <mrow> <mn>0.5714</mn> <mo>,</mo> <mn>0.7143</mn> <mo>,</mo> </mrow> </semantics></math><math display="inline"><semantics> <mrow> <mn>0.8571</mn> <mo>,</mo> </mrow> </semantics></math><math display="inline"><semantics> <mrow> <mn>1</mn> <mo>}</mo> </mrow> </semantics></math>, with probabilities <math display="inline"><semantics> <mrow> <mi>Ran</mi> <mspace width="0.277778em"/> <msub> <mi>p</mi> <mi>X</mi> </msub> <mrow> <mo>=</mo> <mo>{</mo> <mn>0.2327</mn> <mo>,</mo> </mrow> </mrow> </semantics></math><math display="inline"><semantics> <mrow> <mn>0.0268</mn> <mo>,</mo> </mrow> </semantics></math><math display="inline"><semantics> <mrow> <mn>0.0051</mn> <mo>,</mo> </mrow> </semantics></math><math display="inline"><semantics> <mrow> <mn>0.0493</mn> <mo>,</mo> </mrow> </semantics></math><math display="inline"><semantics> <mrow> <mn>0.3023</mn> <mo>,</mo> </mrow> </semantics></math><math display="inline"><semantics> <mrow> <mn>0.1834</mn> <mo>,</mo> </mrow> </semantics></math><math display="inline"><semantics> <mrow> <mn>0.0093</mn> <mo>,</mo> <mn>0.1911</mn> <mo>}</mo> </mrow> </semantics></math> and <math display="inline"><semantics> <mrow> <mi>Ran</mi> <mspace width="0.277778em"/> <msub> <mi>p</mi> <mi>Y</mi> </msub> <mrow> <mo>=</mo> <mo>{</mo> <mn>0.1730</mn> <mo>,</mo> </mrow> </mrow> </semantics></math><math display="inline"><semantics> <mrow> <mn>0.0666</mn> <mo>,</mo> </mrow> </semantics></math><math display="inline"><semantics> <mrow> <mn>0.3864</mn> <mo>,</mo> </mrow> </semantics></math><math display="inline"><semantics> <mrow> <mn>0.1648</mn> <mo>,</mo> </mrow> </semantics></math><math display="inline"><semantics> <mrow> <mn>0.0021</mn> <mo>,</mo> </mrow> </semantics></math><math display="inline"><semantics> <mrow> <mn>0.0703</mn> <mo>,</mo> </mrow> </semantics></math><math display="inline"><semantics> <mrow> <mn>0.0871</mn> <mo>,</mo> </mrow> </semantics></math><math display="inline"><semantics> <mrow> <mn>0.0497</mn> <mo>}</mo> </mrow> </semantics></math>. Correlation values are <math display="inline"><semantics> <mrow> <mi>ρ</mi> <mo>(</mo> <mi>X</mi> <mo>,</mo> <mi>Y</mi> <mo>)</mo> <mo>=</mo> <mo>{</mo> <mn>0</mn> <mo>,</mo> </mrow> </semantics></math><math display="inline"><semantics> <mrow> <mn>0.01</mn> <mo>,</mo> </mrow> </semantics></math><math display="inline"><semantics> <mrow> <mn>0.02</mn> <mo>,</mo> </mrow> </semantics></math><math display="inline"><semantics> <mrow> <mo>…</mo> <mo>,</mo> <mn>1</mn> <mo>}</mo> </mrow> </semantics></math> and the financial terms <math display="inline"><semantics> <mrow> <msub> <mi>ϕ</mi> <mi>X</mi> </msub> <mrow> <mo>(</mo> <mi>X</mi> <mo>)</mo> </mrow> <mo>=</mo> <mo movablelimits="true" form="prefix">min</mo> <mrow> <mo>(</mo> <msub> <mrow> <mo>(</mo> <mi>X</mi> <mo>−</mo> <mn>0.2</mn> <mo>)</mo> </mrow> <mo>+</mo> </msub> <mo>,</mo> <mn>0.9</mn> <mo>)</mo> </mrow> <mrow> <mo>)</mo> </mrow> </mrow> </semantics></math>; <math display="inline"><semantics> <mrow> <msub> <mi>ϕ</mi> <mi>Y</mi> </msub> <mrow> <mo>(</mo> <mi>Y</mi> <mo>)</mo> </mrow> <mo>=</mo> <mo movablelimits="true" form="prefix">min</mo> <mrow> <mo>(</mo> <msub> <mrow> <mo>(</mo> <mi>Y</mi> <mo>−</mo> <mn>0.1</mn> <mo>)</mo> </mrow> <mo>+</mo> </msub> <mo>,</mo> <mn>0.8</mn> <mo>)</mo> </mrow> </mrow> </semantics></math>. Computing time is the average over 101 runs. Platform: Intel i9-9980HK CPU, 32 GB RAM, Windows 10. Compiler: Mingw-w64 g++ 8.3 -std=gnu++17 -Ofast -mfpmath=sse -msse2 -mstackrealign.</p>
Full article ">Figure 8
<p>Three examples of marginal damage distributions. The mean damage ratio varies from low in (<b>A</b>) to moderate in (<b>B</b>) and high in (<b>C</b>).</p>
Full article ">Figure 9
<p>Total gross loss pmfs for Portfolio 1. The pmfs are plotted within the same x-axis range for clarity. Blue pmfs are obtained using aggregation tree with copulas in <a href="#risks-10-00144-t001" class="html-table">Table 1</a> at summation nodes. Red pmfs are obtained by replacing each copula with its corresponding Fréchet decomposition into comonotonic part and independent part.</p>
Full article ">Figure 10
<p>Total gross loss pmfs for Portfolio 2. The pmfs are plotted within the same x-axis range for clarity. Blue pmfs are obtained using aggregation tree with copulas in <a href="#risks-10-00144-t001" class="html-table">Table 1</a> at summation nodes. Red pmfs are obtained by replacing each copula with its corresponding Fréchet decomposition into comonotonic part and independent part.</p>
Full article ">Figure 11
<p>Total gross loss pmfs for Portfolio 3. The pmfs are plotted within the same x-axis range for clarity. Blue pmfs are obtained using aggregation tree with copulas in <a href="#risks-10-00144-t001" class="html-table">Table 1</a> at summation nodes. Red pmfs are obtained by replacing each copula with its corresponding Fréchet decomposition into comonotonic part and independent part.</p>
Full article ">
8 pages, 347 KiB  
Review
The Effect of Option Grants on Managerial Risk Taking: A Review
by Guoyu Lin, Chenyong Liu, Jehu Mette and Rohan Crichton
Risks 2022, 10(8), 143; https://doi.org/10.3390/risks10080143 - 22 Jul 2022
Cited by 2 | Viewed by 1822
Abstract
This article presents a systematic review of the theoretical and empirical literature on option grants and managerial risk taking. One of the objectives is the motivation of further research on the topic. Risk-averse managers hold less diversified portfolios and, thus, tend to take [...] Read more.
This article presents a systematic review of the theoretical and empirical literature on option grants and managerial risk taking. One of the objectives is the motivation of further research on the topic. Risk-averse managers hold less diversified portfolios and, thus, tend to take less risk than optimal for shareholders. More option grants may encourage risk taking and result in higher firm value or alternatively increase the sensitivity of wealth to stock-price fluctuations mitigating overall risk-taking incentives. The net effect of options on risk-taking behavior is, therefore, ambiguous and calls for more empirical investigation. This is crucial for fiscal policymaking and regulation reforms. Yet, establishing a causal link between option granting and managerial risk taking has been challenging due to reverse causality, omitted correlated variables and measurement errors. In this review, we revisit the VegaDelta question by synthesizing the relevant research in economics, finance and accounting. We find that the empirical literature has successfully utilized natural experiments (e.g., regulation changes) to better establish causality, even though some mixed results are also documented. Finally, we also emphasize potential future research avenues especially relating to accounting disclosure, earnings management and tax policy. Full article
19 pages, 730 KiB  
Article
Equivalent Risk Indicators: VaR, TCE, and Beyond
by Silvia Faroni, Olivier Le Courtois and Krzysztof Ostaszewski
Risks 2022, 10(8), 142; https://doi.org/10.3390/risks10080142 - 22 Jul 2022
Cited by 3 | Viewed by 2348
Abstract
While a lot of research concentrates on the respective merits of VaR and TCE, which are the two most classic risk indicators used by financial institutions, little has been written on the equivalence between such indicators. Further, TCE, despite its merits, may not [...] Read more.
While a lot of research concentrates on the respective merits of VaR and TCE, which are the two most classic risk indicators used by financial institutions, little has been written on the equivalence between such indicators. Further, TCE, despite its merits, may not be the most accurate indicator to take into account the nature of probability distribution tails. In this paper, we introduce a new risk indicator that extends TCE to take into account higher-order risks. We compare the quantiles of this indicator to the quantiles of VaR in a simple Pareto framework, and then in a generalized Pareto framework. We also examine equivalence results between the quantiles of high-order TCEs. Full article
(This article belongs to the Special Issue Actuarial Mathematics and Risk Management)
Show Figures

Figure 1

Figure 1
<p>TCE quantile as a function of VaR quantile.</p>
Full article ">Figure 2
<p>Extended TCE quantile as a function of VaR quantile. (<b>Left panel</b>): <math display="inline"><semantics> <mrow> <mi>m</mi> <mo>=</mo> <mn>2</mn> </mrow> </semantics></math> and <math display="inline"><semantics> <mrow> <mi>θ</mi> <mo>=</mo> <mn>1</mn> </mrow> </semantics></math>. (<b>Right panel</b>): <math display="inline"><semantics> <mrow> <mi>m</mi> <mo>=</mo> <mn>2</mn> </mrow> </semantics></math> and <math display="inline"><semantics> <mrow> <mi>θ</mi> <mo>=</mo> <mn>5</mn> </mrow> </semantics></math>.</p>
Full article ">Figure 3
<p>Extended TCE quantile as a function of VaR quantile. (<b>Left panel</b>): <math display="inline"><semantics> <mrow> <mi>m</mi> <mo>=</mo> <mn>3</mn> </mrow> </semantics></math> and <math display="inline"><semantics> <mrow> <mi>θ</mi> <mo>=</mo> <mn>1</mn> </mrow> </semantics></math>. (<b>Right panel</b>): <math display="inline"><semantics> <mrow> <mi>m</mi> <mo>=</mo> <mn>3</mn> </mrow> </semantics></math> and <math display="inline"><semantics> <mrow> <mi>θ</mi> <mo>=</mo> <mn>5</mn> </mrow> </semantics></math>.</p>
Full article ">Figure 4
<p>Extended TCE quantile as a function of VaR quantile. (<b>Left panel</b>): <math display="inline"><semantics> <mrow> <mi>m</mi> <mo>=</mo> <mn>2</mn> </mrow> </semantics></math>, <math display="inline"><semantics> <mrow> <mi>σ</mi> <mo>=</mo> <mn>0.1</mn> </mrow> </semantics></math>, and <math display="inline"><semantics> <mrow> <mi>μ</mi> <mo>=</mo> <mo>−</mo> <mn>0.05</mn> </mrow> </semantics></math>. (<b>Right panel</b>): <math display="inline"><semantics> <mrow> <mi>m</mi> <mo>=</mo> <mn>2</mn> </mrow> </semantics></math>, <math display="inline"><semantics> <mrow> <mi>σ</mi> <mo>=</mo> <mn>0.1</mn> </mrow> </semantics></math>, and <math display="inline"><semantics> <mrow> <mi>μ</mi> <mo>=</mo> <mo>+</mo> <mn>0.05</mn> </mrow> </semantics></math>.</p>
Full article ">Figure 5
<p>Extended TCE quantile as a function of VaR quantile. (<b>Left panel</b>): <math display="inline"><semantics> <mrow> <mi>m</mi> <mo>=</mo> <mn>2</mn> </mrow> </semantics></math>, <math display="inline"><semantics> <mrow> <mi>σ</mi> <mo>=</mo> <mn>0.1</mn> </mrow> </semantics></math>, and <math display="inline"><semantics> <mrow> <mi>μ</mi> <mo>=</mo> <mn>0</mn> </mrow> </semantics></math>. (<b>Right panel</b>): <math display="inline"><semantics> <mrow> <mi>m</mi> <mo>=</mo> <mn>2</mn> </mrow> </semantics></math>, <math display="inline"><semantics> <mrow> <mi>σ</mi> <mo>=</mo> <mn>0.4</mn> </mrow> </semantics></math>, and <math display="inline"><semantics> <mrow> <mi>μ</mi> <mo>=</mo> <mn>0</mn> </mrow> </semantics></math>.</p>
Full article ">Figure 6
<p>Extended TCE quantile as a function of VaR quantile. (<b>Left panel</b>): <math display="inline"><semantics> <mrow> <mi>m</mi> <mo>=</mo> <mn>3</mn> </mrow> </semantics></math>, <math display="inline"><semantics> <mrow> <mi>σ</mi> <mo>=</mo> <mn>0.1</mn> </mrow> </semantics></math>, and <math display="inline"><semantics> <mrow> <mi>μ</mi> <mo>=</mo> <mn>0</mn> </mrow> </semantics></math>. (<b>Right panel</b>): <math display="inline"><semantics> <mrow> <mi>m</mi> <mo>=</mo> <mn>3</mn> </mrow> </semantics></math>, <math display="inline"><semantics> <mrow> <mi>σ</mi> <mo>=</mo> <mn>0.4</mn> </mrow> </semantics></math>, and <math display="inline"><semantics> <mrow> <mi>μ</mi> <mo>=</mo> <mn>0</mn> </mrow> </semantics></math>.</p>
Full article ">Figure 7
<p>Extended TCE quantile at order <math display="inline"><semantics> <mrow> <mi>n</mi> <mo>=</mo> <mn>2</mn> </mrow> </semantics></math> as a function of extended TCE quantile at order <math display="inline"><semantics> <mrow> <mi>m</mi> <mo>=</mo> <mn>5</mn> </mrow> </semantics></math>. (<b>Left panel</b>): <math display="inline"><semantics> <mrow> <mi>θ</mi> <mo>=</mo> <mn>1</mn> </mrow> </semantics></math>. (<b>Right panel</b>): <math display="inline"><semantics> <mrow> <mi>θ</mi> <mo>=</mo> <mn>2</mn> </mrow> </semantics></math>.</p>
Full article ">Figure 8
<p>TCE quantile as a function of extended TCE quantile at order 2. (<b>Left panel</b>): <math display="inline"><semantics> <mrow> <mi>θ</mi> <mo>=</mo> <mn>1</mn> </mrow> </semantics></math>. (<b>Right panel</b>): <math display="inline"><semantics> <mrow> <mi>θ</mi> <mo>=</mo> <mn>2</mn> </mrow> </semantics></math>.</p>
Full article ">Figure 9
<p>Extended TCE quantile at order <math display="inline"><semantics> <mrow> <mi>n</mi> <mo>=</mo> <mn>2</mn> </mrow> </semantics></math> as a function of extended TCE quantile at order <math display="inline"><semantics> <mrow> <mi>m</mi> <mo>=</mo> <mn>5</mn> </mrow> </semantics></math> with <math display="inline"><semantics> <mrow> <mi>σ</mi> <mo>=</mo> <mn>0.1</mn> </mrow> </semantics></math>. (<b>Left panel</b>): <math display="inline"><semantics> <mrow> <mi>μ</mi> <mo>=</mo> <mo>−</mo> <mn>0.05</mn> </mrow> </semantics></math>. (<b>Right panel</b>): <math display="inline"><semantics> <mrow> <mi>μ</mi> <mo>=</mo> <mo>+</mo> <mn>0.05</mn> </mrow> </semantics></math>.</p>
Full article ">Figure 10
<p>Extended TCE quantile at order <math display="inline"><semantics> <mrow> <mi>n</mi> <mo>=</mo> <mn>2</mn> </mrow> </semantics></math> as a function of extended TCE quantile at order <math display="inline"><semantics> <mrow> <mi>m</mi> <mo>=</mo> <mn>5</mn> </mrow> </semantics></math> with <math display="inline"><semantics> <mrow> <mi>μ</mi> <mo>=</mo> <mn>0</mn> </mrow> </semantics></math>. (<b>Left panel</b>): <math display="inline"><semantics> <mrow> <mi>σ</mi> <mo>=</mo> <mn>0.1</mn> </mrow> </semantics></math>. (<b>Right panel</b>): <math display="inline"><semantics> <mrow> <mi>σ</mi> <mo>=</mo> <mn>0.4</mn> </mrow> </semantics></math>.</p>
Full article ">Figure 11
<p>TCE quantile as a function of extended TCE quantile at order <math display="inline"><semantics> <mrow> <mi>m</mi> <mo>=</mo> <mn>2</mn> </mrow> </semantics></math> with <math display="inline"><semantics> <mrow> <mi>σ</mi> <mo>=</mo> <mn>0.1</mn> </mrow> </semantics></math>. (<b>Left panel</b>): <math display="inline"><semantics> <mrow> <mi>μ</mi> <mo>=</mo> <mo>−</mo> <mn>0.05</mn> </mrow> </semantics></math>. (<b>Right panel</b>): <math display="inline"><semantics> <mrow> <mi>μ</mi> <mo>=</mo> <mo>+</mo> <mn>0.05</mn> </mrow> </semantics></math>.</p>
Full article ">Figure 12
<p>TCE quantile as a function of extended TCE quantile at order <math display="inline"><semantics> <mrow> <mi>m</mi> <mo>=</mo> <mn>2</mn> </mrow> </semantics></math> with <math display="inline"><semantics> <mrow> <mi>μ</mi> <mo>=</mo> <mn>0</mn> </mrow> </semantics></math>. (<b>Left panel</b>): <math display="inline"><semantics> <mrow> <mi>σ</mi> <mo>=</mo> <mn>0.1</mn> </mrow> </semantics></math>. (<b>Right panel</b>): <math display="inline"><semantics> <mrow> <mi>σ</mi> <mo>=</mo> <mn>0.4</mn> </mrow> </semantics></math>.</p>
Full article ">Figure 13
<p>Extended TCE quantile, with <math display="inline"><semantics> <mrow> <mi>m</mi> <mo>=</mo> <mn>2</mn> </mrow> </semantics></math>, as a function of VaR.</p>
Full article ">
Previous Issue
Back to TopTop