[go: up one dir, main page]

Next Issue
Volume 9, June
Previous Issue
Volume 9, April


Biomedicines, Volume 9, Issue 5 (May 2021) – 140 articles

Cover Story (view full-size image): 
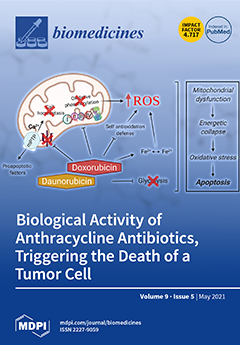
Anthracycline antibiotics—i.e., doxo and daunorubicin—deactivate respiratory chain complexes and disrupt calcium homeostasis, as well as the self-antioxidant defense system, leading to the overproduction of free radicals, plus mPTP formation, which promotes the proapoptotic factor release into cell cytosol and triggers the apoptosis cascade. In addition, they inhibit the glycolytic energy production pathway in tumor cells, thereby exhibiting cytotoxicity.View this paper
  • Issues are regarded as officially published after their release is announced to the table of contents alert mailing list.
  • You may sign up for e-mail alerts to receive table of contents of newly released issues.
  • PDF is the official format for papers published in both, html and pdf forms. To view the papers in pdf format, click on the "PDF Full-text" link, and use the free Adobe Reader to open them.
Order results
Result details
Section
Select all
Export citation of selected articles as:
27 pages, 1913 KiB  
Review
Peptide-Based Nanoparticles for Therapeutic Nucleic Acid Delivery
by Prisca Boisguérin, Karidia Konate, Emilie Josse, Eric Vivès and Sébastien Deshayes
Biomedicines 2021, 9(5), 583; https://doi.org/10.3390/biomedicines9050583 - 20 May 2021
Cited by 47 | Viewed by 7992
Abstract
Gene therapy offers the possibility to skip, repair, or silence faulty genes or to stimulate the immune system to fight against disease by delivering therapeutic nucleic acids (NAs) to a patient. Compared to other drugs or protein treatments, NA-based therapies have the advantage [...] Read more.
Gene therapy offers the possibility to skip, repair, or silence faulty genes or to stimulate the immune system to fight against disease by delivering therapeutic nucleic acids (NAs) to a patient. Compared to other drugs or protein treatments, NA-based therapies have the advantage of being a more universal approach to designing therapies because of the versatility of NA design. NAs (siRNA, pDNA, or mRNA) have great potential for therapeutic applications for an immense number of indications. However, the delivery of these exogenous NAs is still challenging and requires a specific delivery system. In this context, beside other non-viral vectors, cell-penetrating peptides (CPPs) gain more and more interest as delivery systems by forming a variety of nanocomplexes depending on the formulation conditions and the properties of the used CPPs/NAs. In this review, we attempt to cover the most important biophysical and biological aspects of non-viral peptide-based nanoparticles (PBNs) for therapeutic nucleic acid formulations as a delivery system. The most relevant peptides or peptide families forming PBNs in the presence of NAs described since 2015 will be presented. All these PBNs able to deliver NAs in vitro and in vivo have common features, which are characterized by defined formulation conditions in order to obtain PBNs from 60 nm to 150 nm with a homogeneous dispersity (PdI lower than 0.3) and a positive charge between +10 mV and +40 mV. Full article
(This article belongs to the Special Issue Oligonucleotides-Based Therapeutics)
Show Figures

Figure 1

Figure 1
<p>Formulation of peptide-based nanoparticles in the presence of different nucleic acids and their cellular internalization. Peptide-based nanoparticles (PBNs) are formulated by mixing a cell-penetrating peptide (CPP) or a grafted CPP (PEGylated, targeting sequence or fatty acid) with a nucleic acid (NA) such as pDNA, mRNA, siRNA, or ASO at a given molar or charge ratio. By mixing these two compounds, the nanoparticle is formed by self-assembling into naked PBNs (<b>a</b>), a multi-grafted PBNs (<b>b</b>), or prospective micelle-like PBNs (no model available) (<b>c</b>). In all cases, the PBNs of mean size between 60 nm and 150 nm encapsulate several NAs for cellular transfection. Thereafter, cellular internalization could occur via direct translocation (<b>d</b>) or via endocytosis-dependent pathways (<b>f</b>). After the direct translocation (<b>e</b>) or endosomal escape (<b>g</b>), the NAs could be active either by silencing or activating genes or by performing splice modulation (<b>h</b>). GAG = glycosaminoglycans.</p>
Full article ">Figure 2
<p>Examples of functionalized PBNs.</p>
Full article ">
12 pages, 2673 KiB  
Article
Multi-Omic Meta-Analysis of Transcriptomes and the Bibliome Uncovers Novel Hypoxia-Inducible Genes
by Yoko Ono and Hidemasa Bono
Biomedicines 2021, 9(5), 582; https://doi.org/10.3390/biomedicines9050582 - 20 May 2021
Cited by 16 | Viewed by 9721
Abstract
Hypoxia is a condition in which cells, tissues, or organisms are deprived of sufficient oxygen supply. Aerobic organisms have a hypoxic response system, represented by hypoxia-inducible factor 1-? (HIF1A), to adapt to this condition. Due to publication bias, there has been little focus [...] Read more.
Hypoxia is a condition in which cells, tissues, or organisms are deprived of sufficient oxygen supply. Aerobic organisms have a hypoxic response system, represented by hypoxia-inducible factor 1-? (HIF1A), to adapt to this condition. Due to publication bias, there has been little focus on genes other than well-known signature hypoxia-inducible genes. Therefore, in this study, we performed a meta-analysis to identify novel hypoxia-inducible genes. We searched publicly available transcriptome databases to obtain hypoxia-related experimental data, retrieved the metadata, and manually curated it. We selected the genes that are differentially expressed by hypoxic stimulation, and evaluated their relevance in hypoxia by performing enrichment analyses. Next, we performed a bibliometric analysis using gene2pubmed data to examine genes that have not been well studied in relation to hypoxia. Gene2pubmed data provides information about the relationship between genes and publications. We calculated and evaluated the number of reports and similarity coefficients of each gene to HIF1A, which is a representative gene in hypoxia studies. In this data-driven study, we report that several genes that were not known to be associated with hypoxia, including the G protein-coupled receptor 146 gene, are upregulated by hypoxic stimulation. Full article
(This article belongs to the Special Issue Hypoxia-Inducible Factors: Regulation and Therapeutic Potential)
Show Figures

Figure 1

Figure 1
<p>Schematic view of hypoxic transcriptome meta-analysis. Step 1. Evaluation and listing of upregulation and downregulation of hypoxia-inducible genes. Step 2. Confirmation of known hypoxic stimulation-related genes. Step 3. Discovery of novel genes related to hypoxic stimulus-response.</p>
Full article ">Figure 2
<p>(<b>a</b>,<b>b</b>) Confirmation of known hypoxic stimulation-related genes. Enrichment analysis for (<b>a</b>) the UP 100 gene list and (<b>b</b>) the DOWN 100 gene list. (<b>c</b>,<b>d</b>) Scatter plot of ChIP-seq average peaks of hypoxic-related antigens, (<b>c</b>) HIF1A vs. ARNT and (<b>d</b>) EPAS1 vs. ARNT colored by HN-score.</p>
Full article ">Figure 2 Cont.
<p>(<b>a</b>,<b>b</b>) Confirmation of known hypoxic stimulation-related genes. Enrichment analysis for (<b>a</b>) the UP 100 gene list and (<b>b</b>) the DOWN 100 gene list. (<b>c</b>,<b>d</b>) Scatter plot of ChIP-seq average peaks of hypoxic-related antigens, (<b>c</b>) HIF1A vs. ARNT and (<b>d</b>) EPAS1 vs. ARNT colored by HN-score.</p>
Full article ">Figure 3
<p>Discovery of novel genes associated with hypoxic stimulus-response. (<b>a</b>) Scatter plot of the number of publications vs. Simpson similarity coefficients for HIF1A in the UP 100 gene list. In this scatter plot, genes that were reported to be associated with HIF-1 15 years ago were marked as “known genes regulated by HIF-1”. (<b>b</b>) Box plot of log2-transformed HN-ratio per hypoxic treatment time for some of the UP 100 genes.</p>
Full article ">
16 pages, 6213 KiB  
Article
The Insulin Receptor: A Potential Target of Amarogentin Isolated from Gentiana rigescens Franch That Induces Neurogenesis in PC12 Cells
by Lihong Cheng, Hiroyuki Osada, Tianyan Xing, Minoru Yoshida, Lan Xiang and Jianhua Qi
Biomedicines 2021, 9(5), 581; https://doi.org/10.3390/biomedicines9050581 - 20 May 2021
Cited by 11 | Viewed by 3685
Abstract
Amarogentin (AMA) is a secoiridoid glycoside isolated from the traditional Chinese medicine, Gentiana rigescens Franch. AMA exhibits nerve growth factor (NGF)-mimicking and NGF-enhancing activities in PC12 cells and in primary cortical neuron cells. In this study, a possible mechanism was found showing the [...] Read more.
Amarogentin (AMA) is a secoiridoid glycoside isolated from the traditional Chinese medicine, Gentiana rigescens Franch. AMA exhibits nerve growth factor (NGF)-mimicking and NGF-enhancing activities in PC12 cells and in primary cortical neuron cells. In this study, a possible mechanism was found showing the remarkable induction of phosphorylation of the insulin receptor (INSR) and protein kinase B (AKT). The potential target of AMA was predicted by using a small-interfering RNA (siRNA) and the cellular thermal shift assay (CETSA). The AMA-induced neurite outgrowth was reduced by the siRNA against the INSR and the results of the CETSA suggested that the INSR showed a significant thermal stability-shifted effect upon AMA treatment. Other neurotrophic signaling pathways in PC12 cells were investigated using specific inhibitors, Western blotting and PC12(rasN17) and PC12(mtGAP) mutants. The inhibitors of the glucocorticoid receptor (GR), phospholipase C (PLC) and protein kinase C (PKC), Ras, Raf and mitogen-activated protein kinase (MEK) significantly reduced the neurite outgrowth induced by AMA in PC12 cells. Furthermore, the phosphorylation reactions of GR, PLC, PKC and an extracellular signal-regulated kinase (ERK) were significantly increased after inducing AMA and markedly decreased after treatment with the corresponding inhibitors. Collectively, these results suggested that AMA-induced neuritogenic activity in PC12 cells potentially depended on targeting the INSR and activating the downstream Ras/Raf/ERK and PI3K/AKT signaling pathways. In addition, the GR/PLC/PKC signaling pathway was found to be involved in the neurogenesis effect of AMA. Full article
(This article belongs to the Special Issue Molecular Research of Alzheimer's Disease)
Show Figures

Figure 1

Figure 1
<p>Neurogenesis effect of AMA in PC12 cells. (<b>a</b>) Chemical structure of AMA. (<b>b</b>) Percentage of PC12 cells with neurite outgrowth after treatment with AMA at different doses or AMA combined with a low dose of the NGF. (<b>c</b>) Morphological changes in PC12 cells under an inverted optical microscope at 48 h after treatment with (<b>i</b>) control (0.5% DMSO); (<b>ii</b>) NGF (40 ng/mL); (<b>iii</b>) NGF (1 ng/mL); (<b>iv</b>) AMA (3 μM); (<b>v</b>) AMA (3 μM) + NGF (1 ng/mL). (<b>d</b>) Cell viability analysis results of PC12 cells after treatment with various doses of AMA or AMA combined with the NGF. Each experiment was repeated three times. The data were expressed as a mean ± SEM. *** indicates significant differences at <span class="html-italic">p</span> &lt; 0.001 compared with the negative control and <sup>###</sup> indicates a significant difference at <span class="html-italic">p</span> &lt; 0.001 compared with the 3 μM AMA group.</p>
Full article ">Figure 2
<p>Neurogenesis effect of AMA in primary cortical neuron cells. (<b>a</b>) Micrographs of primary cortical neuron cells at 48 h after treatment with (<b>i</b>) control (0.5% DMSO); (<b>ii</b>) NGF (10 ng/mL); (<b>iii</b>) NGF (1 ng/mL); (<b>iv</b>) AMA (0.1 μM); (<b>v</b>) AMA (0.3 μM); (<b>vi</b>) AMA (1 μM); (<b>vii</b>) AMA (3 μM); (<b>viii</b>) AMA (0.1 μM) + NGF (1 ng/mL). (<b>b</b>) Average length of neurite outgrowth of the indicated groups in the primary cortical neuron cells. (<b>c</b>) Average primary dendrite number in each group. Each experiment was repeated three times. The data were expressed as a mean ± SEM. *, ** and *** indicate significant differences at <span class="html-italic">p</span> &lt; 0.05, <span class="html-italic">p</span> &lt; 0.01 and <span class="html-italic">p</span> &lt; 0.001 compared with the negative control; <sup>#, ##</sup> indicate a significant difference at <span class="html-italic">p</span> &lt; 0.05 and <span class="html-italic">p</span> &lt; 0.01 compared with the 0.1 μM AMA group.</p>
Full article ">Figure 3
<p>Effect of AMA on the Ras/Raf/MEK/ERK signaling pathway in PC12 cells. (<b>a</b>,<b>b</b>) Effect of TrkA inhibitor K252a and TrkB inhibitor ANA-12 on the neurite outgrowth induced by AMA and AMA combined with the NGF. (<b>c</b>–<b>e</b>) Effects of Ras, Raf and MEK inhibitors on the neurogenesis activity of AMA and AMA combined with the NGF. (<b>f</b>) Percentage of the neurite outgrowth induced by AMA and AMA combined with the NGF for 48 h in wide-type or Ras mutant PC12 cells. (<b>g</b>) Phosphorylation of ERK at different time points induced by AMA. The ERK phosphorylation was reduced by the inhibitor of MEK and quantified using Western blots through ImageJ software. Each experiment was repeated three times. ** and *** indicate significant differences at <span class="html-italic">p</span> &lt; 0.01 and <span class="html-italic">p</span> &lt; 0.001 compared with the negative control; <sup>##, ###</sup> indicate a significant difference at <span class="html-italic">p</span> &lt; 0.01 and <span class="html-italic">p</span> &lt; 0.001 compared with the 3 μM AMA group; <sup><span>$</span><span>$</span><span>$</span></sup> indicates a significant difference at <span class="html-italic">p</span> &lt; 0.001 compared with the AMA-combined NGF group.</p>
Full article ">Figure 4
<p>Effect of amarogentin on the insulin receptor/PI3K/AKT signaling pathway in PC12 cells. (<b>a</b>,<b>b</b>) Effect of the insulin receptor inhibitor HNMPA-(AM)<sub>3</sub> and PI3K inhibitor LY294002 on the neurite outgrowth induced by AMA and AMA combined with the NGF. (<b>c</b>) AMA-induced phosphorylation of the insulin receptor and AKT in a time-dependent manner and quantification of the Western blots by using ImageJ software. (<b>d</b>) Phosphorylation of the insulin receptor, AKT and ERK induced by AMA or AMA combined with the NGF was decreased by the inhibitor HNMPA-(AM)<sub>3</sub>. (<b>e</b>) Phosphorylation of AKT induced by AMA or AMA combined with the NGF was decreased by the inhibitor LY294002. Each experiment was repeated three times. *** indicates significant differences at <span class="html-italic">p</span> &lt; 0.001 compared with the negative control; <sup>###</sup> indicates a significant difference at <span class="html-italic">p</span> &lt; 0.001 compared with the 3 μM AMA group and <sup><span>$</span><span>$</span><span>$</span></sup> indicates a significant difference at <span class="html-italic">p</span> &lt; 0.001 compared with the AMA-combined NGF group.</p>
Full article ">Figure 5
<p>Effect of AMA on the GR/PLC/PKC signaling pathway in PC12 cells. (<b>a</b>–<b>c</b>) Effect of GR (RU486), PLC (U73343) and PKC (Go6983) inhibitors on the neurite outgrowth induced by AMA and AMA combined with the NGF. (<b>d</b>) AMA-stimulated phosphorylation of GR, PLC and PKC proteins in a time-dependent manner and the quantification of Western blots by using ImageJ software. (<b>e</b>) Phosphorylation of GR, PLC and PKC induced by AMA or AMA combined with the NGF reduced by the corresponding inhibitors and quantified using Western blots through ImageJ software. Each experiment was repeated three times. *** indicates significant differences at <span class="html-italic">p</span> &lt; 0.001 compared with the negative control; <sup>###</sup> indicates a significant difference at <span class="html-italic">p</span> &lt; 0.001 compared with the 3 μM AMA group and <sup><span>$</span><span>$</span><span>$</span></sup> indicates a significant difference at <span class="html-italic">p</span> &lt; 0.001 compared with the AMA-combined NGF group.</p>
Full article ">Figure 6
<p>Target prediction of AMA in PC12 cells by using siRNA and a CETSA assay. (<b>a</b>) Microphotographs of PC12 cells after treatment with siRNA and AMA or AMA combined with the NGF: (<b>i</b>) negative control siRNA, control (0.5% DMSO); (<b>ii</b>) negative control siRNA, AMA (3 μM); (<b>iii</b>) negative control siRNA, AMA (3 μM) + NGF (1 ng/mL); (<b>iv</b>) insulin receptor siRNA, control (0.5% DMSO); (<b>v</b>) insulin receptor siRNA, AMA (3 μM); (<b>vi</b>) insulin receptor siRNA, AMA (3 μM) + NGF (1 ng/mL). (<b>b</b>) Percentage of cells with a neurite outgrowth after treatment with siRNA and AMA or AMA combined with the NGF. (<b>c</b>) Western blot analysis for the insulin receptor after transfection with negative siRNA or insulin receptor siRNA and treatment with AMA or AMA combined with the NGF. Cells were transfected with Lipofectamine 2000 and 150 nM siRNA for 6 h and treated with AMA or AMA combined with the NGF. (<b>d</b>,<b>e</b>) CETSA of PC12 cells on the insulin receptor or GR protein and corresponding fitting curves. (<b>f</b>) Neuritogenic activity of insulin and demethylasterriquinone B1 in PC12 cells. <sup>***</sup>, <sup>###</sup> and <sup><span>$</span><span>$</span><span>$</span></sup> indicate significant differences at <span class="html-italic">p</span> &lt; 0.001 compared with the corresponding groups.</p>
Full article ">Figure 7
<p>Proposed mechanism of the action of AMA in the neuritogenic activity in PC12 cells.</p>
Full article ">
10 pages, 3007 KiB  
Article
Surface-Enhanced Raman Spectroscopy to Characterize Different Fractions of Extracellular Vesicles from Control and Prostate Cancer Patients
by Eric Boateng Osei, Liliia Paniushkina, Konrad Wilhelm, Jürgen Popp, Irina Nazarenko and Christoph Krafft
Biomedicines 2021, 9(5), 580; https://doi.org/10.3390/biomedicines9050580 - 20 May 2021
Cited by 8 | Viewed by 3415
Abstract
Extracellular vesicles (EVs) are membrane-enclosed structures ranging in size from about 60 to 800 nm that are released by the cells into the extracellular space; they have attracted interest as easily available biomarkers for cancer diagnostics. In this study, EVs from plasma of [...] Read more.
Extracellular vesicles (EVs) are membrane-enclosed structures ranging in size from about 60 to 800 nm that are released by the cells into the extracellular space; they have attracted interest as easily available biomarkers for cancer diagnostics. In this study, EVs from plasma of control and prostate cancer patients were fractionated by differential centrifugation at 5000× g, 12,000× g and 120,000× g. The remaining supernatants were purified by ultrafiltration to produce EV-depleted free-circulating (fc) fractions. Spontaneous Raman and surface-enhanced Raman spectroscopy (SERS) at 785 nm excitation using silver nanoparticles (AgNPs) were employed as label-free techniques to collect fingerprint spectra and identify the fractions that best discriminate between control and cancer patients. SERS spectra from 10 µL droplets showed an enhanced Raman signature of EV-enriched fractions that were much more intense for cancer patients than controls. The Raman spectra of dehydrated pellets of EV-enriched fractions without AgNPs were dominated by spectral contributions of proteins and showed variations in S-S stretch, tryptophan and protein secondary structure bands between control and cancer fractions. We conclude that the AgNPs-mediated SERS effect strongly enhances Raman bands in EV-enriched fractions, and the fractions, EV12 and EV120 provide the best separation of cancer and control patients by Raman and SERS spectra. Full article
(This article belongs to the Section Biomedical Materials and Nanomedicine)
Show Figures

Figure 1

Figure 1
<p>EV enrichment and fractionation protocol from blood using differential centrifugation resulted in three crude EV-enriched fractions designated as EV5, EV12 and EV120, and one EV-depleted free circulating fraction (fc).</p>
Full article ">Figure 2
<p>(<b>A</b>) Particle size distribution by dynamic light scattering of EV5, EV12, EV120 and fc fractions isolated from pools of citrate plasma samples. (<b>B</b>) Transmission electron microscopy of EV120-enriched fraction, two EVs at five-fold enlargement (blue and red box) showing typical EV-like structures of approximately 100 nm diameter and (C) fc fraction.</p>
Full article ">Figure 3
<p>SERS spectra at 785 nm excitation mixing AgNPs, potassium chloride and plasma fractions EV5, EV12, EV120 and fc. Blue arrows denote most intense SERS bands of EV-enriched fractions in prostate cancer samples, green arrows denote more intense SERS bands of proteins in control samples.</p>
Full article ">Figure 4
<p>Raman spectra at 785 nm excitation from dried serum fractions EV5, EV12, EV120 and fc. Control (black trace), cancer (red trace). Reproducible difference features are labeled by blue arrows.</p>
Full article ">
40 pages, 2433 KiB  
Review
Identifying Novel Actionable Targets in Colon Cancer
by Maria Grazia Cerrito and Emanuela Grassilli
Biomedicines 2021, 9(5), 579; https://doi.org/10.3390/biomedicines9050579 - 20 May 2021
Cited by 15 | Viewed by 8338
Abstract
Colorectal cancer is the fourth cause of death from cancer worldwide, mainly due to the high incidence of drug-resistance toward classic chemotherapeutic and newly targeted drugs. In the last decade or so, the development of novel high-throughput approaches, both genome-wide and chemical, allowed [...] Read more.
Colorectal cancer is the fourth cause of death from cancer worldwide, mainly due to the high incidence of drug-resistance toward classic chemotherapeutic and newly targeted drugs. In the last decade or so, the development of novel high-throughput approaches, both genome-wide and chemical, allowed the identification of novel actionable targets and the development of the relative specific inhibitors to be used either to re-sensitize drug-resistant tumors (in combination with chemotherapy) or to be synthetic lethal for tumors with specific oncogenic mutations. Finally, high-throughput screening using FDA-approved libraries of “known” drugs uncovered new therapeutic applications of drugs (used alone or in combination) that have been in the clinic for decades for treating non-cancerous diseases (re-positioning or re-purposing approach). Thus, several novel actionable targets have been identified and some of them are already being tested in clinical trials, indicating that high-throughput approaches, especially those involving drug re-positioning, may lead in a near future to significant improvement of the therapy for colon cancer patients, especially in the context of a personalized approach, i.e., in defined subgroups of patients whose tumors carry certain mutations. Full article
Show Figures

Figure 1

Figure 1
<p>Schematic representation of CRC progression along the three different pathways according to the Fearon and Vogelstein model. CIN, chromosomal instability; MSI, microsatellite instability; CIMP, CpG island methylator; MMR, DNA mismatch repair; LOH, loss of heterozygosity. Independently of the pathway, a defect in the APC/beta-catenin axis marks the onset of the transformation process from normal epithelia to early adenoma. A defect along the KRAS/BRAF pathway is required to progress to intermediate adenoma. Loss or silencing of different tumor suppressor genes finally determines the progression to late adenoma and then to carcinoma. In the CIN pathway, the transition to the carcinoma stage is marked by the inactivation of the tumor-suppressor gene TP53, whose product is pivotal in regulating DNA repair, cell cycle arrest, senescence, apoptosis and metabolism in response to a variety of stress signals. Therefore, its loss contributes to drug resistance and to the propagation of damaged DNA to daughter cells, increasing the mutational load. TP53 mutation or loss of it has been reported in 50–75% of CRC cases and it is associated with the progression and outcome of sporadic CRC [<a href="#B2-biomedicines-09-00579" class="html-bibr">2</a>,<a href="#B3-biomedicines-09-00579" class="html-bibr">3</a>].</p>
Full article ">Figure 2
<p>WNT/beta-catenin canonical signaling pathway in CRC and identified inhibitors. When WNT proteins are sequestered by WNT inhibitory factor-1 (WIF-1), the member of the frizzled (FZD) family of atypical G protein-coupled receptors is inhibited by a secreted frizzled-related protein (SFRP) and the co-receptor lipoprotein receptor-related protein (LPR) 5 or 6 is bound to Dickkopf (DKK); WNT signaling is therefore off. As a consequence, the receptor complex is not formed and the destruction complex is assembled in the cytoplasm, where APC and AXIN serve as a scaffold to recruit CK1 and GSK3B, both of which phosphorylate beta-catenin, thus targeting it for BTRC-mediated ubiquitination and subsequent proteasome-mediated degradation. In the nucleus, TCF/LEF transcription factor sits on the promoter of WNT-regulated genes where, via binding a member of the Groucho/TLE family of transcription repressors or CtBP, it recruits HDAC to repress transcription of the downstream genes. The signaling starts when WNT is freed and can bind a member of FZD family LPR5/6, thus forming the receptor complex which, via the binding of the adaptor protein Disheveled (DVL), recruits to the membrane the destruction complex, disrupting it. Tankyrases (TNKSs,) by poly-ADP-ribosylating AXIN, prime it for ubiquitination and subsequent proteasome-mediated degradation. Alternatively, AXIN can sequester GSK3B away from the complex; in both ways beta-catenin is released from the destruction complex and translocates to the nucleus, where it displaces transcription repressors and complexes with TCF/LEF to recruit several transcriptional coactivators (Pygo, BCL9) and histone modifiers (such as TRRAP, PAF1, BRG1, etc.) in order to promote the transcription of the downstream target genes. In the red and green boxes, chemical and re-purposed drugs are identified in the screens described in the text. CGP049090, KF 115-584, ICG-001, LF3: compounds identified as able to displace the interaction of beta-catenin with TCF/LEF transcription factors or recruited coactivators; XAV939: TNKSs inhibitor; IWR compounds, 1–5, KYA1797K: axin stabilizers; IWP compounds, 6–9: inhibitors of WNT production; MSAB: stimulators of beta-catenin ubiquitination [<a href="#B4-biomedicines-09-00579" class="html-bibr">4</a>,<a href="#B5-biomedicines-09-00579" class="html-bibr">5</a>,<a href="#B6-biomedicines-09-00579" class="html-bibr">6</a>,<a href="#B7-biomedicines-09-00579" class="html-bibr">7</a>,<a href="#B8-biomedicines-09-00579" class="html-bibr">8</a>,<a href="#B9-biomedicines-09-00579" class="html-bibr">9</a>].</p>
Full article ">Figure 3
<p>Signaling pathway activated downstream of the TGFBR in CRC. Upon binding the TGFB1 dimer, TGF-beta receptor type-2 (TGFBR2) promotes its dimerization with TGFBR1, resulting in transphosphorylation of TGFBR1. Activated TGFBR1 phosphorylates and activates receptor-regulated SMADs R-SMADs, SMAD2 and SMAD3, thus promoting the trimerization with a co-SMAD (SMAD4). SMAD7 is an inhibitory SMAD (I-SMAD) that can bind to TGFBR1 competing with SMAD2/3 for the catalytic site of phosphorylation, thus preventing the phosphorylation of SMAD2/3. In addition, SMAD7 can promote dephosphorylation/inactivation of TGFBR1 or boost ubiquitination and proteasome-mediated degradation of TGFBR1. Activated SMAD complex enters the nucleus, where it binds DNA directly or indirectly, via other transcription factors, and regulates gene expression, both positively and negatively. SMAD4 inactivation has been reported to correlate with CRC tumor progression, development and distant metastasis. Moreover, its reduced expression or loss was associated with poor survival and prognosis in patients with CRC. In addition, loss of SMAD4 in CRC patients conferred resistance to chemotherapy drugs, such as 5-fluorouracil (5-FU) [<a href="#B10-biomedicines-09-00579" class="html-bibr">10</a>]. Loss-of-function mutations have been found in approximately 10–35% of patients with CRC [<a href="#B11-biomedicines-09-00579" class="html-bibr">11</a>]. Moreover, some studies reported absent, or reduced SMAD4 expression in 66% of CRC samples from patients analyzed [<a href="#B10-biomedicines-09-00579" class="html-bibr">10</a>,<a href="#B11-biomedicines-09-00579" class="html-bibr">11</a>,<a href="#B12-biomedicines-09-00579" class="html-bibr">12</a>,<a href="#B13-biomedicines-09-00579" class="html-bibr">13</a>,<a href="#B14-biomedicines-09-00579" class="html-bibr">14</a>,<a href="#B15-biomedicines-09-00579" class="html-bibr">15</a>,<a href="#B16-biomedicines-09-00579" class="html-bibr">16</a>].</p>
Full article ">Figure 4
<p>Signaling pathways activated downstream of the EGFR in CRC. Upon binding of the EGF with its dimerized receptors, and subsequent activation by autophosphorylation at multiple C-terminal Tyr residues, several proteins can be recruited to trigger different signaling pathways. For clarity, only two major pathways mainly affected by mutational events in CRC are presented in the figure. The phosphorylated C-terminal domain binds SHC and GRB2, which in turn recruits SOS to initiate ERK/MAPK signaling. SOS is a GDP Exchange Factor (GEF) that catalyzes the conversion of GDP to GTP of RAS, activating it. Active RAS recruits BRAF, which is activated by dephosphorylation and phosphorylation events. Activated BRAF phosphorylates and activates MEK1/2, which in turn activates ERK1/2. Phospho-ERK1/2 have various cytoplasmic and nuclear targets, which aid in the transcription and translation of cell cycle and cell growth-related genes. On the other hand, the receptor-bound GRB2 can also bind GAB1 which recruits the p85 regulatory subunit of PI3K that, via binding of the p110 catalytic subunit, (PI3KCA) activates it. PI3KCA-activating mutations occur in approximately 10–20% of CRCs, most of them exhibiting also a KRAS mutation [<a href="#B1-biomedicines-09-00579" class="html-bibr">1</a>]. On the other hand, phosphatase and tensin homolog deleted on chromosome ten (PTEN), by dephosphorylating PIP3, counteracts the PI3K/AKT signaling cascade. Loss of PTEN expression resulting from both genetic (genomic mutations and decreased gene copy numbers) and epigenetic mechanisms (promoter hypermethylation) occurs in 34.5% of cases [<a href="#B21-biomedicines-09-00579" class="html-bibr">21</a>]. Activated PI3K phosphorylates membrane-bound PIP<sub>2</sub> to PIP<sub>3</sub>, which in turn recruits AKT and PDK1, the latter being responsible for AKT phosphorylation and activation. PDK1 can also phosphorylate protein kinase C delta type (PRKCD) which in turn can activate AKT. In addition, PRKCD can inhibit, by phosphorylation, GSK3B. Active AKT has many substrates, and most of them are inhibited upon phosphorylation (such as pro-apoptotic proteins FOXO, CASP9 and BAD) whereas MDM2, the Ub-ligase targeting p53 for degradation, is activated. Finally, AKT can activate mTOR complex 1 (mTORC1) either via phosphorylating TSC2—thus relieving its inhibitory activity on mTORC1 (via Rheb)—or via directly phosphorylating mTORC1 itself. TSC2-mediated inhibition can also be relieved by ERK-mediated phosphorylation downstream of RAS; finally, mTORC1 can also be activated directly by PI3K-mediated phosphorylation. As a consequence of mTORC1 activation, eIF4E-mediated translation of several proteins involved in cell cycle regulation and cell growth is triggered. Besides mTORC1, PI3K can also directly activate mTOR complex 2 (mTORC2), which in turn amplifies AKT-mediated downstream signaling; excessive signaling is, however, kept in check by a negative feedback loop where mTORC1 inhibits mTORC2. Red stars indicate the occurrence of mutations in the specific protein, all of which are activating but for PTEN, for which a loss of function, either genetic or epigenetic, occurs. Inhibitory drugs identified by the re-purposing of chemical screens described in the text are indicated in the red boxes; hatched red boxes indicate target inhibition identified by genetic screens.</p>
Full article ">Figure 5
<p>Genes identified by siRNA/shRNA screen as synthetic lethal in <span class="html-italic">KRAS-</span> and <span class="html-italic">BRAF</span>-mutated CRCs. CIC: cancer-initating cells. *: mutated. Arrows indicates downstream events. Red lines indicate the blockade of the gene product either by si/RNA or by chemical inhibitors.</p>
Full article ">
17 pages, 2538 KiB  
Article
5-Aminolevulinic Acid as a Novel Therapeutic for Inflammatory Bowel Disease
by Vipul Yadav, Yang Mai, Laura E. McCoubrey, Yasufumi Wada, Motoyasu Tomioka, Satofumi Kawata, Shrikant Charde and Abdul W. Basit
Biomedicines 2021, 9(5), 578; https://doi.org/10.3390/biomedicines9050578 - 20 May 2021
Cited by 15 | Viewed by 4925
Abstract
5-Aminolevulinic acid (5-ALA) is a naturally occurring nonprotein amino acid licensed as an optical imaging agent for the treatment of gliomas. In recent years, 5-ALA has been shown to possess anti-inflammatory and immunoregulatory properties through upregulation of heme oxygenase-1 via enhancement of porphyrin, [...] Read more.
5-Aminolevulinic acid (5-ALA) is a naturally occurring nonprotein amino acid licensed as an optical imaging agent for the treatment of gliomas. In recent years, 5-ALA has been shown to possess anti-inflammatory and immunoregulatory properties through upregulation of heme oxygenase-1 via enhancement of porphyrin, indicating that it may be beneficial for the treatment of inflammatory conditions. This study systematically examines 5-ALA for use in inflammatory bowel disease (IBD). Firstly, the ex vivo colonic stability and permeability of 5-ALA was assessed using human and mouse fluid and tissue. Secondly, the in vivo efficacy of 5-ALA, in the presence of sodium ferrous citrate, was investigated via the oral and intracolonic route in an acute DSS colitis mouse model of IBD. Results showed that 5-ALA was stable in mouse and human colon fluid, as well as in colon tissue. 5-ALA showed more tissue restricted pharmacokinetics when exposed to human colonic tissue. In vivo dosing demonstrated significantly improved colonic inflammation, increased local heme oxygenase-1 levels, and decreased concentrations of proinflammatory cytokines TNF-?, IL-6, and IL-1? in both plasma and colonic tissue. These effects were superior to that measured concurrently with established anti-inflammatory treatments, ciclosporin and 5-aminosalicylic acid (mesalazine). As such, 5-ALA represents a promising addition to the IBD armamentarium, with potential for targeted colonic delivery. Full article
(This article belongs to the Section Drug Discovery and Development)
Show Figures

Graphical abstract

Graphical abstract
Full article ">Figure 1
<p>Catabolism of heme, liberating carbon monoxide, iron, biliverdin, and bilirubin. The enzyme heme oxygenase-1 is induced by 5-ALA [<a href="#B44-biomedicines-09-00578" class="html-bibr">44</a>].</p>
Full article ">Figure 2
<p>Overview of the study design. Mice were acclimatised for 7 days, then commenced group-specific treatment with concurrent colitis induction via DSS. All mice were sacrificed on day 10.</p>
Full article ">Figure 3
<p>Stability profile of 5-ALA during, (<b>A</b>): incubation with faecal slurry (human (<span class="html-italic">n</span> = 3) and mouse (<span class="html-italic">n</span> = 10)); (<b>B</b>): incubation with colonic tissue enzymes (human (<span class="html-italic">n</span> = 1) and mouse (<span class="html-italic">n</span> = 3)); (<b>C</b>): percentage of 5-ALA in different compartments during Ussing experiment with human colonic tissue (1 donor); (<b>D</b>): percentage of 5-ALA in different compartments during Ussing experiment with mouse colonic tissue (<span class="html-italic">n</span> = 3). Permeation of 5-ALA occurs from the apical to basolateral side of tissue.</p>
Full article ">Figure 4
<p>(<b>A</b>): Daily mean disease activity index (DAI) scores for PO treatment groups; (<b>B</b>): DAI scores for IR treatment groups; (<b>C</b>): mean colonic weight to length ratios per treatment group; (<b>D</b>): mean spleen weights per treatment group. <span class="html-italic">n</span> = 7 mice per treatment group. Error bars: standard deviation. The * marker indicates significant 5-ALA superiority where <span class="html-italic">p</span> &lt; 0.05.</p>
Full article ">Figure 5
<p>Plasma concentrations of inflammatory markers: TNF-α (<b>A</b>); IL-6 (<b>B</b>); IL-1β (<b>C</b>); and the anti-inflammatory marker, IL-10 (<b>D</b>), in mice following 10 days of treatment. <span class="html-italic">n</span> = 7 mice per treatment group. Error bars: SEM, the * marker indicates significant 5-ALA/SFC superiority where <span class="html-italic">p</span> &lt; 0.05.</p>
Full article ">Figure 6
<p>Colonic tissue concentrations of inflammatory markers: TNF-α (<b>A</b>); IL-6 (<b>B</b>); and IL-1β (<b>C</b>); and the anti-inflammatory marker, IL-10 (<b>D</b>), in mice following 10 days of treatment. <span class="html-italic">n</span> = 7 per treatment group. Error bars: SEM, the * marker indicates significant 5-ALA/SFC superiority where <span class="html-italic">p</span> &lt; 0.05.</p>
Full article ">Figure 7
<p>Heme oxygenase-1 (HO-1) concentrations in plasma and colonic tissue per group, after 10 days of treatment. <span class="html-italic">n</span> = 7 mice per treatment group. Error bars: SD.</p>
Full article ">
4 pages, 156 KiB  
Editorial
The Genius of the Zebrafish Model: Insights on Development and Disease
by James A. Marrs and Swapnalee Sarmah
Biomedicines 2021, 9(5), 577; https://doi.org/10.3390/biomedicines9050577 - 20 May 2021
Cited by 3 | Viewed by 2703
Abstract
The zebrafish is an outstanding and inexpensive vertebrate model system for biomedical research [...] Full article
(This article belongs to the Special Issue Zebrafish Models for Development and Disease 2.0)
19 pages, 1941 KiB  
Review
Systemic Actions of SGLT2 Inhibition on Chronic mTOR Activation as a Shared Pathogenic Mechanism between Alzheimer’s Disease and Diabetes
by Gabriela Dumitrita Stanciu, Razvan Nicolae Rusu, Veronica Bild, Leontina Elena Filipiuc, Bogdan-Ionel Tamba and Daniela Carmen Ababei
Biomedicines 2021, 9(5), 576; https://doi.org/10.3390/biomedicines9050576 - 19 May 2021
Cited by 31 | Viewed by 4806
Abstract
Alzheimer’s disease (AD) affects tens of millions of people worldwide. Despite the advances in understanding the disease, there is an increased urgency for pharmacological approaches able of impacting its onset and progression. With a multifactorial nature, high incidence and prevalence in later years [...] Read more.
Alzheimer’s disease (AD) affects tens of millions of people worldwide. Despite the advances in understanding the disease, there is an increased urgency for pharmacological approaches able of impacting its onset and progression. With a multifactorial nature, high incidence and prevalence in later years of life, there is growing evidence highlighting a relationship between metabolic dysfunction related to diabetes and subject’s susceptibility to develop AD. The link seems so solid that sometimes AD and type 3 diabetes are used interchangeably. A candidate for a shared pathogenic mechanism linking these conditions is chronically-activated mechanistic target of rapamycin (mTOR). Chronic activation of unrestrained mTOR could be responsible for sustaining metabolic dysfunction that causes the breakdown of the blood-brain barrier, tau hyperphosphorylation and senile plaques formation in AD. It has been suggested that inhibition of sodium glucose cotransporter 2 (SGLT2) mediated by constant glucose loss, may restore mTOR cycle via nutrient-driven, preventing or even decreasing the AD progression. Currently, there is an unmet need for further research insight into molecular mechanisms that drive the onset and AD advancement as well as an increase in efforts to expand the testing of potential therapeutic strategies aimed to counteract disease progression in order to structure effective therapies. Full article
(This article belongs to the Special Issue Molecular Research of Alzheimer's Disease)
Show Figures

Figure 1

Figure 1
<p>Alzheimer’s disease is a neurodegenerative disease that involves a multitude of factors. Given the complexity of the human brain, the lack of effective research tools and reasonable animal models, the detailed pathophysiology of the disease remains unclear. Based on multifaceted nature of AD, there have been proposed various hypotheses, including Aβ aggregation, cholinergic dysfunction, tau aggregation, oxidative stress, inflammation, etc. Challenges and future prospects include extensive testing of new hypotheses such as endo-lysosomal, mitochondrial and metabolic dysfunctions to attack the disease from different angles for the effective development of an early diagnosis and successful drugs for therapies. NTF, neurofibrillary tangle; Ach, acetylcholine.</p>
Full article ">Figure 2
<p>Schematic representation of mTOR hyperactivity in cognitive aging and AD. (<b>a</b>) Left—The implications of mTOR in main processes of aging. These features of aging, to different degrees, lead to an increased risk for AD, as well as cognitive decline during normal aging. Rapamycin and other pharmacological approaches that decrease mTOR activity may be valuable for delaying AD progression. (<b>b</b>) Right—The interrelation between neuropathological hallmarks of AD and mTOR. Hyperactive mTOR increases the production of Aβ and tau; and many factors including diabetes may influence the crosstalk of these proteins, and the aberrant cycle it creates contributes to the pathogenesis of AD.</p>
Full article ">Figure 3
<p>Type 2 diabetes is characterized by insulin resistance caused by uncontrolled hepatic glucose synthesis and by reduced uptake of glucose by muscle and adipose tissue. The pancreas contains functional β cells, but the variable secretion of insulin affects the maintenance of glucose homeostasis because β cells are gradually reduced. AD is characterized by increased synthesis and accumulation of tau and β-amyloid proteins. Aβ plaques may induce insulin resistance. Cerebral glucose metabolism consists of glucose transport and intracellular oxidative catabolism, affecting this metabolism favoring the appearance of metabolic abnormalities highlighted in the brains of patients with AD. Chronic activation of mTOR may be responsible for as endo-lysosomal, mitochondrial and metabolic dysfunctions in AD. High glucose intake causes hyperactivation of mTOR with abnormal insulin signaling accompanied by accelerated progression and symptoms similar to AD and with hyperglycemia and the appearance of type 2 diabetes. In patients with type 2 diabetes and AD it occurs: increased oxidative stress, inflammation, cognitive deficit and insulin resistance. Type 2 diabetes therapies based on type 2 co-transport inhibitors for sodium and glucose promotes: natriuresis, reduced filtered glucose reabsorption, decreased renal threshold for glucose, increased urinary glucose excretion followed by reduced plasma glucose levels. These compounds have a positive impact on the restoration of the anabolic/catabolic cycle and represent a new way to treat AD. AD, Alzheimer’s disease; Aβ, amyloid β; SGLT2, sodium glucose cotransporter 2; mTOR, mechanistic target of rapamycin.</p>
Full article ">
22 pages, 11949 KiB  
Article
Hypoxia Engineered Bone Marrow Mesenchymal Stem Cells Targeting System with Tumor Microenvironment Regulation for Enhanced Chemotherapy of Breast Cancer
by Jingzhi Zu, Liwei Tan, Li Yang, Qi Wang, Jing Qin, Jing Peng, Hezhong Jiang, Rui Tan and Jian Gu
Biomedicines 2021, 9(5), 575; https://doi.org/10.3390/biomedicines9050575 - 19 May 2021
Cited by 6 | Viewed by 3278
Abstract
Improving the tumor targeting of docetaxel (DTX) would not only be favored for the chemotherapeutic efficacy, but also reduce its side effects. However, the regulation of the tumor microenvironment could further inhibit the growth of tumors. In this study, we introduced a system [...] Read more.
Improving the tumor targeting of docetaxel (DTX) would not only be favored for the chemotherapeutic efficacy, but also reduce its side effects. However, the regulation of the tumor microenvironment could further inhibit the growth of tumors. In this study, we introduced a system consisting of hypoxia-engineered bone marrow mesenchymal stem cells (H-bMSCs) and DTX micelles (DTX-M) for breast cancer treatment. First, the stem cell chemotherapy complex system (DTX@H-bMSCs) with tumor-targeting ability was constructed according to the uptake of DTX-M by hypoxia-induced bMSCs (H-bMSCs). DTX micellization improved the uptake efficiency of DTX by H-bMSCs, which equipped DTX@H-bMSCs with satisfactory drug loading and stability. Furthermore, the migration of DTX@H-bMSCs revealed that it could effectively target the tumor site and facilitate the drug transport between cells. Moreover, in vitro and in vivo pharmacodynamics of DTX@H-bMSCs exhibited a superior antitumor effect, which could promote the apoptosis of 4T1 cells and upregulate the expression of inflammatory factors at the tumor site. In brief, DTX@H-bMSCs enhanced the chemotherapeutic effect in breast cancer treatment. Full article
(This article belongs to the Section Gene and Cell Therapy)
Show Figures

Figure 1

Figure 1
<p>Preparation and characterization of DTX-M. The drug loading (DL) of DTX-M was 5%, and the concentration of DTX was 1 mg/mL (<a href="#biomedicines-09-00575-t001" class="html-table">Table 1</a>); photo of DTX-M, blank micelles and N.S (<b>A</b>); TEM and size distribution of micelles (<b>B</b>); XRD spectra of DTX, DTX with blank micelles, and DTX-M (<b>C</b>); the drug release behavior in vitro (<b>D</b>); micellar stability in different media by the evaluation of the PDI (<b>E</b>) and particle size (<b>F</b>) change. (Experiments were performed in triplicate and values were mean ± SEM.)</p>
Full article ">Figure 2
<p>Construction and characterization of hypoxia-engineered bMSCs. mRNA detection of CXCR4 in H-bMSCs at various hypoxia times (<b>A</b>); expression of CXCR4 in H-bMSCs at different hypoxia times (<b>B</b>); the quantitative analysis of CXCR4 (<b>C</b>); immunofluorescence images of CXCR4 (<b>D</b>); cell viability of bMSCs at different hypoxia times (<b>E</b>). (** <span class="html-italic">p</span> &lt; 0.01).</p>
Full article ">Figure 3
<p>Construction of DTX@H-bMSCs and DTX@bMSCs. The cytotoxicity of DTX-M or free DTX to bMSCs (<b>A</b>) and H-bMSCs (<b>B</b>), respectively. The fluorescence images (<b>C</b>) and the quantification (<b>D</b>) of C6 or C6-M uptake by H-bMSCs and bMSCs with different incubation times. The drug loading detection of DTX@H-bMSCs and DTX@bMSCs with different DTX-M concentrations (<b>E</b>). (* <span class="html-italic">p</span> &lt; 0.05) (** <span class="html-italic">p</span> &lt; 0.01).</p>
Full article ">Figure 4
<p>The drug delivery behavior in vitro. The drug release behavior of the complexes (<b>A</b>); the cellular uptake of 4T1 cells from bMSCs or H-bMSCs (<b>B</b>); the images of drug delivery from bMSCs or H-bMSCs to 4T1 cells (<b>C</b>), red fluorescence indicates BrdU labeled 4T1 cells, blue fluorescence indicates DAPI and green fluorescence indicates C6 or C6-M.</p>
Full article ">Figure 5
<p>Evaluation of H-bMSCs migration in vitro. Images of the migrated bMSCs or H-bMSCs (in purple) through a membrane with 8 µm pore size preformed in transwell (<b>A</b>); quantitative analysis of the in vitro migration of bMSCs or H-bMSCs (<b>B</b>). (** <span class="html-italic">p</span> &lt; 0.01).</p>
Full article ">Figure 6
<p>Pharmacodynamic investigation of DTX@H-bMSCs in vitro. Antitumor effect of DTX@H-bMSCs against 4T1 cells (<b>A</b>); fluorescence live/dead cell images and quantitative analysis of 4T1 cells in each group were studied in transwell plates (<b>B</b>); the concentration of TNF-α of 4T1 cells in each group (<b>C</b>); flow cytometry analysis of 4T1 cells apoptosis induced by different treatments (<b>D</b>). (* <span class="html-italic">p</span> &lt; 0.05) (** <span class="html-italic">p</span> &lt; 0.01).</p>
Full article ">Figure 7
<p>In vivo biodistribution of Control 1, Cy7 micelles (Cy7-M) 2, Cy7@bMSCs 3 and Cy7@H-bMSCs 4. Real-time fluorescence images of subcutaneous 4T1 cell tumor bearing mice after intravenous injection at set time point (<b>A</b>); the fluorescence images of ex vivo tissues at 24 h post-injection (<b>B</b>); the quantitative analysis of the fluorescence intensity in mice and in tissues are shown in (<b>C</b>,<b>D</b>), respectively. The distribution of H-bMSCs and bMSCs at tumor sites (green fluorescence) at one day and three days after intravenous injection, the SDF-1α were labeled with red fluorescence (<b>E</b>). (** <span class="html-italic">p</span> &lt; 0.01).</p>
Full article ">Figure 8
<p>Antitumor activity of DTX@H-bMSCs in vivo. Administration route of DTX@H-bMSCs in mice model of in situ tumor transplantation of 4T1 cells (<b>A</b>); photographs of mice with different treatments at 4, 8, 12, and 16 days after administration (<b>B</b>); tumor growth curve of each group (<b>C</b>); weights and images of the tumors at 16 days after administration (<b>D</b>); survival curves after different treatments (<b>E</b>). (** <span class="html-italic">p</span> &lt; 0.01).</p>
Full article ">Figure 9
<p>Histopathological analysis of tumor tissues after administration. The histopathological section including HE stain, Ki 67 stain, and TUNEL stain in each group (<b>A</b>–<b>C</b>) indicate quantification of Ki 67 and TUNEL stain, respectively. (** <span class="html-italic">p</span> &lt; 0.01) (values are mean ± SEM, and there were five samples in each group.).</p>
Full article ">Figure 10
<p>Representative immune-fluorescence imaging (<b>A</b>) and IOD analysis (<b>B</b>); TNF-α levels in tumor tissue measured by quantitative ELISA (<b>C</b>). Red fluorescence indicates TNF-α and blue indicates DAPI. (* <span class="html-italic">p</span> &lt; 0.05) (**<span class="html-italic">p</span> &lt; 0.01).</p>
Full article ">Figure 11
<p>Safety and biocompatibility evaluation. Body weight of mice in each group (<b>A</b>); histological characterization of the heart, liver, kidney, and spleen tissues obtained from mice of different treatment groups (<b>B</b>).</p>
Full article ">Scheme 1
<p>Scheme of the preparation pathway and the synergistic mechanism of DTX@H-bMSCs targeted system for enhanced chemotherapy of breast cancer. The hypoxia engineered bMSCs would not only be used as the DTX carriers targeting tumor tissue based on CXCR4/SDF-1α, but also regulate inflammation in TME. As a result, the superior properties of DTX@H-bMSCs, including homing ability, regulation of TME and chemotherapy efficient inhibited the growth of breast tumor.</p>
Full article ">
20 pages, 4726 KiB  
Article
Deciphering the Molecular Mechanism of Water Interaction with Gelatin Methacryloyl Hydrogels: Role of Ionic Strength, pH, Drug Loading and Hydrogel Network Characteristics
by Margaux Vigata, Christoph Meinert, Nathalie Bock, Bronwin L. Dargaville and Dietmar W. Hutmacher
Biomedicines 2021, 9(5), 574; https://doi.org/10.3390/biomedicines9050574 - 19 May 2021
Cited by 42 | Viewed by 6327
Abstract
Water plays a primary role in the functionality of biomedical polymers such as hydrogels. The state of water, defined as bound, intermediate, or free, and its molecular organization within hydrogels is an important factor governing biocompatibility and hemocompatibility. Here, we present a systematic [...] Read more.
Water plays a primary role in the functionality of biomedical polymers such as hydrogels. The state of water, defined as bound, intermediate, or free, and its molecular organization within hydrogels is an important factor governing biocompatibility and hemocompatibility. Here, we present a systematic study of water states in gelatin methacryloyl (GelMA) hydrogels designed for drug delivery and tissue engineering applications. We demonstrate that increasing ionic strength of the swelling media correlated with the proportion of non-freezable bound water. We attribute this to the capability of ions to create ion–dipole bonds with both the polymer and water, thereby reinforcing the first layer of polymer hydration. Both pH and ionic strength impacted the mesh size, having potential implications for drug delivery applications. The mechanical properties of GelMA hydrogels were largely unaffected by variations in ionic strength or pH. Loading of cefazolin, a small polar antibiotic molecule, led to a dose-dependent increase of non-freezable bound water, attributed to the drug’s capacity to form hydrogen bonds with water, which helped recruit water molecules in the hydrogels’ first hydration layer. This work enables a deeper understanding of water states and molecular arrangement at the hydrogel–polymer interface and how environmental cues influence them. Full article
(This article belongs to the Special Issue Hydrogels for Biomedical Application)
Show Figures

Figure 1

Figure 1
<p>Differential scanning calorimetry (DSC) thermogram of 15% GelMA crosslinked in PBS and swelled in PBS.</p>
Full article ">Figure 2
<p>Water content and water types for GelMA hydrogels (5% to 15% gel fraction) crosslinked and swelled in different media. (<b>A</b>) Equilibrium water content (<span class="html-italic">EWC</span>, <span class="html-italic">n</span> = 5). (<b>B</b>) Non-freezable bound water (<span class="html-italic">W<sub>nfb</sub></span>) normalized to the <span class="html-italic">EWC</span> (<span class="html-italic">n</span> = 3). (<b>C</b>) Freezable water (<span class="html-italic">W<sub>f</sub></span>) normalized to the <span class="html-italic">EWC</span> (<span class="html-italic">n</span> = 3).</p>
Full article ">Figure 3
<p>Graphic illustration of the water content in GelMA hydrogels under different crosslinking and swelling conditions. <span class="html-italic">W<sub>f</sub></span>, characterized by intermediate mobility and crystallizability, are represented in light blue and with one hydrogen bond. <span class="html-italic">W<sub>nfb</sub></span> molecules in dark blue have two bonds (hydrogen bond or ion–dipole bond), have the lowest mobility, and are not crystallizable. In the top-left, no ions are present; therefore, the <span class="html-italic">W<sub>nfb</sub></span> is minimal. In the top-right, the introduction of ions from the crosslinking media leads to the formation of ion–dipole bonds between ion, water, and polymer functional groups, thereby reinforcing the <span class="html-italic">W<sub>nfb</sub></span> fraction, yet with minimal effect on swelling since the swelling media does not contain ions. When the swelling media is PBS, (lower-left and right), the higher ion concentration reinforces the <span class="html-italic">W<sub>nfb</sub></span> fraction via ion–dipole bonds between GelMA functional groups and water.</p>
Full article ">Figure 4
<p>Water content and water types for GelMA hydrogels (5% to 15% gel fraction) crosslinked in water and swelled at different ionic strengths. (<b>A</b>) Equilibrium water content (<span class="html-italic">EWC</span>, <span class="html-italic">n</span> = 5). (<b>B</b>) Non-freezable bound water (<span class="html-italic">W<sub>nfb</sub></span>) normalized to the <span class="html-italic">EWC</span> (<span class="html-italic">n</span> = 3). (<b>C</b>) Freezable water (<span class="html-italic">W<sub>f</sub></span>) normalized to the <span class="html-italic">EWC</span> (<span class="html-italic">n</span> = 3).</p>
Full article ">Figure 5
<p>Mesh size for GelMA hydrogels (5% to 15%) crosslinked in water and swelled at different ionic strengths.</p>
Full article ">Figure 6
<p>Graphic illustration of the proposed mechanism of water–GelMA interactions in GelMA hydrogels swelled at different ionic strengths. <span class="html-italic">W<sub>f</sub></span>, <span class="html-italic">W<sub>nfb</sub></span> and free water molecules are presented with the same conventions as in <a href="#biomedicines-09-00574-f003" class="html-fig">Figure 3</a>. On the right, the highest ionic strength of the swelling media reinforces the <span class="html-italic">W<sub>nfb</sub></span> fraction, more than for the lowest ion concentration on the left, due to increased number of ion–dipole bonds.</p>
Full article ">Figure 7
<p>Water content and water types for GelMA hydrogels (5% to 15% gel fraction) crosslinked in water and swelled in media of different pH and fixed ionic strength of 150 mM. (<b>A</b>) Equilibrium water content (<span class="html-italic">EWC</span>, <span class="html-italic">n</span> = 5). (<b>B</b>) Non-freezable bound water (<span class="html-italic">W<sub>nfb</sub></span>) normalized to the <span class="html-italic">EWC</span> (<span class="html-italic">n</span> = 3). (<b>C</b>) Freezable water (<span class="html-italic">W<sub>f</sub></span>) normalized to the <span class="html-italic">EWC</span> (<span class="html-italic">n</span> = 3).</p>
Full article ">Figure 8
<p>Mesh size for GelMA hydrogels (5% to 15%) crosslinked in water and swelled at different pH.</p>
Full article ">Figure 9
<p>Mechanical properties for GelMA hydrogels (5% to 15% gel fraction) swelled at different pH. (<b>A</b>) Compressive modulus. (<b>B</b>) Failure stress. (<b>C</b>) Failure strain. Data are shown as means ± standard deviation, <span class="html-italic">n</span> = 6–8. ** = <span class="html-italic">p</span> &lt; 0.01; **** = <span class="html-italic">p</span> &lt; 0.0001.</p>
Full article ">Figure 10
<p>Graphic illustration of the water content in GelMA hydrogels swelled at different pH. <span class="html-italic">W<sub>f</sub></span>, <span class="html-italic">W<sub>nfb</sub></span> and free water molecules are presented with the same conventions as in <a href="#biomedicines-09-00574-f003" class="html-fig">Figure 3</a>. On the left, when the pH of the swelling media is below the GelMA isoelectric point, the amine functional groups are protonated, thus providing an overall positive charge at the surface of GelMA. Because the amine groups are in the minority compared to the carboxylic acid groups, the charge and effect on the water content and states is minimal. On the right, when the pH of the swelling media is above the GelMA isoelectric point, the carboxylic functional groups tend to be deprotonated, giving an overall negative charge to the hydrogel, making it more hydrophilic and thus imparting a higher water content and higher <span class="html-italic">W<sub>nfb</sub></span>.</p>
Full article ">Figure 11
<p>Water content and water types for GelMA hydrogels (5% to 15% gel fraction) crosslinked with 0, 3, 15, 30 or 90 µg cefazolin in PBS. Hydrogels were analyzed just after crosslinking. (<b>A</b>) Equilibrium water content (<span class="html-italic">EWC</span>) (%) (<span class="html-italic">n</span> = 5). (<b>B</b>) Non-freezable bound water (<span class="html-italic">W<sub>nfb</sub></span>) (%) normalized to the <span class="html-italic">EWC</span> (<span class="html-italic">n</span> = 3). (<b>C</b>) Freezable water (<span class="html-italic">W<sub>f</sub></span>) (%) normalized to the <span class="html-italic">EWC</span> (<span class="html-italic">n</span> = 3). Ns = non-significant; * = <span class="html-italic">p</span> &lt; 0.05; ** = <span class="html-italic">p</span> &lt; 0.01; *** = <span class="html-italic">p</span> &lt; 0.001; **** = <span class="html-italic">p</span> &lt; 0.0001.</p>
Full article ">Figure 12
<p>Graphic illustration cefazolin interaction with water molecules at pH 7.4. The polar hydrogen, nitrogen, sulfur, and oxygen atoms can form hydrogen bonds with water molecules.</p>
Full article ">
18 pages, 266 KiB  
Review
Treatment of Painful Diabetic Neuropathy—A Narrative Review of Pharmacological and Interventional Approaches
by Mayank Gupta, Nebojsa Nick Knezevic, Alaa Abd-Elsayed, Mahoua Ray, Kiran Patel and Bhavika Chowdhury
Biomedicines 2021, 9(5), 573; https://doi.org/10.3390/biomedicines9050573 - 19 May 2021
Cited by 33 | Viewed by 7756
Abstract
Painful diabetic neuropathy (PDN) is a common complication of diabetes mellitus that is associated with a significant decline in quality of life. Like other painful neuropathic conditions, PDN is difficult to manage clinically, and a variety of pharmacological and non-pharmacological options are available [...] Read more.
Painful diabetic neuropathy (PDN) is a common complication of diabetes mellitus that is associated with a significant decline in quality of life. Like other painful neuropathic conditions, PDN is difficult to manage clinically, and a variety of pharmacological and non-pharmacological options are available for this condition. Recommended pharmacotherapies include anticonvulsive agents, antidepressant drugs, and topical capsaicin; and tapentadol, which combines opioid agonism and norepinephrine reuptake inhibition, has also recently been approved for use. Additionally, several neuromodulation therapies have been successfully used for pain relief in PDN, including intrathecal therapy, transcutaneous electrical nerve stimulation (TENS), and spinal cord stimulation (SCS). Recently, 10 kHz SCS has been shown to provide clinically meaningful pain relief for patients refractory to conventional medical management, with a subset of patients demonstrating improvement in neurological function. This literature review is intended to discuss the dosage and prospective data associated with pain management therapies for PDN. Full article
(This article belongs to the Special Issue Neuropathic Pain: Therapy and Mechanisms)
14 pages, 2738 KiB  
Hypothesis
A Cell Membrane-Level Approach to Cicatricial Alopecia Management: Is Caveolin-1 a Viable Therapeutic Target in Frontal Fibrosing Alopecia?
by Ivan Jozic, Jérémy Chéret, Beatriz Abdo Abujamra, Mariya Miteva, Jennifer Gherardini and Ralf Paus
Biomedicines 2021, 9(5), 572; https://doi.org/10.3390/biomedicines9050572 - 19 May 2021
Cited by 8 | Viewed by 4480
Abstract
Irreversible destruction of the hair follicle (HF) in primary cicatricial alopecia and its most common variant, frontal fibrosing alopecia (FFA), results from apoptosis and pathological epithelial-mesenchymal transition (EMT) of epithelial HF stem cells (eHFSCs), in conjunction with the collapse of bulge immune privilege [...] Read more.
Irreversible destruction of the hair follicle (HF) in primary cicatricial alopecia and its most common variant, frontal fibrosing alopecia (FFA), results from apoptosis and pathological epithelial-mesenchymal transition (EMT) of epithelial HF stem cells (eHFSCs), in conjunction with the collapse of bulge immune privilege (IP) and interferon-gamma-mediated chronic inflammation. The scaffolding protein caveolin-1 (Cav1) is a key component of specialized cell membrane microdomains (caveolae) that regulates multiple signaling events, and even though Cav1 is most prominently expressed in the bulge area of human scalp HFs, it has not been investigated in any cicatricial alopecia context. Interestingly, in mice, Cav1 is involved in the regulation of (1) key HF IP guardians (TGF-? and ?-MSH signaling), (2) IP collapse inducers/markers (IFN?, substance P and MICA), and (3) EMT. Therefore, we hypothesize that Cav1 may be an unrecognized, important player in the pathobiology of cicatricial alopecias, and particularly, in FFA, which is currently considered as the most common type of primary lymphocytic scarring alopecia in the world. We envision that localized therapeutic inhibition of Cav1 in management of FFA (by cholesterol depleting agents, i.e., cyclodextrins/statins), could inhibit and potentially reverse bulge IP collapse and pathological EMT. Moreover, manipulation of HF Cav1 expression/localization would not only be relevant for management of cicatricial alopecia, but FFA could also serve as a model disease for elucidating the role of Cav1 in other stem cell- and/or IP collapse-related pathologies. Full article
(This article belongs to the Special Issue Hair Pathology)
Show Figures

Figure 1

Figure 1
<p>Proposed mechanism for the role of Caveolin-1 in development of FFA. (<b>a</b>) Inflammation-induced downregulation of E-cadherin along with excessive IFNγ and EGF signaling promote pathological EMT in bulge epithelial cells of human scalp HFs. (<b>b</b>) Upregulation of caveolin-1 (Cav1) expression allows for monomeric Cav1 to oligomerize at the cell membrane and induce formation of caveolae. Cav1 antagonizes TGF-β signaling by sequestering TGF-β receptors and preventing phosphorylation and signaling through Smad2, inhibiting its association with Smad4, as well as subsequent Smad2 nuclearization and TGFβ-mediated transcriptional activation. Conversely, upregulation of Cav1 leads to increased Substance P levels and promotes localization of its receptor NK-1 to caveolae where NK-1 interacts with downstream G-protein, resulting in sustained Substance P signaling through the NK-1 receptor. Lastly, upregulation of Cav1 has been associated with upregulation of MICA and Vimentin, as well as a downregulation of E-cadherin. Therefore, upregulation of Cav1 orchestrates development of environment permissive to eHFSC IP collapse by (1) inhibiting guardians of IP (TGF-β signaling), (2) promoting suppressors of IP (Substance P and MICA), and (3) promoting EMT (upregulating vimentin and downregulating E-cadherin).</p>
Full article ">Figure 2
<p>Caveolin-1 colocalizes with markers of eHFSCs in the outer root sheath cells in human hair follicles. (<b>a</b>) Cav1 immunostaining of normal human scalp hair follicles exhibits colocalization with K15 and CD34, common markers of eHFSC in ORS cells. ORS-Outer Root Sheath. Treatment of normal human scalp hair follicles with Sandalore results in downregulation of Cav1 expression in the bulge at both protein (<b>b</b>,<b>c</b>) and mRNA levels (<b>d</b>). Data are expressed as mean ± SEM, <span class="html-italic">n</span> = 13–16 HFs from 2 different donors, Student’s <span class="html-italic">t</span>-test, *** <span class="html-italic">p</span> &lt; 0.001, GraphPad Prism 6.</p>
Full article ">Figure 3
<p>Elevated levels of Cav1 in FFA. (<b>a</b>) FFA scalp at the level of the bulge exhibits upregulation of Cav1 expression in comparison to normal scalp from the healthy human donors. HF: Hair follicle; SG: Sebaceous gland. (<b>b</b>) Quantification of Cav1 expression from basal layer of outer root sheath cells with error bars corresponding to SEM from <span class="html-italic">n</span> = 3 different donors. (<b>c</b>) Levels of other structural components of caveolae (Cav2 and Cavin1/PTRF) remain unchanged in comparison to healthy normal scalp, thus indicating a Cav1-specific effect.</p>
Full article ">Figure 4
<p>Differential regulation of IP Guardian/Collapse and EMT/MET-related genes in Cav1 knockout mouse skin. (<b>a</b>) Full thickness skin biopsy punches from location matched 8-week-old female C57BL6 (i.e., Cav1 WT type) and global Cav1 knockout (Cav1<sup>KO</sup>) mice were utilized to assess expression levels of IP Guardian (CD200, IL-10), IP Collapse (Substance P, β2MG, MHC Class I, CXCL11), and EMT/MET-related genes (E-cadherin, N-cadherin, TWIST1) by qRT-PCR. Cav1<sup>KO</sup> mouse skin exhibits upregulation of IP guardian genes and a marker of epithelial cells (E-cadherin), as well as a downregulation of IP collapse and EMT related genes. Error bars correspond to standard deviation from <span class="html-italic">n</span> = 3 mice.</p>
Full article ">Figure 5
<p>Lovastatin treatment of Outer Root Sheath (ORS) keratinocytes results in downregulation of numerous structural components of caveolae. Primary Outer Root Sheath (ORS) keratinocytes isolated from normal human scalp were treated with 5 µM Lovastatin for 6 h and then utilized to assess expression levels of structural components of caveolae including Cav1, Cav2, Cavin1 (aka PTRF), Cavin2 (aka SDPR), Cavin3 (aka SRBC) and Cavin4 (aka MURC). Cholesterol disruption by Lovastatin resulted in downregulation of each structural component of caveolae. Error bars correspond to SEM from n = 3 technical replicates with statistical significance assessed using two-way ANOVA with Bonferroni correction for multiple comparisons, * <span class="html-italic">p</span> &lt; 0.05, ** <span class="html-italic">p</span> &lt; 0.01, *** <span class="html-italic">p</span> &lt; 0.001.</p>
Full article ">
16 pages, 3452 KiB  
Article
CX-4945 and siRNA-Mediated Knockdown of CK2 Improves Cisplatin Response in HPV(+) and HPV(?) HNSCC Cell Lines
by Janeen H. Trembley, Bin Li, Betsy T. Kren, Amy A. Gravely, Emiro Caicedo-Granados, Mark A. Klein and Khalil Ahmed
Biomedicines 2021, 9(5), 571; https://doi.org/10.3390/biomedicines9050571 - 18 May 2021
Cited by 9 | Viewed by 3934
Abstract
Head and neck squamous cell carcinoma (HNSCC) can be categorized into human papillomavirus (HPV) positive or negative disease. Elevated protein kinase CK2 level and activity have been historically observed in HNSCC cells. Previous studies on CK2 in HNSCC did not generally include consideration [...] Read more.
Head and neck squamous cell carcinoma (HNSCC) can be categorized into human papillomavirus (HPV) positive or negative disease. Elevated protein kinase CK2 level and activity have been historically observed in HNSCC cells. Previous studies on CK2 in HNSCC did not generally include consideration of HPV(+) and HPV(?) status. Here, we investigated the response of HPV(+) and HPV(?) HNSCC cells to CK2 targeting using CX-4945 or siRNA downregulation combined with cisplatin treatment. HNSCC cell lines were examined for CK2 expression levels and activity and response to CX-4945, with and without cisplatin. CK2 levels and NF?B p65-related activity were high in HPV(+) HNSCC cells relative to HPV(?) HNSCC cells. Treatment with CX-4945 decreased viability and cisplatin IC50 in all cell lines. Targeting of CK2 increased tumor suppressor protein levels for p21 and PDCD4 in most instances. Further study is needed to understand the role of CK2 in HPV(+) and HPV(?) HNSCC and to determine how incorporation of the CK2-targeted inhibitor CX-4945 could improve cisplatin response in HNSCC. Full article
(This article belongs to the Special Issue CK2 Regulation of Cell Death and Targeting in Cancer Treatment)
Show Figures

Figure 1

Figure 1
<p>Expression of CK2 subunits and key markers in untransformed cells and HNSCC cell lines. Immunoblot analysis of cultured cell lines, as indicated above the blots. CK2α and CK2α’ antibodies were combined for simultaneous detection of these 2 proteins. Proteins detected are indicated on the right side of the blots. Molecular mass markers are indicated on the left side of the blots. Actin signal was used as the loading control.</p>
Full article ">Figure 2
<p>Viability curves for cisplatin treatment alone or combined with reduced CK2 activity or expression in HPV(+) and HPV(−) HNSCC. Cells were treated and viability measured using MTT-related assays as described in Materials and Methods. Log10 cisplatin dosing is indicated on the <span class="html-italic">X</span>-axis and viability relative to control is indicated on the <span class="html-italic">Y</span>-axis. (<b>A</b>) Cisplatin anchored analysis viability curves for cisplatin alone or combined with CX-4945. Cisplatin treatment alone is indicated by black triangles, and combined CX-4945 plus cisplatin treatment is indicated by blue circles. <span class="html-italic">N</span> = 4. IC50 values are shown in <a href="#biomedicines-09-00571-t003" class="html-table">Table 3</a>. Combination Index for 50% loss of viability is indicated on each curve (ED50 CI). (<b>B</b>) Viability curves for cisplatin treatment in siCK2 or siControl transfected cells. Cisplatin/siControl treatment is indicated by black squares (Detroit-562) and black triangles (Fadu), and cisplatin/siCK2 treatment is indicated by blue circles. <span class="html-italic">N</span> = 4. IC50 values are indicated on each curve. 95% CI for Detroit-562: Cis + siControl (8.99, 31.22 µM), Cis + siCK2 (0.43, 1.2 µM). 95% CI for FaDu: Cis + siControl (3.47, 10.37), Cis + siCK2 (0.77, 2.79 µM).</p>
Full article ">Figure 3
<p>Immunoblot analysis of various signals following CX-4945 treatment alone or combined with cisplatin in HNSCC. Cells were treated and protein expression measured using immunoblot assays as described under Materials and Methods. The drug concentrations (µM) for CX-4945/cisplatin for each cell line were as follows: Detroit-562 1.5/5; Fadu 2.5/5; all others 5/5. (<b>A</b>) Representative blots from immunoblot analysis of HNSCC cells following CX-4945 treatment (48 h) with and without cisplatin (24 h). Proteins detected are indicated on the right side of the blots. Actin signal was used as the loading control. (<b>B</b>) Charts representing quantitation of protein signals relative to DMSO control treatment. Orange = CX-4945 treatment alone. Blue = CX-4945 and cisplatin treatment combined. Black open circles represent each data point from 2 biological replicate immunoblots.</p>
Full article ">Figure 4
<p>Immunoblot analysis of various signals following CK2 downregulation alone or combined with cisplatin in HNSCC. Cells were treated and protein expression measured using immunoblot assays as described under Materials and Methods. (<b>A</b>) Immunoblot analysis of Detroit-562 and Fadu cells following siRNA transfection (48 h) with and without cisplatin (24 h) carried out as described under Materials and Methods. CK2α and CK2α’ antibodies were combined for simultaneous detection of these 2 proteins. Proteins detected are indicated on the right side of the blots. Actin signal was used as the loading control. (<b>B</b>) Charts representing quantitation of protein signals relative to si-Control treatment. Orange = siCK2. Blue = siCK2 and cisplatin treatment combined. Black open circles represent each data point from 3 biological replicate experiments. siCtrl = siRNA for non-targeting control.</p>
Full article ">Figure 5
<p>Comparison of PDCD4 induction following combined CX-4945 and cisplatin treatment in HPV(−) vs. HPV(+) HNSCC cells. The mean and SEM of PDCD4 immunoblot signals relative to DMSO control treatment is depicted. Red = HPV(−). Blue = HPV(+). Circles represent each data point.</p>
Full article ">Figure 6
<p>Impact of CK2 level and activity in HNSCC. A summary of results presented here and previously published from this group and others is depicted. Increased cisplatin sensitivity following CX-4945 or CK2 downregulation is observed in both HPV(+) and HPV(−) HNSCC cells.</p>
Full article ">
22 pages, 8307 KiB  
Review
Smart Hydrogels Meet Carbon Nanomaterials for New Frontiers in Medicine
by Simone Adorinni, Petr Rozhin and Silvia Marchesan
Biomedicines 2021, 9(5), 570; https://doi.org/10.3390/biomedicines9050570 - 18 May 2021
Cited by 46 | Viewed by 6597
Abstract
Carbon nanomaterials include diverse structures and morphologies, such as fullerenes, nano-onions, nanodots, nanodiamonds, nanohorns, nanotubes, and graphene-based materials. They have attracted great interest in medicine for their high innovative potential, owing to their unique electronic and mechanical properties. In this review, we describe [...] Read more.
Carbon nanomaterials include diverse structures and morphologies, such as fullerenes, nano-onions, nanodots, nanodiamonds, nanohorns, nanotubes, and graphene-based materials. They have attracted great interest in medicine for their high innovative potential, owing to their unique electronic and mechanical properties. In this review, we describe the most recent advancements in their inclusion in hydrogels to yield smart systems that can respond to a variety of stimuli. In particular, we focus on graphene and carbon nanotubes, for applications that span from sensing and wearable electronics to drug delivery and tissue engineering. Full article
(This article belongs to the Special Issue Hydrogels for Biomedical Application)
Show Figures

Figure 1

Figure 1
<p>Carbon nanostructures (not to scale), reproduced from Adorinni, S. et. al. (2021) [<a href="#B41-biomedicines-09-00570" class="html-bibr">41</a>] under a Creative Commons license (<a href="https://creativecommons.org/licenses/by/4.0/" target="_blank">https://creativecommons.org/licenses/by/4.0/</a>). The nano-onion schematic structure is reproduced with permission from Ugarte, D. et al. (1996) [<a href="#B42-biomedicines-09-00570" class="html-bibr">42</a>], copyright ©1995 Elsevier.</p>
Full article ">Figure 2
<p>Results of a literature search (22 April 2021) on Scopus for documents over the last decade with the keywords “hydrogels” and one of the carbon nanomaterials as shown in the legend. The results pertaining nano-onions, nanohorns, or nanodiscs were &lt;10 in total and are omitted.</p>
Full article ">Figure 3
<p>Self-healing GO-PVA hydrogel. (<b>a</b>,<b>b</b>) examples of the self-healing ability. (<b>c</b>) self-healing mechanism based on the use of borax as cross-linker between hydroxyl groups of PVA polymer. Reproduced from Zheng, C. et al. (2019) [<a href="#B87-biomedicines-09-00570" class="html-bibr">87</a>], under a Creative Commons license (<a href="https://creativecommons.org/licenses/by/4.0/" target="_blank">https://creativecommons.org/licenses/by/4.0/</a>).</p>
Full article ">Figure 4
<p>rGO-MXene hydrogels preparation (<b>a</b>) as scaffolds for cell networks (<b>b</b>). Adapted from Wychowaniec, J.K. et al. (2020) [<a href="#B102-biomedicines-09-00570" class="html-bibr">102</a>], under a Creative Commons license (<a href="https://creativecommons.org/licenses/by/4.0/" target="_blank">https://creativecommons.org/licenses/by/4.0/</a>).</p>
Full article ">Figure 5
<p>Example of mechanically responsive graphene hydrogel for drug release. Adapted with permission from Gonzalez-Dominguez, J.M. et al. (2018) [<a href="#B86-biomedicines-09-00570" class="html-bibr">86</a>] Copyright © 2021, American Chemical Society.</p>
Full article ">Figure 6
<p>Photo-triggered drug release from a phenylalanine derived hydrogelator that self-assembles into helical nanoribbons on the surface of GO flakes and allows for enantioselective drug adsorption. Reprinted with permission from Zhang, Y. et al. (2020) [<a href="#B98-biomedicines-09-00570" class="html-bibr">98</a>], Copyright © 2021 American Chemical Society.</p>
Full article ">Figure 7
<p>(<b>a</b>) Schematic hydrogelation process. (<b>b</b>) SEM image of the hydrogel. (<b>c</b>) Stretching of the elastic material. Reproduced with permission from Wang, H. et al. (2020) [<a href="#B149-biomedicines-09-00570" class="html-bibr">149</a>] © 2021 Elsevier.</p>
Full article ">Figure 8
<p>Aqueous battery for smart contact lenses based on polyvinylidene fluoride polymer, CNTs, and Prussian blue analogue nanoparticles CuHCFe and FeHCFe as cathode and anode, respectively. Reproduced from Yun, J. (2021) [<a href="#B160-biomedicines-09-00570" class="html-bibr">160</a>] © 2021 American Chemical Society.</p>
Full article ">Figure 9
<p>Neuronal axon myelination after 30-day cultivation within peptide-CNT hydrogels. (<b>a</b>–<b>c</b>) Immunostaining with anti-S100/anti-NF200 antibodies to probe the interactions between Schwann cells and axons and (<b>d</b>–<b>f</b>) with anti-MBP/anti-NF200 antibodies to probe myelination. (<b>g</b>) 3D structure of bundled axons within the hydrogel under electrical stimulation. The asterisk-marked region in (<b>g</b>) was investigated by analyzing (<b>h-i</b>) higher-magnification sections with axons and myelinated segments colored green and red, respectively. Adapted with permission from He, L. (2020) [<a href="#B153-biomedicines-09-00570" class="html-bibr">153</a>], copyright © 2021, American Chemical Society.</p>
Full article ">Figure 10
<p>(1) Nanosensors based on near-infrared fluorescent CNTs. (2) Array of eight hydrogel nanosensors and one reference. (3) Bacteria growth changes the sensor array fingerprint, which allows us to differentiate important pathogens. (4) Multiple sensors can be spectrally encoded and used for hyperspectral differentiation of bacteria. Reproduced from Nißler, R. et al. (2020) [<a href="#B157-biomedicines-09-00570" class="html-bibr">157</a>].</p>
Full article ">
20 pages, 3722 KiB  
Article
Influence of Serotonin 5-HT4 Receptors on Responses to Cardiac Stressors in Transgenic Mouse Models
by Ulrich Gergs, Timo Gerigk, Jonas Wittschier, Constanze T. Schmidbaur, Clara Röttger, Mareen Mahnkopf, Hanna Edler, Hartmut Wache and Joachim Neumann
Biomedicines 2021, 9(5), 569; https://doi.org/10.3390/biomedicines9050569 - 18 May 2021
Cited by 6 | Viewed by 3474
Abstract
The current study aimed to deepen our knowledge on the role of cardiac 5-HT4 receptors under pathophysiological conditions. To this end, we used transgenic (TG) mice that overexpressed human 5-HT4a receptors solely in cardiac myocytes (5-HT4-TG mice) and their [...] Read more.
The current study aimed to deepen our knowledge on the role of cardiac 5-HT4 receptors under pathophysiological conditions. To this end, we used transgenic (TG) mice that overexpressed human 5-HT4a receptors solely in cardiac myocytes (5-HT4-TG mice) and their wild-type (WT) littermates that do not have functional cardiac 5-HT4 receptors as controls. We found that an inflammation induced by lipopolysaccharide (LPS) was detrimental to cardiac function in both 5-HT4-TG and WT mice. In a hypoxia model, isolated left atrial preparations from the 5-HT4-TG mice went into contracture faster during hypoxia and recovered slower following hypoxia than the WT mice. Similarly, using isolated perfused hearts, 5-HT4-TG mice hearts were more susceptible to ischemia compared to WT hearts. To study the influence of 5-HT4 receptors on cardiac hypertrophy, 5-HT4-TG mice were crossbred with TG mice overexpressing the catalytic subunit of PP2A in cardiac myocytes (PP2A-TG mice, a model for genetically induced hypertrophy). The cardiac contractility, determined by echocardiography, of the resulting double transgenic mice was attenuated like in the mono-transgenic PP2A-TG and, therefore, largely determined by the overexpression of PP2A. In summary, depending on the kind of stress put upon the animal or isolated tissue, 5-HT4 receptor overexpression could be either neutral (genetically induced hypertrophy, sepsis) or possibly detrimental (hypoxia, ischemia) for mechanical function. We suggest that depending on the underlying pathology, the activation or blockade of 5-HT4 receptors might offer novel drug therapy options in patients. Full article
(This article belongs to the Section Molecular and Translational Medicine)
Show Figures

Figure 1

Figure 1
<p>Echocardiography of LPS-treated mice. (<b>A</b>) M-mode pictures of WT and 5-HT<sub>4</sub>-TG, basal and 7 h after LPS treatment. (<b>B</b>) LPS treatment (7 h) led to a deterioration of cardiac function demonstrated as decreased left ventricular ejection fraction (EF). Number in brackets indicates the number of mice studied. WT = wild-type mice, 5-HT<sub>4</sub>-TG=5-HT<sub>4</sub>-transgenic mice. Data shown are means ± SEM. * <span class="html-italic">p</span> &lt; 0.05 vs. basal; <sup>#</sup> <span class="html-italic">p</span> &lt; 0.05 vs. WT.</p>
Full article ">Figure 2
<p>mRNA expression in WT and 5-HT<sub>4</sub>-TG mice, treated either with LPS or NaCl. (<b>A</b>) The mRNA coding for the overexpressed human 5-HT<sub>4</sub>-receptor was greatly downregulated in hearts of TG after LPS treatment. Ordinate: mRNA expression normalized to GAPDH expression. Three mice were studied in each genotype. * <span class="html-italic">p</span> &lt; 0.05 vs. NaCl. (<b>B</b>) LPS-induced heart failure was accompanied by increased mRNA expression of cytokines like interleukin 1 β and 6 (IL-1 β, IL-6) and tumor necrosis factor α (TNFα) in both 5-HT<sub>4</sub>-TG and WT. The mRNA of the LPS-binding protein (LBP) and the Toll-like receptor 4 (TLR4) was increased in 5-HT<sub>4</sub>-TG, but not in WT. Whereas the mRNA of NFκB was unchanged, the mRNA of IκBα was to a similar extent increased by LPS in WT and 5-HT<sub>4</sub>-TG. Three mice were studied in each group, and injection of NaCl served as control. WT = wild-type mice, 5-HT<sub>4</sub>-TG = 5-HT<sub>4</sub>-transgenic mice. Data shown are means ± SEM. * <span class="html-italic">p</span> &lt; 0.05 vs. NaCl; <sup>#</sup> <span class="html-italic">p</span> &lt; 0.05 vs. WT.</p>
Full article ">Figure 3
<p>Hypoxia in atrial preparations. (<b>A</b>) The scheme demonstrates the experimental protocols of the experiments. Paced left atrial preparations from wild-type mice (WT), or 5-HT<sub>4</sub>-transgenic mice (5-HT<sub>4</sub>-TG) were allowed to equilibrate in the organ bath in buffer saturated with carbogen (=oxygenation, 5% CO<sub>2</sub> and 95% O<sub>2</sub>). Then as indicated, four protocols were performed: (I.) 28 min of oxygenation followed by addition of serotonin (5-HT, 1 µM) for 2 min; (II.) 30 min of oxygenation; (III.) 28 min of oxygenation followed by addition of the 5-HT<sub>4</sub>-antagonist GR 113808 (GR, 1 µM) for 2 min; (IV.) 10 min of hypoxia (Hyp) followed by 20 min of oxygenation. Thereafter, all conditions (I.–IV.) include the same procedure: 30 min of hypoxia (5% CO<sub>2</sub> and 95% N<sub>2</sub>) and then again carbogen (reoxygenation). (<b>B</b>) During hypoxia, left atrial preparations lose their ability to completely relax, and an increase in diastolic tension (contractures) occurs. Under the setups serotonin (1 µM), single hypoxia and GR 113808 (1 µM), 5-HT<sub>4</sub>-TG atria developed contractures earlier than WT atria. Roman numbers indicate the experimental protocol, and numbers at the bottom of the columns indicate the number of experiments. Data shown are means ± SEM. * <span class="html-italic">p</span> &lt; 0.05 vs. WT.</p>
Full article ">Figure 4
<p>Time course of hypoxia in left atrial preparations. (<b>A</b>–<b>C</b>) The force of contraction in% of control (Ctr = initial force at the beginning of the experiment) during the time of oxygenation and hypoxia is presented. After the addition of serotonin (5-HT, 1 μM, protocol I), the relative force was greatly increased in 5-HT<sub>4</sub>-TG and reached initial values again after hypoxia and reoxygenation (<b>A</b>). Preconditioning (protocol IV) as short hypoxia for 10 min was not beneficial (<b>B</b>). Under the condition of single hypoxia (protocol II), force decline was faster in TG left atria than in WT (<b>C</b>). WT = wild-type mice, 5-HT<sub>4</sub>-TG=5-HT<sub>4</sub>-transgenic mice. Data shown are means ± SEM. * <span class="html-italic">p</span> &lt; 0.05 vs. WT.</p>
Full article ">Figure 5
<p>Basal characteristics of isolated perfused heart preparations from WT and 5-HT<sub>4</sub>-TG mice. (<b>A</b>) Basal force of contraction in mN. (<b>B</b>) Effects of agonists and antagonists on the force of contraction after 5 min (maximum was reached). (<b>C</b>) Basal beating rate in beats per minute (bpm). (<b>D</b>) Effects of agonists and antagonists on the beating rate after 5 min. Ctr, control, Iso, isoproterenol (1 µM), 5-HT, serotonin (1 µM) and 5-HT (1 µM) in the presence of the 5-HT<sub>4</sub>-receptor antagonist’s GR 113808 (1 µM) or GR 125487 (1 µM). WT = wild-type mice, 5-HT<sub>4</sub>-TG = 5-HT<sub>4</sub>-transgenic mice. Data shown are means ± SEM. * <span class="html-italic">p</span> &lt; 0.05 vs. Ctr, <sup>#</sup> <span class="html-italic">p</span> &lt; 0.05 vs. WT.</p>
Full article ">Figure 6
<p>Ischemia and reperfusion in isolated perfused heart preparations. (<b>A</b>) Exemplary recordings of the time course of force reduction (ischemia) and force recovery (reperfusion, Rep) in isolated perfused heart preparations from WT and 5-HT<sub>4</sub>-TG. The perfusion rate was always 2 mL/min. No flow ischemia indicates global ischemia of the heart by stopping the perfusion pump. Horizontal bar: 20 min of ischemia. A period of 20 min ischemia did not cause permanent damage because, after reperfusion, force (<b>B</b>) and heart rate (<b>C</b>) of both 5-HT<sub>4</sub>-TG and WT reached preischemic values again. Time to 50% decline of developed force (F<sub>½</sub>) during ischemia was reduced in 5-HT<sub>4</sub>-TG compared to WT (<b>D</b>). WT = wild-type mice, 5-HT<sub>4</sub>-TG=5-HT<sub>4</sub>-transgenic mice. Data shown are means ± SEM. <sup>#</sup> <span class="html-italic">p</span> &lt; 0.05 vs. WT.</p>
Full article ">Figure 7
<p>Protein phosphorylation after ischemia/reperfusion in isolated perfused hearts of WT and 5-HT<sub>4</sub>-TG mice. (<b>A</b>) The scheme demonstrates the protocols (Langendorff perfusion: 2 mL/min flow): (1) 15 min equilibration, 20 min ischemia by stopping the perfusion followed by 15 min reperfusion or 50 min continuous perfusion with saline buffer as time control; (2) 15 min equilibration, 20 min ischemia and 15 min reperfusion in the presence of 1 µM serotonin (5-HT) or 35 min perfusion followed by 15 min perfusion with 5-HT (1 µM) as time control without ischemia. (<b>B</b>) Representative Western blots. The loading scheme is shown in the table above the blots. TG = 5-HT<sub>4</sub>-TG. (<b>C</b>) Phosphorylation of phospholamban at serine-16 (PS16-PLB) and (<b>D</b>) threonine-17 (PT17-PLB) normalized to cardiac calsequestrin (CSQ). (<b>E</b>) Phosphorylation of the mitogen-activated protein kinases (MAPK) p38 and (<b>F</b>) ERK1/2 normalized to the non-phosphorylated MAPKs. Ordinates: Ratio of phosphoproteins to calsequestrin or non-phosphorylated MAPKs in arbitrary imager units. Data shown are means ± SEM. * <span class="html-italic">p</span> &lt; 0.05 vs. Ctr; <sup>§</sup> <span class="html-italic">p</span> &lt; 0.05 vs. ischemia; <sup>+</sup> <span class="html-italic">p</span> &lt; 0.05 vs. Ctr + 5-HT. WT = wild-type mice, 5-HT<sub>4</sub>-TG = 5-HT<sub>4</sub>-transgenic mice; n.d., not determined (As WT preparations did not respond to 5-HT, perfusion with 5-HT was exclusively done with 5-HT<sub>4</sub>-TG hearts).</p>
Full article ">Figure 8
<p>Heart weight. Relative heart weights of 5-HT<sub>4</sub>-TG, PP2A-TG and double transgenic (DT) mice at 12 months of age compared to wild-type (WT) mice. Ordinate: heart weight in milligrams (mg) divided by body weight in grams (g). TG, transgenic mice. Numbers in brackets indicate the numbers of mice studied. Data shown are means ± SEM. <sup>#</sup> <span class="html-italic">p</span> &lt; 0.05 vs. WT.</p>
Full article ">Figure 9
<p>Protein expression in double transgenic mice. Protein expression of SERCA, PP2A, PLB and CSQ in hearts of wild-type (WT), 5-HT<sub>4</sub>-TG, PP2A-TG and double transgenic (DT) mice. (<b>A</b>) Representative Western blots. (<b>B</b>) Quantification of ventricular proteins. Data were normalized to CSQ (loading control) and to mean WT expression. TG, transgenic mice. Data shown are means ± SEM. <sup>#</sup> <span class="html-italic">p</span> &lt; 0.05 vs. WT; <sup>★</sup> <span class="html-italic">p</span> &lt; 0.05 vs. 5-HT<sub>4</sub>-TG.</p>
Full article ">Figure 10
<p>Echocardiography of double transgenic mice. Echocardiography of wild-type (WT), 5-HT<sub>4</sub>-transgenic (5-HT<sub>4</sub>-TG), PP2A-transgenic (PP2A-TG) and double transgenic (DT) mice. (<b>A</b>) Basal ejection fraction (Ctr) was reduced in PP2A-TG and DT mice, and 5-HT increased EF only in 5-HT<sub>4</sub>-TG and DT mice. β-adrenergic stimulation by isoproterenol (Iso) increased EF less in PP2A-TG and DT compared to the other groups. (<b>B</b>) Basal heart rate (Ctr) was not different between genotypes, and positive chronotropic effects of 5-HT were only noted in 5-HT<sub>4</sub>-TG and DT mice. However, β-adrenergic stimulation (Iso) increased heart rate in all groups. Numbers in bars indicate the numbers of mice studied. Data shown are means ± SEM. * <span class="html-italic">p</span> &lt; 0.05 vs. Ctr; <sup>#</sup> <span class="html-italic">p</span> &lt; 0.05 vs. WT.</p>
Full article ">Figure 11
<p>Doppler echocardiography of double transgenic mice. Pulsed wave (PW) Doppler echocardiography of wild-type (WT), 5-HT<sub>4</sub>-transgenic (5-HT<sub>4</sub>-TG), PP2A-transgenic (PP2A-TG) and double transgenic (DT) mice. (<b>A</b>) A typical pattern of E wave and A wave in mitral flow. The E wave represents the early filling of the ventricle. The A wave represents the atrial contraction. (<b>B</b>) E divided by A was increased in PP2A-TG and in DT. (<b>C</b>) By tissue Doppler imaging of the left ventricular posterior wall, the early (E’) and late (A’) diastolic and systolic maximum tissue velocity was assessed. The E’ wave corresponds to the motion of the posterior wall during early diastolic filling of the left ventricle, and the A’ wave originates from atrial contraction during the late filling of the left ventricle. An increased E’/A’ quotient was noted in PP2A-TG but not in DT mice. Numbers in bars indicate the numbers of mice studied. Data shown are means ± SEM. <sup>#</sup> <span class="html-italic">p</span> &lt; 0.05 vs. WT; <sup>★</sup> <span class="html-italic">p</span> &lt; 0.05 vs. 5-HT<sub>4</sub>-TG.</p>
Full article ">Figure 12
<p>Scheme. 5-HT signaling via 5-HT<sub>4</sub>-receptors and LPS signaling in TG cardiac myocytes. Stimulation of cardiac 5-HT<sub>4</sub>-receptors in the sarcolemma of transgenic mice leads to stimulation of adenylate cyclase (AC) via stimulatory G-proteins (Gs). AC increases cAMP levels in the cytosol, where it can either directly activate HCN channels and thereby increase the beating rate in sinoatrial cells or can activate the cAMP-dependent protein kinase (PKA). PKA can increase Ca<sup>2+</sup>-cycling by phosphorylation of phospholamban (PLB) on serine 16 or of the L-type Ca<sup>2+</sup> channel (LTCC) or of the ryanodine receptor (RyR). Ca<sup>2+</sup> is released via the ryanodine receptor, increasing Ca<sup>2+</sup> levels near the myofibrils, which increases the force of contraction at the beginning of systole. Relaxation is initiated by sarcoplasmic Ca<sup>2+</sup> ATPase (SERCA), which pumps Ca<sup>2+</sup> into the sarcoplasmic reticulum at the beginning of diastole. Phosphorylation of these proteins is reduced in part by the catalytic subunit of protein phosphatase 2A (PP2A) and, conversely, the action of PP2A is reduced at least in part by activation of the 5-HT<sub>4</sub> receptor. Lipopolysaccharide (LPS) can bind to a complex of TLR4 and CD14. This leads via intracellular signaling pathways to increased gene transcription in the nucleus. Here, an interaction between 5-HT<sub>4</sub> receptor signaling and LPS signaling appears questionable.</p>
Full article ">
12 pages, 19553 KiB  
Article
Differential Modulation of Dorsal Horn Neurons by Various Spinal Cord Stimulation Strategies
by Kwan Yeop Lee, Dongchul Lee, Zachary B. Kagan, Dong Wang and Kerry Bradley
Biomedicines 2021, 9(5), 568; https://doi.org/10.3390/biomedicines9050568 - 18 May 2021
Cited by 19 | Viewed by 3694
Abstract
New strategies for spinal cord stimulation (SCS) for chronic pain have emerged in recent years, which may work better via different analgesic mechanisms than traditional low-frequency (e.g., 50 Hz) paresthesia-based SCS. To determine if 10 kHz and burst SCS waveforms might have a [...] Read more.
New strategies for spinal cord stimulation (SCS) for chronic pain have emerged in recent years, which may work better via different analgesic mechanisms than traditional low-frequency (e.g., 50 Hz) paresthesia-based SCS. To determine if 10 kHz and burst SCS waveforms might have a similar mechanistic basis, we examined whether these SCS strategies at intensities ostensibly below sensory thresholds would modulate spinal dorsal horn (DH) neuronal function in a neuron type-dependent manner. By using an in vivo electrophysiological approach in rodents, we found that low-intensity 10 kHz SCS, but not burst SCS, selectively activates inhibitory interneurons in the spinal DH. This study suggests that low-intensity 10 kHz SCS may inhibit pain-sensory processing in the spinal DH by activating inhibitory interneurons without activating DC fibers, resulting in paresthesia-free pain relief, whereas burst SCS likely operates via other mechanisms. Full article
(This article belongs to the Special Issue Neuropathic Pain: Therapy and Mechanisms)
Show Figures

Figure 1

Figure 1
<p>In vivo experimental preparation. (<b>A</b>) Schematic showing overall experimental preparation, with sites of spinal stimulation and measurement and afferent mechanical stimuli for dorsal horn neuron characterization. (<b>B</b>) Photo of whole animal experimental in vivo setup. (<b>C</b>) Photo of dorsal multilevel laminectomy with epidurally positioned spinal cord stimulation mini electrode array. (<b>D</b>) Photo of dorsal laminectomy showing multi-electrode Plexon measurement probe prior to insertion into the dorsal cord. SCS electrode also visible.</p>
Full article ">Figure 2
<p>Morphology of different burst waveforms used in experiments. Each burst waveform uses 5 square leading-phase pulses of 1 ms duration separated by 1 ms and delivered at a 40 Hz repetition rate (also known as the intraburst frequency). The name of each burst waveform delineates the form of electrode charge recovery: (<b>top</b>) asymmetric biphasically–recharged burst (AB) recovers the electrode charge following each leading-phase pulse using an asymmetric equal-charge recovery waveform; (<b>bottom</b>) passively-recharged burst (PB) delays charge recovery until all five leading phase pulses have been delivered. The charge recovery waveform morphology was intended to grossly mimic the classic capacitive-discharge recovery waveform, as known from typical neurostimulators [<a href="#B15-biomedicines-09-00568" class="html-bibr">15</a>]. Example waveforms with amplitudes of 5 mA are shown.</p>
Full article ">Figure 3
<p>Non-adapting/inhibitory (NAI) and adapting/excitatory (AE) neuron response to SCS strategies. Exemplary firing rate response of typical sub-populations of cells during 20 s SCS: 10 kHz (<b>A</b>,<b>D</b>), passively-recharged burst (PB) (<b>B</b>,<b>E</b>), asymmetric biphasically recharged burst) (AB) (<b>C</b>,<b>F</b>). Top line: non-adapting/inhibitory cells (<span class="html-italic">n</span> = 11). Bottom line: adapting/excitatory cells (<span class="html-italic">n</span> = 9) (post-stimulus time histogram (bin size: 500ms)).</p>
Full article ">Figure 4
<p>Comparison of dorsal horn non-adapting inhibitory (NAI) neuron firing rates to SCS strategies. Note: axis scale is approximate for firing rate values &gt; 14 spikes/s. * <span class="html-italic">p</span> &lt; 0.05; ** <span class="html-italic">p</span> &lt; 0.01.</p>
Full article ">Figure 5
<p>Comparison of dorsal horn adapting excitatory (AE) neuron firing rates to SCS strategies. * <span class="html-italic">p</span> &lt; 0.05; ** <span class="html-italic">p</span> &lt; 0.01; *** <span class="html-italic">p</span> &lt; 0.001.</p>
Full article ">Figure 6
<p>Dorsal horn neuron ‘responders’ to various SCS strategies. Note that one AE neuron did not meet the responder criteria for any SCS strategies.</p>
Full article ">Figure 7
<p>Selective activity ratio: ratio of NAI firing rate to AE neuron firing rate across animals. *** <span class="html-italic">p</span> &lt; 0.001.</p>
Full article ">
11 pages, 3613 KiB  
Article
Cellular Senescence in Human Aldosterone-Producing Adrenocortical Cells and Related Disorders
by Jacopo Pieroni, Yuto Yamazaki, Xin Gao, Yuta Tezuka, Hiroko Ogata, Kei Omata, Yoshikiyo Ono, Ryo Morimoto, Yasuhiro Nakamura, Fumitoshi Satoh and Hironobu Sasano
Biomedicines 2021, 9(5), 567; https://doi.org/10.3390/biomedicines9050567 - 18 May 2021
Cited by 5 | Viewed by 2987
Abstract
In situ cortisol excess was previously reported to promote cellular senescence, a cell response to stress, in cortisol-producing adenomas (CPA). The aim of this study was to explore senescence pathways in aldosterone-producing cells and related disorders, and the influence of aldosterone overproduction on [...] Read more.
In situ cortisol excess was previously reported to promote cellular senescence, a cell response to stress, in cortisol-producing adenomas (CPA). The aim of this study was to explore senescence pathways in aldosterone-producing cells and related disorders, and the influence of aldosterone overproduction on in situ senescence. We analyzed 30 surgical cases of aldosterone-producing adenoma (APA), 10 idiopathic hyperaldosteronism (IHA) and 19 normal adrenals (NA). CYP11B2 and senescence markers p16 and p21 were immunolocalized in all those cases above and results were correlated with histological/endocrinological findings. In the three cohorts examined, the zona glomerulosa (ZG) was significantly more senescent than other corticosteroid-producing cells. In addition, the ZG of adjacent non-pathological adrenal glands of APA and IHA had significantly higher p16 expression than adjacent non-pathological zona fasciculata (ZF), reticularis (ZR) and ZG of NA. In addition, laboratory findings of primary aldosteronism (PA) were significantly correlated with p21 status in KCNJ5-mutated tumors. Results of our present study firstly demonstrated that non-aldosterone-producing cells in the ZG were the most senescent compared to other cortical zones and aldosterone-producing cells in PA. Therefore, aldosterone production, whether physiological or pathological, could be maintained by suppression of cell senescence in human adrenal cortex. Full article
Show Figures

Figure 1

Figure 1
<p>p16, p21 in NA, APA and IHA cohort. p16 IHC revealed that ZG in the APA and IHA group was significantly more senescent than ZF, ZR and aldosterone-producing lesions. In the NA group, ZG was higher than ZF. Results of p21 were equivalent to those of p16 but there were some differences in the three cohorts. (*) is used to identify the CYP11B2-positive lesions responsible for aldosterone overproduction in the IHA group.</p>
Full article ">Figure 2
<p>p16–p21 expression in CYP11B2-negative cells of ZG in NA, APA and IHA group. Immunohistochemical findings of p16- and p21-positive phenotypes in ZG of non-pathological adrenals (ZG NA), ZG adjacent to aldosterone-producing adrenocortical adenoma (Adj.ZG) and ZG of idiopathic hyperaldosteronism (ZG IHA). The figures demonstrated the increased p16-expression in PA patients’ zona glomerulosa (Adj.ZG and ZG IHA) compared to ZG NA, while no significant differences were detected using p21.</p>
Full article ">Figure 3
<p>p16–p21 and CYP11B2 in clear and compact cells (intratumoral heterogeneity). Immunohistochemical findings of p16- and p21-positive phenotypes in clear and compact tumor cells of aldosterone-producing adrenocortical adenomas. H&amp;E sections were used to carefully circumscribe the two different kinds of cells, and the IHC techniques highlighted a significantly higher expression of p16 and p21 among compact cells, compared to clear ones.</p>
Full article ">Figure 4
<p>Correlation between Senescence markers and clinical factors in <span class="html-italic">KCNJ5</span> mutated group. The figure demonstrates the correlations between the main clinical factors in the APA group. Results highlighted significant correlations between p21 and PRA/ARR. No other significant correlations were detected in this study. PAC, plasma aldosterone concentration; PRA, plasma renin activity; ARR, aldosterone-to-renin ratio.</p>
Full article ">
22 pages, 1243 KiB  
Article
Predict Score: A New Biological and Clinical Tool to Help Predict Risk of Intensive Care Transfer for COVID-19 Patients
by Mickael Gette, Sara Fernandes, Marion Marlinge, Marine Duranjou, Wijayanto Adi, Maelle Dambo, Pierre Simeone, Pierre Michelet, Nicolas Bruder, Regis Guieu and Julien Fromonot
Biomedicines 2021, 9(5), 566; https://doi.org/10.3390/biomedicines9050566 - 18 May 2021
Cited by 2 | Viewed by 2477
Abstract
Background: The COVID-19 crisis has strained world health care systems. This study aimed to develop an innovative prediction score using clinical and biological parameters (PREDICT score) to anticipate the need of intensive care of COVID-19 patients already hospitalized in standard medical units. Methods: [...] Read more.
Background: The COVID-19 crisis has strained world health care systems. This study aimed to develop an innovative prediction score using clinical and biological parameters (PREDICT score) to anticipate the need of intensive care of COVID-19 patients already hospitalized in standard medical units. Methods: PREDICT score was based on a training cohort and a validation cohort retrospectively recruited in 2020 in the Marseille University Hospital. Multivariate analyses were performed, including clinical, and biological parameters, comparing a baseline group composed of COVID-19 patients exclusively treated in standard medical units to COVID-19 patients that needed intensive care during their hospitalization. Results: Independent variables included in the PREDICT score were: age, Body Mass Index, Respiratory Rate, oxygen saturation, C-reactive protein, neutrophil–lymphocyte ratio and lactate dehydrogenase. The PREDICT score was able to correctly identify more than 83% of patients that needed intensive care after at least 1 day of standard medical hospitalization. Conclusions: The PREDICT score is a powerful tool for anticipating the intensive care need for COVID-19 patients already hospitalized in a standard medical unit. It shows limitations for patients who immediately need intensive care, but it draws attention to patients who have an important risk of needing intensive care after at least one day of hospitalization. Full article
(This article belongs to the Section Molecular and Translational Medicine)
Show Figures

Figure 1

Figure 1
<p>Flow chart.</p>
Full article ">Figure 2
<p>Kinetic following of biological parameters in training cohort (media and interquartile). Left column: Standard Medical Unit Patients vs. Standard to Intensive Care Patients groups. Right column: Standard Medical Unit Patients vs Intensive Care Units Patients. NLR: neutrophil–lymphocyte ratio, CRP: C-reactive protein, LDH: lactate dehydrogenase. Data were expressed as mean and range. Statistical analysis was performed to compare the kinetics of biological parameters over time (Day 0 to Day 10) between groups of patients (see Statistical analysis). * <span class="html-italic">p</span> &lt; 0.05 mean that there was a significant difference in the behavior of parameters.</p>
Full article ">Figure 3
<p>Receiver Operating Characteristic (ROC) curves for PREDICT score on admission in Intensive Care Unit; Day 0, day 1, and day 2 of hospitalization, and area under ROC curve repartition. <span class="html-italic">* p</span> &lt; 0.05.</p>
Full article ">Figure 4
<p>PREDICT score population construction repartition during the first two days of hospitalization, with maximum Youden index value (Cut-off). SMU: standard medical unit. SToi: need intensive care unit (ICU).</p>
Full article ">Figure 5
<p>Kinetic follow-up of biological parameters. Left column: Standard Medical Units Patients vs. Standard to Intensive Care Patients. Right column: Standard Medical Units Patients vs. Intensive Care Units Patients. ALB: albuminemia.</p>
Full article ">
13 pages, 2352 KiB  
Article
Radiosynthesis and Evaluation of Talazoparib and Its Derivatives as PARP-1-Targeting Agents
by Dong Zhou, Huaping Chen, Cedric Mpoy, Sadia Afrin, Buck E. Rogers, Joel R. Garbow, John A. Katzenellenbogen and Jinbin Xu
Biomedicines 2021, 9(5), 565; https://doi.org/10.3390/biomedicines9050565 - 18 May 2021
Cited by 21 | Viewed by 4054
Abstract
Poly (ADP-ribose) polymerase-1 (PARP-1) is a critical enzyme in the DNA repair process and the target of several FDA-approved inhibitors. Several of these inhibitors have been radiolabeled for non-invasive imaging of PARP-1 expression or targeted radiotherapy of PARP-1 expressing tumors. In particular, derivatives [...] Read more.
Poly (ADP-ribose) polymerase-1 (PARP-1) is a critical enzyme in the DNA repair process and the target of several FDA-approved inhibitors. Several of these inhibitors have been radiolabeled for non-invasive imaging of PARP-1 expression or targeted radiotherapy of PARP-1 expressing tumors. In particular, derivatives of olaparib and rucaparib, which have reduced trapping potency by PARP-1 compared to talazoparib, have been radiolabeled for these purposes. Here, we report the first radiosynthesis of [18F]talazoparib and its in vitro and in vivo evaluation. Talazoparib (3a?) and its bromo- or iodo-derivatives were synthesized as racemic mixtures (3a, 3b and 3c), and these compounds exhibit high affinity to PARP-1 (Ki for talazoparib (3a?): 0.65 ± 0.07 nM; 3a: 2.37 ± 0.56 nM; 3b: 1.92 ± 0.41 nM; 3c: 1.73 ± 0.43 nM; known PARP-1 inhibitor Olaparib: 1.87 ± 0.10 nM; non-PARP-1 compound Raclopride: >20,000 nM) in a competitive binding assay using a tritium-labeled PARP-1 radioligand [3H]WC-DZ for screening. [18F]Talazoparib (3a?) was radiosynthesized via a multiple-step procedure with good radiochemical and chiral purities (98%) and high molar activity (28 GBq/?mol). The preliminary biodistribution studies in the murine PC-3 tumor model showed that [18F]talazoparib had a good level of tumor uptake that persisted for over 8 h (3.78 ± 0.55 %ID/gram at 4 h and 4.52 ± 0.32 %ID/gram at 8 h). These studies show the potential for the bromo- and iodo- derivatives for PARP-1 targeted radiotherapy studies using therapeutic radionuclides. Full article
(This article belongs to the Section Drug Discovery and Development)
Show Figures

Figure 1

Figure 1
<p>PARP-1 inhibitors approved by US FDA for oncology use.</p>
Full article ">Figure 2
<p>[<sup>3</sup>H]WC-DZ binding to PARP-1 in U251MG cells. (<b>A</b>) Saturation binding curves show the total, non-specific, and specific bound respectively. (<b>B</b>) Scatchard plot analysis was used to derive the <span class="html-italic">K<sub>d</sub></span> and <span class="html-italic">B<sub>max</sub></span> values: <span class="html-italic">K<sub>d</sub></span> = 6.71 ± 1.24 nM, <span class="html-italic">B<sub>max</sub></span> = 2382.54. ± 318.02 fmol/mg protein. (<b>C</b>) Hill plot was used to determine the Hill coefficient: <span class="html-italic">n</span><sub>H</sub> = 1.07 ± 0.18. <span class="html-italic">n</span> = 3, samples in triplicate. Mean ± SEM.</p>
Full article ">Figure 3
<p>Competitive binding for inhibition of the [<sup>3</sup>H]WC-DZ binding to PARP-1 in glioblastoma cells (U251MG) by <b>3a</b>, <b>3a″</b>, <b>3b</b>, <b>3c</b>, olaparib, and raclopride—a known PARP-1 nonselective compound. (<b>A</b>) Representative competitive binding data <span class="html-italic">K</span>i. <b>3a</b>: 2.37 ± 0.56 nM, <b>3a″</b>: 0.65 ± 0.07 nM, <b>3b</b>: 1.92 ± 0.41 nM, <b>3c</b>: 1.73 ± 0.43 nM, olaparib: 1.87 ± 0.10 nM, raclopride: &gt;20,000 nM. (<b>B</b>) (<b>3a</b>), (<b>C</b>) (3a″), (<b>D</b>) (<b>3b</b>), (<b>E</b>) (<b>3c</b>) and (<b>F</b>) (olaparib): Representative pseudo Hill plots for determining the pseudoHill coefficient (<span class="html-italic">n′</span><sub>H</sub> values). <b>3a</b>: <span class="html-italic">n’</span><sub>H</sub> = 1.00 ± 0.07; <b>3a″</b>: <span class="html-italic">n′</span><sub>H</sub> = 0.76 ± 0.13; <b>3b</b>: <span class="html-italic">n′</span><sub>H</sub> = 1.24 ± 0.24; <b>3c</b>: <span class="html-italic">n′</span><sub>H</sub> = 1.01 ± 0.20; Olaparib: <span class="html-italic">n’</span><sub>H</sub> = 1.13 ± 0.13. <span class="html-italic">n</span> = 3, samples in triplicate. Mean ± SEM.</p>
Full article ">Figure 4
<p>Biodistribution of [<sup>18</sup>F]talazoparib/<b>3a″</b> in mature SCID mice with PC-3 prostate tumors (4 per group) at 4 and 8 h post-injection.</p>
Full article ">Scheme 1
<p>Synthesis of talazoparib and its derivatives and radiosynthesis of [<sup>18</sup>F]talazoparib/<b>3a″</b>.</p>
Full article ">
11 pages, 762 KiB  
Review
The War after War: Volumetric Muscle Loss Incidence, Implication, Current Therapies and Emerging Reconstructive Strategies, a Comprehensive Review
by Stefano Testa, Ersilia Fornetti, Claudia Fuoco, Carles Sanchez-Riera, Francesco Rizzo, Mario Ciccotti, Stefano Cannata, Tommaso Sciarra and Cesare Gargioli
Biomedicines 2021, 9(5), 564; https://doi.org/10.3390/biomedicines9050564 - 18 May 2021
Cited by 18 | Viewed by 5157
Abstract
Volumetric muscle loss (VML) is the massive wasting of skeletal muscle tissue due to traumatic events or surgical ablation. This pathological condition exceeds the physiological healing process carried out by the muscle itself, which owns remarkable capacity to restore damages but only when [...] Read more.
Volumetric muscle loss (VML) is the massive wasting of skeletal muscle tissue due to traumatic events or surgical ablation. This pathological condition exceeds the physiological healing process carried out by the muscle itself, which owns remarkable capacity to restore damages but only when limited in dimensions. Upon VML occurring, the affected area is severely compromised, heavily influencing the affected a person’s quality of life. Overall, this condition is often associated with chronic disability, which makes the return to duty of highly specialized professional figures (e.g., military personnel or athletes) almost impossible. The actual treatment for VML is based on surgical conservative treatment followed by physical exercise; nevertheless, the results, in terms of either lost mass and/or functionality recovery, are still poor. On the other hand, the efforts of the scientific community are focusing on reconstructive therapy aiming at muscular tissue void volume replenishment by exploiting biomimetic matrix or artificial tissue implantation. Reconstructing strategies represent a valid option to build new muscular tissue not only to recover damaged muscles, but also to better socket prosthesis in terms of anchorage surfaces and reinnervation substrates for reconstructed mass. Full article
Show Figures

Figure 1

Figure 1
<p>Schematic representation of cell-based reconstructive approach to volumetric muscle loss (VML) recovery.</p>
Full article ">
24 pages, 2613 KiB  
Review
Cardiac Organoids to Model and Heal Heart Failure and Cardiomyopathies
by Magali Seguret, Eva Vermersch, Charlène Jouve and Jean-Sébastien Hulot
Biomedicines 2021, 9(5), 563; https://doi.org/10.3390/biomedicines9050563 - 18 May 2021
Cited by 16 | Viewed by 5743
Abstract
Cardiac tissue engineering aims at creating contractile structures that can optimally reproduce the features of human cardiac tissue. These constructs are becoming valuable tools to model some of the cardiac functions, to set preclinical platforms for drug testing, or to alternatively be used [...] Read more.
Cardiac tissue engineering aims at creating contractile structures that can optimally reproduce the features of human cardiac tissue. These constructs are becoming valuable tools to model some of the cardiac functions, to set preclinical platforms for drug testing, or to alternatively be used as therapies for cardiac repair approaches. Most of the recent developments in cardiac tissue engineering have been made possible by important advances regarding the efficient generation of cardiac cells from pluripotent stem cells and the use of novel biomaterials and microfabrication methods. Different combinations of cells, biomaterials, scaffolds, and geometries are however possible, which results in different types of structures with gradual complexities and abilities to mimic the native cardiac tissue. Here, we intend to cover key aspects of tissue engineering applied to cardiology and the consequent development of cardiac organoids. This review presents various facets of the construction of human cardiac 3D constructs, from the choice of the components to their patterning, the final geometry of generated tissues, and the subsequent readouts and applications to model and treat cardiac diseases. Full article
(This article belongs to the Special Issue Tissue Engineering in Cardiology)
Show Figures

Figure 1

Figure 1
<p>Strategies to build 3D-ECTs without scaffolds, advantages, and drawbacks.</p>
Full article ">Figure 2
<p>Strategies to build 3D-ECTs with scaffolds, advantages, and drawbacks.</p>
Full article ">Figure 3
<p>Different geometries for engineered cardiac tissues, their readouts, advantages and downsides, and their preferential applications.</p>
Full article ">
20 pages, 2762 KiB  
Article
Synthesis, Characterization, and In Vitro Insulin-Mimetic Activity Evaluation of Valine Schiff Base Coordination Compounds of Oxidovanadium(V)
by Mihaela Turtoi, Maria Anghelache, Andrei A. Patrascu, Catalin Maxim, Ileana Manduteanu, Manuela Calin and Delia-Laura Popescu
Biomedicines 2021, 9(5), 562; https://doi.org/10.3390/biomedicines9050562 - 17 May 2021
Cited by 15 | Viewed by 3511
Abstract
Type 2 diabetes became an alarming global health issue since the existing drugs do not prevent its progression. Herein, we aimed to synthesize and characterize a family of oxidovanadium(V) complexes with Schiff base ligands derived from L-/D-valine (val) and salicylaldehyde (sal) or o [...] Read more.
Type 2 diabetes became an alarming global health issue since the existing drugs do not prevent its progression. Herein, we aimed to synthesize and characterize a family of oxidovanadium(V) complexes with Schiff base ligands derived from L-/D-valine (val) and salicylaldehyde (sal) or o-vanillin (van) as insulin-mimetic agents and to assess their potential anti-diabetic properties. Two new oxidovanadium(V) complexes, [{VVO(R-salval)(H2O)}(?2-O){VVO(R-salval)}] and [{VVO(R-vanval)(CH3OH)}2(?2-O)], and their S-enantiomers were synthesized and characterized. The compounds exhibit optical activity as shown by crystallographic and spectroscopic data. The stability, the capacity to bind bovine serum albumin (BSA), the cytotoxicity against human hepatoma cell line, as well as the potential anti-diabetic activity of the four compounds are investigated. The synthesized compounds are stable for up to three hours in physiological conditions and exhibit a high capacity of binding to BSA. Furthermore, the synthesized compounds display cytocompatibility at biologically relevant concentrations, exert anti-diabetic potential and insulin-mimetic activities by inhibiting the ?-amylase and protein tyrosine phosphatase activity, and a long-term increase of insulin receptor phosphorylation compared to the insulin hormone. Thus, the in vitro anti-diabetic potential and insulin-mimetic properties of the newly synthesized oxidovanadium(V) compounds, correlated with their cytocompatibility, make them promising candidates for further investigation as anti-diabetic drugs. Full article
(This article belongs to the Special Issue Feature Papers in Drug Discovery and Development)
Show Figures

Graphical abstract

Graphical abstract
Full article ">Figure 1
<p>Structure formulas of the Schiff base ligands, <span class="html-italic">R</span>-/<span class="html-italic">S</span>-salvalH<sub>2</sub> (salval = N-salicylidenvaline) and <span class="html-italic">R</span>-/<span class="html-italic">S</span>-vanvalH<sub>2</sub> (vanval = 3-Methoxy-N-salicylidenvaline).</p>
Full article ">Figure 2
<p>Absorption spectra (190 ÷ 450 nm) of 1 × 10<sup>−4</sup> M <b>1a</b>/<b>1b</b> (<b>A</b>) and <b>2a</b>/<b>2b</b> (<b>B</b>) complexes in phosphate-buffered saline (PBS, pH 7.4) and CD spectra of 5 × 10<sup>−4</sup> M <b>1a</b>/<b>1b</b> (<b>C</b>) and <b>2a</b>/<b>2b</b> (<b>D</b>) complexes in PBS, pH 7.4 outright on the prepared solutions (T 0 h) and at 9 h (T 9 h) after preparation.</p>
Full article ">Figure 3
<p>The asymmetric unit with the atom-labeling scheme of <b>1a</b>. The two independent molecules (I and II) in the asymmetric unit (<b>A</b>) and the hydrogen-bonding scheme between the carboxyl oxygens and the water molecules of <b>1a</b> (<b>B</b>). Hydrogen atoms have been excluded for clarity.</p>
Full article ">Figure 4
<p>The molecular structure with the atom-labeling scheme of <b>2a</b>. For clarity, hydrogen atoms have been excluded from the diagram.</p>
Full article ">Figure 5
<p>Absorption spectra (in the 230 ÷ 450 nm range) of 2 × 10<sup>−4</sup> M <b>1a</b> (<b>A</b>), <b>1b</b> (<b>B</b>), <b>2a</b> (<b>C</b>), and <b>2b</b> (<b>D</b>) in phosphate-buffered saline (PBS, pH 7.4, 37 °C) recorded over 24 h.</p>
Full article ">Figure 6
<p>Fluorescence spectra of 2 × 10<sup>−6</sup> M bovine serum albumin (BSA) in phosphate-buffered saline (PBS, pH 7.4) in the presence of various concentrations (1 ÷ 25 × 10<sup>−6</sup> M) of <b>1a</b> (<b>A</b>), <b>1b</b> (<b>B</b>), <b>2a</b> (<b>C</b>), <b>2b</b> (<b>D</b>). 0.025% Dimethyl sulfoxide (DMSO, vehicle) was used as a negative control for oxidovanadium(V) complexes.</p>
Full article ">Figure 7
<p>The effect of <b>1a</b>, <b>1b</b>, <b>2a</b>, <b>2b</b> on α-amylase activity (<b>A</b>), HepG2 cell viability (<b>B</b>), total protein tyrosine phosphatases (PTP) enzymatic activity (<b>C</b>), insulin receptor (INS R) phosphorylation (<b>D</b>), and representative immunoblotting images of the phosphorylated form of INS R (pINS R), total form of INS R (tINS R-β), and β-actin (<b>E</b>). Acarbose was used as a positive control for α-amylase inhibition. Cisplatin was used as a positive control for cytotoxicity, Na<sub>3</sub>V<sup>V</sup>O<sub>4</sub> was used as a control for PTP inhibition. As a negative control for V<sup>IV</sup>OSO<sub>4</sub>•3H<sub>2</sub>O, Na<sub>3</sub>V<sup>V</sup>O<sub>4</sub> (VOSO<sub>4</sub> and Na<sub>3</sub>VO<sub>4</sub> for chart simplification), and insulin treatment, HepG2 cells exposed to the free-complete medium were used (depicted barely control). Dimethyl sulfoxide (DMSO) was used as a negative control for oxidovanadium(V) complexes and cisplatin treatment. The results were expressed as % of DMSO and were showed as mean ± SD and analyzed using unpaired two-tailed Student’s <span class="html-italic">t</span>-test; <b><sup>*</sup></b> <span class="html-italic">p</span> &lt; 0.05, <b><sup>**</sup></b> <span class="html-italic">p</span> &lt; 0.01, <b><sup>***</sup></b> <span class="html-italic">p</span> &lt; 0.001 vs. DMSO and <b><sup>#</sup></b> <span class="html-italic">p</span> &lt; 0.05, <b><sup>##</sup></b> <span class="html-italic">p</span> &lt; 0.01, <b><sup>###</sup></b> <span class="html-italic">p</span> &lt; 0.001 vs. Control, <b><sup>&amp;&amp;&amp;</sup></b> <span class="html-italic">p</span> &lt; 0.001 vs. acarbose and <b><sup><span>$</span><span>$</span><span>$</span></sup></b> <span class="html-italic">p</span> &lt; 0.001 vs. V<sup>IV</sup>OSO<sub>4</sub>•3H<sub>2</sub>O.</p>
Full article ">
19 pages, 3151 KiB  
Article
Radiotherapy in Follicular Lymphoma Staged by 18F-FDG-PET/CT: A German Monocenter Study
by Imke E. Karsten, Gabriele Reinartz, Michaela Pixberg, Kai Kröger, Michael Oertel, Birte Friedrichs, Georg Lenz and Hans Theodor Eich
Biomedicines 2021, 9(5), 561; https://doi.org/10.3390/biomedicines9050561 - 17 May 2021
Cited by 5 | Viewed by 4376
Abstract
This retrospective study examined the role of 18F-fluorodeoxyglucose-positron emission tomography/computed tomography (18F-FDG-PET/CT) in stage-related therapy of follicular lymphomas (FL). Twelve patients each in stages I and II, 13 in stage III and 11 in stage IV were treated in the [...] Read more.
This retrospective study examined the role of 18F-fluorodeoxyglucose-positron emission tomography/computed tomography (18F-FDG-PET/CT) in stage-related therapy of follicular lymphomas (FL). Twelve patients each in stages I and II, 13 in stage III and 11 in stage IV were treated in the Department of Radiation Oncology, University Hospital of Muenster, Germany from 2004 to 2016. Radiotherapy (RT), as well as additional chemoimmunotherapy were analyzed with a median follow-up of 87.6 months. Ultrasound (US), CT and 18F-FDG-PET/CT were used to determine progression-free survival (PFS), overall survival (OS) and lymphoma-specific survival (LSS) over 5- and 10- years. 23 of 24 patients with stage I/II (95.8%) had complete remissions (CR) and 17 of 24 patients with stages III/IV FL showed CR (70.8%). 5- and 10-year PFS in stages I/II was 90.0%/78.1% vs. 44.3%/28.5% in stages III/IV. 5- and 10-year OS rates in stages I/II was 100%/93.3% vs. 53.7%/48.4% in stages III/IV. 5- and 10-year LSS of stages I/II was 100%/93.8% vs. 69.2%/62.3% in stages III/IV. FL of stages I/II, staged by 18F-FDG-PET/CT, revealed better survival rates and lower risk of recurrence compared to studies without PET/CT-staging. Especially, patients with PET/CT proven stage I disease showed significantly better survival and lower relapses rates after RT. Full article
(This article belongs to the Special Issue New Insights in Radiotherapy)
Show Figures

Figure 1

Figure 1
<p>Deauville Score determination of mesenteric follicular lymphoma in stage IV. Patient with mesenteric follicular lymphoma (<b>a</b>) CT, (<b>b</b>) PET/CT (arrows). Visually assessed Deauville Score 2 (<b>b</b>). Semiautomatically calculated Deauville Score 3 (<b>c</b>), metabolic activity between liver (<b>d</b>) and mediastinal blood pool (<b>e</b>).</p>
Full article ">Figure 2
<p>PFS in stage I/II and stage III/IV.</p>
Full article ">Figure 3
<p>OS in stage I/II and stage III/IV.</p>
Full article ">Figure 4
<p>LSS in stage I/II and stage III/IV.</p>
Full article ">Figure 5
<p>PFS for visual/manual DS.</p>
Full article ">Figure 6
<p>PFS for semi-automatic DS.</p>
Full article ">
16 pages, 1263 KiB  
Review
Impact of Fatty Acid-Binding Proteins in ?-Synuclein-Induced Mitochondrial Injury in Synucleinopathy
by An Cheng, Wenbin Jia, Ichiro Kawahata and Kohji Fukunaga
Biomedicines 2021, 9(5), 560; https://doi.org/10.3390/biomedicines9050560 - 17 May 2021
Cited by 13 | Viewed by 6850
Abstract
Synucleinopathies are diverse diseases with motor and cognitive dysfunction due to progressive neuronal loss or demyelination, due to oligodendrocyte loss in the brain. While the etiology of neurodegenerative disorders (NDDs) is likely multifactorial, mitochondrial injury is one of the most vital factors in [...] Read more.
Synucleinopathies are diverse diseases with motor and cognitive dysfunction due to progressive neuronal loss or demyelination, due to oligodendrocyte loss in the brain. While the etiology of neurodegenerative disorders (NDDs) is likely multifactorial, mitochondrial injury is one of the most vital factors in neuronal loss and oligodendrocyte dysfunction, especially in Parkinson’s disease, dementia with Lewy body, multiple system atrophy, and Krabbe disease. In recent years, the abnormal accumulation of highly neurotoxic ?-synuclein in the mitochondrial membrane, which leads to mitochondrial dysfunction, was well studied. Furthermore, fatty acid-binding proteins (FABPs), which are members of a superfamily and are essential in fatty acid trafficking, were reported to trigger ?-synuclein oligomerization in neurons and glial cells and to target the mitochondrial outer membrane, thereby causing mitochondrial loss. Here, we provide an updated overview of recent findings on FABP and ?-synuclein interactions and mitochondrial injury in NDDs. Full article
(This article belongs to the Section Molecular and Translational Medicine)
Show Figures

Figure 1

Figure 1
<p>Schematic model of the α-synuclein structure, containing the N-terminal domain, NAC, and the C-terminal domain. Six synucleinopathy-related point mutaions described so far.</p>
Full article ">Figure 2
<p>Schematic model of the MOM and α-synuclein association. The picture shows α-synuclein binding patterns at the MOM. Proteins that interact with α-synuclein are highlighted in colors. The possible mechanism of α-synuclein transport into the mitochondria through VDAC and TOM20. α-synuclein is shown in red. MOM, mitochondrial outer membrane; VDAC, voltage-dependent anion channels.</p>
Full article ">Figure 3
<p>Schematic model of toxic α-synuclein oligomerization with FABP3. α-synuclein initially exhibits as a monomeric form in solution. However, in the presence of FABP3, α-synuclein binds to FABP3 via its C-terminal region and forms a soluble α-synuclein-FABP3 (1:1) complex. In addtion, the α-synuclein-FABP3 complex changes over time to oligomeric forms, (α-synuclein-FABP3)n that displays cytotoxicity (modified from [<a href="#B116-biomedicines-09-00560" class="html-bibr">116</a>]).</p>
Full article ">Figure 4
<p>Schematic representation of the pathways through which FABP5 facilitates mitochondrial macropore formation and induces oligodendrocyte apoptosis [<a href="#B18-biomedicines-09-00560" class="html-bibr">18</a>]. FABP—fatty acid-binding proteins.</p>
Full article ">
19 pages, 4843 KiB  
Article
Simvastatin Enhances the Chondrogenesis But Not the Osteogenesis of Adipose-Derived Stem Cells in a Hyaluronan Microenvironment
by Shun-Cheng Wu, Chih-Hsiang Chang, Ling-Hua Chang, Che-Wei Wu, Jhen-Wei Chen, Chung-Hwan Chen, Yi-Shan Lin, Je-Ken Chang and Mei-Ling Ho
Biomedicines 2021, 9(5), 559; https://doi.org/10.3390/biomedicines9050559 - 17 May 2021
Cited by 9 | Viewed by 3598
Abstract
Directing adipose-derived stem cells (ADSCs) toward chondrogenesis is critical for ADSC-based articular cartilage regeneration. Simvastatin (SIM) was reported to promote both chondrogenic and osteogenic differentiation of ADSCs by upregulating bone morphogenetic protein-2 (BMP-2). We previously found that ADSC chondrogenesis is initiated and promoted [...] Read more.
Directing adipose-derived stem cells (ADSCs) toward chondrogenesis is critical for ADSC-based articular cartilage regeneration. Simvastatin (SIM) was reported to promote both chondrogenic and osteogenic differentiation of ADSCs by upregulating bone morphogenetic protein-2 (BMP-2). We previously found that ADSC chondrogenesis is initiated and promoted in a hyaluronan (HA) microenvironment (HAM). Here, we further hypothesized that SIM augments HAM-induced chondrogenesis but not osteogenesis of ADSCs. ADSCs were treated with SIM in a HAM (SIM plus HAM) by HA-coated wells or HA-enriched fibrin (HA/Fibrin) hydrogel, and chondrogenic differentiation of ADSCs was evaluated. SIM plus HAM increased chondrogenesis more than HAM or SIM alone, including cell aggregation, chondrogenic gene expression (collagen type II and aggrecan) and cartilaginous tissue formation (collagen type II and sulfated glycosaminoglycan). In contrast, SIM-induced osteogenesis in ADSCs was reduced in SIM plus HAM, including mRNA expression of osteogenic genes, osteocalcin and alkaline phosphatase (ALP), ALP activity and mineralization. SIM plus HAM also showed the most effective increases in the mRNA expression of BMP-2 and transcription factors of SOX-9 and RUNX-2 in ADSCs, while these effects were reversed by CD44 blockade. HAM suppressed the levels of JNK, p-JNK, P38 and p-P38 in ADSCs, and SIM plus HAM also decreased SIM-induced phosphorylated JNK and p38 levels. In addition, SIM enhanced articular cartilage regeneration, as demonstrated by implantation of an ADSCs/HA/Fibrin construct in an ex vivo porcine articular chondral defect model. The results from this study indicate that SIM may be an enhancer of HAM-initiated MSC-based chondrogenesis and avoid osteogenesis. Full article
Show Figures

Figure 1

Figure 1
<p>SIM plus HAM enhances the chondrogenesis of ADSCs. ADSCs were treated with SIM and cultured in wells with/without an HA coating, and the chondrogenesis of ADSCs was analyzed. (<b>A</b>) Cell aggregation of ADSCs in the control, SIM, HAM and SIM+HAM groups at 4 h (scale bar = 200 μm). (<b>B</b>) The mRNA expression levels of chondrogenic genes (aggrecan and collagen type II) in the control, SIM, HAM and SIM+HAM groups on day 3. The gene expression levels are expressed relative to those in the control group, which are defined as 1. (<b>C</b>) Alcian blue staining of sGAG in the control, SIM, HAM and SIM+HAM groups on day 7. Blue: Alcian blue staining (scale bars = 200 μm). sGAG synthesis and collagen type II synthesis by ADSCs were quantified with a DMMB assay and an ELISA kit, respectively. The abundance of synthesized sGAG or collagen type II normalized to the total DNA concentration in each group is expressed as the sGAG/DNA or collagen type II/DNA ratios. The sGAG/DNA and collagen type II/DNA ratios are expressed relative to that in the control group on day 7, which is defined as 1. (<b>D</b>) ADSCs were embedded in a 3D HA-enriched fibrin hydrogel (HA/Fibrin) and treated with SIM in chondrogenic medium for 14 days. sGAG synthesis and collagen type II synthesis by ADSCs were quantified with a DMMB assay and an ELISA kit, respectively. The abundance of synthesized sGAG or collagen type II normalized to the total DNA concentration in each group is expressed as the sGAG/DNA or collagen type II/DNA ratios. The sGAG/DNA and collagen type II/DNA ratios are expressed relative to that in the control group on day 14, which is defined as 1. The values presented are the means ± SEMs (<span class="html-italic">n</span> = 6). (*) and (**) indicate <span class="html-italic">p</span> &lt; 0.05 and <span class="html-italic">p</span> &lt; 0.01, respectively, compared with the control group. (#) and (##) indicate <span class="html-italic">p</span> &lt; 0.05 and <span class="html-italic">p</span> &lt; 0.01, respectively, compared with the SIM group.</p>
Full article ">Figure 1 Cont.
<p>SIM plus HAM enhances the chondrogenesis of ADSCs. ADSCs were treated with SIM and cultured in wells with/without an HA coating, and the chondrogenesis of ADSCs was analyzed. (<b>A</b>) Cell aggregation of ADSCs in the control, SIM, HAM and SIM+HAM groups at 4 h (scale bar = 200 μm). (<b>B</b>) The mRNA expression levels of chondrogenic genes (aggrecan and collagen type II) in the control, SIM, HAM and SIM+HAM groups on day 3. The gene expression levels are expressed relative to those in the control group, which are defined as 1. (<b>C</b>) Alcian blue staining of sGAG in the control, SIM, HAM and SIM+HAM groups on day 7. Blue: Alcian blue staining (scale bars = 200 μm). sGAG synthesis and collagen type II synthesis by ADSCs were quantified with a DMMB assay and an ELISA kit, respectively. The abundance of synthesized sGAG or collagen type II normalized to the total DNA concentration in each group is expressed as the sGAG/DNA or collagen type II/DNA ratios. The sGAG/DNA and collagen type II/DNA ratios are expressed relative to that in the control group on day 7, which is defined as 1. (<b>D</b>) ADSCs were embedded in a 3D HA-enriched fibrin hydrogel (HA/Fibrin) and treated with SIM in chondrogenic medium for 14 days. sGAG synthesis and collagen type II synthesis by ADSCs were quantified with a DMMB assay and an ELISA kit, respectively. The abundance of synthesized sGAG or collagen type II normalized to the total DNA concentration in each group is expressed as the sGAG/DNA or collagen type II/DNA ratios. The sGAG/DNA and collagen type II/DNA ratios are expressed relative to that in the control group on day 14, which is defined as 1. The values presented are the means ± SEMs (<span class="html-italic">n</span> = 6). (*) and (**) indicate <span class="html-italic">p</span> &lt; 0.05 and <span class="html-italic">p</span> &lt; 0.01, respectively, compared with the control group. (#) and (##) indicate <span class="html-italic">p</span> &lt; 0.05 and <span class="html-italic">p</span> &lt; 0.01, respectively, compared with the SIM group.</p>
Full article ">Figure 2
<p>SIM plus HAM reduces the osteogenesis of ADSCs. ADSCs were treated with SIM and cultured in wells with/without an HA coating in basal medium, and the osteogenesis of ADSCs was analyzed. (<b>A</b>) The mRNA expression levels of osteogenic genes (osteocalcin; OC and alkaline phosphatase; ALP) in the control, SIM, HAM and SIM+HAM groups on day 3. The gene expression levels are expressed relative to those in the control group, which are defined as 1. (<b>B</b>) ADSCs were treated with SIM and cultured in wells with/without an HA coating in osteogenic medium, and the mineralization of ADSCs was analyzed. ALP activity and Alizarin red S staining of calcium deposition were performed on day 12. Red: Alizarin red S staining. The abundance of ALP activity and calcium deposition are expressed relative to that in the control group on day 12, which is defined as 1. The values presented are the means ± SEMs (<span class="html-italic">n</span> = 6). (*) and (**) indicate <span class="html-italic">p</span> &lt; 0.05 and <span class="html-italic">p</span> &lt; 0.01, respectively, compared with the control group. (#) and (##) indicate <span class="html-italic">p</span> &lt; 0.05 and <span class="html-italic">p</span> &lt; 0.01, respectively, compared with the SIM group.</p>
Full article ">Figure 3
<p>SIM plus HAM enhances the mRNA expression of transcription factors for ADSC chondrogenesis and osteogenesis. ADSCs were pretreated with IM7 (+IM7) or without IM7 (−IM7) prior to SIM treatment and cultivated in wells with/without an HA coating, and the mRNA expression levels of (<b>A</b>) BMP-2, SOX-9 and RUNX-2 in the control, SIM, HAM and SIM+HAM groups on day 3 were analyzed. The mRNA levels are expressed relative to those in the control group, which are defined as 1. The values presented are the means ± SEMs (<span class="html-italic">n</span> = 6). (*) and (**) indicate <span class="html-italic">p</span> &lt; 0.05 and <span class="html-italic">p</span> &lt; 0.01, respectively, compared with the control group. (#) and (##) indicate <span class="html-italic">p</span> &lt; 0.05 and <span class="html-italic">p</span> &lt; 0.01, respectively, and represent the comparison between +IM7 and -IM7 in each group. (<b>B</b>) p38 and JNK signaling were analyzed by Western blot. Representative Western blot photographs were shown. (<b>C</b>) The p-JNK/β-actin, JNK/β-actin and p-JNK/JNK ratios and (<b>D</b>) p-p38/β-actin, p38/β-actin and p-p38/p38 ratios are expressed relative to that in the control group on day 3, which is defined as 1. The values presented are the means ± SEMs (<span class="html-italic">n</span> = 6). (*) and (**) indicate <span class="html-italic">p</span> &lt; 0.05 and <span class="html-italic">p</span> &lt; 0.01, respectively, compared with the control group. (#) and (##) indicate <span class="html-italic">p</span> &lt; 0.05 and <span class="html-italic">p</span> &lt; 0.01, respectively, compared with the SIM group.</p>
Full article ">Figure 4
<p>SIM plus 3D HAM increases the neoformation of cartilaginous tissue by ADSCs at the articular cartilage defect site. (<b>A</b>) Histological images of each group after safranin O and fast green staining. Representative micrographs of the empty, HAM, ADSC, HAM/ADSC and SIM/HAM/ADSC groups are shown. sGAG was stained red, and green indicates the counterstain. The original magnification was 40× (scale bar = 1000 μm) or 100× (scale bar = 500 μm). (<b>B</b>) Quantitative analysis of the percentage of neocartilaginous tissue formed at the defect site. The values indicate the ratio of neocartilaginous tissue formation to the defect area after 4 weeks of culture. The values are the means ± SEMs (<span class="html-italic">n</span> = 5). (*) and (**) indicate <span class="html-italic">p</span> &lt; 0.05 and <span class="html-italic">p</span> &lt; 0.01, respectively, compared with the empty group. (#) indicates <span class="html-italic">p</span> &lt; 0.05 compared with the HAM/ADSC group.</p>
Full article ">Figure 5
<p>The optimal timing at which SIM plus HAM enhances BMP-2 expression in ADSCs is day 3. ADSCs were treated with SIM and cultured in wells with/without HA coating. BMP-2 and SOX-9 expressions in ADSCs were analyzed from days 1 to 5. (<b>A</b>) mRNA expression levels of BMP-2 and SOX-9 in the control, SIM, HAM and SIM+HAM groups from days 1 to 5. The gene expression levels are relative to those in the control group, which are defined as 1. (<b>B</b>) The protein expression levels of BMP-2 and β-actin in the control, SIM, HAM and SIM+HAM groups on day 3. The BMP-2/β-actin expression ratio of each group is relative to that of the control group, which is defined as 1. The values presented are the means ± SEMs (<span class="html-italic">n</span> = 4). (*) and (**) indicate <span class="html-italic">p</span> &lt; 0.05 and <span class="html-italic">p</span> &lt; 0.01, respectively, compared with the control group. (#) and (##) indicate <span class="html-italic">p</span> &lt; 0.05 and <span class="html-italic">p</span> &lt; 0.01, respectively, compared with the SIM group.</p>
Full article ">
16 pages, 2940 KiB  
Article
Influence of Microbial Metabolites on the Nonspecific Permeability of Mitochondrial Membranes under Conditions of Acidosis and Loading with Calcium and Iron Ions
by Nadezhda Fedotcheva, Andrei Olenin and Natalia Beloborodova
Biomedicines 2021, 9(5), 558; https://doi.org/10.3390/biomedicines9050558 - 17 May 2021
Cited by 15 | Viewed by 2784
Abstract
Mitochondrial dysfunction is currently considered one of the main causes of multiple organ failure in chronic inflammation and sepsis. The participation of microbial metabolites in disorders of bioenergetic processes in mitochondria has been revealed, but their influence on the mitochondrial membrane permeability has [...] Read more.
Mitochondrial dysfunction is currently considered one of the main causes of multiple organ failure in chronic inflammation and sepsis. The participation of microbial metabolites in disorders of bioenergetic processes in mitochondria has been revealed, but their influence on the mitochondrial membrane permeability has not yet been studied. We tested the influence of various groups of microbial metabolites, including indolic and phenolic acids, trimethylamine-N-oxide (TMAO) and acetyl phosphate (AcP), on the nonspecific permeability of mitochondrial membranes under conditions of acidosis, imbalance of calcium ions and excess free iron, which are inherent in sepsis. Changes in the parameters of the calcium-induced opening of the mitochondrial permeability transition pore (MPTP) and iron-activated swelling of rat liver mitochondria were evaluated. The most active metabolites were indole-3-carboxylic acid (ICA) and benzoic acid (BA), which activated MPTP opening and swelling under all conditions. AcP showed the opposite effect on the induction of MPTP opening, increasing the threshold concentration of calcium by 1.5 times, while TMAO activated swelling only under acidification. All the redox-dependent effects of metabolites were suppressed by the lipid radical scavenger butyl-hydroxytoluene (BHT), which indicates the participation of these microbial metabolites in the activation of membrane lipid peroxidation. Thus, microbial metabolites can directly affect the nonspecific permeability of mitochondrial membranes, if conditions of acidosis, an imbalance of calcium ions and an excess of free iron are created in the pathological state. Full article
(This article belongs to the Section Molecular and Translational Medicine)
Show Figures

Figure 1

Figure 1
<p>Influence of indolic and phenolic acids on MPTP opening induced by calcium ions. MPTP opening in the course of successive additions of 25 µM CaCl<sub>2</sub> in the presence of indolic acids at a concentration of 100 µM, determined by a drop in the membrane potential (<b>a</b>) and by Ca<sup>2+</sup> release (<b>b</b>) in the control and in the presence of indole carboxylic acid (ICA, 100 µM). A decrease in the calcium retention capacity (CRC) with an increase in ICA concentration from 50 to 200 µM (<b>c</b>) and changes in the CRC at different concentrations of other indolic acids (<b>d</b>). MPTP opening measured by the membrane potential changes in the course of successive additions of 25 µM CaCl<sub>2</sub> in the presence of phenolic acids at a concentration of 100 µM (<b>e</b>) and changes in the CRC at different concentrations of phenolic acids (<b>f</b>). Asterisk (*) indicates values that differ significantly from the control values (<span class="html-italic">p</span> &lt; 0.05).</p>
Full article ">Figure 2
<p>Influence of indolic acids on the mitochondrial swelling activated by iron ions. Activation of swelling during incubation with iron ions (50 µM FeSO<sub>4</sub>) and 100 µM ICA (<b>a</b>, <b>b</b>) and at different ICA concentrations (<b>c</b>); changes in the swelling parameters in the presence of different ICA concentrations (<b>d</b>). The influence of indolic acids on swelling (<b>e</b>) and the swelling parameters: the lag phase and the swelling rate (<b>f</b>). The swelling rate (Δ/min) is indicated in parentheses. Asterisk (*) indicates values that differ significantly from the control values (<span class="html-italic">p</span> &lt; 0.05).</p>
Full article ">Figure 3
<p>Influence of phenolic acids on mitochondrial swelling induced by iron ions and its elimination by BHT. Activation of the swelling of mitochondria during incubation with iron ions (50 µM FeSO<sub>4</sub>) and phenolic acids at a concentration of 100 µM (<b>a</b>); changes in the swelling parameters in the presence of 50 µM FeSO<sub>4</sub> and phenolic acids in the concentration range 100–500 µM (<b>b</b>); and the elimination by BHT of swelling induced by 50 µM FeSO<sub>4</sub> alone (<b>c</b>) and with 100 µM ICA (<b>d</b>).</p>
Full article ">Figure 4
<p>Influence of an excess of indolic and phenolic acids on mitochondrial swelling at neutral pH. Activation of the swelling in the course of successive additions of indolic (<b>a</b>) and phenolic (<b>b</b>) acids at a concentration of 100 µM each; the inhibition by CsA of swelling induced by CA (<b>c</b>) and BA (<b>d</b>).</p>
Full article ">Figure 5
<p>Influence of indolic and phenolic acids on mitochondrial swelling activated by acidification. Activation of swelling by indolic (<b>a</b>) and phenolic (<b>b</b>) acids at a concentration of 100 µM each during incubation at pH 6.7; swelling in the presence of 50 and 100 µM ICA (<b>c</b>) and its inhibition by CsA and BHT (<b>d</b>); comparison of the swelling rate in the presence of indolic (<b>e</b>) and phenolic (<b>f</b>) acids at different concentrations (50–500 µM) at pH 7.4 and 6.7. The swelling rate (Δ/min) is indicated in parentheses.</p>
Full article ">Figure 6
<p>Influence of TMAO and AcP on the MPTP opening induced by calcium ions and on swelling activated by iron ions and medium acidification. MPTP opening in the course of successive additions of 25 µM CaCl<sub>2</sub> in the presence of AcP (<b>a</b>) and TMAO (<b>b</b>) at indicated concentrations; iron-activated swelling in the presence of AcP and TMAO at concentrations of 200 µM (<b>c</b>); swelling activated by acidification (pH 6.7) in the presence of AcP and TMAO at a concentration of 100 µM and its elimination by BHT, the swelling rate (Δ/min) is indicated in parentheses (<b>d</b>); calcium retention capacity at different AcP and TMAO concentrations (100–500 µM) (<b>e</b>) and swelling parameters in the presence of AcP and TMAO at concentrations of 100 µM under iron loading and medium acidification (<b>f</b>). Asterisk (*) indicates values that differ significantly from the control values (<span class="html-italic">p</span> &lt; 0.05).</p>
Full article ">Figure 7
<p>Contribution of microbial metabolites to the regulation of mitochondrial membrane permeability under conditions associated with infections and sepsis. The activation of the listed processes is shown with black arrows, the inhibition highlighted by a red sign.</p>
Full article ">
16 pages, 621 KiB  
Review
Immunosurveillance of Cancer and Viral Infections with Regard to Alterations of Human NK Cells Originating from Lifestyle and Aging
by Xuewen Deng, Hiroshi Terunuma and Mie Nieda
Biomedicines 2021, 9(5), 557; https://doi.org/10.3390/biomedicines9050557 - 17 May 2021
Cited by 12 | Viewed by 5796
Abstract
Natural killer (NK) cells are cytotoxic immune cells with an innate capacity for eliminating cancer cells and virus- infected cells. NK cells are critical effector cells in the immunosurveillance of cancer and viral infections. Patients with low NK cell activity or NK cell [...] Read more.
Natural killer (NK) cells are cytotoxic immune cells with an innate capacity for eliminating cancer cells and virus- infected cells. NK cells are critical effector cells in the immunosurveillance of cancer and viral infections. Patients with low NK cell activity or NK cell deficiencies are predisposed to increased risks of cancer and severe viral infections. However, functional alterations of human NK cells are associated with lifestyles and aging. Personal lifestyles, such as cigarette smoking, alcohol consumption, stress, obesity, and aging are correlated with NK cell dysfunction, whereas adequate sleep, moderate exercise, forest bathing, and listening to music are associated with functional healthy NK cells. Therefore, adherence to a healthy lifestyle is essential and will be favorable for immunosurveillance of cancer and viral infections with healthy NK cells. Full article
(This article belongs to the Special Issue Recent Therapeutic Advances in Natural Killer Cells)
Show Figures

Figure 1

Figure 1
<p>Schematic depiction of NK cell immunosurveillance of cancer and viral infections. (<b>A</b>): Healthy NK cells expressing activating receptors can recognize virus- infected cells and cancer cells, and release sufficient amount of cytotoxic granules and cytokines to kill and clear virus-infected cells and cancer cells. (<b>B</b>): Dysfunctional NK cells expressing an imbalance of activating and inhibitory receptors with high expression of inhibitory receptors, malfunctions in the recognition of cancer and virus-infected cells and the release of cytotoxic granules and cytokines to kill them, evasion of immunosurveillance of viral infections and cancer, and the spread of viral infections and progression of cancer.</p>
Full article ">Figure 2
<p>Schematic short list of the impacts of lifestyles and aging on NK cells. Cigarette smoking, alcohol consumption, stress, obesity, and aging suppress NK cell function, leading to a dysfunctional NK cells, whereas sleep, exercise, forest bathing, and listening to music enhance NK cell function with maintained functional healthy NK cells.</p>
Full article ">
16 pages, 295 KiB  
Article
Predicting COVID-19—Comorbidity Pathway Crosstalk-Based Targets and Drugs: Towards Personalized COVID-19 Management
by Debmalya Barh, Alaa A. Aljabali, Murtaza M. Tambuwala, Sandeep Tiwari, Ángel Serrano-Aroca, Khalid J. Alzahrani, Bruno Silva Andrade, Vasco Azevedo, Nirmal Kumar Ganguly and Kenneth Lundstrom
Biomedicines 2021, 9(5), 556; https://doi.org/10.3390/biomedicines9050556 - 17 May 2021
Cited by 21 | Viewed by 4862
Abstract
It is well established that pre-existing comorbid conditions such as hypertension, diabetes, obesity, cardiovascular diseases (CVDs), chronic kidney diseases (CKDs), cancers, and chronic obstructive pulmonary disease (COPD) are associated with increased severity and fatality of COVID-19. The increased death from COVID-19 is due [...] Read more.
It is well established that pre-existing comorbid conditions such as hypertension, diabetes, obesity, cardiovascular diseases (CVDs), chronic kidney diseases (CKDs), cancers, and chronic obstructive pulmonary disease (COPD) are associated with increased severity and fatality of COVID-19. The increased death from COVID-19 is due to the unavailability of a gold standard therapeutic and, more importantly, the lack of understanding of how the comorbid conditions and COVID-19 interact at the molecular level, so that personalized management strategies can be adopted. Here, using multi-omics data sets and bioinformatics strategy, we identified the pathway crosstalk between COVID-19 and diabetes, hypertension, CVDs, CKDs, and cancers. Further, shared pathways and hub gene-based targets for COVID-19 and its associated specific and combination of comorbid conditions are also predicted towards developing personalized management strategies. The approved drugs for most of these identified targets are also provided towards drug repurposing. Literature supports the involvement of our identified shared pathways in pathogenesis of COVID-19 and development of the specific comorbid condition of interest. Similarly, shared pathways- and hub gene-based targets are also found to have potential implementations in managing COVID-19 patients. However, the identified targets and drugs need further careful evaluation for their repurposing towards personalized treatment of COVID-19 cases having pre-existing specific comorbid conditions we have considered in this analysis. The method applied here may also be helpful in identifying common pathway components and targets in other disease-disease interactions too. Full article
(This article belongs to the Section Molecular and Translational Medicine)
12 pages, 5051 KiB  
Article
Generation of Stilbene Glycoside with Promising Cell Rejuvenation Activity through Biotransformation by the Entomopathogenic Fungus Beauveria bassiana
by Sang Keun Ha, Min Cheol Kang, Seulah Lee, Om Darlami, Dongyun Shin, Inwook Choi, Ki Hyun Kim and Sun Yeou Kim
Biomedicines 2021, 9(5), 555; https://doi.org/10.3390/biomedicines9050555 - 17 May 2021
Cited by 5 | Viewed by 3206
Abstract
A stilbene glycoside (resvebassianol A) (1) with a unique sugar unit, 4-O-methyl-D-glucopyranose, was identified through biotransformation of resveratrol (RSV) by the entomopathogenic fungus Beauveria bassiana to obtain a superior RSV metabolite with enhanced safety. Its structure, including its absolute [...] Read more.
A stilbene glycoside (resvebassianol A) (1) with a unique sugar unit, 4-O-methyl-D-glucopyranose, was identified through biotransformation of resveratrol (RSV) by the entomopathogenic fungus Beauveria bassiana to obtain a superior RSV metabolite with enhanced safety. Its structure, including its absolute configurations, was determined using spectroscopic data, HRESIMS, and chemical reactions. Microarray analysis showed that the expression levels of filaggrin, HAS2-AS1, and CERS3 were higher, while those of IL23A, IL1A, and CXCL8 were lower in the resvebassianol A-treated group than in the RSV-treated group, as confirmed by qRT-PCR. Compound 1 exhibited the same regenerative and anti-inflammatory effects as RSV with no cytotoxicity in skin keratinocytes and TNF-?/IFN-?-stimulated HIEC-6 cells, suggesting that compound 1 is a safe and stable methylglycosylated RSV. Our findings suggest that our biotransformation method can be an efficient biosynthetic platform for producing a broad range of natural glycosides with enhanced safety. Full article
(This article belongs to the Special Issue Recent Advances in the Discovery of Novel Drugs on Natural Molecules)
Show Figures

Figure 1

Figure 1
<p>(<b>A</b>) Chemical structures of resvebassianol A (<b>1</b>) and RSV (<b>2</b>). (<b>B</b>) Key <sup>1</sup>H-<sup>1</sup>H COSY (blue bold lines) and HMBC (red arrows) correlations of <b>1</b>. (<b>C</b>) Coupling constant analysis of 4-<span class="html-italic">O</span>-methyl-D-glucopyranose.</p>
Full article ">Figure 2
<p>Differential expression of genes in resvebassianol A- and RSV-treated keratinocytes. (<b>A</b>) Hierarchical clustering of altered mRNA. Microarray analysis for mRNA expression patterns of platelet heatmap of deregulated mRNAs, which were two-fold upregulated or downregulated. (<b>B</b>) Volcano plotting microarray analysis revealed the mRNAs that were two-fold upregulated or downregulated in platelet during storage.</p>
Full article ">Figure 3
<p>The key differentially expressed mRNAs identified from microarray were verified using qRT-PCR. The expression of genes in resvebassianol A (<b>1</b>)- and RSV-treated groups was consistent with the results of gene chip detection. Values are expressed as means ± SD. * <span class="html-italic">p</span> &lt; 0.05, ** <span class="html-italic">p</span> &lt; 0.01, and *** <span class="html-italic">p</span> &lt; 0.001 vs. RSV-treated group; Comp. means compound.</p>
Full article ">Figure 4
<p>Effects of resvebassianol A on the proliferation and migration of HaCaT cells. (<b>A</b>) Cells were cultured in 96-well plates, and they were treated with resvebassianol A and RSV (1, 10, and 25 μM). After 24 h cell viability was measured using the MTT assay. (<b>B</b>) HaCaT cell proliferation after 24 and 48 h of treatment with resvebassianol A and RSV was measured using BrdU incorporation assay. (<b>C</b>) The wound margin was photographed after 0 h and 6 h of wound scratching. (<b>D</b>) Quantitative analysis of wound closure was determined as the wound area at a given time relative to that of the IL-22-treated group. Values are expressed as means ± SEM. <sup>##</sup> <span class="html-italic">p &lt;</span> 0.01 and <sup>###</sup> <span class="html-italic">p</span> &lt; 0.001 versus untreated (control) group; * <span class="html-italic">p</span> &lt; 0.05, ** <span class="html-italic">p</span> &lt; 0.01, and *** <span class="html-italic">p</span> &lt; 0.001 vs. IL-22-treated group.</p>
Full article ">Figure 5
<p>Inhibitory effects of resvebassianol A on the inflammatory cytokine expression of TNF-α/INF-γ-induced HIEC-6 cells. (<b>A</b>) Cells were cultured in 96-well plates, and they were treated with resvebassianol A and RSV at 1 and 10 μM, respectively. After 24 h, cell viability was measured using the MTT assay. (<b>B</b>,<b>C</b>) The levels of IL-6 and IL-1β in the supernatants were determined using ELISA. Values are expressed as means ± SD. <sup>###</sup> <span class="html-italic">p</span> &lt; 0.001 versus control group; * <span class="html-italic">p</span> &lt; 0.05, ** <span class="html-italic">p</span> &lt; 0.01, and *** <span class="html-italic">p</span> &lt; 0.001 vs. TNF-α/IFN-γ-treated group.</p>
Full article ">
14 pages, 724 KiB  
Review
Subpopulations of High-Density Lipoprotein: Friends or Foes in Cardiovascular Disease Risk in Chronic Kidney Disease?
by Susana Coimbra, Flávio Reis, Maria João Valente, Susana Rocha, Cristina Catarino, Petronila Rocha-Pereira, Maria Sameiro-Faria, Elsa Bronze-da-Rocha, Luís Belo and Alice Santos-Silva
Biomedicines 2021, 9(5), 554; https://doi.org/10.3390/biomedicines9050554 - 16 May 2021
Cited by 3 | Viewed by 4032
Abstract
Dyslipidemia is a major traditional risk factor for cardiovascular disease (CVD) in chronic kidney disease (CKD) patients, although the altered lipid profile does not explain the number and severity of CVD events. High-density lipoprotein (HDL) is a heterogeneous (size, composition, and functionality) population [...] Read more.
Dyslipidemia is a major traditional risk factor for cardiovascular disease (CVD) in chronic kidney disease (CKD) patients, although the altered lipid profile does not explain the number and severity of CVD events. High-density lipoprotein (HDL) is a heterogeneous (size, composition, and functionality) population of particles with different atherogenic or atheroprotective properties. HDL-cholesterol concentrations per se may not entirely reflect a beneficial or a risk profile for CVD. Large HDL in CKD patients may have a unique proteome and lipid composition, impairing their cholesterol efflux capacity. This lack of HDL functionality may contribute to the paradoxical coexistence of increased large HDL and enhanced risk for CVD events. Moreover, CKD is associated with inflammation, oxidative stress, diabetes, and/or hypertension that are able to interfere with the anti-inflammatory, antioxidative, and antithrombotic properties of HDL subpopulations. How these changes interfere with HDL functions in CKD is still poorly understood. Further studies are warranted to fully clarify if different HDL subpopulations present different functionalities and/or atheroprotective effects. To achieve this goal, the standardization of techniques would be valuable. Full article
Show Figures

Figure 1

Figure 1
<p>Illustration of high-density lipoprotein (HDL) separation into subfractions of one studied control (<b>a</b>) and one end-stage renal disease patient on dialysis (<b>b</b>) using the Lipoprint® kit from Quantimetrix Corp. (Redondo Beach, CA, USA). (HDL is separated into 10 subfractions that are classified as large HDL (1–3 subfractions—green color), intermediate HDL (4–7 subfractions—yellow color), and small HDL (8–10 subfractions—red color)).</p>
Full article ">Figure 2
<p>Schematic view of the major alterations in HDL composition in chronic kidney disease. (Apo, apolipoprotein; AMBP, α-1-microglobulin/bikunin precursor; β2M, β-2-microglobulin; CETP, cholesteryl ester transfer protein; GPx, glutathione peroxidase; LCAT, lecithin–cholesterol acyltransferase; PON1, paraoxonase 1; RBP, retinol binding protein; SAA, serum amyloid; SP-B, surfactant protein B; ↑, increases; ↓, decreases).</p>
Full article ">
Previous Issue
Next Issue
Back to TopTop