[go: up one dir, main page]

Next Issue
Volume 12, September
Previous Issue
Volume 12, July


Biomedicines, Volume 12, Issue 8 (August 2024) – 306 articles

Cover Story (view full-size image): 
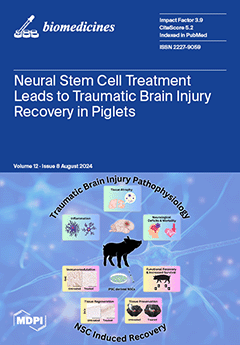
Traumatic Brain Injury (TBI) is a leading cause of death and disability as there are currently no FDA-approved treatments, thus resulting in inflammation, tissue atrophy, and neurological deficits in patients. Schantz, Sneed et al. demonstrated that induced pluripotent stem cell (iPSC)-derived neural stem cells (NSCs) are a promising therapeutic that promoted recovery through immunomodulation, tissue regeneration, and tissue preservation in a translational piglet TBI model with comparable neuroanatomy and physiology to pediatric TBI patients. These cellular-level outcomes led to enhanced functional recovery and increased survivability in piglets, thus supporting further investigations to advance NSC treatment from the bench to bedside. View this paper
  • Issues are regarded as officially published after their release is announced to the table of contents alert mailing list.
  • You may sign up for e-mail alerts to receive table of contents of newly released issues.
  • PDF is the official format for papers published in both, html and pdf forms. To view the papers in pdf format, click on the "PDF Full-text" link, and use the free Adobe Reader to open them.
Order results
Result details
Section
Select all
Export citation of selected articles as:
18 pages, 1786 KiB  
Review
Association between the Exposure to Phthalates and the Risk of Endometriosis: An Updated Review
by Bárbara Ribeiro, Melissa Mariana, Margarida Lorigo, Denise Oliani, Ana Cristina Ramalhinho and Elisa Cairrao
Biomedicines 2024, 12(8), 1932; https://doi.org/10.3390/biomedicines12081932 - 22 Aug 2024
Cited by 1 | Viewed by 1932
Abstract
Endometriosis is a chronic gynecological disease, primarily associated with pelvic pain and infertility, that affects approximately 10% of the women of reproductive age. Estrogen plays a central role in endometriosis, and there is growing evidence that endocrine disruptors, such as phthalates, may contribute [...] Read more.
Endometriosis is a chronic gynecological disease, primarily associated with pelvic pain and infertility, that affects approximately 10% of the women of reproductive age. Estrogen plays a central role in endometriosis, and there is growing evidence that endocrine disruptors, such as phthalates, may contribute to its development. This review aimed to determine whether there is a causal relationship between phthalate exposure and the development of endometriosis, as well as the possible effects of phthalates on fertility, by analyzing epidemiological data. After a literature search with a combination of specific terms on this topic, we found that although there are limitations to the current studies, there is a clear association between phthalate exposure and endometriosis. Phthalates can interfere with the cellular processes of the endometrium; specifically, they can bind to PPAR and ER-α and activate TGF-β, promoting different signaling cascades that regulate the expression of specific target genes. This may lead to inflammation, invasion, cytokine alteration, increased oxidative stress, and impaired cell viability and proliferation, culminating in endometriosis. Nevertheless, future research is important to curb the progression and development of endometriosis, and strategies for prevention, diagnosis, and treatment are a priority. In this regard, public policies and recommendations to reduce exposure to phthalates and other endocrine disruptors should be promptly implemented. Full article
(This article belongs to the Special Issue Pollutants and Human Health: Focus on Molecular-Level Research)
Show Figures

Figure 1

Figure 1
<p>Theories of endometriosis pathophysiology and the main factors involved in its etiology.</p>
Full article ">Figure 2
<p>The most common symptoms associated with endometriosis.</p>
Full article ">Figure 3
<p>General chemical structure of phthalates (MolView v2.4).</p>
Full article ">Figure 4
<p>The effect of phthalates on endometrial cells. Phthalate enters cells and binds to receptors such as PPAR and ER-α. By forming complexes with these receptors, it translocates to the nucleus, regulating gene transcription in target genes. Phthalate can also activate TGF-β, which binds to the receptors—TGFβR 1/2—phosphorylating and activating Smad, which are transported to the nucleus as transcription factors to regulate gene expression. After phthalate stimulation, endometrial cells show inflammation; invasion; cytokine alteration; increased oxidative stress, cell viability, and proliferation. Legend: TGF-β—transforming growth factor-β; TGFβR 1/2—TGF-β receptor type 1/2; RXR—retinoid X receptor; PPARγ—peroxisome proliferator activated receptor γ; EREs—estrogen response elements: PPREs—peroxisome proliferator response elements; PGF-2α—prostaglandin F2-α; PGE-2—prostaglandin E2; Pak-4—p21-activated kinase-4; ICAM—intercellular cell adhesion molecule; COX2—cyclooxygenase-2; IL 1β/8—interleukins 1β/8; MAPK—mitogen-activated protein kinase; NF-κb—nuclear factor kappa B; ROS—reactive oxygen species; SOD—superoxide dismutase; GPx—glutathione peroxidase; HO—heme oxygenase; CAT—catalase; Erk—extracellular-signal-regulated kinase; MMP 2/9—metalloproteinase 2/9.</p>
Full article ">
13 pages, 1326 KiB  
Review
Could the Early Detection of Atrial Fibrillation Reduce the Risk of Developing Dementia?
by Fabrice Demoniere, Rim Abdelli and Léna Rivard
Biomedicines 2024, 12(8), 1931; https://doi.org/10.3390/biomedicines12081931 - 22 Aug 2024
Viewed by 1324
Abstract
Atrial fibrillation (AF) and dementia are major global public health issues and share common risk factors, especially after the age of 65 and regardless of the presence of stroke. Despite accounting for potential confounders, AF appears to be an independent risk factor for [...] Read more.
Atrial fibrillation (AF) and dementia are major global public health issues and share common risk factors, especially after the age of 65 and regardless of the presence of stroke. Despite accounting for potential confounders, AF appears to be an independent risk factor for cognitive decline and dementia. The mechanisms are likely to be multifactorial and may include AF-related ischemic stroke, cerebral hypoperfusion, microbleeds, systemic inflammation, genetic factors, and small vessel disease, leading to brain atrophy and white matter damage. The early aggressive management of AF and comorbidities may reduce the risk of dementia. Indeed, the early detection of AF-related cognitive impairment should allow for the early implementation of measures to prevent the development of dementia, mainly through integrative approaches involving the correction of risk factors and maintenance of rhythm control. Well-designed prospective studies are needed to determine whether early detection and AF treatment can prevent dementia and identify whether optimal integrative measures are effective in preventing cognitive impairment and dementia. Full article
(This article belongs to the Special Issue Advanced Research in Atrial Fibrillation)
Show Figures

Figure 1

Figure 1
<p>Projections of dementia and AF in the USA.</p>
Full article ">Figure 2
<p>Potential targets to decrease dementia in AF patients.</p>
Full article ">Figure 3
<p>Published and ongoing trials on AF and cognition.</p>
Full article ">
14 pages, 893 KiB  
Review
Selective COX-2 Inhibitors as Neuroprotective Agents in Traumatic Brain Injury
by Matthew I. Hiskens, Anthony G. Schneiders and Andrew S. Fenning
Biomedicines 2024, 12(8), 1930; https://doi.org/10.3390/biomedicines12081930 - 22 Aug 2024
Cited by 2 | Viewed by 1732
Abstract
Traumatic brain injury (TBI) is a significant contributor to mortality and morbidity in people, both young and old. There are currently no approved therapeutic interventions for TBI. Following TBI, cyclooxygenase (COX) enzymes generate prostaglandins and reactive oxygen species that perpetuate inflammation, with COX-1 [...] Read more.
Traumatic brain injury (TBI) is a significant contributor to mortality and morbidity in people, both young and old. There are currently no approved therapeutic interventions for TBI. Following TBI, cyclooxygenase (COX) enzymes generate prostaglandins and reactive oxygen species that perpetuate inflammation, with COX-1 and COX-2 isoforms providing differing responses. Selective COX-2 inhibitors have shown potential as neuroprotective agents. Results from animal models of TBI suggest potential treatment through the alleviation of secondary injury mechanisms involving neuroinflammation and neuronal cell death. Additionally, early clinical trials have shown that the use of celecoxib improves patient mortality and outcomes. This review aims to summarize the therapeutic effects of COX-2 inhibitors observed in TBI animal models, highlighting pertinent studies elucidating molecular pathways and expounding upon their mechanistic actions. We then investigated the current state of evidence for the utilization of COX-2 inhibitors for TBI patients. Full article
Show Figures

Figure 1

Figure 1
<p>Generation of prostaglandins and free radicals following TBI. TBI increases the activity of phospholipase A<sub>2</sub>, phospholipase D, and phospholipase C enzymes, resulting in arachidonic acid generation. COX-1 and COX-2 enzymes convert arachidonic acid into prostaglandin G<sub>2,</sub> which is then converted into prostaglandin H<sub>2</sub>. Prostaglandin H<sub>2</sub> is then converted into prostaglandin analogs and thromboxane A<sub>2</sub>. These metabolites trigger physiological effects, and also result in the further generation of free radicals.</p>
Full article ">Figure 2
<p>Structure of celecoxib and rofecoxib.</p>
Full article ">
14 pages, 1564 KiB  
Article
Effect of Pravastatin on Placental Expression of Epidermal Growth Factor-like Domain 7 in Early-Onset Pre-Eclampsia: A New Potential Mechanism of Action
by Silvia Salvi, Stefano Fruci, Valentina Lacconi, Federica Totaro Aprile, Roberta Rullo, Heidi Stuhlmann, Antonio Lanzone, Luisa Campagnolo and Micol Massimiani
Biomedicines 2024, 12(8), 1929; https://doi.org/10.3390/biomedicines12081929 - 22 Aug 2024
Viewed by 1092
Abstract
The primary intervention for pre-eclampsia (PE) remains iatrogenic delivery, which can be very preterm and not optimal for the fetus. Although many efforts have been made to prevent and manage PE, there is still a dearth of drugs to treat its pathophysiological progression. [...] Read more.
The primary intervention for pre-eclampsia (PE) remains iatrogenic delivery, which can be very preterm and not optimal for the fetus. Although many efforts have been made to prevent and manage PE, there is still a dearth of drugs to treat its pathophysiological progression. Pravastatin (PRA), a hydrophilic statin, has gained interest for the prevention and treatment of PE. The aim of the present study was to evaluate the ability of PRA to modulate factors involved in placentation, such as Epidermal Growth Factor-Like Domain 7 (EGFL7), in human chorionic villous culture from healthy controls and women with PE. A total of 18 women were enrolled: 10 controls and 8 cases. Chorionic villous explants were maintained in culture for 24 h with or without 10 μM Pravastatin, and the expression of EGFL7 and NOTCH1 pathway members was evaluated by qRT-PCR and Western blot analysis. The rationale of the present study was to establish an ex vivo model to identify potential different responses to PRA treatment of chorionic villous explants in order to clarify the molecular mechanism of PRA in the prevention and treatment of PE and to predict whether there are specific clinical conditions that modulate the response to the drug treatment. Within PE patients, two different groups were identified: the high responders, whose villous cultures exhibit significantly increased expressions of the EGFL7 and Notch pathways after PRA incubation; and the low responders, who are high-risk PE patients in which prophylaxis failed to prevent PE and PRA was not able to modulate EGFL7 expression. In conclusion, we identified EGFL7 as a new factor regulated by PRA, placing interest in early discrimination between low- and high- risk women, in which the well-known pharmacological prophylaxis seems to be ineffective, and to explore new potential prevention strategies. Full article
(This article belongs to the Special Issue Role of Factors in Embryo Implantation and Placental Development)
Show Figures

Figure 1

Figure 1
<p><span class="html-italic">EGFL7</span> gene expression levels in chorionic villous explants immediately after dissection. (<b>A</b>): Representative phase-contrast images of villous explant samples from control and PE placenta. (<b>B</b>): qRT-PCR analysis demonstrating reduced expression of <span class="html-italic">EGFL7</span> in PE villous explant samples compared to the healthy controls. Scale bar in panel images = 250 μM. Statistical analysis was performed using Mann–Whitney test (** <span class="html-italic">p</span> = 0.0044).</p>
Full article ">Figure 2
<p>Effect of pravastatin administration to ex vivo chorionic villous explant cultures on <span class="html-italic">EGFL7</span> expression. (<b>A</b>): Representative phase-contrast images of villous explants from healthy control and PE placenta after 24 h of culture in the presence or absence of 10 μM pravastatin (PRA). (<b>B</b>): qRT-PCR analysis showing that PRA treatment did not affect <span class="html-italic">EGFL7</span> expression in both healthy control and PE villous cultures. Scale bar in panel images = 250 μM. Statistical analysis was performed using Student’s <span class="html-italic">t</span> test. − and + PRA: without or with 10 μM pravastatin.</p>
Full article ">Figure 3
<p>Identification of high-responder and low-responder PE pregnancies following treatment of chorionic villous explant cultures with 10 μM pravastatin (PRA) for 24 h. (<b>A</b>,<b>B</b>): qRT-PCR analysis demonstrating increased expression of <span class="html-italic">EGFL7</span> in high-responder PE villous explant cultures following PRA treatment (<b>A</b>) and no changes in low-responder PE villous cultures (<b>B</b>) when compared to villi cultured without PRA. (<b>C</b>): Western blot analysis of villous explant cultures with or without PRA, indicating increased expression of EGFL7 in high-responder PE villous cultures. (<b>D</b>): Quantification of Western blot analysis (<span class="html-italic">n</span> = 3). Statistical analysis was performed using Student’s <span class="html-italic">t</span> test (* <span class="html-italic">p</span> = 0.0467 for qRT-PCR; * <span class="html-italic">p</span> = 0.028 for western blot). − and + PRA: without or with 10 μM pravastatin.</p>
Full article ">Figure 4
<p>Expression analysis of <span class="html-italic">NOTCH1</span> and NOTCH target genes in chorionic villous explant culture samples from healthy control and high- and low-responder PE patients untreated or after pravastatin (PRA) treatment. qRT-PCR analysis of <span class="html-italic">NOTCH1</span>, hairy, and enhancer of split-related protein 1 (<span class="html-italic">HEY1</span>) and hairy and enhancer of split-related protein 2 (<span class="html-italic">HEY2</span>) gene expression in untreated or PRA-treated villi samples, indicating that PRA treatment significantly increased the expression of <span class="html-italic">NOTCH1</span> target genes in high-responder PE villous cultures, while it did not affect their expression in both healthy controls and low-responder PE villous cultures. Statistical analysis was performed using Student’s <span class="html-italic">t</span> test (* <span class="html-italic">p</span> = 0.0290 <span class="html-italic">HEY1</span>; * <span class="html-italic">p</span> = 0.0276 <span class="html-italic">HEY2</span>).</p>
Full article ">
20 pages, 1582 KiB  
Review
Complex Interactions between the Human Major Histocompatibility Complex (MHC) and Microbiota: Their Roles in Disease Pathogenesis and Immune System Regulation
by Antonio Arnaiz-Villena, Ignacio Juarez, Christian Vaquero-Yuste, Tomás Lledo, José Manuel Martin-Villa and Fabio Suarez-Trujillo
Biomedicines 2024, 12(8), 1928; https://doi.org/10.3390/biomedicines12081928 - 22 Aug 2024
Cited by 1 | Viewed by 2017
Abstract
The relationship between microbiota and the immune system is complex and characterized by the ways in which microbiota directs immune function interactions, both innate and acquired and also keeps activating the immune system throughout an individual’s life. In this respect, the human Major [...] Read more.
The relationship between microbiota and the immune system is complex and characterized by the ways in which microbiota directs immune function interactions, both innate and acquired and also keeps activating the immune system throughout an individual’s life. In this respect, the human Major Histocompatibility Complex (MHC, referred to as HLA in humans) plays a crucial role and is also established in self-defense against microbes by presenting microbial-derived peptides to the immune cells. However, this assumption has some unclear aspects that should be investigated. For example, how is the microbiota shaped by microbe species diversity, quantity and functions of the immune system, as well as the role and molecular mechanisms of the HLA complex during this process. There are autoimmune diseases related to both HLA and specific microbiota changes or alterations, many of which are mentioned in the present review. In addition, the HLA peptide presenting function should be put in a framework together with its linkage to diseases and also with HLA compatibility necessary for transplants to be successful. These are still quite an enigmatically statistical and phenomenological approach, but no firm pathogenic mechanisms have been described; thus, HLA’s real functioning is still to be fully unveiled. After many years of HLA single-genes studies, firm pathogenesis mechanisms underlying disease linkage have been discovered. Finally, microbiota has been defined as conformed by bacteria, protozoa, archaea, fungi, and viruses; notwithstanding, endogenous viral sequences integrated into the human genome and other viral particles (obelisks) recently found in the digestive mucosa should be taken into account because they may influence both the microbiome and the immune system and their interactions. In this context, we propose to integrate these microbial-genetic particle components into the microbiome concept and designate it as “microgenobiota”. Full article
Show Figures

Figure 1

Figure 1
<p>Schematic gene structure of the HLA genomic region. Classical class I region molecules present antigens to CD8 + T lymphocytes, while class II molecules present antigens to CD4 + T lymphocytes in order to initiate immune responses. Class III region gene molecules show important immune functions, particularly the genes coding for complement system proteins of the alternative (Bf) and classical (C4a, C4b, C2) pathways. HFE or hemochromatosis gene is placed telomeric to the represented HLA-F gene [<a href="#B8-biomedicines-12-01928" class="html-bibr">8</a>,<a href="#B13-biomedicines-12-01928" class="html-bibr">13</a>,<a href="#B14-biomedicines-12-01928" class="html-bibr">14</a>,<a href="#B15-biomedicines-12-01928" class="html-bibr">15</a>,<a href="#B16-biomedicines-12-01928" class="html-bibr">16</a>,<a href="#B17-biomedicines-12-01928" class="html-bibr">17</a>,<a href="#B18-biomedicines-12-01928" class="html-bibr">18</a>,<a href="#B19-biomedicines-12-01928" class="html-bibr">19</a>,<a href="#B20-biomedicines-12-01928" class="html-bibr">20</a>,<a href="#B21-biomedicines-12-01928" class="html-bibr">21</a>,<a href="#B22-biomedicines-12-01928" class="html-bibr">22</a>].</p>
Full article ">Figure 2
<p>Non-classical immune modulatory HLA class I genes –E,–F, and –G. Seven different soluble and membrane-bound protein isoforms are described for the HLA-G molecule (and none for HLA-E and HLA-F molecules), which are represented together with their mRNAs [<a href="#B8-biomedicines-12-01928" class="html-bibr">8</a>,<a href="#B15-biomedicines-12-01928" class="html-bibr">15</a>,<a href="#B16-biomedicines-12-01928" class="html-bibr">16</a>,<a href="#B17-biomedicines-12-01928" class="html-bibr">17</a>].</p>
Full article ">Figure 3
<p>Principal microbiota sites in the human body. The gut -associated microbiome is one of the most studied and related diseases. The role of the HLA complex in some microbiota-related disease development is postulated through the theory of molecular mimicry, among others. Dysbiosis (which can be a cause or consequence of the disease) promotes a pro-inflammatory state in the intestinal mucosa. On the other hand, the structure of certain HLA alleles could predispose to the cross-presentation of microbial peptides to the adaptive immune system, which may trigger a humoral response against the recognized microbes of the microbiota that, in turn, can reach other sites in the body and trigger a systemic disease by recognizing unrelated epitopes by molecular mimicry and a wrong immune response against them. (This figure is shown for teaching purposes).</p>
Full article ">
21 pages, 6530 KiB  
Article
Combination of Anti-CD40 and Anti-CD40L Antibodies as Co-Stimulation Blockade in Preclinical Cardiac Xenotransplantation
by Martin Bender, Jan-Michael Abicht, Bruno Reichart, Elisabeth Neumann, Julia Radan, Maren Mokelke, Ines Buttgereit, Maria Leuschen, Felicia Wall, Sebastian Michel, Reinhard Ellgass, Stig Steen, Audrius Paskevicius, Andreas Lange, Barbara Kessler, Elisabeth Kemter, Nikolai Klymiuk, Joachim Denner, Antonia W. Godehardt, Ralf R. Tönjes, Jonathan M. Burgmann, Constança Figueiredo, Anastasia Milusev, Valentina Zollet, Neda Salimi-Afjani, Alain Despont, Robert Rieben, Stephan Ledderose, Christoph Walz, Christian Hagl, David Ayares, Eckhard Wolf, Michael Schmoeckel, Paolo Brenner, Uli Binder, Michaela Gebauer, Arne Skerra and Matthias Länginadd Show full author list remove Hide full author list
Biomedicines 2024, 12(8), 1927; https://doi.org/10.3390/biomedicines12081927 - 22 Aug 2024
Cited by 2 | Viewed by 1519
Abstract
The blockade of the CD40/CD40L immune checkpoint is considered essential for cardiac xenotransplantation. However, it is still unclear which single antibody directed against CD40 or CD40L (CD154), or which combination of antibodies, is better at preventing organ rejection. For example, the high doses [...] Read more.
The blockade of the CD40/CD40L immune checkpoint is considered essential for cardiac xenotransplantation. However, it is still unclear which single antibody directed against CD40 or CD40L (CD154), or which combination of antibodies, is better at preventing organ rejection. For example, the high doses of antibody administered in previous experiments might not be feasible for the treatment of humans, while thrombotic side effects were described for first-generation anti-CD40L antibodies. To address these issues, we conducted six orthotopic pig-to-baboon cardiac xenotransplantation experiments, combining a chimeric anti-CD40 antibody with an investigational long-acting PASylated anti-CD40L Fab fragment. The combination therapy effectively resulted in animal survival with a rate comparable to a previous study that utilized anti-CD40 monotherapy. Importantly, no incidence of thromboembolic events associated with the administration of the anti-CD40L PAS-Fab was observed. Two experiments failed early because of technical reasons, two were terminated deliberately after 90 days with the baboons in excellent condition and two were extended to 120 and 170 days, respectively. Unexpectedly, and despite the absence of any clinical signs, histopathology revealed fungal infections in all four recipients. This study provides, for the first time, insights into a combination therapy with anti-CD40/anti-CD40L antibodies to block this immune checkpoint. Full article
Show Figures

Figure 1

Figure 1
<p>Dosing scheme (top) and survival (bottom) of the study group comprising six animals, which received anti-CD40 IgG4/anti-CD40L PAS-Fab combination therapy (orange). The dosage of the anti-CD40 Mab was reduced within 30 days from initially 50 to 30 mg/kg body weight (bw), and the dosage of the anti-CD40L PAS-Fab was lowered within 60 days from 20 to 10 mg/kg bw. In comparison with a previously reported [<a href="#B4-biomedicines-12-01927" class="html-bibr">4</a>] immunosuppressive regimen with the anti-CD40 Mab alone (gray), there was no significant difference in survival (Log-rank (Mantel–Cox) test, <span class="html-italic">n</span> = 10, <span class="html-italic">p</span> = 0.0896). In the current study group, two technical failures were excluded from the survival analysis. In the previously described group [<a href="#B4-biomedicines-12-01927" class="html-bibr">4</a>], two animals which were positive for PCMV/PRV were excluded. PCMV/PRV, porcine cytomegalovirus/porcine roseolovirus.</p>
Full article ">Figure 2
<p>Serum troponin T levels. Levels were high after surgery but subsequently dropped to a normal range in animals #16956, #16935 and #17012. The strong increase in serum troponin T levels in animal #17020 indicates myocardial damage due to graft rejection towards the end of the experiment.</p>
Full article ">Figure 3
<p>Plasma bilirubin (<b>a</b>), creatinine (<b>b</b>) and LDH (<b>c</b>) levels and platelet counts (<b>d</b>), non-suggestive of thrombotic microangiopathy. There were no signs of liver or kidney damage. The increase in LDH in animal #17020 at the end of the experiment was caused by humoral rejection. LDH, lactate dehydrogenase.</p>
Full article ">Figure 4
<p>Levels of non-Gal-α(1,3)-Gal xenoreactive IgM (<b>a</b>) and IgG (<b>b</b>) as measured by flow cytometry on porcine aortic endothelial cells (PAEC) from <span class="html-italic">GGTA1-KO</span>, <span class="html-italic">hCD46/hTBM</span> transgenic animals. The values from a previously investigated baboon that had rejected an intrathoracic heterotopically transplanted pig heart served as positive control (black) and showed a strong increase in both IgM and IgG, indicative of humoral rejection. Note: while animal #17020 revealed clinical and histological signs of humoral rejection, there was no increase in xenoreactive IgM and IgG.</p>
Full article ">Figure 5
<p>Cumulative pleural effusions in baboon #17012 (<b>a</b>) and serum levels of the inflammatory markers leukocytes and IL-6 (<b>b</b>), CRP (<b>c</b>) as well as the myocardial markers CK and NT-proBNP (<b>d</b>). The sharp rise in pleural effusions around postoperative day 85 was accompanied by a marked increase in all inflammatory and myocardial markers ((<b>a</b>–<b>d</b>) and <a href="#biomedicines-12-01927-f002" class="html-fig">Figure 2</a>). For comparison, at the beginning of the pleural effusions around postoperative day 30 there was only an increase in IL-6, leukocyte count (<b>b</b>) and also in troponin T levels (<a href="#biomedicines-12-01927-f002" class="html-fig">Figure 2</a>).</p>
Full article ">Figure 6
<p>Serum levels of different pro-inflammatory cytokines in all animals of the study group (<b>a</b>–<b>g</b>). The marked increase around postoperative day 85 was only observed in baboon #17012 (magenta), whereas #17020 showed elevated levels of some cytokines towards the end of the experiment, when organ rejection occurred. The sharp increase in pleural effusions around postoperative day 85 in baboon #17012 (<b>h</b>) was accompanied by a strong rise in several pro-inflammatory cytokine levels (magenta).</p>
Full article ">Figure 7
<p>Microscopic findings in post-mortem myocardial specimens. Histological analysis revealed mild-to-marked interstitial edema (arrows) in myocardial specimens of baboons #16956 (<b>a</b>), #16935 (<b>c</b>), #17012 (<b>d</b>) and #17020 (<b>f</b>,<b>h</b>). Fungal thrombi in pulmonal vessels (arrowhead) were detected in all animals (#16956, (<b>b</b>); #17012, (<b>e</b>); #17020, (<b>i</b>); not shown for #16935). Based on capillaritis (arrowhead, (<b>f</b>)), endothelial swelling (arrowhead, (<b>h</b>)) and elongated C4d staining in capillaries (arrows, (<b>g</b>)), baboon #17020 was diagnosed with severe antibody-mediated rejection (AMR3). (<b>a</b>–<b>d</b>,<b>f</b>,<b>h</b>,<b>i</b>), H&amp;E staining; (<b>e</b>), Grocott methenamine staining; (<b>g</b>), C4d staining; scale bars = 100 µm.</p>
Full article ">Figure 8
<p>Immunofluorescence staining of post-mortem myocardial specimens. Antibody deposition (IgM) (<b>a</b>), complement deposition (C3b/c, C4c, C5b) (<b>b</b>,<b>c</b>), fibrin deposition (Fgn) (<b>d</b>), cardiomyocyte structure (WGA, a lectin staining N-acetyl-D-glucosamine and sialic acid on the cell membrane) (<b>e</b>) and macrophage infiltration (CD68) (<b>f</b>) were analyzed in all donor organs. Scale bar, 100 µm. <span class="html-italic">n</span> = 4 <span class="html-italic">GGTA1-KO</span>, <span class="html-italic">hCD46/hTBM</span> transgenic pigs; <span class="html-italic">n</span> = 1 wild-type pig (control).</p>
Full article ">
17 pages, 853 KiB  
Review
Heart Transplant Rejection: From the Endomyocardial Biopsy to Gene Expression Profiling
by Anca Otilia Farcas, Mihai Ciprian Stoica, Ioana Maria Maier, Adrian Cornel Maier and Anca Ileana Sin
Biomedicines 2024, 12(8), 1926; https://doi.org/10.3390/biomedicines12081926 - 22 Aug 2024
Viewed by 1684
Abstract
Heart transplant prolongs life for patients with end-stage heart failure but rejection remains a complication that reduces long-term survival. The aim is to provide a comprehensive overview of the current status in HT rejection. EMB is an invasive diagnostic tool, consisting in the [...] Read more.
Heart transplant prolongs life for patients with end-stage heart failure but rejection remains a complication that reduces long-term survival. The aim is to provide a comprehensive overview of the current status in HT rejection. EMB is an invasive diagnostic tool, consisting in the sampling of a fragment of myocardial tissue from the right ventricular septum using fluoroscopic guidance. This tissue can later be subjected to histopathological, immunohistochemical or molecular analysis, providing valuable information for cardiac allograft rejection, but this procedure is not without complications. To increase the accuracy of the rejection diagnosis, EMB requires a systematic evaluation of endocardium, myocardium, interstitium and intramural vessels. There are three types of rejection: hyperacute, acute or chronic, diagnosed by the histopathological evaluation of EMB as well as by new diagnostic methods such as DSA, ddcfDNA and gene expression profiling, the last having a high negative predictive value. More than 50 years after the introduction of EMB in medical practice, it still remains the “gold standard” in monitoring rejection in HT recipients but other new, less invasive diagnostic methods reduce the number of EMBs required. Full article
(This article belongs to the Special Issue An Update on Transplantation Immunology)
Show Figures

Figure 1

Figure 1
<p>Artistic representation of EMB technique.</p>
Full article ">Figure 2
<p>Schematic graphic representation of the immunological basis of rejection.</p>
Full article ">
25 pages, 1287 KiB  
Review
The Impact of Adenomyosis on Pregnancy
by Panagiotis Tsikouras, Nektaria Kritsotaki, Konstantinos Nikolettos, Sonia Kotanidou, Efthymios Oikonomou, Anastasia Bothou, Sotiris Andreou, Theopi Nalmpanti, Kyriaki Chalkia, Vlasios Spanakis, Nikolaos Tsikouras, Melda Chalil, Nikolaos Machairiotis, George Iatrakis and Nikolaos Nikolettos
Biomedicines 2024, 12(8), 1925; https://doi.org/10.3390/biomedicines12081925 - 22 Aug 2024
Cited by 1 | Viewed by 2593
Abstract
Adenomyosis is characterized by ectopic proliferation of endometrial tissue within the myometrium. Histologically, this condition is marked by the presence of islands of benign endometrial glands surrounded by stromal cells. The myometrium appears thinner, and cross-sectional analysis often reveals signs of recent or [...] Read more.
Adenomyosis is characterized by ectopic proliferation of endometrial tissue within the myometrium. Histologically, this condition is marked by the presence of islands of benign endometrial glands surrounded by stromal cells. The myometrium appears thinner, and cross-sectional analysis often reveals signs of recent or chronic hemorrhage. The ectopic endometrial tissue may respond to ovarian hormonal stimulation, exhibiting proliferative or secretory changes during the menstrual cycle, potentially leading to bleeding, uterine swelling, and pain. Adenomyosis can appear as either a diffuse or focal condition. It is crucial to understand that adenomyosis involves the infiltration of the endometrium into the myometrium, rather than its displacement. The surgical management of adenomyosis is contingent upon its anatomical extent. The high incidence of the disease and the myths that develop around it increase the need to study its characteristics and its association with pregnancy and potential obstetric complications. These complications often require quick decisions, appropriate diagnosis, and proper counseling. Therefore, knowing the possible risks associated with adenomyosis is key to decision making. Pregnancy has a positive effect on adenomyosis and its painful symptoms. This improvement is not only due to the inhibition of ovulation, which inhibits the bleeding of adenomyotic tissue, but also to the metabolic, hormonal, immunological, and angiogenic changes associated with pregnancy. Adenomyosis affects pregnancy through disturbances of the endocrine system and the body’s immune response at both local and systemic levels. It leads to bleeding from the adenomyotic tissue, molecular and functional abnormalities of the ectopic endometrium, abnormal placentation, and destruction of the adenomyotic tissue due to changes in the hormonal environment that characterizes pregnancy. Some of the obstetric complications that occur in women with adenomyosis in pregnancy include miscarriage, preterm delivery, placenta previa, low birth weight for gestational age, obstetric hemorrhage, and the need for cesarean section. These complications are an understudied field and remain unknown to the majority of obstetricians. These pathological conditions pose challenges to both the typical progression of pregnancy and the smooth conduct of labor in affected women. Further multicenter studies are imperative to validate the most suitable method for concluding labor following surgical intervention for adenomyosis. Full article
(This article belongs to the Special Issue Advanced Research in Endometriosis 4.0)
Show Figures

Figure 1

Figure 1
<p>KRAS signaling pathways. KRAS pathway is activated by a receptor tyrosine kinase and regulates the intracellular pathways of mTOR, ERK and NF-kB. GAP: GTPase activating proteins; GEF: guanine-nucleotide exchange factors.</p>
Full article ">Figure 2
<p>Theories explaining the origin of adenomyosis.</p>
Full article ">Figure 3
<p>Mechanisms that redound adenomyosis in negative pregnancy outcomes.</p>
Full article ">
16 pages, 3800 KiB  
Article
miRNA Profiles in Patients with Hematological Malignancy at Different Stages of the Disease: A Preliminary Study
by Jood Hashem, Lujain Alkhalaileh, Hassan Abushukair and Mahmoud Ayesh
Biomedicines 2024, 12(8), 1924; https://doi.org/10.3390/biomedicines12081924 - 22 Aug 2024
Viewed by 1503
Abstract
The dysregulation of miRNA expression has been shown to impact cellular physiology and tumorigenesis. Studies have reported several miRNA regulatory elements and pathways that play a significant role in the diagnosis, prognosis, and treatment of hematological malignancies. This is the first study to [...] Read more.
The dysregulation of miRNA expression has been shown to impact cellular physiology and tumorigenesis. Studies have reported several miRNA regulatory elements and pathways that play a significant role in the diagnosis, prognosis, and treatment of hematological malignancies. This is the first study to test the differential expression of miRNAs at crucial stages of the disease, specifically newly diagnosed, resistant to treatment, and remission. Circulating miRNAs extracted from the blood samples of 18 patients diagnosed with leukemia or lymphoma at different stages and 2 healthy controls were quantified by qPCR using a panel of 96 tumorigenic miRNAs. An enrichment analysis was performed to understand the mechanisms through which differential miRNA expression affects cellular and molecular functions. Significant upregulation of hsa-miR-1, hsa-miR-20a-5p, hsa-miR-23a-3p, hsa-miR-92b3p, and hsa-miR-196a-5p was detected among the different stages of leukemia and lymphoma. mir-1 and mir-196a-5p were upregulated in the remission stage of leukemia, while mir-20a-5p, mir-23a-3p, and mir-92b-3p were upregulated during the resistant stage of lymphoma. The enrichment analysis revealed these miRNAs’ involvement in the RAS signaling pathway, TGF-β signaling, and apoptotic pathways, among others. This study highlights new biomarkers that could be used as potential targets for disease diagnosis, prognosis, and treatment, therefore enhancing personalized treatments and survival outcomes for patients. Full article
(This article belongs to the Section Molecular Genetics and Genetic Diseases)
Show Figures

Figure 1

Figure 1
<p>Heatmap showing hierarchical clustering of differential expression patterns of miRNAs between different stages in (<b>A</b>) leukemia and (<b>B</b>) lymphoma samples.</p>
Full article ">Figure 2
<p>Box plots representing the different ΔCT values at ND, Rem, and Res stages for multiple differentially expressed miRNAs in leukemia and lymphoma samples. Significance was defined as a fold change ≥ 2 or ≤0.5 with a <span class="html-italic">p</span>-value &lt; 0.1. Five miRNAs met these criteria, all of them upregulated. (<b>A</b>) Upregulation of mir-1 in the Rem stage compared to the ND and Res stages in patients with leukemia. (<b>B</b>) Upregulation of mir-196a-5p in the Rem stage compared to the ND and Res stages in patients with leukemia. (<b>C</b>) Upregulation of mir-20a-5p in the Res stage compared to the ND and Rem stages in patients with lymphoma. (<b>D</b>) Upregulation of mir-23a-3p in the Res stage compared to the Rem stage and upregulation in the ND stage compared to the Rem and Res stages in patients with lymphoma. (<b>E</b>) Upregulation of mir-92b-3p in the Res stage compared to the ND and Rem stages and an upregulation in the ND compared to Rem stage in patients with lymphoma.</p>
Full article ">Figure 3
<p>Gene ontology enrichment analysis results for five miRNAs in leukemia and lymphoma. (<b>A</b>) miR-1; (<b>B</b>) miR-196-5p; (<b>C</b>) miR-20a-5p; (<b>D</b>) miR-23a-3p; (<b>E</b>) miR-92b-3p. Biological process, cellular component, and molecular function terms are shown on the <span class="html-italic">Y</span>-axis, and the <span class="html-italic">X</span>-axis represents the fold enrichment score for each term.</p>
Full article ">Figure 4
<p>Bubble plots demonstrating enriched KEGG pathways for the five miRNAs in leukemia and in lymphoma. <span class="html-italic">Y</span>-axis represents the pathways that were associated with the miRNAs’ target genes, and the <span class="html-italic">X</span>-axis represents the fold enrichment score for each term. The bigger the size of the dot, the greater the degree of pathway enrichment. The red color indicates a lower chance of error, so higher confidence in the results. (<b>A</b>) miR-1 in leukemia significantly impacts the cell cycle, among other pathways. (<b>B</b>) miR-196a-5p in leukemia majorly impacts the RAS signaling pathway, among others. (<b>C</b>) miR-20a-5p in lymphoma significantly impacts the TGF–β signaling pathway, among others. (<b>D</b>) miR-23a-3p in lymphoma significantly impacts the TNF signaling pathway, among others. (<b>E</b>) miR-92b-3p in lymphoma significantly impacts the RNA degradation and apoptosis pathways, among others.</p>
Full article ">
23 pages, 12660 KiB  
Article
Optimizing Cardiomyocyte Differentiation: Comparative Analysis of Bone Marrow and Adipose-Derived Mesenchymal Stem Cells in Rats Using 5-Azacytidine and Low-Dose FGF and IGF Treatment
by Ahmed Farag, Sai Koung Ngeun, Masahiro Kaneda, Mohamed Aboubakr and Ryou Tanaka
Biomedicines 2024, 12(8), 1923; https://doi.org/10.3390/biomedicines12081923 - 22 Aug 2024
Cited by 4 | Viewed by 1592
Abstract
Mesenchymal stem cells (MSCs) exhibit multipotency, self-renewal, and immune-modulatory properties, making them promising in regenerative medicine, particularly in cardiovascular treatments. However, optimizing the MSC source and induction method of cardiac differentiation is challenging. This study compares the cardiomyogenic potential of bone marrow (BM)-MSCs [...] Read more.
Mesenchymal stem cells (MSCs) exhibit multipotency, self-renewal, and immune-modulatory properties, making them promising in regenerative medicine, particularly in cardiovascular treatments. However, optimizing the MSC source and induction method of cardiac differentiation is challenging. This study compares the cardiomyogenic potential of bone marrow (BM)-MSCs and adipose-derived (AD)-MSCs using 5-Azacytidine (5-Aza) alone or combined with low doses of Fibroblast Growth Factor (FGF) and Insulin-like Growth Factor (IGF). BM-MSCs and AD-MSCs were differentiated using two protocols: 10 μmol 5-Aza alone and 10 μmol 5-Aza with 1 ng/mL FGF and 10 ng/mL IGF. Morphological, transcriptional, and translational analyses, along with cell viability assessments, were performed. Both the MSC types exhibited similar morphological changes; however, AD-MSCs achieved 70–80% confluence faster than BM-MSCs. Surface marker profiling confirmed CD29 and CD90 positivity and CD45 negativity. The differentiation protocols led to cell flattening and myotube formation, with earlier differentiation in AD-MSCs. The combined protocol reduced cell mortality in BM-MSCs and enhanced the expression of cardiac markers (MEF2c, Troponin I, GSK-3β), particularly in BM-MSCs. Immunofluorescence confirmed cardiac-specific protein expression in all the treated groups. Both MSC types exhibited the expression of cardiac-specific markers indicative of cardiomyogenic differentiation, with the combined treatment showing superior efficiency for BM-MSCs. Full article
(This article belongs to the Special Issue In Vitro Models of Cardiovascular Diseases and Toxicity)
Show Figures

Figure 1

Figure 1
<p>Experimental design. BM-MSCs, bone marrow mesenchymal stem cells; AD-MSCs, adipose tissue mesenchymal stem cells; AZA, 5-Azacytidine.</p>
Full article ">Figure 2
<p>Morphology of plastic-adherent mesenchymal stem cell (MSC) cultures: (<b>A</b>) Bone marrow-derived MSCs (BM-MSCs) at day 1 and (<b>B</b>) at passage 4. (<b>C</b>) Adipose tissue-derived MSCs (AD-MSCs) at day 1 and (<b>D</b>) at passage 4. By passage 4, both BM-MSCs and AD-MSCs displayed a uniform population of spindle-shaped cells. The scale bar represents 500 µm.</p>
Full article ">Figure 3
<p>Expression of cell surface markers in passage 4 cells derived from bone marrow and adipose tissue: (<b>A</b>,<b>B</b>) Representative histograms showing the expression of surface markers: CD29 and CD90 (positive expression), and CD45 (negative expression). (<b>C</b>) The percentage values of cell surface markers’ expression are presented. No significant differences were observed in the expression levels of markers between BM-MSCs and AD-MSCs.</p>
Full article ">Figure 3 Cont.
<p>Expression of cell surface markers in passage 4 cells derived from bone marrow and adipose tissue: (<b>A</b>,<b>B</b>) Representative histograms showing the expression of surface markers: CD29 and CD90 (positive expression), and CD45 (negative expression). (<b>C</b>) The percentage values of cell surface markers’ expression are presented. No significant differences were observed in the expression levels of markers between BM-MSCs and AD-MSCs.</p>
Full article ">Figure 4
<p>Multi-lineage differentiation of BM-MSCs and AD-MSCs: (i) Adipogenic differentiation is evidenced by positive Oil Red O staining, showing lipid granules in differentiated MSCs (<b>b</b>,<b>d</b>) compared to undifferentiated cells (<b>a</b>,<b>c</b>). (ii) Chondrogenic differentiation is confirmed by positive Alcian Blue staining, highlighting highly sulfated proteoglycans in differentiated MSCs (<b>f</b>,<b>h</b>) versus undifferentiated cells (<b>e</b>,<b>g</b>). (iii) Osteogenic differentiation is validated by positive Alizarin Red S staining in differentiated MSCs (<b>j</b>,<b>l</b>) compared to undifferentiated cells (<b>i</b>,<b>k</b>). The scale bar represents 100 μm.</p>
Full article ">Figure 5
<p>RT-PCR analysis of pluripotency and immunomodulatory gene expression in BM-MSCs and AD-MSCs at passage 4 (<span class="html-italic">n</span> = 4): The genes <span class="html-italic">Oct4</span>, <span class="html-italic">Nanog</span>, and <span class="html-italic">Sox2</span> showed negative expression, while <span class="html-italic">Rex-1</span>, <span class="html-italic">TGFB1</span>, and <span class="html-italic">IL-6</span> were positively expressed in both cell types. <span class="html-italic">β-actin</span> was used as an internal control.</p>
Full article ">Figure 6
<p>Morphology of BM-MSCs and AD-MSCs after cardiomyogenic differentiation: Yellow arrowheads indicate the appearance of binucleation, while green arrowheads highlight striations and myotube-like arrangements. Scale bar: 200 μm.</p>
Full article ">Figure 7
<p>(<b>A</b>) Live/dead cell staining of BM-MSCs and AD-MSCs after 7 days of culture in various experimental groups: Living cells are indicated by green fluorescence, while dead cells are indicated by red fluorescence. Scale bar: 100 μm. (<b>B</b>) Cell viability was calculated as the percentage of green cells relative to the total number of cells. Statistical significance is indicated as follows: ns (non-significant, <span class="html-italic">p</span> &gt; 0.05), * <span class="html-italic">p</span> &lt; 0.05, ** <span class="html-italic">p</span> &lt; 0.01, and *** <span class="html-italic">p</span> &lt; 0.001 compared with the control groups.</p>
Full article ">Figure 8
<p>RT-qPCR analysis of gene expression levels in induced BM-MSCs and AD-MSCs: The expression levels of <span class="html-italic">MEF2c</span>, <span class="html-italic">Troponin I</span>, and <span class="html-italic">GSK-3β</span> are shown across different study groups. Statistical significance is indicated as follows: ns, non-significant <span class="html-italic">p</span>  &gt;  0.05, * <span class="html-italic">p</span>  &lt;  0.05, ** <span class="html-italic">p</span>  &lt;  0.01, *** <span class="html-italic">p</span>  &lt;  0.001, and **** <span class="html-italic">p</span>  &lt;  0.0001.</p>
Full article ">Figure 9
<p>Immunofluorescence staining of cardiomyocyte-specific proteins. Detection of cells positive for Anti-Cardiac Troponin T (cTnT), alpha Actinin 2 (α-Actinin), and Myosin Heavy Chain 1 (MHC) using immunofluorescence microscopy. Scale bar: 100 μm.</p>
Full article ">
11 pages, 610 KiB  
Article
Exploring Vitamin D Deficiency and IGF Axis Dynamics in Colorectal Adenomas
by George Ciulei, Olga Hilda Orășan, Angela Cozma, Vasile Negrean, Teodora Gabriela Alexescu, Simina Țărmure, Florin Eugen Casoinic, Roxana Liana Lucaciu, Adriana Corina Hangan and Lucia Maria Procopciuc
Biomedicines 2024, 12(8), 1922; https://doi.org/10.3390/biomedicines12081922 - 22 Aug 2024
Viewed by 1029
Abstract
(1) Colorectal cancer is a major cause of cancer-related death, with colorectal adenomas (CRAs) serving as precursors. Identifying risk factors such as vitamin D deficiency and the insulin-like growth factor (IGF) axis is crucial for prevention. (2) This case–control study included 85 participants [...] Read more.
(1) Colorectal cancer is a major cause of cancer-related death, with colorectal adenomas (CRAs) serving as precursors. Identifying risk factors such as vitamin D deficiency and the insulin-like growth factor (IGF) axis is crucial for prevention. (2) This case–control study included 85 participants (53 CRA patients and 32 controls) who underwent colonoscopy. We measured serum vitamin D3 (cholecalciferol), calcidiol (vitamin D metabolite), calcitriol (active vitamin D metabolite), insulin-like growth factor-1 (IGF-1), and insulin-like growth factor binding protein-3 (IGFBP-3) to explore their associations with CRA risk. (3) Results: We found that lower cholecalciferol levels were a significant risk factor for CRA (OR = 4.63, p = 0.004). Although no significant differences in calcidiol and calcitriol levels were observed between CRA patients and controls, calcidiol deficiency was common in the study population. IGF-1 levels inversely correlated with age, calcitriol, and IGFBP-3 in CRA patients. (4) This study highlights the potential of lower cholecalciferol levels to detect patients at risk of CRA when calcidiol values cannot, suggesting the importance of evaluating different vitamin D metabolites in cancer prevention research. Our findings underscore the need to further investigate the interactions between calcitriol, the active form of vitamin D, and the IGF axis in colorectal cancer development. Full article
Show Figures

Figure 1

Figure 1
<p>Correlation between IGF-1 and IGFBP-3 serum levels in the CRA<sup>3</sup> group, Spearman’s r coefficient, <span class="html-italic">p</span> value, and a simple linear regression line. <sup>1</sup> IGFBP-3—insulin-like growth factor binding protein-3; <sup>2</sup> IGF-1—insulin-like growth factor-1; <sup>3</sup> CRA—colorectal adenoma.</p>
Full article ">Figure 2
<p>Correlation between IGF-1 and IGFBP-3 serum levels in the control group, Spearman’s r coefficient, <span class="html-italic">p</span> value, and a simple linear regression line. <sup>1</sup> IGFBP-3—insulin-like growth factor binding protein-3; <sup>2</sup> IGF-1—insulin-like growth factor-1.</p>
Full article ">
16 pages, 2176 KiB  
Article
Therapeutic Potential of a Biodynamic Supplement on Skin Pressure Ulcers: A Randomized Clinical Study
by Pasquale Ferorelli, Manfred Doepp, Stefano Lenzi, Roberto Rovelli, Gennaro Gisonna, Giuseppe Maierà, Francesco Antonelli, Massimo Radaelli, Anna Shevchenko, Giordana Feriotto, Carlo Mischiati, Ilaria Borromeo and Simone Beninati
Biomedicines 2024, 12(8), 1918; https://doi.org/10.3390/biomedicines12081918 - 22 Aug 2024
Viewed by 1597
Abstract
Pressure ulcers (PUs) are a debilitating and often painful condition. They are localized lesions on the skin and/or underlying tissues and are common in the elderly, people with mobility difficulties, diabetics, and vascular disease or malnutrition, as well as in those requiring intensive [...] Read more.
Pressure ulcers (PUs) are a debilitating and often painful condition. They are localized lesions on the skin and/or underlying tissues and are common in the elderly, people with mobility difficulties, diabetics, and vascular disease or malnutrition, as well as in those requiring intensive or palliative care. The prevention and treatment of PUs involve strategies to optimize hydration, circulation, and nutrition. Nutrition plays a key role in pressure ulcer care because wounds require macronutrients and micronutrients to heal. Reports relating to the effectiveness of “Complementary Enzyme Therapy” also in the vulnological field led us to this study, the aim of which was to test the activity of a biodynamic food supplement (Citozym®) rich in carbohydrates, vitamins, and amylase and lactase and characterized by marked antioxidant activity. Citozym® administered topically and/or systemically, and in particular in both administrations, in patients suffering from Pus, has shown a marked reduction in bedsores and, in many cases, complete healing. Furthermore, it was possible to observe a lower incidence of side effects compared to conventional therapies. The results obtained, confirmed by various tests and recognized by the scientific community, allow us to conclude that treatment with Citozym® could represent a new and effective strategy for the treatment of PUs. Full article
Show Figures

Figure 1

Figure 1
<p>Presence of pathologies (diabetes, hypertension, and overweight) and dependencies (smoking and alcohol) related to the patients in the study groups (control, topic, systemic, and topic + systemic). Data are expressed as % over the total number of patients (<span class="html-italic">n</span> = 20) in each group.</p>
Full article ">Figure 2
<p>Variation in wound contraction during the planned treatments. The reduction in the wound area (cm<sup>2</sup>) indicates the speed of re-epithelialization of the wound. Data are expressed as mean ± SD (<span class="html-italic">n</span> = 20). One-way analysis of variance (ANOVA) was performed with Past 4.15. Significant differences within the same group (<span class="html-italic">p</span> &lt; 0.05; ANOVA and Tukey–Kramer test) are reported with different letters in the column. All analyses were considered significant at <span class="html-italic">p</span> &lt; 0.05 within each treatment group. When comparing the control to the topic, systemic, and topic+systemic groups, the significance was *** <span class="html-italic">p</span> &lt; 0.001; * <span class="html-italic">p</span> &lt; 0.05.</p>
Full article ">Figure 3
<p>Representative photographic images of a reduction in PU in a 77-year-old patient treated with Citozym<sup>®</sup> using the topical/systemic combination (1–4) and in a 67-year-old patient treated with topical therapy alone (5–8). Note the incomplete reduction in the wound in the exclusively topical treatment (photo 8) and the complete closure in the combined topical + systemic treatment (photo 4).</p>
Full article ">Figure 4
<p>The reduction in the ulcer area treated with combined therapy for 60 days. Representative photographic images of pressure ulcer reduction in a 57-year-old diabetic patient treated with Citozym<sup>®</sup> using the topical/systemic combination. (Note the more complete partial but sterile closure in the combined topical + systemic treatment).</p>
Full article ">Figure 5
<p>Reduction in pressure ulcer area treated with combined therapy for approximately 60 days. Representative photographic images of the reduction in PU in a 77-year-old diabetic patient treated with Citozym<sup>®</sup>, using the topical/systemic combination. The wound was reduced by approximately 75%.</p>
Full article ">Figure 6
<p>Reduction in the area of PU in the foot treated with combined therapy for 60 days. Representative photographic images of pressure ulcer reduction in a 78-year-old patient treated with Citozym<sup>®</sup>, using the topical/systemic combination. The wound was reduced by approximately 85%.</p>
Full article ">Figure 7
<p>PUSH test tool derived from the collection of parameters indicated on patients examined and treated as described in the Methods section. The length-by-width data were obtained from the estimate of the surface area in cm<sup>2</sup>. The evaluation of exudates was performed after dressing and before applying any topical agent to the wound. Asterisks indicate significant values with respect to control untreated ulcers (<span class="html-italic">p</span> &lt; 0.05).</p>
Full article ">Figure 8
<p>QL tests obtained by collecting the experience of patients subjected to the therapies indicated in the Methods section. Each parameter in the graph corresponds to the percentage of survey responses after therapy. The answers, although subjective and linked to the patient’s sensitivity, can represent the intrinsic value of the well-being achieved by the patient following the therapy.</p>
Full article ">
30 pages, 1235 KiB  
Review
Xenografting Human Musculoskeletal Sarcomas in Mice, Chick Embryo, and Zebrafish: How to Boost Translational Research
by Veronica Giusti, Giacomo Miserocchi, Giulia Sbanchi, Micaela Pannella, Claudia Maria Hattinger, Marilena Cesari, Leonardo Fantoni, Ania Naila Guerrieri, Chiara Bellotti, Alessandro De Vita, Chiara Spadazzi, Davide Maria Donati, Monica Torsello, Enrico Lucarelli, Toni Ibrahim and Laura Mercatali
Biomedicines 2024, 12(8), 1921; https://doi.org/10.3390/biomedicines12081921 - 21 Aug 2024
Cited by 2 | Viewed by 1126
Abstract
Musculoskeletal sarcomas pose major challenges to researchers and clinicians due to their rarity and heterogeneity. Xenografting human cells or tumor fragments in rodents is a mainstay for the generation of cancer models and for the preclinical trial of novel drugs. Lately, though, technical, [...] Read more.
Musculoskeletal sarcomas pose major challenges to researchers and clinicians due to their rarity and heterogeneity. Xenografting human cells or tumor fragments in rodents is a mainstay for the generation of cancer models and for the preclinical trial of novel drugs. Lately, though, technical, intrinsic and ethical concerns together with stricter regulations have significantly curbed the employment of murine patient-derived xenografts (mPDX). In alternatives to murine PDXs, researchers have focused on embryonal systems such as chorioallantoic membrane (CAM) and zebrafish embryos. These systems are time- and cost-effective hosts for tumor fragments and near-patient cells. The CAM of the chick embryo represents a unique vascularized environment to host xenografts with high engraftment rates, allowing for ease of visualization and molecular detection of metastatic cells. Thanks to the transparency of the larvae, zebrafish allow for the tracking of tumor development and metastatization, enabling high-throughput drug screening. This review will focus on xenograft models of musculoskeletal sarcomas to highlight the intrinsic and technically distinctive features of the different hosts, and how they can be exploited to elucidate biological mechanisms beneath the different phases of the tumor’s natural history and in drug development. Ultimately, the review suggests the combination of different models as an advantageous approach to boost basic and translational research. Full article
(This article belongs to the Topic Animal Models of Human Disease 2.0)
Show Figures

Graphical abstract

Graphical abstract
Full article ">Figure 1
<p>Methodologies and applications of CDXs and PDXs in the different hosts. Each figure reports a timeline of xenografting experiment, including technical details and downstream applications. (<b>A</b>) mice; (<b>B</b>) chick embryo; (<b>C</b>) zebrafish larvae. Timeline specifications: M: months; EDD: egg development days; dpf: days post-fertilization.</p>
Full article ">Figure 2
<p>Comparison of CDXs and PDXs in the different hosts. The table highlights the limits and potentialities of xenograft in mouse, chick embryo, and zebrafish larvae.</p>
Full article ">
21 pages, 6758 KiB  
Article
NeuroAiDTM-II (MLC901) Promoted Neurogenesis by Activating the PI3K/AKT/GSK-3β Signaling Pathway in Rat Spinal Cord Injury Models
by Anam Anjum, Muhammad Dain Yazid, Muhammad Fauzi Daud, Jalilah Idris, Angela Min Hwei Ng, Amaramalar Selvi Naicker, Ohnmar Htwe Rashidah Ismail, Ramesh Kumar Athi Kumar and Yogeswaran Lokanathan
Biomedicines 2024, 12(8), 1920; https://doi.org/10.3390/biomedicines12081920 - 21 Aug 2024
Viewed by 1187
Abstract
Traumatic damage to the spinal cord (SCI) frequently leads to irreversible neurological deficits, which may be related to apoptotic neurodegeneration in nerve tissue. The MLC901 treatment possesses neuroprotective and neuroregenerative activity. This study aimed to explore the regenerative potential of MLC901 and the [...] Read more.
Traumatic damage to the spinal cord (SCI) frequently leads to irreversible neurological deficits, which may be related to apoptotic neurodegeneration in nerve tissue. The MLC901 treatment possesses neuroprotective and neuroregenerative activity. This study aimed to explore the regenerative potential of MLC901 and the molecular mechanisms promoting neurogenesis and functional recovery after SCI in rats. A calibrated forceps compression injury for 15 s was used to induce SCI in rats, followed by an examination of the impacts of MLC901 on functional recovery. The Basso, Beattie, and Bresnahan (BBB) scores were utilized to assess neuronal functional recovery; H&E and immunohistochemistry (IHC) staining were also used to observe pathological changes in the lesion area. Somatosensory Evoked Potentials (SEPs) were measured using the Nicolet® Viking Quest™ apparatus. Additionally, we employed the Western blot assay to identify PI3K/AKT/GSK-3β pathway-related proteins and to assess the levels of GAP-43 and GFAP through immunohistochemistry staining. The study findings revealed that MLC901 improved hind-limb motor function recovery, alleviating the pathological damage induced by SCI. Moreover, MLC901 significantly enhanced locomotor activity, SEPs waveform, latency, amplitude, and nerve conduction velocity. The treatment also promoted GAP-43 expression and reduced reactive astrocytes (GFAP). MLC901 treatment activated p-AKT reduced p-GSK-3β expression levels and showed a normalized ratio (fold changes) relative to β-tubulin. Specifically, p-AKT exhibited a 4-fold increase, while p-GSK-3β showed a 2-fold decrease in T rats compared to UT rats. In conclusion, these results suggest that the treatment mitigates pathological tissue damage and effectively improves neural functional recovery following SCI, primarily by alleviating apoptosis and promoting neurogenesis. The underlying molecular mechanism of this treatment mainly involves the activation of the PI3K/AKT/GSK-3β pathway. Full article
(This article belongs to the Special Issue Spinal Cord Compression: Molecular, Cellular and Therapeutic Aspects)
Show Figures

Figure 1

Figure 1
<p>Diagrammatic representation of the step-by-step procedure for creating a mechanical spinal cord injury (SCI) model using the calibrated forceps compression method. (<b>a</b>) Sublime Animal Position: The animal is positioned in a prone orientation on the surgical table, ensuring stability and access to the spinal region. (<b>b</b>) Marking T10, T12, and T13 vertebra: Identification of the vertebrae to be targeted and marked for precise surgical intervention. (<b>c</b>) subcutaneous cut: An incision is made through the skin to gain access to the underlying tissues. (<b>d</b>) Removing Muscles: The overlying muscles are carefully removed to expose the spinal column while minimizing damage to surrounding tissues. (<b>e</b>) Exposing Spinal Cord: The spinal column is accessed, providing visibility to the spinal cord. (<b>f</b>) Removing T12 Vertebrae: The T12 vertebra is removed to allow direct compression of the spinal cord. (<b>g</b>) Compression of the Spinal Cord for 15 Sec: The spinal cord is compressed using calibrated forceps for a precise duration to induce injury, the blue box indicates spinal cord exposure and the compression site. (<b>h</b>) Wound Closing (Suture of Tissue and Skin): The surgical wound is closed with sutures, including tissue layers and skin, to complete the procedure, <span class="html-italic">n</span> = 6: Indicates the number of animals used for this procedure.</p>
Full article ">Figure 2
<p>Health evaluation after compression injury. (<b>a</b>) Changes in body weight following spinal cord injury: Injured rats initially lost more body weight on Days 3 and 7 than sham (H) rats, but later began gaining weight. Treated (T) rats lost less weight compared to untreated (UT) animals on Days 3 and 7 (mean ± standard deviation [SD]; one-way analysis of variance [ANOVA] with post hoc test, * <span class="html-italic">p</span> &lt; 0.05, ** <span class="html-italic">p</span> &lt; 0.01) (<span class="html-italic">n</span> = 6). (<b>b</b>) Urine volume per void: Manual bladder voiding by the experimenter was required for 1 week (Day 7) post-SCI, after which spontaneous recovery began. No significant difference was observed between UT and T rats. Data were analyzed using Student’s <span class="html-italic">t</span>-test for non-parametric and unpaired comparisons (<span class="html-italic">n</span> = 6). (<b>c</b>) Length of the incision area: The length of the incision area was measured up to Day 28 post-injury. Wound recovery continued until Day 28, with no significant difference observed between UT and T rats. Data were analyzed using Student’s <span class="html-italic">t</span>-test for unpaired comparisons (<span class="html-italic">n</span> = 6).</p>
Full article ">Figure 3
<p>Assessment of locomotor function following MLC901 treatment (<b>a</b>) Basso, Beattie, and Bresnahan (BBB) scores, (<b>b</b>) distance traveled in the open field test (OFT), (<b>c</b>) performance in the running wheel test, (<b>d</b>) grid walk assessment, (<b>e</b>) grid distance traveled, (<b>f</b>) inverted grid (grip strength test), (<b>g</b>) total number of footsteps taken, and (<b>h</b>) fore- and hind-limb faults. Assessments were conducted on Day 0 (pre-injury) and Days 3, 7, 14, 21, and 28 post-injuries. Data are presented as means with error bars indicating the standard error of the mean (<span class="html-italic">n</span> = 6). Statistical analysis was performed using one-way ANOVA followed by post hoc tests. Treated (T) rats demonstrated significant recovery and improvement compared to controls. Statistical significance is indicated as * <span class="html-italic">p</span> &lt; 0.05, ** <span class="html-italic">p</span> &lt; 0.01, and *** <span class="html-italic">p</span> &lt; 0.001 for comparisons among the three groups (sham [H], treated [T], and untreated [UT]).</p>
Full article ">Figure 4
<p>Somatosensory Evoked Potential (SEP) Analysis. (<b>a</b>) Waveform: SEPs were obtained by stimulating the left hindlimb in sham (H), untreated (UT), and treated (T) rats with moderate compression injury on Day 0 (pre-injury), Day 14, and Day 28 post-injury. The waveform data show the characteristic peaks and changes over time. (<b>b</b>) Amplitude: Amplitude of SEPs was significantly reduced in UT rats compared to sham controls, with treated (T) rats showing a significant improvement. Statistical significance (<span class="html-italic">p</span> &lt; 0.05) was observed between UT and T rats on Day 14 and Day 28. (<b>c</b>) Latency: The latency period of SEPs was significantly increased in injured rats compared to sham controls, with no significant differences between UT and T rats at Days 14 and 28. (<b>d</b>) Duration: The duration of SEPs, inversely related to nerve conduction velocity, was longer in UT rats compared to T rats. No significant differences were found between groups at Days 14 and 28. Data are expressed as mean ± standard deviation (SD) and were analyzed using one-way analysis of variance (ANOVA) followed by post hoc tests (<span class="html-italic">n</span> = 6). Statistical significance is indicated by * <span class="html-italic">p</span> &lt; 0.05.</p>
Full article ">Figure 5
<p>Histological analysis of spinal cord: (<b>a</b>) Transverse Section: Transverse spinal cord sections stained with hematoxylin and eosin (H&amp;E) at 4 weeks post-injury. This view highlights the extent of tissue damage and demyelination in untreated (UT), treated (T), and sham (H) rats. Images are captured at 4× magnification with a scale bar of 500 µm. Significant differences in tissue integrity and lesion characteristics are evident between groups. Sham (H) rats show normal spinal cord morphology, while UT rats display extensive tissue damage and large cystic cavities. Treated (T) rats show reduced lesion size and less severe tissue degeneration compared to UT rats. (<b>b</b>) Longitudinal Section: Longitudinal spinal cord sections stained with H&amp;E, provide a detailed view of demyelination and histopathological features across the length of the injury. Images are taken at 10× magnification with a scale bar of 500 µm. Similar to the transverse sections, UT rats exhibit pronounced tissue loss and hemorrhagic foci, while T rats demonstrate reduced tissue damage and smaller lesions. Sham (H) rats present with normal spinal cord structure. (<b>c</b>) Relative Tissue Loss: Quantitative analysis of tissue loss in the center of the lesion, normalized to spinal cord sections from sham (H) rats without lesions. Bars represent the means and standard deviation (SD) of tissue loss measurements. Significant differences are observed between treatment groups, with T rats showing less tissue loss compared to UT rats (<span class="html-italic">p</span> &lt; 0.05). Data were analyzed by one-way analysis of variance (ANOVA) with the Dunnett post hoc test. (<b>d</b>) Lesion Size: Measurement of lesion size in the center of the injury site, comparing untreated (UT), treated (T), and sham (H) rats. Bars represent the means and standard deviation (SD) of lesion size measurements. Statistical Significance: Significant reduction in lesion size in T rats compared to UT rats (<span class="html-italic">p</span> &lt; 0.05 *). Data were analyzed using one-way ANOVA with the Dunnett post hoc test. These findings confirm that MLC901 treatment effectively mitigates spinal cord damage and supports tissue repair following mechanical compression injury.</p>
Full article ">Figure 6
<p>Comparison of GAP-43 and GFAP expression 28 days post-compression spinal cord injury with MLC901 treatment. (<b>a</b>,<b>b</b>) GAP-43 Expression: Immunofluorescence staining revealed that the intensity of Growth-associated protein 43 (GAP-43, green) was significantly higher in MLC901-treated (T) rats compared to untreated (UT) rats 28 days post-injury ((<b>a</b>,<b>b</b>); <span class="html-italic">p</span> &lt; 0.05 *). This increased GAP-43 immunoreactivity indicates enhanced neurogenesis and axonal growth in the T group. (<b>c</b>,<b>d</b>) GFAP Expression: Conversely, the intensity of Glial fibrillary acidic protein (GFAP, red) immunoreactivity was notably lower in the T rats compared to the UT rats ((<b>c</b>,<b>d</b>); <span class="html-italic">p</span> &lt; 0.05 *). Reduced GFAP staining suggests that MLC901 treatment effectively mitigates astrocytic scar formation and inflammation, contributing to a more favorable environment for neuroprotection and recovery. Nuclei Staining: Nuclei are stained with DAPI (blue), which helps to visualize cell bodies in the spinal cord sections. The higher magnification images (20×) on the right side of the figures showed morphological changes and detailed regions of demyelination with double staining for GAP-43-DAPI and GFAP-DAPI, highlighting the distinct areas of neurogenesis and astrocytic response. Scale bars are 1000 µm and 100 µm, providing context for the images’ magnification. Data are expressed as mean ± standard deviation (SD). Statistical significance was determined using Student’s <span class="html-italic">t</span>-test (<span class="html-italic">n</span> = 6). Significance is indicated as * <span class="html-italic">p</span> &lt; 0.05. These findings support that MLC901 treatment enhances neurogenesis while reducing astrocytic scar formation, contributing to improved functional recovery following spinal cord injury.</p>
Full article ">Figure 7
<p>MLC901 activated the PI3K/AKT/GSK-3β signaling pathway. (<b>a</b>) Western Blot Analysis: To assess the relative expression levels of p-AKT, AKT, p-GSK-3β, and GAP-43 proteins in spinal cord tissues from sham (H), treated (T), and untreated (UT) rats with β-Tubulin as a loading control. (<b>b</b>) Mean Fluorescence Intensity (MFI): To measure the expression levels of p-AKT/AKT, p-GSK-3β, and GAP-43 (neurogenesis marker) in spinal cord tissues of sham (H), treated (T), and untreated (UT) rats. (i) p-AKT/AKT Ratio: T rats showed higher expression compared to UT rats, indicating enhanced activation of the PI3K/AKT pathway. (ii) p-GSK-3β expression: UT rats showed higher expression compared to T rats, suggesting that MLC901 treatment inhibits GSK-3β activity and reduces apoptosis. (iii) GAP-43 Expression: Significantly higher expression in T rats compared to UT rats (<span class="html-italic">p</span> &lt; 0.05), indicating that MLC901 promotes neurogenesis. Statistical Analysis: Data are presented as mean ± standard deviation (SD) (<span class="html-italic">n</span> = 6/group). Statistical significance was determined using a one-way analysis of variance (ANOVA), followed by a post hoc test. * <span class="html-italic">p</span> &lt; 0.05 indicates significant differences between T rats and the UT SCI group.</p>
Full article ">Figure 8
<p>Histopathological Evaluation of Liver and Kidney Tissues. (<b>a</b>) Hepatic Tissue (Liver): Hematoxylin and eosin (H&amp;E) staining of liver tissue sections to assess potential hepatotoxicity associated with MLC901 treatment, observed under different magnifications (10×, 20×, and 40×), using scale bars 50, 100, and 500 µm. The images showed no sign of sinusoidal dilatation (enlargement of the hepatic capillaries), necrosis, hemorrhage, or congestion observed in treated (T) rats associated with MLC901 treatment, in liver tissue. MLC901 treatment did not induce hepatotoxicity after 28 days, indicating the liver remained healthy under the treatment conditions, <span class="html-italic">n</span> = 6. (<b>b</b>) Renal Tissue (Kidney): Hematoxylin and eosin (H&amp;E) staining of kidney tissue sections to evaluate potential nephrotoxicity associated with MLC901 treatment, observed under different magnifications (10×, 20×, and 40×), using scale bars 50, 100, and 500 µm. The images showed no vacuolization in tubular cells, focal necrosis, or hemorrhage observed in the kidney tissue of T rats. MLC901 treatment did not induce nephrotoxicity after 28 days, confirming that the kidney function remained intact, <span class="html-italic">n</span> = 6. Both liver and kidney tissues in T rats showed no adverse effects such as hepatotoxicity or nephrotoxicity, suggesting that MLC901 is safe for these organs after 28 days of treatment, UT represents untreated rats without MLC901 treatment and receiving normal saline.</p>
Full article ">
10 pages, 1563 KiB  
Article
Bone Turnover Markers during Growth Hormone Therapy for Short Stature Children Born Small for Gestational Age
by Alicja Korpysz, Maciej Jaworski, Ewa Skorupa, Mieczysław Szalecki, Mieczysław Walczak and Elżbieta Petriczko
Biomedicines 2024, 12(8), 1919; https://doi.org/10.3390/biomedicines12081919 - 21 Aug 2024
Viewed by 3228
Abstract
Growth hormone therapy (GHT) can improve growth velocity and final height, but can also accelerate the process of bone growth, which is related to structural bone modeling in both formation and resorption. This study evaluated the capacity of bone turnover markers to predict [...] Read more.
Growth hormone therapy (GHT) can improve growth velocity and final height, but can also accelerate the process of bone growth, which is related to structural bone modeling in both formation and resorption. This study evaluated the capacity of bone turnover markers to predict early growth response to one year of GHT in short stature children born small for gestational age (SGA). This study included 25 prepubertal children born SGA. We estimated P1NP (N-terminal procollagen type 1), CTX (C-terminal telopeptide of collagen type 1), P3NP (N-terminal procollagen type 3), NT-pro-CNP (amino-terminal C-type natriuretic peptide) and Ca-P metabolism using standard ECLIA (electrochemiluminescence), RIA (radioimmunoassay), and ELISA (enzyme-linked immunosorbent assay) methods. A statistically significant increase in bone resorption markers (CTX) was found at both 6 and 12 months. P1NP bone markers were increased at 6 months and after 12 months of therapy. The P3NP marker for collagen synthesis also increased after 12 months of therapy. We obtained significant increases in phosphorus levels at 6 and 12 months, and similar ALP (alkaline phosphatase) increases. We found a significant correlation between height (cm) and CTX after 6–12 months, as well as a P1NP/height (SD) correlation after 12 months. Calcium levels significantly correlated with height (SD) after 12 months. We found strong reactions of bone resorption and bone formation markers during growth hormone therapy, which may determine their selection as predictors of GHT outcome in children born SGA. However, the issue requires further research. Full article
Show Figures

Figure 1

Figure 1
<p>Height (v1–v3)/CTX, CTX-C-terminal telopeptide of collagen type 1.</p>
Full article ">Figure 2
<p>Height (v1–v3)/P1NP, P1NP-N-terminal procollagen type 1.</p>
Full article ">Figure 3
<p>Height (v1–v3)/P3NP, P3NP-N-terminal procollagen type 3.</p>
Full article ">Figure 4
<p>Correlation height/CTX.</p>
Full article ">Figure 5
<p>Correlation height/P1NP.</p>
Full article ">
16 pages, 5973 KiB  
Article
Icaritin Exerts Anti-Cancer Effects through Modulating Pyroptosis and Immune Activities in Hepatocellular Carcinoma
by Yuanyuan Jiao, Wenqian Li, Wen Yang, Mingyu Wang, Yaling Xing and Shengqi Wang
Biomedicines 2024, 12(8), 1917; https://doi.org/10.3390/biomedicines12081917 - 21 Aug 2024
Cited by 1 | Viewed by 1505
Abstract
Icaritin (ICT), a natural compound extracted from the dried leaves of the genus Epimedium, possesses antitumor and immunomodulatory properties. However, the mechanisms through which ICT modulates pyroptosis and immune response in hepatocellular carcinoma (HCC) remain unclear. This study demonstrated that ICT exhibits pyroptosis-inducing [...] Read more.
Icaritin (ICT), a natural compound extracted from the dried leaves of the genus Epimedium, possesses antitumor and immunomodulatory properties. However, the mechanisms through which ICT modulates pyroptosis and immune response in hepatocellular carcinoma (HCC) remain unclear. This study demonstrated that ICT exhibits pyroptosis-inducing and anti-hepatocarcinoma effects. Specifically, the caspase1-GSDMD and caspase3-GSDME pathways were found to be involved in ICT-triggered pyroptosis. Furthermore, ICT promoted pyroptosis in co-cultivation of HepG2 cells and macrophages, regulating the release of inflammatory cytokines and the transformation of macrophages into a proinflammatory phenotype. In the Hepa1-6+Luc liver cancer model, ICT treatment significantly increased the expression of cleaved-caspase1, cleaved-caspase3, and granzyme B, modulated cytokine secretion, and stimulated CD8+ T cell infiltration, resulting in a reduction in tumor growth. In conclusion, the findings in this research suggested that ICT may modulate cell pyroptosis in HCC and subsequently regulate the immune microenvironment of the tumor. These observations may expand the understanding of the pharmacological mechanism of ICT, as well as the therapy of liver cancer. Full article
(This article belongs to the Special Issue Signaling Pathways That Regulate Cell Proliferation and Apoptosis)
Show Figures

Figure 1

Figure 1
<p>Icaritin (ICT) inhibited cell viability and proliferation of hepatocellular carcinoma (HCC) cells. (<b>A</b>) Chemical structural formula of ICT. (<b>B</b>) Colony formation in HepG2 and Huh7 cells subjected to ICT (0–40 μM). (<b>C</b>) Cell viability of HepG2, MHCC97H, HCCLM3, Huh7, and LO2 cells given ICT for 24 or 48 h. Data are presented as the mean ± SD. The following symbols denote statistical significance: <span class="html-italic">* p</span> &lt; 0.05, ** <span class="html-italic">p</span> &lt; 0.01, *** <span class="html-italic">p</span> &lt; 0.001.</p>
Full article ">Figure 2
<p>HCC cells underwent pyroptosis caused by ICT. (<b>A</b>) Microscopy images showing pyroptosis in HCC cells treated with ICT (40× magnification). Red arrows indicate cells exhibiting large bubbles. (<b>B</b>) LDH release in HCC cells subjected to ICT (0–50 μM) for 24 and 48 h. (<b>C</b>) Images of HepG2 cells stained with Annexin V-PI after 48 h of ICT (0–25 μM) treatment. Red arrows indicate cells exhibiting large bubbles. (<b>D</b>) Flow cytometry pseudo-color dot plots demonstrating annexin V-PI staining in HepG2 cells utilized with ICT (0–25 μM) for 48 h. (<b>E</b>) LDH release in HepG2 and Huh7 cells induced by 25 µM ICT and different inhibitors for 48 h. Inhibitors include Z-VAD-FMK (a pan caspase inhibitor), Ac-DEVD-CHO (a caspase-3 inhibitor), and disulfiram (a GSDMD inhibitor). The mean ± SD is displayed in the graphs. * <span class="html-italic">p</span> &lt; 0.05, ** <span class="html-italic">p</span> &lt; 0.01, *** <span class="html-italic">p</span> &lt; 0.001.</p>
Full article ">Figure 2 Cont.
<p>HCC cells underwent pyroptosis caused by ICT. (<b>A</b>) Microscopy images showing pyroptosis in HCC cells treated with ICT (40× magnification). Red arrows indicate cells exhibiting large bubbles. (<b>B</b>) LDH release in HCC cells subjected to ICT (0–50 μM) for 24 and 48 h. (<b>C</b>) Images of HepG2 cells stained with Annexin V-PI after 48 h of ICT (0–25 μM) treatment. Red arrows indicate cells exhibiting large bubbles. (<b>D</b>) Flow cytometry pseudo-color dot plots demonstrating annexin V-PI staining in HepG2 cells utilized with ICT (0–25 μM) for 48 h. (<b>E</b>) LDH release in HepG2 and Huh7 cells induced by 25 µM ICT and different inhibitors for 48 h. Inhibitors include Z-VAD-FMK (a pan caspase inhibitor), Ac-DEVD-CHO (a caspase-3 inhibitor), and disulfiram (a GSDMD inhibitor). The mean ± SD is displayed in the graphs. * <span class="html-italic">p</span> &lt; 0.05, ** <span class="html-italic">p</span> &lt; 0.01, *** <span class="html-italic">p</span> &lt; 0.001.</p>
Full article ">Figure 3
<p>The caspase1-GSDMD and caspase3-GSDME pathways are involved in ICT-triggered pyroptosis. (<b>A</b>) Expression levels of cleaved-caspase-1/3 and GSDMD/E-NT in HepG2 cells exposed to 0–25μM ICT for 48 h, assessed using Western blotting. (<b>B</b>) LDH release in GSDMD/E knockdown HepG2 cells treated with 20 μM ICT for 48 h. (<b>C</b>) LDH release and annexin V-PI staining in GSDMD/E overexpressed HepG2 cells subjected to 20 μM ICT for 48 h. White arrows indicate cells exhibiting large bubbles. (<b>D</b>) Expression of GSDMD/E-NT in HepG2 cells stimulated for 48 h with 20 μM ICT and Z-VAD-FMK inhibitor, analyzed using Western blotting. The graphs represent the mean ± SD. * <span class="html-italic">p</span> &lt; 0.05, ** <span class="html-italic">p</span> &lt; 0.01, *** <span class="html-italic">p</span> &lt; 0.001.</p>
Full article ">Figure 4
<p>Pyroptosis induced the release of inflammatory factors and promoted macrophage transformation towards a proinflammatory phenotype. (<b>A</b>) Experimental diagram of the co-culture system. (<b>B</b>) LDH release was detected in the co-culture system treated with 0–6 µM ICT for 48 h. (<b>C</b>) ELISA of inflammatory cytokines IL-1β, IL-18, and IL-6. Statistical analyses were conducted to compare the groups of co-cultured HepG2 and THP-1 cells with and without ICT treatment groups. (<b>D</b>) Expression levels of proinflammatory macrophage (M1) markers (COX-2, IL-6, TNF-α) and anti-inflammatory (M2) markers (CD163, IL-10) assessed using qPCR. Statistical analyses were conducted to compare the THP-1 cell group with other groups. The graphs represent the mean ± SD. The n.s. represent no significance and <span class="html-italic">p</span> &lt; 0.05 was considered statistically significant., * <span class="html-italic">p</span> &lt; 0.05, ** <span class="html-italic">p</span> &lt; 0.01, *** <span class="html-italic">p</span> &lt; 0.001.</p>
Full article ">Figure 5
<p>The anti-hepatocarcinoma effects of ICT on the regulation of pyroptosis, cytokines, and immunity. (<b>A</b>) Graph demonstrating the significant inhibitory effect of ICT on tumor growth. (<b>B</b>) H&amp;E staining of the liver with magnification of cell features; yellow arrows indicate interstitial inflammatory cell infiltration. (<b>C</b>) Immunohistochemical staining revealing elevated expression of cleaved-caspase-1/3 and granzyme B in ICT-treated samples, with brown coloration indicating positive staining. (<b>D</b>) Differences in cytokine expression between HCC and ICT groups. (<b>E</b>) Representative multiplex immunohistochemistry staining depicting the infiltration of various immune cells.</p>
Full article ">Figure 5 Cont.
<p>The anti-hepatocarcinoma effects of ICT on the regulation of pyroptosis, cytokines, and immunity. (<b>A</b>) Graph demonstrating the significant inhibitory effect of ICT on tumor growth. (<b>B</b>) H&amp;E staining of the liver with magnification of cell features; yellow arrows indicate interstitial inflammatory cell infiltration. (<b>C</b>) Immunohistochemical staining revealing elevated expression of cleaved-caspase-1/3 and granzyme B in ICT-treated samples, with brown coloration indicating positive staining. (<b>D</b>) Differences in cytokine expression between HCC and ICT groups. (<b>E</b>) Representative multiplex immunohistochemistry staining depicting the infiltration of various immune cells.</p>
Full article ">
20 pages, 4999 KiB  
Article
Decentralized and Secure Collaborative Framework for Personalized Diabetes Prediction
by Md Rakibul Hasan, Qingrui Li, Utsha Saha and Juan Li
Biomedicines 2024, 12(8), 1916; https://doi.org/10.3390/biomedicines12081916 - 21 Aug 2024
Cited by 1 | Viewed by 1720
Abstract
Diabetes is a global epidemic with severe consequences for individuals and healthcare systems. While early and personalized prediction can significantly improve outcomes, traditional centralized prediction models suffer from privacy risks and limited data diversity. This paper introduces a novel framework that integrates blockchain [...] Read more.
Diabetes is a global epidemic with severe consequences for individuals and healthcare systems. While early and personalized prediction can significantly improve outcomes, traditional centralized prediction models suffer from privacy risks and limited data diversity. This paper introduces a novel framework that integrates blockchain and federated learning to address these challenges. Blockchain provides a secure, decentralized foundation for data management, access control, and auditability. Federated learning enables model training on distributed datasets without compromising patient privacy. This collaborative approach facilitates the development of more robust and personalized diabetes prediction models, leveraging the combined data resources of multiple healthcare institutions. We have performed extensive evaluation experiments and security analyses. The results demonstrate good performance while significantly enhancing privacy and security compared to centralized approaches. Our framework offers a promising solution for the ethical and effective use of healthcare data in diabetes prediction. Full article
Show Figures

Figure 1

Figure 1
<p>System framework.</p>
Full article ">Figure 2
<p>Accuracy of individual client learners over time.</p>
Full article ">Figure 3
<p>Precision of individual client learners over time.</p>
Full article ">Figure 4
<p>Recall of individual client learners over time.</p>
Full article ">Figure 5
<p>F1-score of individual client learners over time.</p>
Full article ">Figure 6
<p>Communication overhead between centralized and federated learning.</p>
Full article ">Figure 7
<p>A new patient (Data Owner) is registered.</p>
Full article ">Figure 8
<p>Data Owner (Nora) has granted her patient data access to Data Producer (Dr. Alex).</p>
Full article ">Figure 8 Cont.
<p>Data Owner (Nora) has granted her patient data access to Data Producer (Dr. Alex).</p>
Full article ">Figure 9
<p>Access has been revoked by the data owner.</p>
Full article ">Figure 10
<p>Access from an unauthorized entity is denied.</p>
Full article ">Figure 11
<p>Local models are aggregated into global models.</p>
Full article ">Figure 12
<p>Malicious model updates are avoided.</p>
Full article ">
29 pages, 1134 KiB  
Review
The Role of Epithelial-to-Mesenchymal Transition Transcription Factors (EMT-TFs) in Acute Myeloid Leukemia Progression
by Diego Cuevas, Roberto Amigo, Adolfo Agurto, Adan Andreu Heredia, Catherine Guzmán, Antonia Recabal-Beyer, Valentina González-Pecchi, Teresa Caprile, Jody J. Haigh and Carlos Farkas
Biomedicines 2024, 12(8), 1915; https://doi.org/10.3390/biomedicines12081915 - 21 Aug 2024
Cited by 1 | Viewed by 1925
Abstract
Acute myeloid leukemia (AML) is a diverse malignancy originating from myeloid progenitor cells, with significant genetic and clinical variability. Modern classification systems like those from the World Health Organization (WHO) and European LeukemiaNet use immunophenotyping, molecular genetics, and clinical features to categorize AML [...] Read more.
Acute myeloid leukemia (AML) is a diverse malignancy originating from myeloid progenitor cells, with significant genetic and clinical variability. Modern classification systems like those from the World Health Organization (WHO) and European LeukemiaNet use immunophenotyping, molecular genetics, and clinical features to categorize AML subtypes. This classification highlights crucial genetic markers such as FLT3, NPM1 mutations, and MLL-AF9 fusion, which are essential for prognosis and directing targeted therapies. The MLL-AF9 fusion protein is often linked with therapy-resistant AML, highlighting the risk of relapse due to standard chemotherapeutic regimes. In this sense, factors like the ZEB, SNAI, and TWIST gene families, known for their roles in epithelial–mesenchymal transition (EMT) and cancer metastasis, also regulate hematopoiesis and may serve as effective therapeutic targets in AML. These genes contribute to cell proliferation, differentiation, and extramedullary hematopoiesis, suggesting new possibilities for treatment. Advancing our understanding of the molecular mechanisms that promote AML, especially how the bone marrow microenvironment affects invasion and drug resistance, is crucial. This comprehensive insight into the molecular and environmental interactions in AML emphasizes the need for ongoing research and more effective treatments. Full article
(This article belongs to the Special Issue Advances in the Pathogenesis and Treatment of Acute Myeloid Leukemia)
Show Figures

Figure 1

Figure 1
<p>Anticancer drugs can interfere with the catalytic cycle of TOP2, causing chromosomal translocation. (1) DNA supercoiling and catenation. (2) TOP2 dimer binds to one DNA double helix (green), and some compounds can inhibit TOP2 binding to DNA [<a href="#B111-biomedicines-12-01915" class="html-bibr">111</a>]. (3,4) Top2 generates a double-strand break in green DNA in the presence of Mg<sup>2+</sup>, and TOP2 remains attached to both DNA ends. A second DNA double helix (red) passes through the break in an ATP-dependent process. Some compounds can stimulate or inhibit DNA break formation [<a href="#B111-biomedicines-12-01915" class="html-bibr">111</a>]. (5–7) After the red DNA passage is completed, green DNA is re-ligated and both DNAs are released from the enzyme. (5a) Etoposide and doxorubicin can inhibit DNA re-ligation [<a href="#B111-biomedicines-12-01915" class="html-bibr">111</a>], resulting in the accumulation of TOP2 attached to DNA ends. After proteasomal action, DNA with double-strand breaks is repaired by Non-Homologous End-Joining (NHEJ), potentially leading to mutation (6a) or chromosome translocation (6b) [<a href="#B19-biomedicines-12-01915" class="html-bibr">19</a>].</p>
Full article ">Figure 2
<p>Overview of the role of EMT factors in normal hematopoiesis, AML development, and EME. EMT factors such as <span class="html-italic">ZEB2</span> ensure hematopoietic lineage fidelity during early hematopoiesis by restraining mature gene expression programs. Later in hematopoiesis, EMT factors lock in cell identity once committed. Upregulated expression of <span class="html-italic">ZEB2</span> can specifically transform T cell lineage and cause Early T cell Precursor Acute Lymphoblastic Leukemia (ETP-ALL). AML driver mutations can increase EMT factor expression, including <span class="html-italic">ZEB1/2</span>, <span class="html-italic">SNAI1/2</span>, and <span class="html-italic">TWIST1</span>, which can corrupt epigenetic factors such as LSD1 and lead to leukemic stem cell (LSC) gene expression program and transformation. EMT factors can also enhance survival signal pathway expression and increase drug resistance. EMT processes also drive extramedullary tissue engraftment, tissue colonization, and blast crisis development by altering AML cell adhesion and homing and survival signals. Ery—erythrocyte, Meg—megakaryocyte, Mac—macrophage, Gr—granulocyte, DC—dendritic cell, NK—natural killer cells, B—B cells, T—T cells, EME—extramedullary engraftment, HSC—hematopoietic stem cell, HPC—hematopoietic progenitor cell, LSC—leukemic stem cell.</p>
Full article ">
17 pages, 1605 KiB  
Review
The Effects of Chronic Psychostimulant Administration on Bone Health: A Review
by Jessica Nowak, Jacob Aronin, Faraaz Beg, Natasha O’Malley, Michael Ferrick, Teresa Quattrin, Sonja Pavlesen, Michael Hadjiargyrou, David E. Komatsu and Panayotis K. Thanos
Biomedicines 2024, 12(8), 1914; https://doi.org/10.3390/biomedicines12081914 - 21 Aug 2024
Cited by 1 | Viewed by 1256
Abstract
(1) Background: Methylphenidate (MP) and amphetamine (AMP) are psychostimulants that are widely prescribed to treat Attention Deficit Hyperactivity Disorder (ADHD) and narcolepsy. In recent years, 6.1 million children received an ADHD diagnosis, and nearly 2/3 of these children were prescribed psychostimulants for treatment. [...] Read more.
(1) Background: Methylphenidate (MP) and amphetamine (AMP) are psychostimulants that are widely prescribed to treat Attention Deficit Hyperactivity Disorder (ADHD) and narcolepsy. In recent years, 6.1 million children received an ADHD diagnosis, and nearly 2/3 of these children were prescribed psychostimulants for treatment. The purpose of this review is to summarize the current literature on psychostimulant use and the resulting effects on bone homeostasis, biomechanical properties, and functional integrity. (2) Methods: Literature searches were conducted from Medline/PubMed electronic databases utilizing the search terms “methylphenidate” OR “amphetamine” OR “methylphenidate” AND “bone health” AND “bone remodeling” AND “osteoclast” AND “osteoblast” AND “dopamine” from 01/1985 to 04/2023. (3) Results: Of the 550 publications found, 44 met the inclusion criteria. Data from identified studies demonstrate that the use of MP and AMP results in decreases in specific bone properties and biomechanical integrity via downstream effects on osteoblasts and osteoclast-related genes. (4) Conclusions: The chronic use of psychostimulants negatively affects bone integrity and strength as a result of increased osteoclast activity. These data support the need to take this into consideration when planning the treatment type and duration for bone fractures. Full article
(This article belongs to the Special Issue Dopamine Signaling Pathway in Health and Disease)
Show Figures

Figure 1

Figure 1
<p>PRISMA flow chart. Number of articles identified, screened and included in this review.</p>
Full article ">Figure 2
<p>Mechanisms of AMP and MP on the DAT. Normal-functioning DAT reuptakes extracellular DA from the cleft; MP acts as a transporter blockade and blocks the reuptake of DA, resulting in an increase in DA levels at the synapse; and AMP acts as a transporter reversal, resulting in an efflux of DA back into the synaptic cleft.</p>
Full article ">Figure 3
<p>D1R-Runx2 activation pathway. In vitro pathway associated with D1R activation and downstream increases in cAMP, PKA, ERK1/2, Runx2, and osteoblast genes ALP, BSP, and OCN.</p>
Full article ">Figure 4
<p>D2R-CREB activation pathway. In vitro pathway associated with D2R activation and a downstream decrease in cAMP, PKA, CREB, and osteoclast genes, such as c-Fos.</p>
Full article ">
20 pages, 724 KiB  
Review
Nesfatin-1: A Novel Diagnostic and Prognostic Biomarker in Digestive Diseases
by Adriana-Cezara Damian-Buda, Daniela Maria Matei, Lidia Ciobanu, Dana-Zamfira Damian-Buda, Raluca Maria Pop, Anca Dana Buzoianu and Ioana Corina Bocsan
Biomedicines 2024, 12(8), 1913; https://doi.org/10.3390/biomedicines12081913 - 20 Aug 2024
Cited by 1 | Viewed by 1141
Abstract
Nesfatin-1, deriving from a precursor protein, NUCB2, is a newly discovered molecule with anti-apoptotic, anti-inflammatory, antioxidant, and anorexigenic effects. It was initially identified in the central nervous system (CNS) and received increasing interest due to its energy-regulating properties. However, research showed that nesfatin-1 [...] Read more.
Nesfatin-1, deriving from a precursor protein, NUCB2, is a newly discovered molecule with anti-apoptotic, anti-inflammatory, antioxidant, and anorexigenic effects. It was initially identified in the central nervous system (CNS) and received increasing interest due to its energy-regulating properties. However, research showed that nesfatin-1 is also expressed in peripheral tissues, including the digestive system. The aim of this review is to give a résumé of the present state of knowledge regarding its structure, immunolocalization, and potential implications in diseases with inflammatory components. The main objective was to focus on its clinical importance as a diagnostic biomarker and potential therapeutic molecule in a variety of disorders, among which digestive disorders were of particular interest. Previous studies have shown that nesfatin-1 regulates the balance between pro- and antioxidant agents, which makes nesfatin-1 a promising therapeutic agent. Further in-depth research regarding the underlying mechanisms of action is needed for a better understanding of its effects. Full article
Show Figures

Graphical abstract

Graphical abstract
Full article ">Figure 1
<p>Nesfatin-1: localization and possible role in tissue functions regulation. Created with <a href="http://BioRender.com" target="_blank">BioRender.com</a> (accessed on 1 August 2024).</p>
Full article ">
17 pages, 6504 KiB  
Article
Effects of Resistant-Starch-Encapsulated Probiotic Cocktail on Intestines Damaged by 5-Fluorouracil
by Jui-Ling Wang, Chin-Hsing Yeh, Shih-Hung Huang, Lawrence Shih-Hsin Wu and Miles Chih-Ming Chen
Biomedicines 2024, 12(8), 1912; https://doi.org/10.3390/biomedicines12081912 - 20 Aug 2024
Viewed by 1187
Abstract
Probiotics and prebiotics have gained attention for their potential health benefits. However, their efficacy hinges on probiotic survival through the harsh gastrointestinal environment. Microencapsulation techniques provide a solution, with resistant starch (RS)-based techniques showing promise in maintaining probiotic viability. Specifically, RS-encapsulated probiotics significantly [...] Read more.
Probiotics and prebiotics have gained attention for their potential health benefits. However, their efficacy hinges on probiotic survival through the harsh gastrointestinal environment. Microencapsulation techniques provide a solution, with resistant starch (RS)-based techniques showing promise in maintaining probiotic viability. Specifically, RS-encapsulated probiotics significantly improved probiotic survival in gastric acid, bile salts, and simulated intestinal conditions. This study investigated the effects of a resistant-starch-encapsulated probiotic cocktail (RS-Pro) in the context of 5-fluorouracil (5-FU) chemotherapy, which frequently induces microbiota dysbiosis and intestinal mucositis. Female BALB/c mice were divided into three groups: a 5-FU group, a 5-FU+Pro group receiving free probiotics, and a 5-FU+RS-Pro group receiving RS-encapsulated probiotics. After 28 days of treatment, analyses were conducted on fecal microbiota, intestinal histology, peripheral blood cell counts, and body and organ weights. It was revealed by 16S rRNA MiSeq sequencing that 5-FU treatment disrupted gut microbiota composition, reduced microbial diversity, and caused dysbiosis. RS-Pro treatment restored microbial diversity and increased the population of beneficial bacteria, such as Muribaculaceae, which play roles in carbohydrate and polyphenol metabolism. Furthermore, 5-FU administration induced moderate intestinal mucositis, characterized by reduced cellularity and shortened villi. However, RS-Pro treatment attenuated 5-FU-induced intestinal damage, preserving villus length. Mild leukopenia observed in the 5-FU-treated mice was partially alleviated in 5-FU+Pro and 5-FU+RS-Pro groups. These findings suggest that RS-Pro may serve as an adjunct to chemotherapy, potentially reducing adverse effects and improving therapeutic outcomes in future clinical applications. Full article
Show Figures

Figure 1

Figure 1
<p>The manufactural process and SEM images of resistant-starch-encapsulated probiotic cocktails (RS-Pro). (<b>A</b>) Schematic diagram of the resistant-starch-based encapsulation technique (RS-BET) process to produce resistant-starch-encapsulated probiotic cocktails (RS-Pro). (<b>B</b>) Scanning electron micrographs (SEM) of RS-Pro (<b>a</b>,<b>b</b>), RS processed by RS-BET, (<b>c</b>) and naïve RS (<b>d</b>) are shown. Black arrows indicate probiotic cells captured within the matrix.</p>
Full article ">Figure 2
<p>RS-Pro presented tolerance to acid and bile salt. (<b>A</b>) The viable counts of probiotics in the probiotic cocktails (Pro) and RS-Pro before and after exposure to acid (gray fill), 0.3% bile salts (cross diagonal), and simulated intestinal conditions (blank) over a 3 h period (or a total of 6 h for simulated intestinal conditions) are presented as a bar chart. Viable counts are expressed in log CFU/mL. Statistical significance is indicated by *, <span class="html-italic">p</span> &lt; 0.05, **, <span class="html-italic">p</span> &lt; 0.01 and ***, <span class="html-italic">p</span> &lt; 0.001 compared with original loading amount, <span class="html-italic">n</span> = 3. (<b>B</b>) The log reduction in viable cell counts following different treatments compared to the initial inoculation. Data are presented as mean ± SD from 3 independent experiments. Data presented as mean ± SD of 3 independent experiments. **, <span class="html-italic">p</span> &lt; 0.01 and ***, <span class="html-italic">p</span> &lt; 0.001.</p>
Full article ">Figure 3
<p>Schematic diagram of animal study. BALB/cByJNarl mice were categorized into three experimental groups. Each group received a 20 mg/kg injection of 5-FU and either probiotics cocktail (Pro or RS-Pro) or no probiotics (5-FU). After 28 days, the animals were euthanized for further analysis.</p>
Full article ">Figure 4
<p>Rarefaction curves and Venn diagram of amplicon sequence variants (ASVs). (<b>A</b>) Rarefaction curves representing alpha diversity analysis, including Chao1 index (<b>a</b>), observed species (<b>b</b>), Shannon index (<b>c</b>), and PD whole tree (<b>d</b>), illustrating the observed number of species at various sequencing depths. The <span class="html-italic">y</span>-axis indicates the average number of ASVs per sample in each group. (<b>B</b>) Venn diagram depicting ASVs in different study groups. Yellow, red, green, and blue circles represent different experimental groups, while the intersections reveal shared ASVs among one or more groups. The single-layer zone indicates the number of ASVs specific to each group, with numbers indicating the corresponding species.</p>
Full article ">Figure 5
<p>Taxonomic profiles of the fecal bacteria. The figure provides a comparison of the component proportions of the microbiome at the class (<b>A</b>) and genus (<b>B</b>) levels among the different experimental groups, displaying the taxonomic profiles of fecal bacteria in three groups and illustrating the effects of RS probiotics on 5-FU-induced changes in the relative abundances of gut microbiota. Fecal samples were collected both before (day 0) and after (day 27) the experiment.</p>
Full article ">Figure 6
<p>Cladogram and histogram of linear discriminant analysis effect size (LEfSe) among the different groups: control, 5-FU, 5-FU+Pro, and 5-FU+RS-Pro groups. In the cladograms (<b>A</b>), taxonomic cladogram representation obtained from LEfSe analysis of 16S sequences highlights statistically significant differences between groups. Different colors of nodes indicate microbial groups that play significant roles: purple nodes in the control group, red nodes in the 5-FU group, green nodes in the 5-FU+Pro group, and blue nodes in the 5-FU+RS-Pro group. The histogram (<b>B</b>) displays linear discriminant analysis (LDA) scores assessing the effect size of each differentially abundant bacterial taxa between groups.</p>
Full article ">Figure 7
<p>Histological analysis of the small intestine following 5-FU and probiotics cocktail administration. (<b>A</b>) Representative histological images of small intestine fragments stained with hematoxylin and eosin from various experimental groups are presented. Additional mice of the same age were employed as normal controls. In panel (<b>a</b>–<b>e</b>), it is evident that normal control mice exhibited the integrity of the intestinal mucosa, with normal villi and crypts. Mice treated with 5-FU (20 mg/kg twice weekly) (panel (<b>b</b>,<b>f</b>)) exhibited loss of intestinal mucosal integrity, shortened and blunted villi, and inflammatory cell infiltration in the lamina propria. Mice treated with Pro and RS-Pro (panel (<b>c</b>,<b>d</b>,<b>g</b>,<b>h</b>)) showed alleviated 5-FU-induced histological changes, with preserved villi. Scale bars = 100 μm (panel (<b>a</b>–<b>d</b>)) and 50 μm (panel (<b>e</b>–<b>h</b>)). (<b>B</b>) Measurements of villus height (<b>upper</b>) and crypt depth (<b>lower</b>) in intestinal segments. The box graph represents the maximum, median, and minimum.</p>
Full article ">
17 pages, 1328 KiB  
Review
Navigating Complexity in Postural Orthostatic Tachycardia Syndrome
by Hui-Qi Qu and Hakon Hakonarson
Biomedicines 2024, 12(8), 1911; https://doi.org/10.3390/biomedicines12081911 - 20 Aug 2024
Cited by 2 | Viewed by 3311
Abstract
Postural Orthostatic Tachycardia Syndrome (POTS) affects up to 1% of the US population, predominantly women, and is characterized by a complex, elusive etiology and heterogeneous phenotypes. This review delves into the intricate physiology and etiology of POTS, decoding the roles of the sinoatrial [...] Read more.
Postural Orthostatic Tachycardia Syndrome (POTS) affects up to 1% of the US population, predominantly women, and is characterized by a complex, elusive etiology and heterogeneous phenotypes. This review delves into the intricate physiology and etiology of POTS, decoding the roles of the sinoatrial node, the autonomic nervous system, fluid dynamics, and the interplay between the immune and endocrine systems. It further examines key contributing factors such as dysautonomia, thoracic hypovolemia, autonomic neuropathies, sympathetic denervation, autoimmune responses, and associations with conditions such as small-fiber neuropathy and mast cell activation syndrome. Given the numerous mysteries surrounding POTS, we also cautiously bring attention to sinoatrial node and myocardial function, particularly in how the heart responds to stress despite exhibiting a normal cardiac phenotype at rest. The potential of genomic research in elucidating the underlying mechanisms of POTS is emphasized, suggesting this as a valuable approach that is likely to improve our understanding of the genetic underpinnings of POTS. The review introduces a tentative classification system for the etiological factors in POTS, which seeks to capture the condition’s diverse aspects by categorizing various etiological factors and acknowledging co-occurring conditions. This classification, while aiming to enhance understanding and optimize treatment targets, is presented as a preliminary model needing further study and refinement. This review underscores the ongoing need for research to unravel the complexities of POTS and to develop targeted therapies that can improve patient outcomes. Full article
(This article belongs to the Section Molecular and Translational Medicine)
Show Figures

Figure 1

Figure 1
<p>Etiological Factors of POTS. Extended thoracic hypovolemia has the potential to strain the ANS, leading to dysautonomia. Autoimmune responses targeting components of the ANS may trigger dysautonomia. POTS frequently co-occurs with conditions that have inflammatory underpinnings, suggesting inflammatory mechanisms in the pathophysiology of POTS. The diminished venoconstriction resulting from autonomic neuropathies or sympathetic denervation in the lower extremities induces thoracic hypovolemia. The impaired reuptake of norepinephrine due to NET deficiency can result in elevated circulating levels, further contributing to autonomic dysfunction. A decrease in norepinephrine clearance might be attributed to a decline in cardiac output. Molecular mimicry, leading to the formation of cross-reacting autoantibodies, may underlie the risk of POTS associated with HPV vaccination. The mechanisms behind long COVID-19 and POTS may involve hypovolemia, inflammation, and autoimmunity. Additionally, EDS may be linked to POTS due to peripheral neuropathy and thoracic hypovolemia. Endocrine dysfunction, deconditioning, muscle pump dysfunction, mast cell activation disorders, and pregnancy may also contribute to thoracic hypovolemia. Medications may cause dysautonomia. Dysautonomia leads to issues with heart rate regulation, myocardial contractility, and the function of blood vessels. Our research further highlights the significant challenges affecting the heart and circulatory system in POTS patients. Despite the fragmented understanding of POTS risk factors, highlighting a complex interplay of physiological, immunological, and environmental factors, the identification of these diverse factors underscores critical gaps in knowledge, such as the direct involvement of the heart, and offers insights into potential areas for intervention and therapeutic development. Red arrows represent central mechanisms, and blue arrows represent contributing factors.</p>
Full article ">Figure 2
<p>Cardiac contraction and regulatory mechanisms. The purported role of myocardial function in POTS involves a complex interplay of the acto-myosin complex and multiple regulatory mechanisms. Several key players are outlined.</p>
Full article ">
11 pages, 628 KiB  
Article
Clinical Evaluation of Adrenal Incidentaloma: The Experience of a Referral Center
by Luigi Petramala, Francesco Circosta, Luca Marino, Edoardo Palombi, Maria Ludovica Costanzo, Adriana Servello, Gioacchino Galardo and Claudio Letizia
Biomedicines 2024, 12(8), 1910; https://doi.org/10.3390/biomedicines12081910 - 20 Aug 2024
Viewed by 1103
Abstract
The number of adrenal incidentaloma (AI) cases has increased in the last few years due to the widespread use of imaging diagnostics. Management requires evaluation of the malignant nature and hormonal activity. The aim of the present study is to assess possible clinical [...] Read more.
The number of adrenal incidentaloma (AI) cases has increased in the last few years due to the widespread use of imaging diagnostics. Management requires evaluation of the malignant nature and hormonal activity. The aim of the present study is to assess possible clinical abnormalities in 132 AI patients both at baseline and during follow-up (mean 48.6 ± 12.5 months). In all patients, demographic, anthropometric data, biochemical, metabolic and hormonal data, and 24-h ambulatory blood pressure monitoring were assessed. Mild autonomous cortisol secretions (MACS) were diagnosed in patients without signs and symptoms of overt Cushing’s syndrome and post dexamethasone (DXM) plasma cortisol concentration > 50 nmol/L (>1.8 μg/dL). Patients with overnight DXM-1 mg test positive showed higher values of diastolic blood pressure, glycemia and uric acid levels compared to patients with negative DXM test at baseline. During follow-up, the potential development of MACS in patients with nonfunctional AI showed a prevalence of 29%, though the cardiovascular and metabolic alterations were less pronounced compared to those diagnosed with MACS at baseline. Therefore, follow-ups with AI patients are useful for observing changes in clinical features. Full article
(This article belongs to the Special Issue Recent Updates on Adrenal Tumors)
Show Figures

Figure 1

Figure 1
<p>Prevalence of non-functional adrenal incidentaloma (NFAI) and mild autonomous cortisol secretions (MACS) at baseline and follow-up.</p>
Full article ">Figure 2
<p>Prevalence of de novo appearance of an autonomous secretion of cortisol in patients with non-functional adrenal incidentaloma (NFAI) during follow-up. Morelli 2014 [<a href="#B11-biomedicines-12-01910" class="html-bibr">11</a>], Dalmazi 2014 [<a href="#B13-biomedicines-12-01910" class="html-bibr">13</a>], Hong 2017 [<a href="#B15-biomedicines-12-01910" class="html-bibr">15</a>], Papanastiou 2017 [<a href="#B16-biomedicines-12-01910" class="html-bibr">16</a>], Comlecki 2010 [<a href="#B18-biomedicines-12-01910" class="html-bibr">18</a>], Ceccato 2021 [<a href="#B19-biomedicines-12-01910" class="html-bibr">19</a>], Falcetta 2020 [<a href="#B20-biomedicines-12-01910" class="html-bibr">20</a>], Bernini 2005 [<a href="#B21-biomedicines-12-01910" class="html-bibr">21</a>], Vassilatou 2009 [<a href="#B22-biomedicines-12-01910" class="html-bibr">22</a>], Araujo-Castro 2021 [<a href="#B23-biomedicines-12-01910" class="html-bibr">23</a>], Giordano 2005 [<a href="#B24-biomedicines-12-01910" class="html-bibr">24</a>], Barzon 1999 [<a href="#B25-biomedicines-12-01910" class="html-bibr">25</a>], Goh 2020 [<a href="#B26-biomedicines-12-01910" class="html-bibr">26</a>], Anagnostis 2010 [<a href="#B27-biomedicines-12-01910" class="html-bibr">27</a>], Fagour 2009 [<a href="#B28-biomedicines-12-01910" class="html-bibr">28</a>], Patrova 2017 [<a href="#B29-biomedicines-12-01910" class="html-bibr">29</a>], Araujo-Castro 2017 [<a href="#B17-biomedicines-12-01910" class="html-bibr">17</a>]. DXM +: MACS diagnosis after positive DXM test plus one abnormal hormonal test of hypothalamic-pituitary-adrenal axis [urinary free cortisol (UFC) level &gt; 100 mcg/24 h; morning plasma ACTH levels &lt;  pg/mL); altered salivary cortisol]; DXM -: MACS diagnosis after positive DXM test alone.</p>
Full article ">
15 pages, 10762 KiB  
Article
Lymphocytic Myocarditis in Children with Parvovirus B19 Infection: Pathological and Molecular Insights
by Lisann Pelzl, Sabrina Mantino, Martina Sauter, Tatiana Manuylova, Ulrich Vogel and Karin Klingel
Biomedicines 2024, 12(8), 1909; https://doi.org/10.3390/biomedicines12081909 - 20 Aug 2024
Cited by 3 | Viewed by 1569
Abstract
Background: This study aims to evaluate the role of parvovirus B19 (B19V) in the pathogenesis of myocarditis in a paediatric population, including post-mortem samples from two children. Methods: From 2004 to 2023, endomyocardial biopsies (EMBs) from children under 16 years of age were [...] Read more.
Background: This study aims to evaluate the role of parvovirus B19 (B19V) in the pathogenesis of myocarditis in a paediatric population, including post-mortem samples from two children. Methods: From 2004 to 2023, endomyocardial biopsies (EMBs) from children under 16 years of age were analyzed using histology, immunohistochemistry, and molecular pathology. A total of 306 children with acute and 1060 children with chronic lymphocytic myocarditis were identified. Results: B19V infection was more frequent in acute myocarditis than in chronic myocarditis (43% vs. 14%), with higher viral loads in acute cases regardless of age. The most prominent cardiac CD3+ T cell infiltration was noted in children < 2 years, correlating with high cardiac B19V loads. In two male infants who died from B19V infection, B19V DNA was localized in the endothelial cells of multiple organs using in situ hybridization. Virus replication was found in the endothelial cells of small cardiac arterioles and venules but not in capillaries. B19V DNA/mRNA was also detected in immune cells, especially in the spleen and lymph nodes, revealing virus replication in B lymphocytes. Conclusions: B19V can induce severe lymphocytic myocarditis, especially in young children. The simultaneous histopathological and molecular assessment of EMBs is important for early diagnosis of viral myocarditis, preventing severe disease, and ensuring appropriate therapy. Full article
Show Figures

Figure 1

Figure 1
<p>Detection of viral DNA/RNA in children with histological evidence of myocarditis. (<b>A</b>) PCR results from the heart tissue of 306 patients with histologically proven acute myocarditis. (<b>B</b>) PCR results from the heart tissue of 1060 patients with chronic myocarditis. (<b>C</b>) Comparison of viral copy numbers in the heart, buffy coat (BC), and plasma of all children with acute and chronic myocarditis. (<b>D</b>) Comparison of viral copy numbers in heart samples from two age groups (0–2 years and 3–16 years) with acute and chronic myocarditis. B19V viral load is presented as the number of copies per µg of DNA (heart or BC) and per ml of plasma. Data are presented as mean ± SEM; ns, not significant; * <span class="html-italic">p</span> &lt; 0.05, ** <span class="html-italic">p</span> &lt; 0.01, and **** <span class="html-italic">p</span> &lt; 0.0001.</p>
Full article ">Figure 2
<p>Correlation of CD3+ T cell infiltration and B19V DNA copies in children with acute and chronic myocarditis. (<b>A</b>) Comparison of CD3+ cell count in acute myocarditis without infection, other virus infections, and B19V infection between two age groups (0–2 years and 3–16 years). (<b>B</b>) Comparison of CD3+ cell count in chronic myocarditis without infection, other virus infections, and B19V infection between two age groups (0–2 years and 3–16 years). (<b>C</b>) Correlation of CD3+ T cell infiltration with viral DNA load in the myocardium (blue) and BC (red). (<b>D</b>) Correlation of CD3+ T cell infiltration with viral load in the myocardium (blue) and plasma (red). CD3+ cell count is presented as the number of cells per mm<sup>2</sup>. B19V DNA load is given as the number of copies per µg of DNA (heart or BC) and per ml of plasma. Data are presented as mean ± SEM; ns, not significant; * <span class="html-italic">p</span> &lt; 0.05, and ** <span class="html-italic">p</span> &lt; 0.01.</p>
Full article ">Figure 3
<p>Histological/immunohistological presentation of fatal myocarditis in a 12-month-old patient (<b>A</b>) with cardiac B19V infection. (<b>A</b>,<b>B</b>) HE staining of heart tissue shows acute myocarditis characterized by myocyte necrosis and extensive inflammatory infiltrate. (<b>C</b>–<b>F</b>) Immunohistochemical staining (brown cells) reveals the presence of many CD3+ T cells (<b>C</b>), some CD20+ B cells (<b>D</b>), and numerous CD68+ macrophages (<b>E</b>), with many of them expressing MHCII (<b>F</b>). (<b>G</b>,<b>H</b>) Detection of B19V DNA (black signals) via radioactive ISH in endothelial cells of cardiac vessels.</p>
Full article ">Figure 4
<p>Morphological presentation of fatal myocarditis in a 17-month-old patient B after cardiac B19V infection. (<b>A</b>) Masson’s trichrome staining of heart tissue shows acute myocarditis with myocyte necrosis, many CD3+ T cells (<b>B</b>) and CD68+ macrophages (<b>C</b>) comparable to findings in patient A. (<b>D</b>) Detection of B19V DNA (black signals) via radioactive ISH in the endothelium of a cardiac vessel.</p>
Full article ">Figure 5
<p>Visualization of B19V DNA (black) via radioactive ISH in different organs of patient B. (<b>A</b>) Localization of B19V DNA within kidney glomeruli and (<b>B</b>) arterioles of liver tissue. (<b>C</b>,<b>D</b>) B19V-positive immune cells and arterioles in the lung. (<b>E</b>) B19V DNA is present in numerous immune cells of lymph nodes and endothelial cells, with a close-up shown in (<b>F</b>). (<b>G</b>) B19V DNA-positive follicles and vessels in splenic tissue, with a close-up shown in (<b>H</b>).</p>
Full article ">Figure 6
<p>B19V replication in B cells of the spleen. Splenic tissue from patient B was immunohistochemically stained for CD20+ B lymphocytes (<b>A</b>,<b>C</b>,<b>E</b>) and CD3+ T lymphocytes (<b>B</b>,<b>D</b>,<b>F</b>) (visualized in brown). Consecutive radioactive ISH clearly shows the localization of B19V DNA in B cells (black signal) at different magnifications (<b>A</b>–<b>E</b>).</p>
Full article ">Figure 7
<p>B19V DNA/mRNA is present in the germinal centres of secondary lymph follicles and in endothelial cells of small cardiac vessels. (<b>A</b>,<b>B</b>) B19V nucleic acids are detected in lymphatic tissue using sense (B19V sense) and anti-sense (B19V anti-sense) probes in consecutive tissue sections (red signals). (<b>C</b>,<b>D</b>) Corresponding localization of B19V nucleic acids in endothelial cells of small vessels using sense and anti-sense probes in consecutive heart tissue sections (red).</p>
Full article ">
20 pages, 5755 KiB  
Article
The Sigma-1 Receptor Exacerbates Cardiac Dysfunction Induced by Obstructive Nephropathy: A Role for Sexual Dimorphism
by Francisco Javier Munguia-Galaviz, Alejandra Guillermina Miranda-Diaz, Yanet Karina Gutierrez-Mercado, Marco Ku-Centurion, Ricardo Arturo Gonzalez-Gonzalez, Eliseo Portilla-de Buen and Raquel Echavarria
Biomedicines 2024, 12(8), 1908; https://doi.org/10.3390/biomedicines12081908 - 20 Aug 2024
Viewed by 1414
Abstract
The Sigma-1 Receptor (Sigmar1) is a stress-activated chaperone and a promising target for pharmacological modulation due to its ability to induce multiple cellular responses. Yet, it is unknown how Sigmar1 is involved in cardiorenal syndrome type 4 (CRS4) in which renal damage results [...] Read more.
The Sigma-1 Receptor (Sigmar1) is a stress-activated chaperone and a promising target for pharmacological modulation due to its ability to induce multiple cellular responses. Yet, it is unknown how Sigmar1 is involved in cardiorenal syndrome type 4 (CRS4) in which renal damage results in cardiac dysfunction. This study explored the role of Sigmar1 and its ligands in a CRS4 model induced by unilateral ureteral obstruction (UUO) in male and female C57BL/6 mice. We evaluated renal and cardiac dysfunction markers, Sigmar1 expression, and cardiac remodeling through time (7, 12, and 21 days) and after chronically administering the Sigmar1 agonists PRE-084 (1 mg/kg/day) and SA4503 (1 mg/kg/day), and the antagonist haloperidol (2 mg/kg/day), for 21 days after UUO using colorimetric analysis, RT-qPCR, histology, immunohistochemistry, enzyme-linked immunosorbent assay, RNA-seq, and bioinformatics. We found that obstructive nephropathy induces Sigmar1 expression in the kidneys and heart, and that Sigmar1 stimulation with its agonists PRE-084 and SA4503 aggravates cardiac dysfunction and remodeling in both sexes. Still, their effects are significantly more potent in males. Our findings reveal essential differences associated with sex in the development of CRS4 and should be considered when contemplating Sigmar1 as a pharmacological target. Full article
(This article belongs to the Special Issue Sigma-1 Receptor in Health and Disease)
Show Figures

Graphical abstract

Graphical abstract
Full article ">Figure 1
<p>Experimental design. (<b>A</b>) Sham vs. UUO time course (7, 12, and 21 days) in male and female mice. (<b>B</b>) UUO male and female mice treated daily with saline, PRE-084 (1 mg/kg), SA4503 (1 mg/kg), or haloperidol (2 mg/kg), and sacrificed at day 21. Subsequent evaluation of serum, left kidney, and heart was carried out in all groups, N = 5.</p>
Full article ">Figure 2
<p>UUO induces CRS4 development. (<b>A</b>) Representative images of kidneys and hearts from sham and UUO male mice after 21 days. Circulating levels of (<b>B</b>) sCR (mg/dL) and (<b>C</b>) BUN (mg/dL) in male and female mice after sham surgery or UUO (7, 12, and 21 days). Fold-change of renal (<b>D</b>) Ngal and cardiac (<b>E</b>) Anp, (<b>F</b>) Bnp, and (<b>G</b>) Acta2 determined by RT-qPCR and normalized with Gapdh in male and female mice after sham surgery or UUO (7, 12, and 21 days). (<b>H</b>) Representative images of sham and UUO hearts after 21 days stained with Sirius Red (200×, scale bar = 100 μm). (<b>I</b>) Percentage of Sirius Red-positive area in sham and UUO hearts after 21 days. N = 5, * <span class="html-italic">p</span> &lt; 0.05; ** <span class="html-italic">p</span> &lt; 0.01; **** <span class="html-italic">p</span> &lt; 0.0001 vs. sham.</p>
Full article ">Figure 3
<p>UUO elevates Sigmar1 expression in the kidney and heart. (<b>A</b>) Representative images of anti-Sigmar1 IHC kidney sections from sham and UUO (7, 12, and 21 days) mice (200×, scale bar = 100 μm). (<b>B</b>) Percentage of Sigmar1 positive area in sham and UUO (7, 12, and 21 days) kidneys. (<b>C</b>) Fold-change of renal Sigmar1/Gapdh by RT-qPCR in male and female mice after sham surgery or UUO (7, 12, and 21 days). (<b>D</b>) Representative images of anti-Sigmar1 IHC heart sections from sham and UUO (7, 12, and 21 days) mice (200×, scale bar = 100 μm). (<b>E</b>) Percentage of Sigmar1-positive area in sham and UUO (7, 12, and 21 days) hearts. (<b>F</b>) Fold-change of cardiac Sigmar1/Gapdh by RT-qPCR in male and female mice after sham surgery or UUO (7, 12, and 21 days). N = 5, * <span class="html-italic">p</span> &lt; 0.005; ** <span class="html-italic">p</span> &lt; 0.01, *** <span class="html-italic">p</span> &lt; 0.001 vs. sham.</p>
Full article ">Figure 4
<p>Male sex potentiates Sigmar1 effects on renal and cardiac function markers after UUO. Circulating levels of (<b>A</b>) sCR (mg/dL) and (<b>B</b>) BUN (mg/dL) in male and female mice after 21 days of UUO and treatment with saline, PRE-084 (1 mg/kg/day), SA4503 (1 mg/kg/day), and haloperidol (2 mg/kg/day). Fold-change of renal (<b>C</b>) Ngal and cardiac (<b>D</b>) Anp, and (<b>E</b>) Bnp determined by RT-qPCR and normalized with Gapdh in male and female mice after 21 days of UUO and treatment with saline, PRE-084, SA4503, and haloperidol. (<b>F</b>) Renal concentration of FGF-23 (pg/mL) per μg of protein quantified by ELISA in male and female mice after 21 days of UUO and treatment with saline, PRE-084, SA4503, and haloperidol. N = 5, * <span class="html-italic">p</span> &lt; 0.005 vs. saline.</p>
Full article ">Figure 5
<p>Sigmar1 agonists and antagonist potentiate cardiac fibrosis development after UUO. (<b>A</b>) Representative images of cardiac sections stained with Sirius Red (200×, scale bar = 100 μm) after 21 days of UUO and treatment with saline, PRE-084 (1 mg/kg/day), SA4503 (1 mg/kg/day), and haloperidol (2 mg/kg/day). (<b>B</b>) Percentage of Sirius Red-positive area in male and female hearts after 21 days of UUO and treatment with saline, PRE-084, SA4503, and haloperidol. (<b>C</b>) Cardiac Col1a1/Gapdh fold-change by RT-qPCR in male and female mice after 21 days of UUO and treatment with saline, PRE-084, SA4503, and haloperidol. (<b>D</b>) Representative images of anti-Acta2 IHC cardiac sections after 21 days of UUO and treatment with saline, PRE-084, SA4503, and haloperidol (200×, scale bar = 100 μm). (<b>E</b>) Percentage of Acta2-positive area in male and female hearts after 21 days of UUO and treatment with saline, PRE-084, SA4503, and haloperidol. (<b>F</b>) Cardiac Acta2/Gapdh fold-change by RT-qPCR in male and female mice after 21 days of UUO and treatment with saline, PRE-084, SA4503, and haloperidol. (<b>G</b>) Serum TGF-β (pg/mL) quantified by ELISA in male and female mice after 21 days of UUO and treatment with saline, PRE-084, SA4503, and haloperidol. N = 5, * <span class="html-italic">p</span> &lt; 0.005; ** <span class="html-italic">p</span> &lt; 0.01; *** <span class="html-italic">p</span> &lt; 0.001 vs. saline.</p>
Full article ">Figure 6
<p>Sigmar1 expression in the kidneys and heart is modulated by its agonists and antagonists after UUO. (<b>A</b>) Representative images of anti-Sigmar1 IHC kidney sections after 21 days of UUO and treatment with saline, PRE-084 (1 mg/kg/day), SA4503 (1 mg/kg/day), and haloperidol (2 mg/kg/day) (200×, scale bar = 100 μm). (<b>B</b>) Percentage of Sigmar1-positive areas in kidneys of males and females after 21 days of UUO and treatment with saline, PRE-084, SA4503, and haloperidol. (<b>C</b>) Renal Sigmar1/Gapdh fold-change by RT-qPCR after 21 days of UUO and treatment with saline, PRE-084, SA4503, and haloperidol. (<b>D</b>) Representative images of anti-Sigmar1 IHC cardiac sections after 21 days of UUO and treatment with Saline, PRE-084, SA4503, and haloperidol (200×, scale bar = 100 μm). (<b>E</b>) Percentage of Sigmar1-positive areas in male and female hearts after 21 days of UUO and treatment with saline, PRE-084, SA4503, and haloperidol. (<b>F</b>) Cardiac Sigmar1/Gapdh fold-change by RT-qPCR in male and female mice after 21 days of UUO and treatment with saline, PRE-084, SA4503, and haloperidol. N = 5, * <span class="html-italic">p</span> &lt; 0.005; ** <span class="html-italic">p</span> &lt; 0.01 vs. saline.</p>
Full article ">Figure 7
<p>Cardiac DEGs induced by PRE-084 in UUO male mice. (<b>A</b>) Heatmap plot of DEGs in PRE-084-treated male mice for 21 days after UUO surgery. Red = upregulated and blue = downregulated. <span class="html-italic">p</span> &lt; 0.05 and log2 (fold change) &gt; 1. (<b>B</b>) List of most significantly enriched DEGs. (<b>C</b>) Volcano map showing the distribution of cardiac DEGs in PRE-084-treated male mice for 21 days after UUO surgery. N = 3.</p>
Full article ">Figure 8
<p>Enrichment analysis in UUO hearts treated with PRE-084. (<b>A</b>) Enriched GO terms. (<b>B</b>) Scatter plot of the top enriched GO terms. Circle sizes, number of enriched genes per pathway, color, and <span class="html-italic">p</span>-value range. N = 3.</p>
Full article ">
15 pages, 1934 KiB  
Article
Higher Circulating Neutrophil Counts Is Associated with Increased Risk of All-Cause Mortality and Cardiovascular Disease in Patients with Diabetic Kidney Disease
by Ruiyan Xie, David M. Bishai, David T. W. Lui, Paul C. H. Lee and Desmond Y. H. Yap
Biomedicines 2024, 12(8), 1907; https://doi.org/10.3390/biomedicines12081907 - 20 Aug 2024
Cited by 2 | Viewed by 1647
Abstract
Background: Accumulating evidence has suggested the pathogenic roles of chronic inflammation and neutrophils in diabetic kidney disease (DKD). This study investigated the relationship between neutrophils, all-cause, and cardiovascular disease (CVD) mortality in type 2 diabetes mellitus (T2DM) patients with DKD. Methods: We used [...] Read more.
Background: Accumulating evidence has suggested the pathogenic roles of chronic inflammation and neutrophils in diabetic kidney disease (DKD). This study investigated the relationship between neutrophils, all-cause, and cardiovascular disease (CVD) mortality in type 2 diabetes mellitus (T2DM) patients with DKD. Methods: We used data from the National Health and Nutrition Examination Surveys (NHANES) from 2005 to 2020 to investigate the relationship between circulating neutrophils counts, kidney function indices, all-cause, and CVD mortality in adult T2DM patients with DKD. Clinical predictive models and risk scores for long-term mortality were constructed. Results: 44,332 patients [8034 with T2DM and 36,323 without T2DM] were included. Two thousand two hundred twenty patients had DKD, and 775 died (31.5% related to CVD) during a follow-up of 6.18 (range: 5.94–6.42) years. Higher neutrophil counts (Quartile 4, Q4) were associated with increased all-cause and CVD mortality [HR 1.73 (95% CI 1.34–2.25) and 1.81 (95% CI 1.14–2.89), respectively, p < 0.0001 and 0.01]. Neutrophil counts in Q4 showed a positive correlation with urine albumin-creatinine ratio (UACR) but a negative association with eGFR (p < 0.01 for all). Clinical predictive models incorporating neutrophil counts showed satisfactory performance in forecasting 5-year and 10-year CVD mortality-free survival (ROC AUC 0.824 and 0.842, respectively), and the nomogram-predicted survival demonstrated good concordance with observed survival. Conclusions: Higher levels of circulating neutrophil counts show a significant correlation with renal abnormalities and higher all-cause and CVD mortality in T2DM patients with DKD. The novel clinical predictive models and risk scores incorporating neutrophil counts may facilitate stratification and, hence, risk factor management in DKD patients. Full article
(This article belongs to the Section Endocrinology and Metabolism Research)
Show Figures

Figure 1

Figure 1
<p>The flow chart of this study.</p>
Full article ">Figure 2
<p>Dose-response relationship between circulating neutrophil counts of DKD patients and (<b>A</b>) CVD mortality and (<b>B</b>) all-cause mortality. Adjusted for age, sex, race, smoking, alcohol use, hypertension, hyperlipidemia, eGFR, and UACR in a logistic regression with the RCS model. The shaded area represents the estimated relative risk and the 95% CI. The vertical line represents cut-off value, and the horizontal dashed line represents reference line of no association is indicated at a hazard ration of 1.0. CI, confidence interval. <span class="html-italic">p</span> non-linearity = 0.0029 (CVD mortality) and 0.0000 (all-cause mortality), respectively.</p>
Full article ">Figure 3
<p>Clinical predictive models for long-term CVD mortality-free survival among individuals with DKD. (<b>A</b>) Nomogram for predicting 5- and 10-year CVD mortality-free survival between DKD patients in the development cohort. ROC curves of the predictive nomogram in (<b>B</b>) development and (<b>C</b>) validation cohorts. Q1, Quartile 1; Q2, Quartile 2; Q3, Quartile 3; Q4, Quartile 4.</p>
Full article ">Figure 4
<p>CVD-free mortality in patients with diabetic kidney disease according to risk scores and baseline neutrophils counts. (<b>A</b>,<b>B</b>) Development cohort and (<b>C</b>,<b>D</b>) Validation cohort.</p>
Full article ">Figure 5
<p>Survival is free of (<b>A</b>) cardiovascular disease mortality and (<b>B</b>) all-cause mortality in diabetic kidney disease patients with different quartiles of neutrophil counts.</p>
Full article ">
33 pages, 943 KiB  
Review
Growth Factors and Their Application in the Therapy of Hereditary Neurodegenerative Diseases
by Shaza Issa, Haidar Fayoud, Alisa Shaimardanova, Albert Sufianov, Galina Sufianova, Valeriya Solovyeva and Albert Rizvanov
Biomedicines 2024, 12(8), 1906; https://doi.org/10.3390/biomedicines12081906 - 20 Aug 2024
Cited by 2 | Viewed by 1871
Abstract
Hereditary neurodegenerative diseases (hNDDs) such as Alzheimer’s, Parkinson’s, Huntington’s disease, and others are primarily characterized by their progressive nature, severely compromising both the cognitive and motor abilities of patients. The underlying genetic component in hNDDs contributes to disease risk, creating a complex genetic [...] Read more.
Hereditary neurodegenerative diseases (hNDDs) such as Alzheimer’s, Parkinson’s, Huntington’s disease, and others are primarily characterized by their progressive nature, severely compromising both the cognitive and motor abilities of patients. The underlying genetic component in hNDDs contributes to disease risk, creating a complex genetic landscape. Considering the fact that growth factors play crucial roles in regulating cellular processes, such as proliferation, differentiation, and survival, they could have therapeutic potential for hNDDs, provided appropriate dosing and safe delivery approaches are ensured. This article presents a detailed overview of growth factors, and explores their therapeutic potential in treating hNDDs, emphasizing their roles in neuronal survival, growth, and synaptic plasticity. However, challenges such as proper dosing, delivery methods, and patient variability can hinder their clinical application. Full article
(This article belongs to the Special Issue Neurodegenerative Diseases: From Mechanisms to Therapeutic Approaches)
Show Figures

Figure 1

Figure 1
<p>This figure summarizes GF-based gene therapy approaches for hNDDs covered in this review. Purified Recombinant Protein: This approach involves obtaining and directly administering purified recombinant GFs (e.g., BDNF, GDNF, IGF-1, NGF, FGF-2, CNTF, and TGF-β1) to the target cells. Growth Factor-Releasing Genetically Modified Cells: involves the utilization of cells (e.g., mesenchymal stem cells, fibroblasts, bone marrow stromal cells, macrophages) genetically engineered to release GFs like BDNF, HGF, NGF, and GDNF. Delivery of Growth Factor Gene: This involves the delivery of genes encoding GFs directly to target areas using viral vectors (e.g., AAV and HSV) in order to enable the patient’s own cells to produce the necessary GFs, such as BDNF, GDNF, VEGF-A, and CNTF, providing a sustained therapeutic effect. Activation of the Expression of Growth Factor: Using pharmacological agents or small molecules to enhance the endogenous expression of GFs (e.g., CNTF and TGF-β1) within the target cells. Delivery of Growth Factor Mimetic: Employing mimetics, i.e., synthetic molecules designed to mimic the biological activity of natural GFs. These mimetics bind to and activate GF receptors, such as IGF-1 mimetics, providing neuroprotective effects similar to endogenous factors.</p>
Full article ">
18 pages, 1647 KiB  
Article
High Expression of AhR and Environmental Pollution as AhR-Linked Ligands Impact on Oncogenic Signaling Pathways in Western Patients with Gastric Cancer—A Pilot Study
by Martine Perrot-Applanat, Cynthia Pimpie, Sophie Vacher, Marc Pocard and Véronique Baud
Biomedicines 2024, 12(8), 1905; https://doi.org/10.3390/biomedicines12081905 - 20 Aug 2024
Cited by 1 | Viewed by 1372
Abstract
The vast majority of gastric cancer (GC) cases are adenocarcinomas including intestinal and diffuse GC. The incidence of diffuse GC, often associated with poor overall survival, has constantly increased in Western countries. Epidemiological studies have reported increased mortality from GC after occupational exposure [...] Read more.
The vast majority of gastric cancer (GC) cases are adenocarcinomas including intestinal and diffuse GC. The incidence of diffuse GC, often associated with poor overall survival, has constantly increased in Western countries. Epidemiological studies have reported increased mortality from GC after occupational exposure to pro-carcinogens that are metabolically activated by cytochrome P450 enzymes through aryl hydrocarbon receptor (AhR). However, little is known about the role of AhR and environmental AhR ligands in diffuse GC as compared to intestinal GC in Western patients. In a cohort of 29, we demonstrated a significant increase in AhR protein and mRNA expression levels in GCs independently of their subtypes and clinical parameters. AhR and RHOA mRNA expression were correlated in diffuse GC. Further, our study aimed to characterize in GC how AhR and the AhR-related genes cytochrome P450 1A1 (CYP1A1) and P450 1B1 (CYP1B1) affect the mRNA expression of a panel of genes involved in cancer development and progression. In diffuse GC, CYP1A1 expression correlated with genes involved in IGF signaling, epithelial–mesenchymal transition (Vimentin), and migration (MMP2). Using the poorly differentiated KATO III epithelial cell line, two well-known AhR pollutant ligands, namely 2-3-7-8 tetrachlorodibenzo-p-dioxin (TCDD) and benzo[a]pyrene (BaP), strongly increased the expression of CYP1A1 and Interleukin1β (IL1B), and to a lesser extend UGT1, NQO1, and AhR Repressor (AhRR). Moreover, the increased expression of CYP1B1 was seen in diffuse GC, and IHC staining indicated that CYP1B1 is mainly expressed in stromal cells. TCDD treatment increased CYP1B1 expression in KATO III cells, although at lower levels as compared to CYP1A1. In intestinal GC, CYP1B1 expression is inversely correlated with several cancer-related genes such as IDO1, a gene involved in the early steps of tryptophan metabolism that contributes to the endogenous AhR ligand kynurenine expression. Altogether, our data provide evidence for a major role of AhR in GC, as an environmental xenobiotic receptor, through different mechanisms and pathways in diffuse and intestinal GC. Our results support the continued efforts to clarify the identity of exogenous AhR ligands in diffuse GC in order to define new therapeutic strategies. Full article
Show Figures

Figure 1

Figure 1
<p>Immunohistochemical staining of AhR and CYP1B1 in peritumoral and diffuse GCs. AhR in peritumoral gastric tissue (<b>A</b>); weak cytoplasmic and/or nuclear staining were observed in glandular tissue and stroma. In tumoral tissue (<b>B</b>,<b>D</b>), strong AhR immunostaining is observed in most cells, both epithelial and stromal compartments. CYP1B1 (<b>C</b>) and AhR (<b>D</b>) immunostaining are shown on the same tumor (diffuse GC). CYP1B1 was mainly observed in the stromal compartment in diffuse GC (<b>C</b>). Original magnification ×20. Bar scale, 500 μm.</p>
Full article ">Figure 2
<p>mRNA expression levels of AhR and AhR-related genes in KATO III and AGS gastric cells upon treatment with either TCDD or BaP. (<b>a</b>) The KATO III cells were cultivated in the absence (Ctrl) or presence of either TCDD (dioxin) 30 nM or BaP (10 µM) for 16 h. The cells were incubated with (gray column) or without (black column) CHH223191 (10 μM). The expression of the indicated genes was determined by qRT-PCR. All the experiments were performed in triplicate. The results are expressed as means +/− S.E.M and normalized so that the mean of the control cells was 1. * <span class="html-italic">p</span> value &lt; 0.005, ** <span class="html-italic">p</span> value &lt; 0.01; *** <span class="html-italic">p</span> value &lt; 0.001; **** <span class="html-italic">p</span> value &lt; 0.0001. (<b>b</b>) The KATO III cells were cultivated in the presence or absence of dioxin at the indicated concentrations. The expression levels of <span class="html-italic">CYP1A1</span> and <span class="html-italic">CYP1B1</span> were determined by qRT-PCR in the same experiment. The results were expressed as in (<b>a</b>). (<b>c</b>) The AGS cells were cultivated in the absence (Ctrl in black) or presence of (dioxin) (0.01–10 nM, in gray). The expression levels of the indicated genes were determined by qRT-PCR in the same experiment. All the experiments were performed in triplicate. The results were expressed as in (<b>a</b>).</p>
Full article ">Figure 3
<p>AhR role in cancer biology; environmental compounds at the crossroads of toxicity and several signaling pathways.</p>
Full article ">
25 pages, 1837 KiB  
Review
Gas Chromatography–Mass Spectrometry-Based Analyses of Fecal Short-Chain Fatty Acids (SCFAs): A Summary Review and Own Experience
by Paweł Czarnowski, Michał Mikula, Jerzy Ostrowski and Natalia Żeber-Lubecka
Biomedicines 2024, 12(8), 1904; https://doi.org/10.3390/biomedicines12081904 - 20 Aug 2024
Cited by 3 | Viewed by 2424
Abstract
The gut microbiome, crucial to human health, changes with age and disease, and influences metabolic profiles. Gut bacteria produce short-chain fatty acids (SCFAs), essential for maintaining homeostasis and modulating inflammation. Dysbiosis, commonly due to poor diet or lifestyle, disrupts the integrity of the [...] Read more.
The gut microbiome, crucial to human health, changes with age and disease, and influences metabolic profiles. Gut bacteria produce short-chain fatty acids (SCFAs), essential for maintaining homeostasis and modulating inflammation. Dysbiosis, commonly due to poor diet or lifestyle, disrupts the integrity of the intestinal barrier and may contribute to conditions such as obesity, diabetes, and non-alcoholic fatty liver disease (NAFLD). Analytical methods such as gas chromatography–mass spectrometry (GC/MS) are vital for SCFA analysis, with various preparation and storage techniques improving the accuracy. Advances in these methods have improved the reliability and sensitivity of SCFA quantification, which is crucial for the identification of disease biomarkers. Evidence from GC/MS-based studies has revealed that accurate SCFA quantification requires meticulous sample preparation and handling. The process begins with the extraction of SCFAs from biological samples using methods such as direct solvent extraction or solid-phase microextraction (SPME), both of which require optimization for maximum recovery. Derivatization, which chemically modifies SCFAs to enhance volatility and detectability, is a crucial step, typically involving esterification or silylation. Following this, the cleanup process removes impurities that might interfere with the analysis. Although recent advances in GC/MS technology have significantly improved SCFA-detection sensitivity and specificity, proper sample storage, with acid preservatives and the avoidance of repeated thawing, is essential for maintaining SCFA integrity. Full article
Show Figures

Figure 1

Figure 1
<p>Gut–microbiome relationship. Higher consumption of processed food lowers microbial α-diversity, characteristic of dysbiosis, and increases the intake of processed food. SCFAs (acetate, propionate, butyrate) are produced by fermenting dietary fiber and resistant starch. Key SCFA producers include <span class="html-italic">Clostridium</span>, <span class="html-italic">Roseburia</span> and <span class="html-italic">Faecalibacterium</span>. SCFAs regulate appetite, energy homeostasis and the integrity of the intestinal barrier, altering mineral bioavailability and the metabolism of glucose, lipids and cholesterol. Dysbiosis increases intestinal permeability, allowing harmful compounds to enter the bloodstream, disrupting the gut–liver axis and immune response, and altered SCFA levels contribute to conditions such as obesity, IBS, IBD, colon cancer, celiac disease and NAFLD. Created with BioRender.com (accessed on 17 July 2024).</p>
Full article ">Figure 2
<p>Development of metabolic syndromes through obesity. The prevalence of obesity and related metabolic disorders is increasing due to unhealthy lifestyles, lack of exercise and an excessive intake of empty calories. This causes insulin resistance and may lead to type 2 diabetes. The WHO estimates that 1 in 8 people worldwide is obese, with adult obesity more than doubling since 1990. Up to 75% of obese adults and 50% of obese children develop metabolic disorders. Created with BioRender.com (accessed on 15 July 2024).</p>
Full article ">Figure 3
<p>Sample preparation for GC/MS analysis in our protocol. Created with BioRender.com (accessed on 17 July 2024).</p>
Full article ">
12 pages, 1767 KiB  
Article
The Relationship between Circulating Kidney Injury Molecule-1 and Cardiovascular Morbidity and Mortality in Hemodialysis Patients
by Alexandru Florin Sircuța, Iulia Dana Grosu, Adalbert Schiller, Ligia Petrica, Viviana Ivan, Oana Schiller, Madalina Bodea, Monica-Nicoleta Mircea, Ionuţ Goleț and Flaviu Bob
Biomedicines 2024, 12(8), 1903; https://doi.org/10.3390/biomedicines12081903 - 20 Aug 2024
Viewed by 1004
Abstract
Background: The importance of identifying mortality biomarkers in chronic kidney disease (CKD), and especially in patients treated with hemodialysis (HD), has become evident. In addition to being a marker of tubulointerstitial injury, plasma kidney injury molecule-1 (KIM-1) has been mentioned in regard to [...] Read more.
Background: The importance of identifying mortality biomarkers in chronic kidney disease (CKD), and especially in patients treated with hemodialysis (HD), has become evident. In addition to being a marker of tubulointerstitial injury, plasma kidney injury molecule-1 (KIM-1) has been mentioned in regard to HD patients as a risk marker for cardiovascular (CV) mortality and coronary artery calcification. The aim of this study was to assess the level of plasma KIM-1 as a marker of cardiovascular disease (CVD) and mortality in CKD5-HD patients (patients with CKD stage G5D treated with hemodialysis). Methods: We conducted a prospective case–control study that included 63 CKD5-HD patients (HD for 1–5 years) followed up for 48 months and a control group consisting of 52 non-dialysis patients diagnosed with CKD stages G1-G5 (ND-CKD). All patients had a CVD baseline assessment including medical history, echocardiography, and electrocardiography (ECG). Circulating plasma KIM-1 levels were determined with single-molecule counting immunoassay technology using an enzyme-linked immunosorbent assay. We obtained the following parameters: serum creatinine and urea; the inflammation markers CRP (C-reactive protein) and IL-6 (interleukin-6); and the anemia markers complete blood count, serum ferritin, and transferrin saturation (TSAT). Results: The mean plasma KIM-1 level was 403.8 ± 546.8 pg/mL, showing a statistically significant correlation with inflammation (CRP, R = 0.28, p = 0.02; IL-6, R = 0.36, p = 0.005) and with anemia (hematocrit, R = −0.5, p = −0.0316; hemoglobin (Hb), R = −0.5, p = 0.02). We found that patients with left ventricular hypertrophy (LVH) on echocardiography (59.7%) had significantly lower mean levels of plasma KIM-1 than patients from the control group (155.51 vs. 432.12 pg/mL; p = 0.026). Regarding the patients’ follow-up, we assessed all-cause mortality as an endpoint. After 24 months of follow-up, we found a mortality rate of 22.23%, while after 48 months, the mortality rate was 50.73%. A plasma KIM-1 level < 82.98 pg/mL was significantly associated with decreased survival in hemodialysis patients (p < 0.001). Conclusions: In patients treated with hemodialysis, low levels of plasma KIM-1 were associated with cardiovascular changes and an increased risk of mortality. Plasma KIM-1 levels were significantly higher in HD patients compared to ND-CKD patients. Full article
(This article belongs to the Section Molecular and Translational Medicine)
Show Figures

Figure 1

Figure 1
<p>(<b>a</b>) Plasma KIM-1 levels in patients with and without left ventricular hypertrophy on echocardiography; (<b>b</b>) plasma KIM-1 levels in patients with and without valvular calcifications on echocardiography.</p>
Full article ">Figure 2
<p>Survival probability of the HD patients.</p>
Full article ">Figure 3
<p>(<b>a</b>) Cox regression analysis of the influence of plasma KIM-1 on survival of HD patients; (<b>b</b>) Cox regression analysis of the quartiles of plasma KIM-1 levels.</p>
Full article ">Figure 4
<p>(<b>a</b>) Cox regression analysis of the influence of plasma IL-6 on survival of patients treated with hemodialysis; (<b>b</b>) Cox regression analysis of the influence of plasma CRP on survival of HD patients.</p>
Full article ">Figure 5
<p>Multivariate analysis (hazard regression plot, 95% confidence intervals) of the influence of age, plasma KIM-1, CRP, and IL-6 on survival of HD patients.</p>
Full article ">
Previous Issue
Back to TopTop