[go: up one dir, main page]

Next Issue
Volume 9, April-1
Previous Issue
Volume 9, March-1


Mathematics, Volume 9, Issue 6 (March-2 2021) – 114 articles

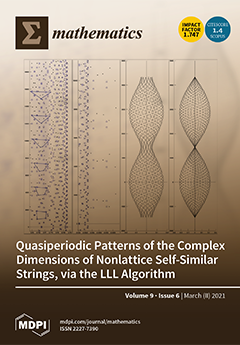
Cover Story (view full-size image): The diagrams show polygons tracking the quasiperiodic patterns of complex dimensions and the deviations from the approximations. They also show phase transitions with smaller horizontal deviations and new mysterious structures of complex dimensions. View this paper.
  • Issues are regarded as officially published after their release is announced to the table of contents alert mailing list.
  • You may sign up for e-mail alerts to receive table of contents of newly released issues.
  • PDF is the official format for papers published in both, html and pdf forms. To view the papers in pdf format, click on the "PDF Full-text" link, and use the free Adobe Reader to open them.
Order results
Result details
Section
Select all
Export citation of selected articles as:
10 pages, 5623 KiB  
Article
Can Artificial Neural Networks Predict the Survival Capacity of Mutual Funds? Evidence from Spain
by Laura Fabregat-Aibar, Maria-Teresa Sorrosal-Forradellas, Glòria Barberà-Mariné and Antonio Terceño
Mathematics 2021, 9(6), 695; https://doi.org/10.3390/math9060695 - 23 Mar 2021
Viewed by 1840
Abstract
Recently, the total net assets of mutual funds have increased considerably and turned them into one of the main investment instruments. Despite this increment, every year a considerable number of funds disappear. The main purpose of this paper is to determine if the [...] Read more.
Recently, the total net assets of mutual funds have increased considerably and turned them into one of the main investment instruments. Despite this increment, every year a considerable number of funds disappear. The main purpose of this paper is to determine if the neural networks can be a valid instrument to detect the survival capacity of a fund, using the traditional variables linked to the literature of disappearance funds: age, size, performance and volatility. This paper also incorporates annualized variation in return and the Sharpe ratio as variables. The data used is a sample of Spanish mutual funds during 2018 and 2019. The results show that the network correctly classifies funds into surviving and non-surviving with a total error of 13%. Moreover, it shows that not all variables are significant to determine the survival capacity of a fund. The results indicate that surviving and non-surviving funds differ in variables related to performance and its variation, volatility and the Sharpe ratio. However, age and size are not significant variables. As a conclusion, the neural network correctly predicts the 87% of survival capacity of mutual funds. Therefore, this methodology can be used to classify this financial instrument according to its survival or disappearance. Full article
(This article belongs to the Special Issue Mathematics of Financial Operations)
Show Figures

Figure 1

Figure 1
<p>Evolution of the number of non-surviving funds in the Spanish market, 1985–2019.</p>
Full article ">Figure 2
<p>Self Organizing Maps (SOM) for Spanish mutual funds.</p>
Full article ">Figure 3
<p>Map of features (The scale of values next to each map shows the rank of values which are taken by the representative patterns of all the mutual funds located in one cell).</p>
Full article ">
13 pages, 829 KiB  
Article
Geometrically Constructed Family of the Simple Fixed Point Iteration Method
by Vinay Kanwar, Puneet Sharma, Ioannis K. Argyros, Ramandeep Behl, Christopher Argyros, Ali Ahmadian and Mehdi Salimi
Mathematics 2021, 9(6), 694; https://doi.org/10.3390/math9060694 - 23 Mar 2021
Cited by 5 | Viewed by 3593
Abstract
This study presents a new one-parameter family of the well-known fixed point iteration method for solving nonlinear equations numerically. The proposed family is derived by implementing approximation through a straight line. The presence of an arbitrary parameter in the proposed family improves convergence [...] Read more.
This study presents a new one-parameter family of the well-known fixed point iteration method for solving nonlinear equations numerically. The proposed family is derived by implementing approximation through a straight line. The presence of an arbitrary parameter in the proposed family improves convergence characteristic of the simple fixed point iteration as it has a wider domain of convergence. Furthermore, we propose many two-step predictor–corrector iterative schemes for finding fixed points, which inherit the advantages of the proposed fixed point iterative schemes. Finally, several examples are given to further illustrate their efficiency. Full article
Show Figures

Figure 1

Figure 1
<p>The graph of approximate nonlinear function <math display="inline"><semantics> <mrow> <mi>y</mi> <mo>=</mo> <mi>ϕ</mi> <mo>(</mo> <mi>x</mi> <mo>)</mo> </mrow> </semantics></math> by a linear approximation.</p>
Full article ">
27 pages, 418 KiB  
Article
Counting Hamiltonian Cycles in 2-Tiled Graphs
by Alen Vegi Kalamar, Tadej Žerak and Drago Bokal
Mathematics 2021, 9(6), 693; https://doi.org/10.3390/math9060693 - 23 Mar 2021
Cited by 6 | Viewed by 2193
Abstract
In 1930, Kuratowski showed that K3,3 and K5 are the only two minor-minimal nonplanar graphs. Robertson and Seymour extended finiteness of the set of forbidden minors for any surface. Širáň and Kochol showed that there are infinitely many k [...] Read more.
In 1930, Kuratowski showed that K3,3 and K5 are the only two minor-minimal nonplanar graphs. Robertson and Seymour extended finiteness of the set of forbidden minors for any surface. Širáň and Kochol showed that there are infinitely many k-crossing-critical graphs for any k2, even if restricted to simple 3-connected graphs. Recently, 2-crossing-critical graphs have been completely characterized by Bokal, Oporowski, Richter, and Salazar. We present a simplified description of large 2-crossing-critical graphs and use this simplification to count Hamiltonian cycles in such graphs. We generalize this approach to an algorithm counting Hamiltonian cycles in all 2-tiled graphs, thus extending the results of Bodroža-Pantić, Kwong, Doroslovački, and Pantić. Full article
Show Figures

Figure 1

Figure 1
<p>Two pictures of <math display="inline"><semantics> <msub> <mi>V</mi> <mn>10</mn> </msub> </semantics></math>. In general, <math display="inline"><semantics> <msub> <mi>V</mi> <mrow> <mn>2</mn> <mi>n</mi> </mrow> </msub> </semantics></math> is obtained from a <math display="inline"><semantics> <mrow> <mn>2</mn> <mi>n</mi> </mrow> </semantics></math>-cycle by adding the <span class="html-italic">n</span> main diagonals.</p>
Full article ">Figure 2
<p>Two available frames.</p>
Full article ">Figure 3
<p>Thirteen available pictures to insert into a frame.</p>
Full article ">Figure 4
<p>Demonstration of creation of tiles from <math display="inline"><semantics> <mi mathvariant="script">S</mi> </semantics></math>.</p>
Full article ">Figure 5
<p>Example for <math display="inline"><semantics> <mrow> <mi>m</mi> <mo>=</mo> <mn>1</mn> </mrow> </semantics></math>. For <math display="inline"><semantics> <mrow> <mi mathvariant="script">T</mi> <mo>=</mo> <mo>(</mo> <msub> <mi>T</mi> <mn>0</mn> </msub> <mo>,</mo> <msub> <mi>T</mi> <mn>1</mn> </msub> <mo>,</mo> <msub> <mi>T</mi> <mn>2</mn> </msub> <mo>)</mo> </mrow> </semantics></math>, <math display="inline"><semantics> <mrow> <mi>G</mi> <mo>=</mo> <mo>∘</mo> <mo>(</mo> <msup> <mrow> <mo>(</mo> <mo>⊗</mo> <mi mathvariant="script">T</mi> <mo>)</mo> </mrow> <mo>↕</mo> </msup> <mo>)</mo> </mrow> </semantics></math> is shown. When appropriate white vertices are identified, they are suppressed (see [<a href="#B8-mathematics-09-00693" class="html-bibr">8</a>] for details).</p>
Full article ">Figure 6
<p>Alphabet letters describing top paths in tiles from <math display="inline"><semantics> <mi mathvariant="script">S</mi> </semantics></math>.</p>
Full article ">Figure 7
<p>Additional letter <span class="html-italic">H</span> is used to describe one special picture. In this case, <math display="inline"><semantics> <mrow> <msub> <mi>P</mi> <mi>t</mi> </msub> <mo>=</mo> <mi>H</mi> <mo>,</mo> <mi>I</mi> <mi>d</mi> <mo>=</mo> <mo>∅</mo> <mo>,</mo> <msub> <mi>P</mi> <mi>b</mi> </msub> <mo>=</mo> <mo>∅</mo> </mrow> </semantics></math>.</p>
Full article ">Figure 8
<p>On the left side, <math display="inline"><semantics> <mrow> <mi>I</mi> <mi>d</mi> <mo>=</mo> <mi>I</mi> </mrow> </semantics></math>; on the right side, <math display="inline"><semantics> <mrow> <mi>I</mi> <mi>d</mi> <mo>=</mo> <mo>∅</mo> </mrow> </semantics></math>.</p>
Full article ">Figure 9
<p>Alphabet letters describing bottom paths in tiles from <math display="inline"><semantics> <mi mathvariant="script">S</mi> </semantics></math>.</p>
Full article ">Figure 10
<p>Alphabet letters describing frames.</p>
Full article ">Figure 11
<p>Transformation of frames. In transformed frames, white vertices are the left wall vertices and gray vertices are the right wall vertices of a 2-tile.</p>
Full article ">Figure 12
<p>Graph <span class="html-italic">G</span> from <a href="#mathematics-09-00693-f005" class="html-fig">Figure 5</a> can be obtained using modified tiles <math display="inline"><semantics> <mrow> <msub> <mi>T</mi> <mn>0</mn> </msub> <mo>,</mo> <msub> <mi>T</mi> <mn>1</mn> </msub> <mo>,</mo> <msub> <mi>T</mi> <mn>2</mn> </msub> </mrow> </semantics></math>. The signature of this graph is <math display="inline"><semantics> <mrow> <mi>s</mi> <mi>i</mi> <mi>g</mi> <mo>(</mo> <mi>G</mi> <mo>)</mo> <mo>=</mo> <mi>D</mi> <mi>V</mi> <mi>d</mi> <mi>L</mi> <mspace width="4pt"/> <mi>H</mi> <mi>d</mi> <mi>L</mi> <mspace width="4pt"/> <mi>D</mi> <mi>D</mi> <mi>L</mi> </mrow> </semantics></math>. Later in Example 1, we show that the total number of Hamiltonian cycles in <span class="html-italic">G</span> is 224.</p>
Full article ">Figure 13
<p>(<b>a</b>) Drawing of <math display="inline"><semantics> <mrow> <msub> <mi>T</mi> <mi>i</mi> </msub> <mo>⊗</mo> <mrow> <msup> <mrow/> <mo>↕</mo> </msup> <msubsup> <mi>T</mi> <mrow> <mi>i</mi> <mo>+</mo> <mn>1</mn> </mrow> <mo>↕</mo> </msubsup> </mrow> </mrow> </semantics></math>, where <math display="inline"><semantics> <mrow> <mi>s</mi> <mi>i</mi> <mi>g</mi> <msub> <mrow> <mo>(</mo> <msub> <mi>T</mi> <mi>i</mi> </msub> <mo>)</mo> </mrow> <mrow> <mi>F</mi> <mi>r</mi> </mrow> </msub> <mo>=</mo> <mi>d</mi> <mi>L</mi> </mrow> </semantics></math>. White vertices are right wall vertices of tile <math display="inline"><semantics> <msub> <mi>T</mi> <mi>i</mi> </msub> </semantics></math> and left wall vertices of tile <math display="inline"><semantics> <msub> <mi>T</mi> <mrow> <mi>i</mi> <mo>+</mo> <mn>1</mn> </mrow> </msub> </semantics></math>. (<b>b</b>) Dotted arrows show the only possible combination for <math display="inline"><semantics> <msubsup> <mi>a</mi> <mrow> <mo>]</mo> <mo>[</mo> </mrow> <mrow> <mi>i</mi> <mo>,</mo> <mi>i</mi> <mo>+</mo> <mn>1</mn> </mrow> </msubsup> </semantics></math>.</p>
Full article ">Figure 14
<p>(<b>a</b>) Drawing of <math display="inline"><semantics> <mrow> <msub> <mi>T</mi> <mi>i</mi> </msub> <mo>⊗</mo> <mrow> <msup> <mrow/> <mo>↕</mo> </msup> <msubsup> <mi>T</mi> <mrow> <mi>i</mi> <mo>+</mo> <mn>1</mn> </mrow> <mo>↕</mo> </msubsup> </mrow> </mrow> </semantics></math>, where <math display="inline"><semantics> <mrow> <mi>s</mi> <mi>i</mi> <mi>g</mi> <msub> <mrow> <mo>(</mo> <msub> <mi>T</mi> <mi>i</mi> </msub> <mo>)</mo> </mrow> <mrow> <mi>F</mi> <mi>r</mi> </mrow> </msub> <mo>=</mo> <mi>L</mi> </mrow> </semantics></math>. White vertices are right wall vertices of tile <math display="inline"><semantics> <msub> <mi>T</mi> <mi>i</mi> </msub> </semantics></math> and left wall vertices of tile <math display="inline"><semantics> <msub> <mi>T</mi> <mrow> <mi>i</mi> <mo>+</mo> <mn>1</mn> </mrow> </msub> </semantics></math>. (<b>b</b>) Dotted and dashed arrows show two possible combinations for <math display="inline"><semantics> <msubsup> <mi>a</mi> <mrow> <mo>]</mo> <mo>[</mo> </mrow> <mrow> <mi>i</mi> <mo>,</mo> <mi>i</mi> <mo>+</mo> <mn>1</mn> </mrow> </msubsup> </semantics></math>.</p>
Full article ">
11 pages, 408 KiB  
Article
Grading Investment Diversification Options in Presence of Non-Historical Financial Information
by Clara Calvo, Carlos Ivorra, Vicente Liern and Blanca Pérez-Gladish
Mathematics 2021, 9(6), 692; https://doi.org/10.3390/math9060692 - 23 Mar 2021
Cited by 1 | Viewed by 1692
Abstract
Modern portfolio theory deals with the problem of selecting a portfolio of financial assets such that the expected return is maximized for a given level of risk. The forecast of the expected individual assets’ returns and risk is usually based on their historical [...] Read more.
Modern portfolio theory deals with the problem of selecting a portfolio of financial assets such that the expected return is maximized for a given level of risk. The forecast of the expected individual assets’ returns and risk is usually based on their historical returns. In this work, we consider a situation in which the investor has non-historical additional information that is used for the forecast of the expected returns. This implies that there is no obvious statistical risk measure any more, and it poses the problem of selecting an adequate set of diversification constraints to mitigate the risk of the selected portfolio without losing the value of the non-statistical information owned by the investor. To address this problem, we introduce an indicator, the historical reduction index, measuring the expected reduction of the expected return due to a given set of diversification constraints. We show that it can be used to grade the impact of each possible set of diversification constraints. Hence, the investor can choose from this gradation, the set better fitting his subjective risk-aversion level. Full article
(This article belongs to the Special Issue Application of Mathematical Methods in Financial Economics)
Show Figures

Figure 1

Figure 1
<p>An instance of a historical frontier, a resulting curve, and a true frontier.</p>
Full article ">Figure 2
<p>True returns <math display="inline"><semantics> <mrow> <msubsup> <mi>r</mi> <mi>j</mi> <mn>1</mn> </msubsup> <mrow> <mo>(</mo> <msubsup> <mi>S</mi> <mn>0</mn> <mrow> <mi>s</mi> <mi>d</mi> </mrow> </msubsup> <mo>,</mo> <mi>α</mi> <mo>)</mo> </mrow> </mrow> </semantics></math> for <math display="inline"><semantics> <mrow> <mi>j</mi> <mo>=</mo> <mn>1</mn> <mo>,</mo> <mo>…</mo> <mo>,</mo> <mn>50</mn> </mrow> </semantics></math>.</p>
Full article ">Figure 3
<p>Relative values <math display="inline"><semantics> <mrow> <msubsup> <mi>V</mi> <mi>r</mi> <mi>k</mi> </msubsup> <mrow> <mo>(</mo> <msubsup> <mi>S</mi> <mn>0</mn> <mrow> <mi>s</mi> <mi>d</mi> </mrow> </msubsup> <mo>,</mo> <mi>α</mi> <mo>)</mo> </mrow> </mrow> </semantics></math> for <math display="inline"><semantics> <mrow> <mi>k</mi> <mo>=</mo> <mn>1</mn> <mo>,</mo> <mo>…</mo> <mo>,</mo> <mn>12</mn> </mrow> </semantics></math>.</p>
Full article ">Figure 4
<p>Mean values <math display="inline"><semantics> <mrow> <msub> <mover accent="true"> <mi>V</mi> <mo>¯</mo> </mover> <mi>a</mi> </msub> <mrow> <mo>(</mo> <mi>α</mi> <mo>)</mo> </mrow> </mrow> </semantics></math> (top-most curve) and <math display="inline"><semantics> <mrow> <msub> <mover accent="true"> <mi>V</mi> <mo>¯</mo> </mover> <mi>r</mi> </msub> <mrow> <mo>(</mo> <msubsup> <mi>S</mi> <mi>j</mi> <mrow> <mi>s</mi> <mi>d</mi> </mrow> </msubsup> <mo>,</mo> <mi>α</mi> <mo>)</mo> </mrow> </mrow> </semantics></math> for <math display="inline"><semantics> <mrow> <mi>j</mi> <mo>=</mo> <mn>0</mn> <mo>,</mo> <mo>…</mo> <mo>,</mo> <mn>6</mn> </mrow> </semantics></math>.</p>
Full article ">Figure 5
<p>HRI<math display="inline"><semantics> <msubsup> <mrow/> <mrow> <msubsup> <mi>S</mi> <mi>j</mi> <mrow> <mi>s</mi> <mi>d</mi> </mrow> </msubsup> </mrow> <mi>α</mi> </msubsup> </semantics></math> for <math display="inline"><semantics> <mrow> <mi>j</mi> <mo>=</mo> <mn>0</mn> <mo>,</mo> <mo>…</mo> <mo>,</mo> <mn>6</mn> </mrow> </semantics></math>.</p>
Full article ">Figure 6
<p>HRI<math display="inline"><semantics> <msubsup> <mrow/> <mrow> <msubsup> <mi>S</mi> <mi>j</mi> <mi>c</mi> </msubsup> </mrow> <mi>α</mi> </msubsup> </semantics></math> for <math display="inline"><semantics> <mrow> <mi>j</mi> <mo>=</mo> <mn>1</mn> <mo>,</mo> <mo>…</mo> <mo>,</mo> <mn>9</mn> <mo>.</mo> </mrow> </semantics></math></p>
Full article ">
27 pages, 6963 KiB  
Article
Evaluation Procedures for Forecasting with Spatiotemporal Data
by Mariana Oliveira, Luís Torgo and Vítor Santos Costa
Mathematics 2021, 9(6), 691; https://doi.org/10.3390/math9060691 - 23 Mar 2021
Cited by 12 | Viewed by 3641
Abstract
The increasing use of sensor networks has led to an ever larger number of available spatiotemporal datasets. Forecasting applications using this type of data are frequently motivated by important domains such as environmental monitoring. Being able to properly assess the performance of different [...] Read more.
The increasing use of sensor networks has led to an ever larger number of available spatiotemporal datasets. Forecasting applications using this type of data are frequently motivated by important domains such as environmental monitoring. Being able to properly assess the performance of different forecasting approaches is fundamental to achieve progress. However, traditional performance estimation procedures, such as cross-validation, face challenges due to the implicit dependence between observations in spatiotemporal datasets. In this paper, we empirically compare several variants of cross-validation (CV) and out-of-sample (OOS) performance estimation procedures, using both artificially generated and real-world spatiotemporal datasets. Our results show both CV and OOS reporting useful estimates, but they suggest that blocking data in space and/or in time may be useful in mitigating CV’s bias to underestimate error. Overall, our study shows the importance of considering data dependencies when estimating the performance of spatiotemporal forecasting models. Full article
(This article belongs to the Special Issue Spatial Statistics with Its Application)
Show Figures

Figure 1

Figure 1
<p>Time-wise holdout methods. The observations used for training are in lighter lilac, while the observations used for testing are in dark orange. Time flows from left to right.</p>
Full article ">Figure 2
<p>Cross-validation methods. The folds used for training are in lighter lilac, while the folds used for testing are in dark orange.</p>
Full article ">Figure 3
<p>Block cross-validation methods. The folds used for training are in lighter lilac, while the folds used for testing are in dark orange.</p>
Full article ">Figure 4
<p>Prequential evaluation methods with growing window. Blocks of data used for training in lighter lilac; blocks of data used for testing in dark orange.</p>
Full article ">Figure 5
<p>Some variations of prequential evaluation methods. Blocks of data used for training are in lighter lilac, while blocks of data used for testing are in dark orange.</p>
Full article ">Figure 6
<p>Buffered cross-validation. The folds used for training are in lighter lilac, the folds used for testing are in dark orange and buffer observations are in white.</p>
Full article ">Figure 7
<p>Global distribution of locations included in each data source.</p>
Full article ">Figure 8
<p>Spatial neighbours at maximum spatial radius within each spatiotemporal neighbourhood with <math display="inline"><semantics> <mrow> <mi>α</mi> <mo>=</mo> <mn>0.25</mn> </mrow> </semantics></math> and different values of <math display="inline"><semantics> <mi>β</mi> </semantics></math> for dataset Cook Agronomy Farm.</p>
Full article ">Figure 9
<p>Experimental design for spatiotemporal evaluation procedures assessment. Data are divided into an in-set and out-set, respecting temporal order. The error on the out-set is considered to be the “gold standard”; different estimation methods are used to estimate error on the in-set (in this example, time-wise hold-out). These values are then compared.</p>
Full article ">Figure 10
<p>Box plots of estimation errors incurred by cross-validation and out-of-sample procedures on 192 artificial datasets using four learning algorithms.</p>
Full article ">Figure 11
<p>Box plots of estimation errors incurred by cross-validation and out-of-sample procedures on 17 real world datasets using four learning algorithms.</p>
Full article ">Figure 12
<p>Bar plots of relative absolute estimation errors incurred by cross-validation and out-of-sample procedures on 192 artificial and 17 real-world datasets using four learning algorithms. Note the different legends.</p>
Full article ">Figure 13
<p>Bar plots of relative estimation errors incurred by cross-validation and out-of-sample procedures on 192 artificial and 17 real-world datasets using two learning algorithms. Note the different legends.</p>
Full article ">Figure 14
<p>Critical difference diagram according to Friedman–Nemenyi test (at 5% confidence level) for a subset of estimation procedures using 192 artificial datasets.</p>
Full article ">Figure 15
<p>Critical difference diagram according to Friedman–Nemenyi test (at 5% confidence level) for a subset of estimation procedures using real datasets.</p>
Full article ">Figure 16
<p>Average error against average rank of absolute errors for (<b>a</b>) artificial; and (<b>b</b>) real-world data sets. Procedures below the dashed lined tend to be optimistic in their error estimates. Lower ranks indicate more accurate estimates in terms of absolute error.</p>
Full article ">
32 pages, 3869 KiB  
Review
Performance Assessment of Supervised Classifiers for Designing Intrusion Detection Systems: A Comprehensive Review and Recommendations for Future Research
by Ranjit Panigrahi, Samarjeet Borah, Akash Kumar Bhoi, Muhammad Fazal Ijaz, Moumita Pramanik, Rutvij H. Jhaveri and Chiranji Lal Chowdhary
Mathematics 2021, 9(6), 690; https://doi.org/10.3390/math9060690 - 23 Mar 2021
Cited by 82 | Viewed by 5084
Abstract
Supervised learning and pattern recognition is a crucial area of research in information retrieval, knowledge engineering, image processing, medical imaging, and intrusion detection. Numerous algorithms have been designed to address such complex application domains. Despite an enormous array of supervised classifiers, researchers are [...] Read more.
Supervised learning and pattern recognition is a crucial area of research in information retrieval, knowledge engineering, image processing, medical imaging, and intrusion detection. Numerous algorithms have been designed to address such complex application domains. Despite an enormous array of supervised classifiers, researchers are yet to recognize a robust classification mechanism that accurately and quickly classifies the target dataset, especially in the field of intrusion detection systems (IDSs). Most of the existing literature considers the accuracy and false-positive rate for assessing the performance of classification algorithms. The absence of other performance measures, such as model build time, misclassification rate, and precision, should be considered the main limitation for classifier performance evaluation. This paper’s main contribution is to analyze the current literature status in the field of network intrusion detection, highlighting the number of classifiers used, dataset size, performance outputs, inferences, and research gaps. Therefore, fifty-four state-of-the-art classifiers of various different groups, i.e., Bayes, functions, lazy, rule-based, and decision tree, have been analyzed and explored in detail, considering the sixteen most popular performance measures. This research work aims to recognize a robust classifier, which is suitable for consideration as the base learner, while designing a host-based or network-based intrusion detection system. The NSLKDD, ISCXIDS2012, and CICIDS2017 datasets have been used for training and testing purposes. Furthermore, a widespread decision-making algorithm, referred to as Techniques for Order Preference by Similarity to the Ideal Solution (TOPSIS), allocated ranks to the classifiers based on observed performance reading on the concern datasets. The J48Consolidated provided the highest accuracy of 99.868%, a misclassification rate of 0.1319%, and a Kappa value of 0.998. Therefore, this classifier has been proposed as the ideal classifier for designing IDSs. Full article
(This article belongs to the Section Mathematics and Computer Science)
Show Figures

Figure 1

Figure 1
<p>Usage statistics of supervised classifiers.</p>
Full article ">Figure 2
<p>Comparison of classification accuracy in various classifier groups found in the literature.</p>
Full article ">Figure 3
<p>The methodology of classification to rank allocations of supervised classifiers.</p>
Full article ">Figure 4
<p>Weights and ranks of supervised classifier groups.</p>
Full article ">Figure 5
<p>Performance of decision tree classifiers for NSLKDD dataset.</p>
Full article ">Figure 6
<p>Performance of decision tree classifiers for ISCXIDS2012 dataset.</p>
Full article ">Figure 7
<p>Performance of decision tree classifiers for CICIDS2017 dataset.</p>
Full article ">Figure 8
<p>Techniques for Order Preference by Similarity to the Ideal Solution (TOPSIS) weights and ranks of decision tree classifiers for NSLKDD, ISCXIDS2012 and CICIIDS2017 dataset.</p>
Full article ">Figure 9
<p>Detection (%) of attacks and normal class labels of NSL-KDD multi-class dataset.</p>
Full article ">Figure 10
<p>Detection (%) of attacks and normal class labels of ISCXIDS2012 binary class dataset.</p>
Full article ">Figure 11
<p>Detection (%) of attacks and normal class labels of CICIDS2017 multi class dataset.</p>
Full article ">Figure 12
<p>Classification of J48Consolidated on NSL-KDD dataset.</p>
Full article ">Figure 13
<p>Classification of J48Consolidated on ISCXIDS2012 dataset.</p>
Full article ">Figure 14
<p>Classification of J48Consolidated on CICIDS2017 dataset.</p>
Full article ">
21 pages, 1506 KiB  
Article
Effective Algorithms for the Economic Lot-Sizing Problem with Bounded Inventory and Linear Fixed-Charge Cost Structure
by José M. Gutiérrez, Beatriz Abdul-Jalbar, Joaquín Sicilia and Inmaculada Rodríguez-Martín
Mathematics 2021, 9(6), 689; https://doi.org/10.3390/math9060689 - 23 Mar 2021
Cited by 1 | Viewed by 1644
Abstract
Efficient algorithms for the economic lot-sizing problem with storage capacity are proposed. On the one hand, for the cost structure consisting of general linear holding and ordering costs and fixed setup costs, an OT2 dynamic programming algorithm is introduced, where T [...] Read more.
Efficient algorithms for the economic lot-sizing problem with storage capacity are proposed. On the one hand, for the cost structure consisting of general linear holding and ordering costs and fixed setup costs, an OT2 dynamic programming algorithm is introduced, where T is the number of time periods. The new approach induces an accurate partition of the planning horizon, discarding most of the infeasible solutions. Moreover, although there are several algorithms based on dynamic programming in the literature also running in quadratic time, even considering more general cost structures and assumptions, the new solution uses a geometric technique to speed up the algorithm for a class of subproblems generated by dynamic programming, which can now be solved in linearithmic time. To be precise, the computational results show that the average occurrence percentage of this class of subproblems ranges between 13% and 45%, depending on both the total number of periods and the percentage of storage capacity availability. Furthermore, this percentage significantly increases from 13% to 35% as the capacity availability decreases. This reveals that the usage of the geometric technique is predominant under restrictive storage capacities. Specifically, when the percentage of capacity availability is below 50%, the average running times are on average 100 times faster than those when this percentage is above 50%. On the other hand, an OT on-line array searching method in Monge arrays can be used when the costs are non-speculative costs. Full article
Show Figures

Figure 1

Figure 1
<p>Comparison of average running times for different values of <span class="html-italic">A</span> reported by CPLEX (in red) and Algorithm 1 (in blue).</p>
Full article ">Figure 2
<p>Average number of breaking periods (β) vs. the percentage of storage availability (A) for different values of T.</p>
Full article ">
34 pages, 1852 KiB  
Article
Mass-Preserving Approximation of a Chemotaxis Multi-Domain Transmission Model for Microfluidic Chips
by Elishan Christian Braun, Gabriella Bretti and Roberto Natalini
Mathematics 2021, 9(6), 688; https://doi.org/10.3390/math9060688 - 23 Mar 2021
Cited by 8 | Viewed by 2164
Abstract
The present work is inspired by the recent developments in laboratory experiments made on chips, where the culturing of multiple cell species was possible. The model is based on coupled reaction-diffusion-transport equations with chemotaxis and takes into account the interactions among cell populations [...] Read more.
The present work is inspired by the recent developments in laboratory experiments made on chips, where the culturing of multiple cell species was possible. The model is based on coupled reaction-diffusion-transport equations with chemotaxis and takes into account the interactions among cell populations and the possibility of drug administration for drug testing effects. Our effort is devoted to the development of a simulation tool that is able to reproduce the chemotactic movement and the interactions between different cell species (immune and cancer cells) living in a microfluidic chip environment. The main issues faced in this work are the introduction of mass-preserving and positivity-preserving conditions, involving the balancing of incoming and outgoing fluxes passing through interfaces between 2D and 1D domains of the chip and the development of mass-preserving and positivity preserving numerical conditions at the external boundaries and at the interfaces between 2D and 1D domains. Full article
Show Figures

Figure 1

Figure 1
<p>Microfluidic chip environment: two chambers connected by multiple channels. Credits by Vacchelli et al. [<a href="#B1-mathematics-09-00688" class="html-bibr">1</a>] edited by AAAS.</p>
Full article ">Figure 2
<p>Simplified schematization of the chip geometry depicted in <a href="#mathematics-09-00688-f001" class="html-fig">Figure 1</a>.</p>
Full article ">Figure 3
<p>Time step restriction (64) <math display="inline"><semantics> <mrow> <mo>▵</mo> <mi>t</mi> </mrow> </semantics></math> for the hyperbolic transmission condition with <math display="inline"><semantics> <mrow> <mo>▵</mo> <mi>x</mi> <mo>=</mo> <mn>0.01</mn> </mrow> </semantics></math>, <math display="inline"><semantics> <mrow> <mo>▵</mo> <mi>y</mi> <mo>=</mo> <mn>0.1</mn> </mrow> </semantics></math> and <math display="inline"><semantics> <mrow> <mi>λ</mi> <mo>=</mo> <mn>5</mn> </mrow> </semantics></math> for different <span class="html-italic">K</span> and channel widths <math display="inline"><semantics> <mrow> <mo>(</mo> <mi>b</mi> <mo>−</mo> <mi>a</mi> <mo>)</mo> </mrow> </semantics></math> for the transmission between the two-dimensional parabolic Equation (57) with the one-dimensional hyperbolic Equation (62) with <math display="inline"><semantics> <mrow> <mi>f</mi> <mo>=</mo> <mn>0</mn> </mrow> </semantics></math>.</p>
Full article ">Figure 4
<p>Time step restriction (61) <math display="inline"><semantics> <mrow> <mo>▵</mo> <mi>t</mi> </mrow> </semantics></math> for the one-dimensional parabolic transmission condition with <math display="inline"><semantics> <mrow> <mo>▵</mo> <mi>x</mi> <mo>=</mo> <mn>0.01</mn> </mrow> </semantics></math>, <math display="inline"><semantics> <mrow> <mo>▵</mo> <mi>y</mi> <mo>=</mo> <mn>0.1</mn> </mrow> </semantics></math> and <math display="inline"><semantics> <mrow> <mi>D</mi> <mo>=</mo> <mn>5</mn> </mrow> </semantics></math> for different <span class="html-italic">K</span> and channel width <math display="inline"><semantics> <mrow> <mi>σ</mi> <mo>=</mo> <mi>b</mi> <mo>−</mo> <mi>a</mi> </mrow> </semantics></math>, <math display="inline"><semantics> <mrow> <mi>f</mi> <mo>=</mo> <mn>0</mn> </mrow> </semantics></math>. As expected, the time step <math display="inline"><semantics> <mrow> <mo>▵</mo> <mi>t</mi> </mrow> </semantics></math> must be chosen smaller when either <span class="html-italic">K</span> or the channel width <math display="inline"><semantics> <mi>σ</mi> </semantics></math> increases.</p>
Full article ">Figure 5
<p>(<b>left</b>) evolution of total mass for 1D-1D-doubly parabolic model with standard vs. mass-preserving boundary conditions. (<b>right</b>) evolution of total mass for 1D-1D-hyperbolic-parabolic model with standard vs. mass-preserving boundary conditions.</p>
Full article ">Figure 6
<p>Log-log plot of the error—namely, the quantity <math display="inline"><semantics> <mrow> <mrow> <mo>∥</mo> </mrow> <msub> <mi>u</mi> <mi>e</mi> </msub> <mo>−</mo> <msub> <mi>u</mi> <mi>approx</mi> </msub> <mrow> <mo>∥</mo> </mrow> </mrow> </semantics></math> in <math display="inline"><semantics> <msup> <mi>L</mi> <mn>1</mn> </msup> </semantics></math>-norm as a function of the space step, with fixed <math display="inline"><semantics> <mrow> <mo>Δ</mo> <mi>t</mi> <mo>=</mo> <msup> <mn>10</mn> <mrow> <mo>−</mo> <mn>3</mn> </mrow> </msup> </mrow> </semantics></math> and decreasing <math display="inline"><semantics> <mrow> <mo>Δ</mo> <mi>x</mi> <mo>=</mo> <mn>0.5</mn> <mo>,</mo> <mn>0.1</mn> <mo>,</mo> <mn>0.05</mn> <mo>,</mo> <mn>0.001</mn> </mrow> </semantics></math> at time <math display="inline"><semantics> <mrow> <mi>t</mi> <mo>=</mo> <mn>100</mn> </mrow> </semantics></math>. We depict in blue the obtained error and in red a line with slope 2 for comparison.</p>
Full article ">Figure 7
<p>Log-log plot of the error, namely the quantity <math display="inline"><semantics> <mrow> <mrow> <mo>∥</mo> </mrow> <msub> <mi>u</mi> <mi>e</mi> </msub> <mo>−</mo> <msub> <mi>u</mi> <mi>approx</mi> </msub> <mrow> <mo>∥</mo> </mrow> </mrow> </semantics></math> in <math display="inline"><semantics> <msup> <mi>L</mi> <mn>1</mn> </msup> </semantics></math>-norm as a function of the time step, with fixed <math display="inline"><semantics> <mrow> <mo>Δ</mo> <mi>x</mi> <mo>=</mo> <msup> <mn>10</mn> <mrow> <mo>−</mo> <mn>3</mn> </mrow> </msup> </mrow> </semantics></math> and decreasing <math display="inline"><semantics> <mrow> <mo>Δ</mo> <mi>t</mi> <mo>=</mo> <mn>0.5</mn> <mo>,</mo> <mn>0.1</mn> <mo>,</mo> <mn>0.05</mn> <mo>,</mo> <mn>0.001</mn> </mrow> </semantics></math> at time <math display="inline"><semantics> <mrow> <mi>t</mi> <mo>=</mo> <mn>100</mn> </mrow> </semantics></math>. We depict in blue the obtained error and in red a line with slope 2 for comparison.</p>
Full article ">Figure 8
<p>Treated case. Initial distribution for the model (<a href="#FD3-mathematics-09-00688" class="html-disp-formula">3</a>)–(<a href="#FD7-mathematics-09-00688" class="html-disp-formula">7</a>) at time <math display="inline"><semantics> <mrow> <mi>t</mi> <mo>=</mo> <mn>0</mn> </mrow> </semantics></math>.</p>
Full article ">Figure 9
<p>Treated case. Evolution of the model (<a href="#FD3-mathematics-09-00688" class="html-disp-formula">3</a>)–(<a href="#FD7-mathematics-09-00688" class="html-disp-formula">7</a>) at time <span class="html-italic">t</span> = 10,000 s (<b>top</b>) and at time <span class="html-italic">t</span> = 50,000 s (<b>bottom</b>).</p>
Full article ">Figure 10
<p>Untreated case. Evolution of the model (<a href="#FD3-mathematics-09-00688" class="html-disp-formula">3</a>)–(<a href="#FD7-mathematics-09-00688" class="html-disp-formula">7</a>) at time <span class="html-italic">t</span> = 10,000 s (<b>top</b>) and at time <span class="html-italic">t</span> = 50,000 s (<b>bottom</b>).</p>
Full article ">Figure 11
<p>Visualization of immune cells (blue dots) and tumor cells (red squares) for times t = 0, t = 5, and t = 50 using the density of each quantity and representing them as cells.</p>
Full article ">
23 pages, 345 KiB  
Article
Interleaving Shifted Versions of a PN-Sequence
by Sara Díaz Cardell, Amparo Fúster-Sabater and Verónica Requena
Mathematics 2021, 9(6), 687; https://doi.org/10.3390/math9060687 - 23 Mar 2021
Cited by 4 | Viewed by 2233
Abstract
The output sequence of the shrinking generator can be considered as an interleaving of determined shifted versions of a single PN -sequence. In this paper, we present a study of the interleaving of a PN-sequence and shifted versions of itself. We analyze some [...] Read more.
The output sequence of the shrinking generator can be considered as an interleaving of determined shifted versions of a single PN -sequence. In this paper, we present a study of the interleaving of a PN-sequence and shifted versions of itself. We analyze some important cryptographic properties as the period and the linear complexity in terms of the shifts. Furthermore, we determine the total number of the interleaving sequences that achieve each possible value of the linear complexity. Full article
(This article belongs to the Special Issue Algebra and Number Theory)
Show Figures

Figure 1

Figure 1
<p>Run test for a 10-interleaving sequence generated from a PN -sequence with characteristic polynomial of degree 16.</p>
Full article ">
25 pages, 4286 KiB  
Article
Solving Regression Problems with Intelligent Machine Learner for Engineering Informatics
by Jui-Sheng Chou, Dinh-Nhat Truong and Chih-Fong Tsai
Mathematics 2021, 9(6), 686; https://doi.org/10.3390/math9060686 - 23 Mar 2021
Cited by 9 | Viewed by 3177
Abstract
Machine learning techniques have been used to develop many regression models to make predictions based on experience and historical data. They might be used singly or in ensembles. Single models are either classification or regression models that use one technique, while ensemble models [...] Read more.
Machine learning techniques have been used to develop many regression models to make predictions based on experience and historical data. They might be used singly or in ensembles. Single models are either classification or regression models that use one technique, while ensemble models combine various single models. To construct or find the best model is very complex and time-consuming, so this study develops a new platform, called intelligent Machine Learner (iML), to automatically build popular models and identify the best one. The iML platform is benchmarked with WEKA by analyzing publicly available datasets. After that, four industrial experiments are conducted to evaluate the performance of iML. In all cases, the best models determined by iML are superior to prior studies in terms of accuracy and computation time. Thus, the iML is a powerful and efficient tool for solving regression problems in engineering informatics. Full article
Show Figures

Figure 1

Figure 1
<p>Artificial neural network (ANN) model.</p>
Full article ">Figure 2
<p>Support Vector Machine (SVM) and Support Vector Regression (SVR) models.</p>
Full article ">Figure 3
<p>The classification and regression tree (CART) model.</p>
Full article ">Figure 4
<p>Linear Ridge Regression (LRR) and Logistic Regression (LgR) models.</p>
Full article ">Figure 5
<p>Ensemble models.</p>
Full article ">Figure 6
<p>K-fold cross-validation method.</p>
Full article ">Figure 7
<p>Intelligent machine leaner framework.</p>
Full article ">Figure 8
<p>Snapshot of intelligent Machine Learner (iML) interface.</p>
Full article ">Figure 9
<p>Snapshot of report file.</p>
Full article ">Figure 10
<p>Root mean square errors of best models.</p>
Full article ">
14 pages, 328 KiB  
Article
Boscovich Fuzzy Regression Line
by Pavel Škrabánek, Jaroslav Marek and Alena Pozdílková
Mathematics 2021, 9(6), 685; https://doi.org/10.3390/math9060685 - 23 Mar 2021
Cited by 4 | Viewed by 2601
Abstract
We introduce a new fuzzy linear regression method. The method is capable of approximating fuzzy relationships between an independent and a dependent variable. The independent and dependent variables are expected to be a real value and triangular fuzzy numbers, respectively. We demonstrate on [...] Read more.
We introduce a new fuzzy linear regression method. The method is capable of approximating fuzzy relationships between an independent and a dependent variable. The independent and dependent variables are expected to be a real value and triangular fuzzy numbers, respectively. We demonstrate on twenty datasets that the method is reliable, and it is less sensitive to outliers, compare with possibilistic-based fuzzy regression methods. Unlike other commonly used fuzzy regression methods, the presented method is simple for implementation and it has linear time-complexity. The method guarantees non-negativity of model parameter spreads. Full article
(This article belongs to the Special Issue Recent Advances in Applications of Fuzzy Logic and Soft Computing)
17 pages, 2411 KiB  
Article
Application of Mathematical Methods to the Study of Special-Needs Education in Spanish Journals
by José Luis Gallego Ortega, Antonio Rodríguez Fuentes and Antonio García Guzmán
Mathematics 2021, 9(6), 684; https://doi.org/10.3390/math9060684 - 22 Mar 2021
Viewed by 1947
Abstract
This research analyzes the written production on special-needs education in Spanish high-impact journals indexed in the Journal Citation Reports (Web of Science). Its objective is to show the status of this issue in the past 20 years based on updated and relevant information [...] Read more.
This research analyzes the written production on special-needs education in Spanish high-impact journals indexed in the Journal Citation Reports (Web of Science). Its objective is to show the status of this issue in the past 20 years based on updated and relevant information that contributes to the development of the discipline itself and to improving special-needs education. A total of 1201 special-needs education documents published in 15 high-impact journals were analyzed. The results evince the development of this discipline and the principal subjects of study and other relevant aspects associated with this field of knowledge. This research allows for reinforcing the body of knowledge in this field of study, which would be far-reaching for researchers and education administrators alike. Full article
Show Figures

Figure A1

Figure A1
<p>Journals in Journal Citation Report (JCR) and documents (“ESE” and “TªE” are not currently in the JCR). Source: own compilation.</p>
Full article ">Figure A2
<p>Total documents/special‐needs education documents by journals.</p>
Full article ">Figure A3
<p>Number of total journals with a special-needs education document. Source: own compilation.</p>
Full article ">Figure A4
<p>Total documents/special‐needs education documents by years.</p>
Full article ">Figure A5
<p>Interannual variation rate for total documents/special-needs education documents. Source: own compilation.</p>
Full article ">Figure A6
<p>Demarcation of the publications. Source: own compilation.</p>
Full article ">Figure A7
<p>Nationality of publications. Source: own compilation.</p>
Full article ">
20 pages, 341 KiB  
Article
Asymptotic Profile for Diffusion Wave Terms of the Compressible Navier–Stokes–Korteweg System
by Takayuki Kobayashi, Masashi Misawa and Kazuyuki Tsuda
Mathematics 2021, 9(6), 683; https://doi.org/10.3390/math9060683 - 22 Mar 2021
Viewed by 1628
Abstract
The asymptotic profile for diffusion wave terms of solutions to the compressible Navier–Stokes–Korteweg system is studied on R2. The diffusion wave with time-decay estimate was studied by Hoff and Zumbrun (1995, 1997), Kobayashi and Shibata (2002), and Kobayashi and Tsuda (2018) [...] Read more.
The asymptotic profile for diffusion wave terms of solutions to the compressible Navier–Stokes–Korteweg system is studied on R2. The diffusion wave with time-decay estimate was studied by Hoff and Zumbrun (1995, 1997), Kobayashi and Shibata (2002), and Kobayashi and Tsuda (2018) for compressible Navier–Stokes and compressible Navier–Stokes–Korteweg systems. Our main assertion in this paper is that, for some initial conditions given by the Hardy space, asymptotic behaviors in space–time L2 of the diffusion wave parts are essentially different between density and the potential flow part of the momentum. Even though measuring by L2 on space, decay of the potential flow part is slower than that of the Stokes flow part of the momentum. The proof is based on a modified version of Morawetz’s energy estimate, and the Fefferman–Stein inequality on the duality between the Hardy space and functions of bounded mean oscillation. Full article
10 pages, 282 KiB  
Article
Repdigits as Product of Terms of k-Bonacci Sequences
by Petr Coufal and Pavel Trojovský
Mathematics 2021, 9(6), 682; https://doi.org/10.3390/math9060682 - 22 Mar 2021
Cited by 6 | Viewed by 2122
Abstract
For any integer k2, the sequence of the k-generalized Fibonacci numbers (or k-bonacci numbers) is defined by the k initial values [...] Read more.
For any integer k2, the sequence of the k-generalized Fibonacci numbers (or k-bonacci numbers) is defined by the k initial values F(k2)(k)==F0(k)=0 and F1(k)=1 and such that each term afterwards is the sum of the k preceding ones. In this paper, we search for repdigits (i.e., a number whose decimal expansion is of the form aaa, with a[1,9]) in the sequence (Fn(k)Fn(k+m))n, for m[1,9]. This result generalizes a recent work of Bednařík and Trojovská (the case in which (k,m)=(2,1)). Our main tools are the transcendental method (for Diophantine equations) together with the theory of continued fractions (reduction method). Full article
(This article belongs to the Special Issue Mathematical Analysis and Analytic Number Theory 2020)
21 pages, 894 KiB  
Article
Black-Box-Based Mathematical Modelling of Machine Intelligence Measuring
by László Barna Iantovics
Mathematics 2021, 9(6), 681; https://doi.org/10.3390/math9060681 - 22 Mar 2021
Cited by 13 | Viewed by 3151
Abstract
Current machine intelligence metrics rely on a different philosophy, hindering their effective comparison. There is no standardization of what is machine intelligence and what should be measured to quantify it. In this study, we investigate the measurement of intelligence from the viewpoint of [...] Read more.
Current machine intelligence metrics rely on a different philosophy, hindering their effective comparison. There is no standardization of what is machine intelligence and what should be measured to quantify it. In this study, we investigate the measurement of intelligence from the viewpoint of real-life difficult-problem-solving abilities, and we highlight the importance of being able to make accurate and robust comparisons between multiple cooperative multiagent systems (CMASs) using a novel metric. A recent metric presented in the scientific literature, called MetrIntPair, is capable of comparing the intelligence of only two CMASs at an application. In this paper, we propose a generalization of that metric called MetrIntPairII. MetrIntPairII is based on pairwise problem-solving intelligence comparisons (for the same problem, the problem-solving intelligence of the studied CMASs is evaluated experimentally in pairs). The pairwise intelligence comparison is proposed to decrease the necessary number of experimental intelligence measurements. MetrIntPairII has the same properties as MetrIntPair, with the main advantage that it can be applied to any number of CMASs conserving the accuracy of the comparison, while it exhibits enhanced robustness. An important property of the proposed metric is the universality, as it can be applied as a black-box method to intelligent agent-based systems (IABSs) generally, not depending on the aspect of IABS architecture. To demonstrate the effectiveness of the MetrIntPairII metric, we provide a representative experimental study, comparing the intelligence of several CMASs composed of agents specialized in solving an NP-hard problem. Full article
(This article belongs to the Section Mathematics and Computer Science)
Show Figures

Figure 1

Figure 1
<p>Main processing performed by the Algorithm 1.</p>
Full article ">Figure 2
<p>Graphical representation of <span class="html-italic">Int</span><math display="inline"><semantics> <msub> <mrow/> <mn>1</mn> </msub> </semantics></math>, <span class="html-italic">Int</span><math display="inline"><semantics> <msub> <mrow/> <mn>2</mn> </msub> </semantics></math> and <span class="html-italic">Int</span><math display="inline"><semantics> <msub> <mrow/> <mn>3</mn> </msub> </semantics></math>.</p>
Full article ">Figure 3
<p>QQ plot of <span class="html-italic">Int</span><math display="inline"><semantics> <msub> <mrow/> <mrow> <mn>1</mn> <mo>*</mo> </mrow> </msub> </semantics></math>.</p>
Full article ">Figure 4
<p>QQ plot of <span class="html-italic">Int</span><math display="inline"><semantics> <msub> <mrow/> <mrow> <mn>2</mn> <mo>*</mo> </mrow> </msub> </semantics></math>.</p>
Full article ">Figure 5
<p>QQ plot of <span class="html-italic">Int<math display="inline"><semantics> <msub> <mrow/> <mn>3</mn> </msub> </semantics></math></span><math display="inline"><semantics> <msub> <mrow/> <mo>*</mo> </msub> </semantics></math>.</p>
Full article ">
17 pages, 429 KiB  
Article
Handling Hysteresis in a Referral Marketing Campaign with Self-Information. Hints from Epidemics
by Deborah Lacitignola
Mathematics 2021, 9(6), 680; https://doi.org/10.3390/math9060680 - 22 Mar 2021
Cited by 5 | Viewed by 1889
Abstract
In this study we show that concept of backward bifurcation, borrowed from epidemics, can be fruitfully exploited to shed light on the mechanism underlying the occurrence of hysteresis in marketing and for the strategic planning of adequate tools for its control. We enrich [...] Read more.
In this study we show that concept of backward bifurcation, borrowed from epidemics, can be fruitfully exploited to shed light on the mechanism underlying the occurrence of hysteresis in marketing and for the strategic planning of adequate tools for its control. We enrich the model introduced in (Gaurav et al., 2019) with the mechanism of self-information that accounts for information about the product performance basing on consumers’ experience on the recent past. We obtain conditions for which the model exhibits a forward or a backward phenomenology and evaluate the impact of self-information on both these scenarios. Our analysis suggests that, even if hysteretic dynamics in referral campaigns is intimately linked to the mechanism of referrals, an adequate level of self-information and a fairly high level of customer-satisfaction can act as strategic tools to manage hysteresis and allow the campaign to spread in more controllable conditions. Full article
Show Figures

Figure 1

Figure 1
<p>Bifurcation diagram in the plane (<math display="inline"><semantics> <mrow> <mi>σ</mi> <mo>,</mo> <msup> <mi>b</mi> <mo>∗</mo> </msup> </mrow> </semantics></math>). The other parameters are <math display="inline"><semantics> <mrow> <mi>μ</mi> <mo>=</mo> <mn>0.05</mn> </mrow> </semantics></math>; <math display="inline"><semantics> <mrow> <mi>ρ</mi> <mo>=</mo> <mn>0.25</mn> </mrow> </semantics></math>; <math display="inline"><semantics> <mrow> <mi>λ</mi> <mo>=</mo> <mn>0.02</mn> </mrow> </semantics></math>; <math display="inline"><semantics> <mrow> <mi>p</mi> <mo>=</mo> <mn>0.7</mn> </mrow> </semantics></math>; <math display="inline"><semantics> <mrow> <mi>q</mi> <mo>=</mo> <mn>0.8</mn> </mrow> </semantics></math>; <math display="inline"><semantics> <mrow> <mi>a</mi> <mo>=</mo> <mn>0.5</mn> </mrow> </semantics></math>; <math display="inline"><semantics> <mrow> <mi>k</mi> <mo>=</mo> <mn>2</mn> </mrow> </semantics></math>; <math display="inline"><semantics> <mrow> <mi>γ</mi> <mo>=</mo> <mn>0.2</mn> </mrow> </semantics></math> so that <math display="inline"><semantics> <mrow> <msup> <mi>α</mi> <mo>∗</mo> </msup> <mo>=</mo> <mn>1.1684</mn> </mrow> </semantics></math> and <math display="inline"><semantics> <mrow> <msub> <mi>σ</mi> <mi>c</mi> </msub> <mo>=</mo> <mn>0.6850</mn> </mrow> </semantics></math>. The solid lines (-) denote stability; the dashed lines (- -) denote instability. (<b>Left</b>) Forward scenario. The case <math display="inline"><semantics> <mrow> <mi>α</mi> <mo>&lt;</mo> <msup> <mi>α</mi> <mo>∗</mo> </msup> </mrow> </semantics></math>, <math display="inline"><semantics> <mrow> <mi>α</mi> <mo>=</mo> <mn>0.4</mn> </mrow> </semantics></math>− At <math display="inline"><semantics> <mrow> <mi>σ</mi> <mo>=</mo> <msub> <mi>σ</mi> <mi>c</mi> </msub> <mo>=</mo> <mn>0.6850</mn> </mrow> </semantics></math>, system (<a href="#FD5-mathematics-09-00680" class="html-disp-formula">5</a>) exhibits a forward bifurcation. (<b>Right</b>) Backward scenario. The case <math display="inline"><semantics> <mrow> <mi>α</mi> <mo>&gt;</mo> <msup> <mi>α</mi> <mo>∗</mo> </msup> </mrow> </semantics></math>, <math display="inline"><semantics> <mrow> <mi>α</mi> <mo>=</mo> <mn>2</mn> </mrow> </semantics></math>− At <math display="inline"><semantics> <mrow> <mi>σ</mi> <mo>=</mo> <msub> <mi>σ</mi> <mi>c</mi> </msub> <mo>=</mo> <mn>0.6850</mn> </mrow> </semantics></math>, system (<a href="#FD5-mathematics-09-00680" class="html-disp-formula">5</a>) exhibits a backward bifurcation. The value <math display="inline"><semantics> <mrow> <msub> <mi>σ</mi> <mrow> <mi>S</mi> <mi>N</mi> </mrow> </msub> <mo>=</mo> <mn>0.9105</mn> </mrow> </semantics></math> is the saddle-node bifurcation threshold.</p>
Full article ">Figure 2
<p>Graphical representation of an hysteresis cycle on the bifurcation diagram in the plane (<math display="inline"><semantics> <mrow> <mi>σ</mi> <mo>,</mo> <msup> <mi>b</mi> <mo>∗</mo> </msup> </mrow> </semantics></math>) in the case <math display="inline"><semantics> <mrow> <mi>α</mi> <mo>&gt;</mo> <msup> <mi>α</mi> <mo>∗</mo> </msup> </mrow> </semantics></math>, where a backward scenario is obtained. The other parameters are as in <a href="#mathematics-09-00680-f001" class="html-fig">Figure 1</a> (right). Here <math display="inline"><semantics> <mrow> <msup> <mi>α</mi> <mo>∗</mo> </msup> <mo>=</mo> <mn>1.1684</mn> </mrow> </semantics></math>, <math display="inline"><semantics> <mrow> <msub> <mi>σ</mi> <mi>c</mi> </msub> <mo>=</mo> <mn>0.6850</mn> </mrow> </semantics></math> and the value <math display="inline"><semantics> <mrow> <msub> <mi>σ</mi> <mrow> <mi>S</mi> <mi>N</mi> </mrow> </msub> <mo>=</mo> <mn>0.9105</mn> </mrow> </semantics></math> is the saddle-node bifurcation threshold. The solid lines (-) denote stability; the dashed lines (- -) denote instability.</p>
Full article ">Figure 3
<p>Thresholds (<a href="#FD16-mathematics-09-00680" class="html-disp-formula">16</a>) as function of the information variable <math display="inline"><semantics> <mi>ζ</mi> </semantics></math>. The other parameters are chosen as in <a href="#mathematics-09-00680-f001" class="html-fig">Figure 1</a>. (<b>Top-left</b>) The threshold <math display="inline"><semantics> <mrow> <msup> <mi>α</mi> <mo>∗</mo> </msup> <mrow> <mo>(</mo> <mi>ζ</mi> <mo>)</mo> </mrow> </mrow> </semantics></math> as function of <math display="inline"><semantics> <mi>ζ</mi> </semantics></math>. (<b>Top-right</b>) The saddle-node bifurcation threshold <math display="inline"><semantics> <mrow> <msub> <mi>σ</mi> <mrow> <mi>S</mi> <mi>N</mi> </mrow> </msub> <mrow> <mo>(</mo> <mi>ζ</mi> <mo>)</mo> </mrow> </mrow> </semantics></math> as function of <math display="inline"><semantics> <mi>ζ</mi> </semantics></math>. The threshold <math display="inline"><semantics> <msub> <mi>σ</mi> <mrow> <mi>S</mi> <mi>N</mi> </mrow> </msub> </semantics></math> is feasible in the range <math display="inline"><semantics> <mfenced separators="" open="(" close="]"> <mn>0</mn> <mo>,</mo> <msup> <mi>ζ</mi> <mo>∗</mo> </msup> </mfenced> </semantics></math>, with <math display="inline"><semantics> <mrow> <msup> <mi>ζ</mi> <mo>∗</mo> </msup> <mo>=</mo> <mn>0.9375</mn> </mrow> </semantics></math> (<b>Bottom</b>) The length of the bistability range, i.e., <math display="inline"><semantics> <mrow> <msub> <mi>σ</mi> <mrow> <mi>S</mi> <mi>N</mi> </mrow> </msub> <mo>−</mo> <msub> <mi>σ</mi> <mi>c</mi> </msub> </mrow> </semantics></math>, within the backward scenario as function of <math display="inline"><semantics> <mi>ζ</mi> </semantics></math>. The bistability range is increasing for <math display="inline"><semantics> <mfenced separators="" open="[" close=")"> <mn>0</mn> <mo>,</mo> <msub> <mi>ζ</mi> <mn>1</mn> </msub> </mfenced> </semantics></math> and <math display="inline"><semantics> <mfenced separators="" open="(" close=")"> <msub> <mi>ζ</mi> <mn>2</mn> </msub> <mo>,</mo> <msup> <mi>ζ</mi> <mo>∗</mo> </msup> </mfenced> </semantics></math> and it decreases for <math display="inline"><semantics> <mfenced separators="" open="[" close="]"> <msub> <mi>ζ</mi> <mn>1</mn> </msub> <mo>,</mo> <msub> <mi>ζ</mi> <mn>2</mn> </msub> </mfenced> </semantics></math>. Here <math display="inline"><semantics> <mrow> <msup> <mi>ζ</mi> <mo>∗</mo> </msup> <mo>=</mo> <mn>0.9375</mn> </mrow> </semantics></math>; <math display="inline"><semantics> <mrow> <msub> <mi>ζ</mi> <mn>1</mn> </msub> <mo>=</mo> <mn>0.1135</mn> </mrow> </semantics></math>; <math display="inline"><semantics> <mrow> <msub> <mi>ζ</mi> <mn>2</mn> </msub> <mo>=</mo> <mn>0.8861</mn> </mrow> </semantics></math>.</p>
Full article ">Figure 4
<p>Sensitivity indices of the different thresholds <math display="inline"><semantics> <msup> <mi>α</mi> <mo>∗</mo> </msup> </semantics></math>, <math display="inline"><semantics> <msub> <mi>σ</mi> <mi>c</mi> </msub> </semantics></math> and <math display="inline"><semantics> <msup> <mi>σ</mi> <mrow> <mi>S</mi> <mi>N</mi> </mrow> </msup> </semantics></math> as function of the information variable <math display="inline"><semantics> <mi>ζ</mi> </semantics></math>. The other parameters are chosen as in <a href="#mathematics-09-00680-f001" class="html-fig">Figure 1</a>. (<b>Top-left</b>) Plot of the sensitivity <math display="inline"><semantics> <msubsup> <mi>ϕ</mi> <mrow> <mi>ζ</mi> </mrow> <msup> <mi>α</mi> <mo>∗</mo> </msup> </msubsup> </semantics></math> versus the information variable <math display="inline"><semantics> <mi>ζ</mi> </semantics></math>; (<b>Top-right</b>) Plot of the sensitivity <math display="inline"><semantics> <msubsup> <mi>ϕ</mi> <mrow> <mi>ζ</mi> </mrow> <msub> <mi>σ</mi> <mi>c</mi> </msub> </msubsup> </semantics></math> versus the information variable <math display="inline"><semantics> <mi>ζ</mi> </semantics></math>; (<b>Bottom</b>) Plot of the sensitivity <math display="inline"><semantics> <msubsup> <mi>ϕ</mi> <mrow> <mi>ζ</mi> </mrow> <msup> <mi>σ</mi> <mrow> <mi>S</mi> <mi>N</mi> </mrow> </msup> </msubsup> </semantics></math> versus the information variable <math display="inline"><semantics> <mi>ζ</mi> </semantics></math>.</p>
Full article ">Figure 5
<p>Impact of the customer satisfaction parameter <span class="html-italic">q</span> on the referral campaign in the bistability region, <math display="inline"><semantics> <mrow> <mi>σ</mi> <mo>∈</mo> <mo>[</mo> <msub> <mi>σ</mi> <mi>c</mi> </msub> <mo>,</mo> <msub> <mi>σ</mi> <mrow> <mi>S</mi> <mi>N</mi> </mrow> </msub> <mo>]</mo> </mrow> </semantics></math>, for different levels of self-information. Initial conditions are chosen in the neighbouring of the campaign-standing equilibrium. The other parameters are as in <a href="#mathematics-09-00680-f001" class="html-fig">Figure 1</a>. (<b>Top-left</b>) Low level of the self-information parameter, i.e., <math display="inline"><semantics> <mrow> <mi>ζ</mi> <mo>=</mo> <mn>0.08</mn> </mrow> </semantics></math> (<math display="inline"><semantics> <mrow> <mi>k</mi> <mo>=</mo> <mn>2</mn> <mo>;</mo> <mi>γ</mi> <mo>=</mo> <mn>0.04</mn> </mrow> </semantics></math>) and <math display="inline"><semantics> <mrow> <mi>σ</mi> <mo>=</mo> <mn>0.4</mn> </mrow> </semantics></math>. (<b>Top-right</b>) Intermediate level of the self-information parameter, i.e., <math display="inline"><semantics> <mrow> <mi>ζ</mi> <mo>=</mo> <mn>0.5</mn> </mrow> </semantics></math> (<math display="inline"><semantics> <mrow> <mi>k</mi> <mo>=</mo> <mn>2</mn> <mo>;</mo> <mi>γ</mi> <mo>=</mo> <mn>0.25</mn> </mrow> </semantics></math>) and <math display="inline"><semantics> <mrow> <mi>σ</mi> <mo>=</mo> <mn>0.7</mn> </mrow> </semantics></math>. (<b>Bottom</b>) High level of the self-information parameter, i.e., <math display="inline"><semantics> <mrow> <mi>ζ</mi> <mo>=</mo> <mn>0.9</mn> </mrow> </semantics></math> (<math display="inline"><semantics> <mrow> <mi>k</mi> <mo>=</mo> <mn>2</mn> <mo>;</mo> <mi>γ</mi> <mo>=</mo> <mn>0.45</mn> </mrow> </semantics></math>) and <math display="inline"><semantics> <mrow> <mi>σ</mi> <mo>=</mo> <mn>0.9</mn> </mrow> </semantics></math>.</p>
Full article ">
20 pages, 904 KiB  
Article
Personalized Cotesting Policies for Cervical Cancer Screening: A POMDP Approach
by Malek Ebadi and Raha Akhavan-Tabatabaei
Mathematics 2021, 9(6), 679; https://doi.org/10.3390/math9060679 - 22 Mar 2021
Cited by 1 | Viewed by 2609
Abstract
Screening for cervical cancer is a critical policy that requires clinical and managerial vigilance because of its serious health consequences. Recently the practice of conducting simultaneous tests of cytology and Human Papillomavirus (HPV)-DNA testing (known as cotesting) has been included in the public [...] Read more.
Screening for cervical cancer is a critical policy that requires clinical and managerial vigilance because of its serious health consequences. Recently the practice of conducting simultaneous tests of cytology and Human Papillomavirus (HPV)-DNA testing (known as cotesting) has been included in the public health policies and guidelines with a fixed frequency. On the other hand, personalizing medical interventions by incorporating patient characteristics into the decision making process has gained considerable attention in recent years. We develop a personalized partially observable Markov decision process (POMDP) model for cervical cancer screening decisions by cotesting. In addition to the merits offered by the guidelines, by availing the possibility of including patient-specific risks and other attributes, our POMDP model provides a patient-tailored screening plan. Our results show that the policy generated by the POMDP model outperforms the static guidelines in terms of quality-adjusted life years (QALY) gain, while performing comparatively equal in lifetime risk reduction. Full article
(This article belongs to the Special Issue Markov-Chain Modelling and Applications)
Show Figures

Figure 1

Figure 1
<p>State transition diagram.</p>
Full article ">Figure 2
<p>Timeline of the decision process.</p>
Full article ">Figure 3
<p>Belief simplex and update of belief states.</p>
Full article ">Figure 4
<p>Alpha vectors over belief space in a two-state partially observable Markov decision process (POMDP); bold segment of the alpha vectors constitute a piecewise linear and convex (PWLC) value function. <math display="inline"><semantics> <msup> <mi>α</mi> <mn>4</mn> </msup> </semantics></math> is a redundant vector and can be eliminated.</p>
Full article ">Figure 5
<p>Five-year average risk of cancer for patients with different risk profiles. Colored dots show the screening ages of each risk profile.</p>
Full article ">Figure 6
<p>Lifetime risk of cancer under different policies.</p>
Full article ">Figure 7
<p>Quality adjusted life years (QALY) gained under different starting belief points.</p>
Full article ">
23 pages, 12722 KiB  
Article
Vehicle Response to Kinematic Excitation, Numerical Simulation Versus Experiment
by Jozef Melcer, Eva Merčiaková, Mária Kúdelčíková and Veronika Valašková
Mathematics 2021, 9(6), 678; https://doi.org/10.3390/math9060678 - 22 Mar 2021
Cited by 7 | Viewed by 1792
Abstract
The article is devoted to the numerical simulation and experimental verification of a vehicle’s response to kinematic excitation caused by driving along an asphalt road. The source of kinematic excitation was road unevenness, which was mapped by geodetic methods. Vertical unevenness was measured [...] Read more.
The article is devoted to the numerical simulation and experimental verification of a vehicle’s response to kinematic excitation caused by driving along an asphalt road. The source of kinematic excitation was road unevenness, which was mapped by geodetic methods. Vertical unevenness was measured in 0.25 m increments in two longitudinal profiles of the road spaced two meters apart with precise leveling realized by geodetic digital levels. A space multi-body computational model of a Tatra 815 heavy truck was adopted. The model had 15 degrees of freedom. Nine degrees of freedom were tangible and six degrees of freedom were intangible. The equations of motion were derived in the form of second-order ordinary differential equations and were solved numerically by the Runge–Kutta method. A custom computer program in MATLAB was created for numerical simulation of vehicle movement (eps = 2−52). The program allowed simulation of quantities such as deflections, speeds, accelerations at characteristic points of the vehicle, and static or dynamic components of contact forces arising between the wheel and the road. The response of the vehicle (acceleration at characteristic points) at different speeds was experimentally tested. The experiment was numerically simulated and the results were mutually compared. The basic statistical characteristics of experimentally obtained and numerically simulated signals and their power spectral densities were compared. Full article
(This article belongs to the Section Dynamical Systems)
Show Figures

Figure 1

Figure 1
<p>Computational model of vehicle.</p>
Full article ">Figure 2
<p>Left and right road profiles.</p>
Full article ">Figure 3
<p>Histogram of unevenness and Gauss’s law.</p>
Full article ">Figure 4
<p>Power spectral density (PSD) of left road profile in log-log scale.</p>
Full article ">Figure 5
<p>PSD of right road profile in log-log scale.</p>
Full article ">Figure 6
<p>Vertical deflection of the center of gravity of the sprung mass of vehicle.</p>
Full article ">Figure 7
<p>Angle of rotation of the sprung mass of vehicle in the longitudinal direction about an axis passing through the center of gravity.</p>
Full article ">Figure 8
<p>Vertical deflection of the right front axle of vehicle.</p>
Full article ">Figure 9
<p>Speed of vertical motion of the right front axle of vehicle.</p>
Full article ">Figure 10
<p>Contact force between the left rear wheel of the rear axle and the road.</p>
Full article ">Figure 11
<p>Localization of sensors on the vehicle.</p>
Full article ">Figure 12
<p>Sensor and its location on the front and rear axles.</p>
Full article ">Figure 13
<p>Steel strips with accelerometers D2 and D3 at a distance of 100 m.</p>
Full article ">Figure 14
<p>Records from accelerometers D2 and D3.</p>
Full article ">Figure 15
<p>Acceleration in the center of gravity (CG) of vehicle sprung mass, <span class="html-italic">V</span> = 15.18 km/h.</p>
Full article ">Figure 16
<p>Density of probability distribution, acceleration in vehicle CG.</p>
Full article ">Figure 17
<p>Distribution function, acceleration in vehicle CG.</p>
Full article ">Figure 18
<p>PSD of vertical accelerations in vehicle CG.</p>
Full article ">Figure 19
<p>PSD of vertical accelerations in vehicle CG, 0–10 Hz.</p>
Full article ">Figure 20
<p>Acceleration on right front axle, <span class="html-italic">V</span> = 15.18 km/h.</p>
Full article ">Figure 21
<p>Density of probability distribution, acceleration on vehicle front axle (FA).</p>
Full article ">Figure 22
<p>Distribution function, acceleration on vehicle FA.</p>
Full article ">Figure 23
<p>PSD of vertical accelerations on vehicle FA, 0–25 Hz.</p>
Full article ">Figure 24
<p>Acceleration on right rear axle, <span class="html-italic">V</span> = 15.18 km/h.</p>
Full article ">Figure 25
<p>Density of probability distribution, acceleration on vehicle rear axle (RA).</p>
Full article ">Figure 26
<p>Distribution function, acceleration on vehicle RA.</p>
Full article ">Figure 27
<p>PSD of vertical accelerations on vehicle RA, 0–10 Hz.</p>
Full article ">Figure 28
<p>Acceleration in the CG of vehicle sprung mass, <span class="html-italic">V</span> = 52.85 km/h.</p>
Full article ">Figure 29
<p>Density of probability distribution, acceleration in vehicle CG.</p>
Full article ">Figure 30
<p>Distribution function, acceleration in vehicle CG.</p>
Full article ">Figure 31
<p>PSD of vertical accelerations in vehicle CG, 0–10 Hz.</p>
Full article ">Figure 32
<p>Acceleration on right front axle, <span class="html-italic">V</span> = 52.95 km/h.</p>
Full article ">Figure 33
<p>Density of probability distribution, acceleration on vehicle FA.</p>
Full article ">Figure 34
<p>Distribution function, acceleration on vehicle FA.</p>
Full article ">Figure 35
<p>PSD of vertical accelerations on vehicle FA, 0–25 Hz.</p>
Full article ">Figure 36
<p>Acceleration on right rear axle, <span class="html-italic">V</span> = 52.95 km/h.</p>
Full article ">Figure 37
<p>Density of probability distribution, acceleration on vehicle RA.</p>
Full article ">Figure 38
<p>Distribution function, acceleration on vehicle RA.</p>
Full article ">Figure 39
<p>PSD of vertical accelerations on vehicle RA, 0–10 Hz.</p>
Full article ">Figure 40
<p>Density of probability distribution, acceleration on vehicle FA, <span class="html-italic">V</span> = 15.18 km/h.</p>
Full article ">Figure 41
<p>RMS of acceleration in vehicle CG versus speed <span class="html-italic">V.</span></p>
Full article ">
33 pages, 9707 KiB  
Article
A Local Spatial STIRPAT Model for Outdoor NOx Concentrations in the Community of Madrid, Spain
by José-María Montero, Gema Fernández-Avilés and Tiziana Laureti
Mathematics 2021, 9(6), 677; https://doi.org/10.3390/math9060677 - 22 Mar 2021
Cited by 11 | Viewed by 2916
Abstract
Air pollution control is one of the main challenges facing modern societies. Consequently, the estimation of population, affluence, and technology impacts on air pollution concentrations (STIRPAT modeling) has become the cornerstone of environmental decision-making. Spatial effects are not usually included in STIRPAT modeling [...] Read more.
Air pollution control is one of the main challenges facing modern societies. Consequently, the estimation of population, affluence, and technology impacts on air pollution concentrations (STIRPAT modeling) has become the cornerstone of environmental decision-making. Spatial effects are not usually included in STIRPAT modeling of air pollution. However, space matters: accounting for spatial dependencies significantly improves the accuracy of estimates and forecasts, especially (or only) when dealing with small information units rather than with large ones (countries, large regions, provinces in China, counties and states in the USA, etc.). The latter scale is typical in the literature on air pollution due to the difficulties in finding data on its drivers at a true local scale. Accordingly, this paper has a double objective. The first is the estimation of a spatial panel data STIRPAT model, with the spatial units being both very small and also highly autonomous, developed municipalities. The second is to examine whether an environmental Kuznets curve relationship exists between income per capita and NOx concentrations. A case study has been carried out in the Autonomous Community of Madrid, Spain, at the municipal level. Full article
(This article belongs to the Special Issue Mathematics and Mathematical Physics Applied to Financial Markets)
Show Figures

Figure 1

Figure 1
<p>Municipalities, Statistical zones and Location of the NO<sub>x</sub> MS operating in the Autonomous Community of Madrid in the period 2000–2009. Green Triangle: Traffic stations; Red circle: Industrial stations; Blue square: Background stations.</p>
Full article ">Figure 2
<p>Location of the NO<sub>x</sub> MS operating in the city of Madrid in the period 2000–2009. Source: Own elaboration from <a href="http://www.madrid.com" target="_blank">www.madrid.com</a> accessed on 15 March 2021.</p>
Full article ">Figure 3
<p>NO<sub>x</sub> spatio-temporal prediction maps and prediction errors for the 179 municipalities of the Autonomous Community of Madrid, years 2000–2009.</p>
Full article ">Figure 3 Cont.
<p>NO<sub>x</sub> spatio-temporal prediction maps and prediction errors for the 179 municipalities of the Autonomous Community of Madrid, years 2000–2009.</p>
Full article ">Figure 4
<p>Left panel: Quartile map of average NO<sub>x</sub> concentrations values (2001–2009, by municipalities). Central panel: Quartile map of spatial fixed effects (SL-PD-STIRPAT, by municipalities). Right panel: Quartile map of spatial fixed effects (SD-PD-STIRPAT, by municipalities).</p>
Full article ">
11 pages, 231 KiB  
Article
On an Intuitionistic Fuzzy Form of the Goguen’s Implication
by Krassimir Atanassov, Nora Angelova and Vassia Atanassova
Mathematics 2021, 9(6), 676; https://doi.org/10.3390/math9060676 - 22 Mar 2021
Cited by 6 | Viewed by 1919
Abstract
In the present paper we construct a new intuitionistic fuzzy implication, giving intuitionistic fuzzy form to Goguen’s implication. Some of its basic properties are studied and illustrated with examples. Geometrical interpretations of the different forms of the new implication are given. Other forms [...] Read more.
In the present paper we construct a new intuitionistic fuzzy implication, giving intuitionistic fuzzy form to Goguen’s implication. Some of its basic properties are studied and illustrated with examples. Geometrical interpretations of the different forms of the new implication are given. Other forms of the Goguen’s implication are discussed. Full article
(This article belongs to the Special Issue Intuitionistic Fuzzy Sets and Applications)
Show Figures

Figure 1

Figure 1
<p>The geometrical interpretations of elements <math display="inline"><semantics> <mrow> <mi>x</mi> <mo>∈</mo> <mi>E</mi> </mrow> </semantics></math>.</p>
Full article ">Figure 2
<p>The geometrical interpretations of elements <span class="html-italic">x</span>, <span class="html-italic">y</span> and <math display="inline"><semantics> <mrow> <mi>x</mi> <mo>→</mo> <mi>y</mi> </mrow> </semantics></math>: first scenario.</p>
Full article ">Figure 3
<p>The geometrical interpretations of elements <span class="html-italic">x</span>, <span class="html-italic">y</span> and <math display="inline"><semantics> <mrow> <mi>x</mi> <mo>→</mo> <mi>y</mi> </mrow> </semantics></math>: second scenario.</p>
Full article ">Figure 4
<p>The geometrical interpretations of elements <span class="html-italic">x</span>, <span class="html-italic">y</span> and <math display="inline"><semantics> <mrow> <mi>x</mi> <mo>→</mo> <mi>y</mi> </mrow> </semantics></math>: third scenario.</p>
Full article ">Figure 5
<p>The geometrical interpretations of elements <span class="html-italic">x</span>, <span class="html-italic">y</span> and <math display="inline"><semantics> <mrow> <mi>x</mi> <mo>→</mo> <mi>y</mi> </mrow> </semantics></math>: fourth scenario.</p>
Full article ">
19 pages, 553 KiB  
Article
Mathematical Analysis of Oxygen Uptake Rate in Continuous Process under Caputo Derivative
by Rubayyi T. Alqahtani, Abdullahi Yusuf and Ravi P. Agarwal
Mathematics 2021, 9(6), 675; https://doi.org/10.3390/math9060675 - 22 Mar 2021
Cited by 16 | Viewed by 2734
Abstract
In this paper, the wastewater treatment model is investigated by means of one of the most robust fractional derivatives, namely, the Caputo fractional derivative. The growth rate is assumed to obey the Contois model, which is often used to model the growth of [...] Read more.
In this paper, the wastewater treatment model is investigated by means of one of the most robust fractional derivatives, namely, the Caputo fractional derivative. The growth rate is assumed to obey the Contois model, which is often used to model the growth of biomass in wastewaters. The characteristics of the model under consideration are derived and evaluated, such as equilibrium, stability analysis, and steady-state solutions. Further, important characteristics of the fractional wastewater model allow us to understand the dynamics of the model in detail. To this end, we discuss several important analyses of the fractional variant of the model under consideration. To observe the efficiency of the non-local fractional differential operator of Caputo over its counter-classical version, we perform numerical simulations. Full article
(This article belongs to the Special Issue Nonlinear Equations: Theory, Methods, and Applications)
Show Figures

Figure 1

Figure 1
<p>A steady-state diagram of the oxygen concentration, the substrate concentration, and the microorganism concentration varying the residence time <math display="inline"><semantics> <mi>τ</mi> </semantics></math> for different values of parameter <math display="inline"><semantics> <mi>β</mi> </semantics></math>. The value of the parameters stated in <a href="#mathematics-09-00675-t001" class="html-table">Table 1</a>. <math display="inline"><semantics> <mi>β</mi> </semantics></math> = 0.1 (Black color), <math display="inline"><semantics> <mi>β</mi> </semantics></math> = 0.5 (Blue color), <math display="inline"><semantics> <mi>β</mi> </semantics></math> = 1 (Red color).</p>
Full article ">Figure 1 Cont.
<p>A steady-state diagram of the oxygen concentration, the substrate concentration, and the microorganism concentration varying the residence time <math display="inline"><semantics> <mi>τ</mi> </semantics></math> for different values of parameter <math display="inline"><semantics> <mi>β</mi> </semantics></math>. The value of the parameters stated in <a href="#mathematics-09-00675-t001" class="html-table">Table 1</a>. <math display="inline"><semantics> <mi>β</mi> </semantics></math> = 0.1 (Black color), <math display="inline"><semantics> <mi>β</mi> </semantics></math> = 0.5 (Blue color), <math display="inline"><semantics> <mi>β</mi> </semantics></math> = 1 (Red color).</p>
Full article ">Figure 2
<p>Unfolding diagram for the minimum residence time in <a href="#mathematics-09-00675-f001" class="html-fig">Figure 1</a>a as a function of <span class="html-italic">β</span> and the influent concentration (<span class="html-italic">S</span><sub>0</sub>). The value of the parameters stated in <a href="#mathematics-09-00675-t001" class="html-table">Table 1</a>. (<b>a</b>) Minimum residence time versus parameter <span class="html-italic">S</span><sub>0</sub>. (<b>b</b>) Minimum residence time versus parameter <span class="html-italic">S</span><sub>0</sub>.</p>
Full article ">Figure 3
<p>Numerical simulation of the oxygen saturation concentration, the substrate concentration, and the microorganism concentration for different values of fractional order. The value of the parameters is stated in <a href="#mathematics-09-00675-t001" class="html-table">Table 1</a>. (<b>a</b>) Dynamic of the concentration of substrate. (<b>b</b>) Dynamic of the substrate concentration. (<b>c</b>) Dynamic of the microorganism concentration.</p>
Full article ">Figure 4
<p>Numerical simulation of the oxygen saturation concentration, the substrate concentration, and the microorganism concentration for different values of residence time. The value of the parameters is stated in <a href="#mathematics-09-00675-t001" class="html-table">Table 1</a>. (<b>a</b>) Dynamic of the concentration of substrate with different values of τ. (<b>b</b>) Dynamic of the substrate concentration with different values of τ. (<b>c</b>) Dynamic of the microorganism concentration with different values of τ.</p>
Full article ">
12 pages, 278 KiB  
Article
A Note on Some Definite Integrals of Arthur Erdélyi and George Watson
by Robert Reynolds and Allan Stauffer
Mathematics 2021, 9(6), 674; https://doi.org/10.3390/math9060674 - 22 Mar 2021
Viewed by 1675
Abstract
This manuscript concerns two definite integrals that could be connected to the Bose-Einstein and the Fermi-Dirac functions in the integrands, separately, with numerators slightly modified with a difference in two expressions that contain the Fourier kernel multiplied by a polynomial and its complex [...] Read more.
This manuscript concerns two definite integrals that could be connected to the Bose-Einstein and the Fermi-Dirac functions in the integrands, separately, with numerators slightly modified with a difference in two expressions that contain the Fourier kernel multiplied by a polynomial and its complex conjugate. In this work, we use our contour integral method to derive these definite integrals, which are given by 0ieimx(log(a)ix)keimx(log(a)+ix)k2eαx1dx and 0ieimx(log(a)ix)keimx(log(a)+ix)k2eαx+1dx in terms of the Lerch function. We use these two definite integrals to derive formulae by Erdéyli and Watson. We derive special cases of these integrals in terms of special functions not found in current literature. Special functions have the property of analytic continuation, which widens the range of computation of the variables involved. Full article
18 pages, 11597 KiB  
Article
Fractional System of Korteweg-De Vries Equations via Elzaki Transform
by Wenfeng He, Nana Chen, Ioannis Dassios, Nehad Ali Shah and Jae Dong Chung
Mathematics 2021, 9(6), 673; https://doi.org/10.3390/math9060673 - 22 Mar 2021
Cited by 28 | Viewed by 3243
Abstract
In this article, a hybrid technique, called the Iteration transform method, has been implemented to solve the fractional-order coupled Korteweg-de Vries (KdV) equation. In this method, the Elzaki transform and New Iteration method are combined. The iteration transform method solutions are obtained in [...] Read more.
In this article, a hybrid technique, called the Iteration transform method, has been implemented to solve the fractional-order coupled Korteweg-de Vries (KdV) equation. In this method, the Elzaki transform and New Iteration method are combined. The iteration transform method solutions are obtained in series form to analyze the analytical results of fractional-order coupled Korteweg-de Vries equations. To understand the analytical procedure of Iteration transform method, some numerical problems are presented for the analytical result of fractional-order coupled Korteweg-de Vries equations. It is also demonstrated that the current technique’s solutions are in good agreement with the exact results. The numerical solutions show that only a few terms are sufficient for obtaining an approximate result, which is efficient, accurate, and reliable. Full article
Show Figures

Figure 1

Figure 1
<p>Graphs of <math display="inline"><semantics> <mrow> <mi>μ</mi> <mo>(</mo> <mi>ζ</mi> <mo>,</mo> <mi>τ</mi> <mo>)</mo> </mrow> </semantics></math> and <math display="inline"><semantics> <mrow> <mi>ν</mi> <mo>(</mo> <mi>ζ</mi> <mo>,</mo> <mi>τ</mi> <mo>)</mo> </mrow> </semantics></math> at <math display="inline"><semantics> <mrow> <mi>ρ</mi> <mo>=</mo> <mn>1</mn> </mrow> </semantics></math> and <math display="inline"><semantics> <mrow> <mi>η</mi> <mo>=</mo> <mn>0.001</mn> </mrow> </semantics></math> of example 1.</p>
Full article ">Figure 2
<p>Error graphs of <math display="inline"><semantics> <mrow> <mi>μ</mi> <mo>(</mo> <mi>ζ</mi> <mo>,</mo> <mi>τ</mi> <mo>)</mo> </mrow> </semantics></math> and <math display="inline"><semantics> <mrow> <mi>ν</mi> <mo>(</mo> <mi>ζ</mi> <mo>,</mo> <mi>τ</mi> <mo>)</mo> </mrow> </semantics></math> at <math display="inline"><semantics> <mrow> <mi>ρ</mi> <mo>=</mo> <mn>1</mn> </mrow> </semantics></math> and <math display="inline"><semantics> <mrow> <mi>η</mi> <mo>=</mo> <mn>0.001</mn> </mrow> </semantics></math> of example 1.</p>
Full article ">Figure 3
<p>Graphs of <math display="inline"><semantics> <mrow> <mi>μ</mi> <mo>(</mo> <mi>ζ</mi> <mo>,</mo> <mi>τ</mi> <mo>)</mo> </mrow> </semantics></math> and <math display="inline"><semantics> <mrow> <mi>ν</mi> <mo>(</mo> <mi>ζ</mi> <mo>,</mo> <mi>τ</mi> <mo>)</mo> </mrow> </semantics></math> at <math display="inline"><semantics> <mrow> <mi>ρ</mi> <mo>=</mo> <mn>1</mn> </mrow> </semantics></math> of example 2.</p>
Full article ">Figure 4
<p>Error graphs of <math display="inline"><semantics> <mrow> <mi>μ</mi> <mo>(</mo> <mi>ζ</mi> <mo>,</mo> <mi>τ</mi> <mo>)</mo> </mrow> </semantics></math> and <math display="inline"><semantics> <mrow> <mi>ν</mi> <mo>(</mo> <mi>ζ</mi> <mo>,</mo> <mi>τ</mi> <mo>)</mo> </mrow> </semantics></math> at <math display="inline"><semantics> <mrow> <mi>ρ</mi> <mo>=</mo> <mn>1</mn> </mrow> </semantics></math> of example 2.</p>
Full article ">Figure 5
<p>Graphs of <math display="inline"><semantics> <mrow> <mi>μ</mi> <mo>(</mo> <mi>ζ</mi> <mo>,</mo> <mi>τ</mi> <mo>)</mo> </mrow> </semantics></math> and error plot at <math display="inline"><semantics> <mrow> <mi>ρ</mi> <mo>=</mo> <mn>1</mn> </mrow> </semantics></math> of example 3.</p>
Full article ">Figure 6
<p>Graphs of <math display="inline"><semantics> <mrow> <mi>ν</mi> <mo>(</mo> <mi>ζ</mi> <mo>,</mo> <mi>τ</mi> <mo>)</mo> </mrow> </semantics></math> and error plot at <math display="inline"><semantics> <mrow> <mi>ρ</mi> <mo>=</mo> <mn>1</mn> </mrow> </semantics></math> of example 3.</p>
Full article ">Figure 7
<p>Graphs of <math display="inline"><semantics> <mrow> <mi>ω</mi> <mo>(</mo> <mi>ζ</mi> <mo>,</mo> <mi>τ</mi> <mo>)</mo> </mrow> </semantics></math> and error plot at <math display="inline"><semantics> <mrow> <mi>ρ</mi> <mo>=</mo> <mn>1</mn> </mrow> </semantics></math> of example 3.</p>
Full article ">
14 pages, 660 KiB  
Article
Data-Driven Leak Localization in Urban Water Distribution Networks Using Big Data for Random Forest Classifier
by Ivana Lučin, Bože Lučin, Zoran Čarija and Ante Sikirica
Mathematics 2021, 9(6), 672; https://doi.org/10.3390/math9060672 - 22 Mar 2021
Cited by 28 | Viewed by 3518
Abstract
In the present paper, a Random Forest classifier is used to detect leak locations on two different sized water distribution networks with sparse sensor placement. A great number of leak scenarios were simulated with Monte Carlo determined leak parameters (leak location and emitter [...] Read more.
In the present paper, a Random Forest classifier is used to detect leak locations on two different sized water distribution networks with sparse sensor placement. A great number of leak scenarios were simulated with Monte Carlo determined leak parameters (leak location and emitter coefficient). In order to account for demand variations that occur on a daily basis and to obtain a larger dataset, scenarios were simulated with random base demand increments or reductions for each network node. Classifier accuracy was assessed for different sensor layouts and numbers of sensors. Multiple prediction models were constructed for differently sized leakage and demand range variations in order to investigate model accuracy under various conditions. Results indicate that the prediction model provides the greatest accuracy for the largest leaks, with the smallest variation in base demand (62% accuracy for greater- and 82% for smaller-sized networks, for the largest considered leak size and a base demand variation of ±2.5%). However, even for small leaks and the greatest base demand variations, the prediction model provided considerable accuracy, especially when localizing the sources of leaks when the true leak node and neighbor nodes were considered (for a smaller-sized network and a base demand of variation ±20% the model accuracy increased from 44% to 89% when top five nodes with greatest probability were considered, and for a greater-sized network with a base demand variation of ±10% the accuracy increased from 36% to 77%). Full article
(This article belongs to the Special Issue Artificial Intelligence and Big Data Computing)
Show Figures

Figure 1

Figure 1
<p>Hanoi network pattern demands.</p>
Full article ">Figure 2
<p>Hanoi network with pattern demands in nodes.</p>
Full article ">Figure 3
<p>Net3 network with two sensor layouts.</p>
Full article ">Figure 4
<p>Flowchart of data generation and the machine learning algorithm used for the prediction of leak location.</p>
Full article ">Figure 5
<p>Prediction of leak location for 30 day measurements with percentage of predicted leak nodes.</p>
Full article ">
17 pages, 287 KiB  
Article
Controllability for Retarded Semilinear Neutral Control Systems of Fractional Order in Hilbert Spaces
by Daewook Kim and Jin-Mun Jeong
Mathematics 2021, 9(6), 671; https://doi.org/10.3390/math9060671 - 21 Mar 2021
Viewed by 1585
Abstract
In this paper, we discuss the approximate controllability for a class of retarded semilinear neutral control systems of fractional order by investigating the relations between the reachable set of the semilinear retarded neutral system of fractional order and that of its corresponding linear [...] Read more.
In this paper, we discuss the approximate controllability for a class of retarded semilinear neutral control systems of fractional order by investigating the relations between the reachable set of the semilinear retarded neutral system of fractional order and that of its corresponding linear system. The research direction used here is to find the conditions for nonlinear terms so that controllability is maintained even in perturbations. Finally, we will show a simple example to which the main result can be applied. Full article
(This article belongs to the Special Issue Fractional Calculus and Nonlinear Systems)
17 pages, 2407 KiB  
Article
Close-Enough Facility Location
by Alejandro Moya-Martínez, Mercedes Landete and Juan Francisco Monge
Mathematics 2021, 9(6), 670; https://doi.org/10.3390/math9060670 - 21 Mar 2021
Cited by 2 | Viewed by 2424
Abstract
This paper introduces the concept of close-enough in the context of facility location. It is assumed that customers are willing to move from their homes to close-enough pickup locations. Given that the number of pickup locations is expanding every day, it is assumed [...] Read more.
This paper introduces the concept of close-enough in the context of facility location. It is assumed that customers are willing to move from their homes to close-enough pickup locations. Given that the number of pickup locations is expanding every day, it is assumed that pickup locations can be placed everywhere. Conversely, the set of potential location for opening facilities is discrete as well as the set of customers. Opening facilities and pickup points entails an installation budget and a distribution cost to transport goods from facilities to customers and pickup locations. The (p,t)-Close-Enough Facility Location Problem is the problem of deciding where to locate p facilities among the finite set of candidates, where to locate t pickup points in the plane and how to allocate customers to facilities or to pickup points so that all the demand is satisfied and the total cost is minimized. In this paper, it is proved that the set of initial infinite number of pickup locations is finite in practice. Two mixed-integer linear programming models are proposed for the discrete problem. The models are enhanced with valid inequalities and a branch and price algorithm is designed for the most promising model. The findings of a comprehensive computational study reveal the performance of the different models and the branch and price algorithm and illustrate the value of pickup locations. Full article
Show Figures

Figure 1

Figure 1
<p>Illustration of a solution with <math display="inline"><semantics> <mrow> <mi>p</mi> <mo>=</mo> <mn>2</mn> </mrow> </semantics></math> and <math display="inline"><semantics> <mrow> <mi>t</mi> <mo>=</mo> <mn>10</mn> <mo>.</mo> </mrow> </semantics></math></p>
Full article ">Figure 2
<p>Illustration of the statements in Proposition 1.</p>
Full article ">Figure 3
<p>Candidate pickup points when <math display="inline"><semantics> <mrow> <mi>I</mi> <mo>=</mo> <mi>J</mi> </mrow> </semantics></math>.</p>
Full article ">Figure 4
<p>Candidate pickup points for the example in <a href="#mathematics-09-00670-f001" class="html-fig">Figure 1</a>.</p>
Full article ">Figure 5
<p>Optimal integer and fractional solutions.</p>
Full article ">Figure 6
<p>Bounds in instance i60 on successive iterations.</p>
Full article ">
20 pages, 316 KiB  
Article
On the Local Convergence of Two-Step Newton Type Method in Banach Spaces under Generalized Lipschitz Conditions
by Akanksha Saxena, Ioannis K. Argyros, Jai P. Jaiswal, Christopher Argyros and Kamal R. Pardasani
Mathematics 2021, 9(6), 669; https://doi.org/10.3390/math9060669 - 21 Mar 2021
Cited by 3 | Viewed by 1695
Abstract
The motive of this paper is to discuss the local convergence of a two-step Newton-type method of convergence rate three for solving nonlinear equations in Banach spaces. It is assumed that the first order derivative of nonlinear operator satisfies the generalized Lipschitz i.e., [...] Read more.
The motive of this paper is to discuss the local convergence of a two-step Newton-type method of convergence rate three for solving nonlinear equations in Banach spaces. It is assumed that the first order derivative of nonlinear operator satisfies the generalized Lipschitz i.e., L-average condition. Also, some results on convergence of the same method in Banach spaces are established under the assumption that the derivative of the operators satisfies the radius or center Lipschitz condition with a weak L-average particularly it is assumed that L is positive integrable function but not necessarily non-decreasing. Our new idea gives a tighter convergence analysis without new conditions. The proposed technique is useful in expanding the applicability of iterative methods. Useful examples justify the theoretical conclusions. Full article
14 pages, 665 KiB  
Article
Calculation of Two Types of Quaternion Step Derivatives of Elementary Functions
by Ji Eun Kim
Mathematics 2021, 9(6), 668; https://doi.org/10.3390/math9060668 - 21 Mar 2021
Cited by 2 | Viewed by 2067
Abstract
We aim to get the step derivative of a complex function, as it derives the step derivative in the imaginary direction of a real function. Given that the step derivative of a complex function cannot be derived using i, which is used [...] Read more.
We aim to get the step derivative of a complex function, as it derives the step derivative in the imaginary direction of a real function. Given that the step derivative of a complex function cannot be derived using i, which is used to derive the step derivative of a real function, we intend to derive the complex function using the base direction of the quaternion. Because many analytical studies on quaternions have been conducted, various examples can be presented using the expression of the elementary function of a quaternion. In a previous study, the base direction of the quaternion was regarded as the base separate from the basis of the complex number. However, considering the properties of the quaternion, we propose two types of step derivatives in this study. The step derivative is first defined in the j direction, which includes a quaternion. Furthermore, the step derivative in the j+k2 direction is determined using the rule between bases i, j, and k defined in the quaternion. We present examples in which the definition of the j-step derivative and (j,k)-step derivative are applied to elementary functions ez, sinz, and cosz. Full article
(This article belongs to the Special Issue Nonlinear Equations: Theory, Methods, and Applications)
Show Figures

Figure 1

Figure 1
<p>(<b>a</b>) The result obtained by using the Maple plot to see what the step derivative has according to the size of <span class="html-italic">h</span>. (<b>b</b>) In the graph of (<b>a</b>), the result of zooming in about <span class="html-italic">h</span> near zero. In (<b>a</b>,<b>b</b>), the red graph represents the <span class="html-italic">j</span>-step derivative of <math display="inline"><semantics> <msup> <mi>e</mi> <mi>z</mi> </msup> </semantics></math> at <math display="inline"><semantics> <msub> <mi>z</mi> <mn>0</mn> </msub> </semantics></math> according to the size of <span class="html-italic">h</span>, and the blue constant graph represents the absolute value of the derivative of <math display="inline"><semantics> <msup> <mi>e</mi> <mi>z</mi> </msup> </semantics></math> at <math display="inline"><semantics> <msub> <mi>z</mi> <mn>0</mn> </msub> </semantics></math> by the definition of the derivative for a complex system.</p>
Full article ">Figure 2
<p>(<b>a</b>) The result of expressing the value of the relative error of the quaternion <span class="html-italic">j</span>-step derivative of <math display="inline"><semantics> <msup> <mi>e</mi> <mi>z</mi> </msup> </semantics></math> at <math display="inline"><semantics> <msub> <mi>z</mi> <mn>0</mn> </msub> </semantics></math> on the vertical axis according to the size of the horizontal axis <span class="html-italic">h</span> using the Maple plot. (<b>b</b>) In the graph of (<b>a</b>), the result of zooming in about <span class="html-italic">h</span> near <math display="inline"><semantics> <mfrac> <mi>π</mi> <mn>2</mn> </mfrac> </semantics></math>. It confirms to us how close the relative error is to zero.</p>
Full article ">Figure 3
<p>(<b>a</b>) Graph showing the absolute value of the quaternion <span class="html-italic">j</span>-step derivative of <math display="inline"><semantics> <mrow> <mo form="prefix">cos</mo> <mo>(</mo> <mi>z</mi> <mo>)</mo> </mrow> </semantics></math> at <math display="inline"><semantics> <msub> <mi>z</mi> <mn>0</mn> </msub> </semantics></math> according to the step size <span class="html-italic">h</span> driven by the Maple program. (<b>b</b>) In the graph of (<b>a</b>), the result of zooming in about <span class="html-italic">h</span> near <math display="inline"><semantics> <mfrac> <mrow> <mn>5</mn> <mi>π</mi> </mrow> <mn>8</mn> </mfrac> </semantics></math>. In (<b>a</b>,<b>b</b>), the red graph represents the <span class="html-italic">j</span>-step derivative of <math display="inline"><semantics> <mrow> <mo form="prefix">cos</mo> <mi>z</mi> </mrow> </semantics></math> at <math display="inline"><semantics> <msub> <mi>z</mi> <mn>0</mn> </msub> </semantics></math> according to the size of <span class="html-italic">h</span>, and the blue constant graph represents the absolute value of the derivative of <math display="inline"><semantics> <mrow> <mo form="prefix">cos</mo> <mi>z</mi> </mrow> </semantics></math> at <math display="inline"><semantics> <msub> <mi>z</mi> <mn>0</mn> </msub> </semantics></math> by the definition of the derivative for a complex system.</p>
Full article ">Figure 4
<p>(<b>a</b>) The result of expressing the value of the relative error of the quaternion <span class="html-italic">j</span>-step derivative of <math display="inline"><semantics> <mrow> <mo form="prefix">cos</mo> <mi>z</mi> </mrow> </semantics></math> at <math display="inline"><semantics> <msub> <mi>z</mi> <mn>0</mn> </msub> </semantics></math> on the vertical axis according to the size of the horizontal axis <span class="html-italic">h</span> using the Maple plot. (<b>b</b>) In the graph of (<b>a</b>), the result of zooming in about <span class="html-italic">h</span> near <math display="inline"><semantics> <mfrac> <mi>π</mi> <mn>2</mn> </mfrac> </semantics></math>. It confirms to us how close the relative error is to zero.</p>
Full article ">Figure 5
<p>(<b>a</b>) The result obtained by using the Maple plot to see what the step derivative has according to the size of <span class="html-italic">h</span>. (<b>b</b>) In the graph of (<b>a</b>), the result of zooming in about <span class="html-italic">h</span> near zero. In (<b>a</b>,<b>b</b>), according to the size of <span class="html-italic">h</span>, the green graph represents the <math display="inline"><semantics> <mrow> <mo>(</mo> <mi>j</mi> <mo>,</mo> <mi>k</mi> <mo>)</mo> </mrow> </semantics></math>-step derivative, the red graph represents the <span class="html-italic">j</span>-step derivative of <math display="inline"><semantics> <msup> <mi>e</mi> <mi>z</mi> </msup> </semantics></math> at <math display="inline"><semantics> <msub> <mi>z</mi> <mn>0</mn> </msub> </semantics></math>, and the blue constant graph represents the absolute value of the derivative of <math display="inline"><semantics> <msup> <mi>e</mi> <mi>z</mi> </msup> </semantics></math> at <math display="inline"><semantics> <msub> <mi>z</mi> <mn>0</mn> </msub> </semantics></math> by the definition of the derivative for a complex system.</p>
Full article ">Figure 6
<p>(<b>a</b>) The result of expressing the value of the relative error of the quaternion <math display="inline"><semantics> <mrow> <mo>(</mo> <mi>j</mi> <mo>,</mo> <mi>k</mi> <mo>)</mo> </mrow> </semantics></math>-step derivative of <math display="inline"><semantics> <msup> <mi>e</mi> <mi>z</mi> </msup> </semantics></math> at <math display="inline"><semantics> <msub> <mi>z</mi> <mn>0</mn> </msub> </semantics></math> on the vertical axis according to the size of the horizontal axis <span class="html-italic">h</span> using the Maple plot. (<b>b</b>) In the graph of (<b>a</b>), the result of zooming in about <span class="html-italic">h</span> near <math display="inline"><semantics> <mfrac> <mrow> <mn>3</mn> <mi>π</mi> </mrow> <mn>8</mn> </mfrac> </semantics></math>. It confirms to us how close the relative error is to zero.</p>
Full article ">Figure 7
<p>(<b>a</b>) The result obtained by using the Maple plot to see what the step derivative has according to the size of <span class="html-italic">h</span>. (<b>b</b>) In the graph of (<b>a</b>), the result of zooming in about <span class="html-italic">h</span> near the midpoints of <math display="inline"><semantics> <mfrac> <mrow> <mn>5</mn> <mi>π</mi> </mrow> <mn>8</mn> </mfrac> </semantics></math> and <math display="inline"><semantics> <mfrac> <mrow> <mn>11</mn> <mi>π</mi> </mrow> <mn>16</mn> </mfrac> </semantics></math>. In (<b>a</b>,<b>b</b>), the green graph represents the <math display="inline"><semantics> <mrow> <mo>(</mo> <mi>j</mi> <mo>,</mo> <mi>k</mi> <mo>)</mo> </mrow> </semantics></math>-step derivative, the red graph represents the <span class="html-italic">j</span>-step derivative of <math display="inline"><semantics> <mrow> <mo form="prefix">cos</mo> <mi>z</mi> </mrow> </semantics></math> at <math display="inline"><semantics> <msub> <mi>z</mi> <mn>0</mn> </msub> </semantics></math> according to the size of <span class="html-italic">h</span>, and the blue constant graph represents the absolute value of the derivative of <math display="inline"><semantics> <mrow> <mo form="prefix">cos</mo> <mi>z</mi> </mrow> </semantics></math> at <math display="inline"><semantics> <msub> <mi>z</mi> <mn>0</mn> </msub> </semantics></math> by the definition of the derivative for a complex system.</p>
Full article ">Figure 8
<p>(<b>a</b>) The result of expressing the value of the relative error of the quaternion <math display="inline"><semantics> <mrow> <mo>(</mo> <mi>j</mi> <mo>,</mo> <mi>k</mi> <mo>)</mo> </mrow> </semantics></math>-step derivative of <math display="inline"><semantics> <mrow> <mo form="prefix">cos</mo> <mi>z</mi> </mrow> </semantics></math> at <math display="inline"><semantics> <msub> <mi>z</mi> <mn>0</mn> </msub> </semantics></math> on the vertical axis according to the size of the horizontal axis <span class="html-italic">h</span> using the Maple plot. (<b>b</b>) In the graph of (<b>a</b>), the result of zooming in about <span class="html-italic">h</span> near <math display="inline"><semantics> <mfrac> <mi>π</mi> <mn>2</mn> </mfrac> </semantics></math>. The quaternion <math display="inline"><semantics> <mrow> <mo>(</mo> <mi>j</mi> <mo>,</mo> <mi>k</mi> <mo>)</mo> </mrow> </semantics></math>-step derivative of <math display="inline"><semantics> <mrow> <mo form="prefix">cos</mo> <mi>z</mi> </mrow> </semantics></math> has a relative error approximated to zero for <span class="html-italic">h</span> near <math display="inline"><semantics> <mrow> <mo>±</mo> <mfrac> <mi>π</mi> <mn>2</mn> </mfrac> </mrow> </semantics></math>.</p>
Full article ">Figure 9
<p>(<b>a</b>) shows the result of the real part of the step derivatives of <math display="inline"><semantics> <mrow> <mo form="prefix">sin</mo> <mi>z</mi> </mrow> </semantics></math> at <math display="inline"><semantics> <msub> <mi>z</mi> <mn>0</mn> </msub> </semantics></math> according to the size of <span class="html-italic">h</span> by using the Maple plot. (<b>b</b>) In the graph of (<b>a</b>), the result of zooming in about <span class="html-italic">h</span> near the midpoints of <math display="inline"><semantics> <mfrac> <mrow> <mn>5</mn> <mi>π</mi> </mrow> <mn>8</mn> </mfrac> </semantics></math> and <math display="inline"><semantics> <mfrac> <mrow> <mn>11</mn> <mi>π</mi> </mrow> <mn>16</mn> </mfrac> </semantics></math>. In (<b>a</b>,<b>b</b>), the green graph represents the real part of the <math display="inline"><semantics> <mrow> <mo>(</mo> <mi>j</mi> <mo>,</mo> <mi>k</mi> <mo>)</mo> </mrow> </semantics></math>-step derivative, the red graph represents the real part of the <span class="html-italic">j</span>-step derivative of <math display="inline"><semantics> <mrow> <mo form="prefix">cos</mo> <mi>z</mi> </mrow> </semantics></math> at <math display="inline"><semantics> <msub> <mi>z</mi> <mn>0</mn> </msub> </semantics></math> according to the size of <span class="html-italic">h</span>, and the blue constant graph represents the real part of the derivative of <math display="inline"><semantics> <mrow> <mo form="prefix">sin</mo> <mi>z</mi> </mrow> </semantics></math> at <math display="inline"><semantics> <msub> <mi>z</mi> <mn>0</mn> </msub> </semantics></math> by the definition of the derivative for a complex system.</p>
Full article ">Figure 10
<p>(<b>a</b>) shows the result of the imaginary part of the step derivatives of <math display="inline"><semantics> <mrow> <mo form="prefix">sin</mo> <mi>z</mi> </mrow> </semantics></math> at <math display="inline"><semantics> <msub> <mi>z</mi> <mn>0</mn> </msub> </semantics></math> according to the size of <span class="html-italic">h</span> by using the Maple plot. (<b>b</b>) In the graph of (<b>a</b>), the result of zooming in about <span class="html-italic">h</span> near <math display="inline"><semantics> <mi>π</mi> </semantics></math>. In (<b>a</b>,<b>b</b>), the green graph represents the imaginary part of the <math display="inline"><semantics> <mrow> <mo>(</mo> <mi>j</mi> <mo>,</mo> <mi>k</mi> <mo>)</mo> </mrow> </semantics></math>-step derivative, the red graph represents the imaginary part of the <span class="html-italic">j</span>-step derivative of <math display="inline"><semantics> <mrow> <mo form="prefix">cos</mo> <mi>z</mi> </mrow> </semantics></math> at <math display="inline"><semantics> <msub> <mi>z</mi> <mn>0</mn> </msub> </semantics></math> according to the size of <span class="html-italic">h</span>, and the blue constant graph represents the imaginary part of the derivative of <math display="inline"><semantics> <mrow> <mo form="prefix">sin</mo> <mi>z</mi> </mrow> </semantics></math> at <math display="inline"><semantics> <msub> <mi>z</mi> <mn>0</mn> </msub> </semantics></math> by the definition of the derivative for a complex system.</p>
Full article ">Figure 11
<p>(<b>a</b>) The result of expressing the value of the relative error of the quaternion <math display="inline"><semantics> <mrow> <mo>(</mo> <mi>j</mi> <mo>,</mo> <mi>k</mi> <mo>)</mo> </mrow> </semantics></math>-step derivative of <math display="inline"><semantics> <mrow> <mo form="prefix">sin</mo> <mi>z</mi> </mrow> </semantics></math> at <math display="inline"><semantics> <msub> <mi>z</mi> <mn>0</mn> </msub> </semantics></math> on the vertical axis according to the size of the horizontal axis <span class="html-italic">h</span> using the Maple plot. (<b>b</b>) In the graph of (<b>a</b>), the result of zooming in about <span class="html-italic">h</span> near zero. It confirms that the quaternion <math display="inline"><semantics> <mrow> <mo>(</mo> <mi>j</mi> <mo>,</mo> <mi>k</mi> <mo>)</mo> </mrow> </semantics></math>-step derivative of <math display="inline"><semantics> <mrow> <mo form="prefix">sin</mo> <mi>z</mi> </mrow> </semantics></math> has a relative error approximated to the minimum value for <span class="html-italic">h</span> near zero.</p>
Full article ">
16 pages, 3821 KiB  
Article
Fuzzy Numerical Solution via Finite Difference Scheme of Wave Equation in Double Parametrical Fuzzy Number Form
by Maryam Almutairi, Hamzeh Zureigat, Ahmad Izani Ismail and Ali Fareed Jameel
Mathematics 2021, 9(6), 667; https://doi.org/10.3390/math9060667 - 21 Mar 2021
Cited by 16 | Viewed by 2437
Abstract
The use of fuzzy partial differential equations has become an important tool in which uncertainty or vagueness exists to model real-life problems. In this article, two numerical techniques based on finite difference schemes that are the centered time center space and implicit schemes [...] Read more.
The use of fuzzy partial differential equations has become an important tool in which uncertainty or vagueness exists to model real-life problems. In this article, two numerical techniques based on finite difference schemes that are the centered time center space and implicit schemes to solve fuzzy wave equations were used. The core of the article is to formulate a new form of centered time center space and implicit schemes to obtain numerical solutions fuzzy wave equations in the double parametric fuzzy number approach. Convex normalized triangular fuzzy numbers are represented by fuzziness, based on a double parametric fuzzy number form. The properties of fuzzy set theory are used for the fuzzy analysis and formulation of the proposed numerical schemes followed by the new proof stability thermos under in the double parametric form of fuzzy numbers approach. The consistency and the convergence of the proposed scheme are discussed. Two test examples are carried out to illustrate the feasibility of the numerical schemes and the new results are displayed in the forms of tables and figures where the results show that the schemes have not only been effective for accuracy but also for reducing computational cost. Full article
(This article belongs to the Special Issue Computational Mathematics and Neural Systems)
Show Figures

Figure 1

Figure 1
<p>The lower exact solution of Equation (31) at <math display="inline"><semantics> <mrow> <mi>t</mi> <mo>=</mo> <mn>0.01</mn> <mo>,</mo> <mi>x</mi> <mo>=</mo> <mn>0.1</mn> </mrow> </semantics></math>, <math display="inline"><semantics> <mrow> <mi>r</mi> <mo>=</mo> <mn>0</mn> <mo> </mo> <mi>and</mi> <mo> </mo> <mi>β</mi> <mo>=</mo> <mn>1</mn> </mrow> </semantics></math>.</p>
Full article ">Figure 2
<p>The upper exact solution of Equation (31) at <math display="inline"><semantics> <mrow> <mi>t</mi> <mo>=</mo> <mn>0.01</mn> <mo>,</mo> <mi>x</mi> <mo>=</mo> <mn>0.1</mn> </mrow> </semantics></math>, <math display="inline"><semantics> <mrow> <mo> </mo> <mi>r</mi> <mo>=</mo> <mn>0</mn> <mo> </mo> <mi>and</mi> <mo> </mo> <mi>β</mi> <mo>=</mo> <mn>1</mn> </mrow> </semantics></math>.</p>
Full article ">Figure 3
<p>The exact and numerical solution of Equation (31) by CTCS and implicit schemes at <math display="inline"><semantics> <mrow> <mi>t</mi> <mo>=</mo> <mn>0.05</mn> </mrow> </semantics></math> and <math display="inline"><semantics> <mrow> <mi>x</mi> <mo>=</mo> <mn>0.9</mn> </mrow> </semantics></math> for all <math display="inline"><semantics> <mrow> <mi>r</mi> <mo>,</mo> <mi>β</mi> <mo>∈</mo> <mrow> <mo>[</mo> <mrow> <mn>0</mn> <mo>,</mo> <mn>1</mn> </mrow> <mo>]</mo> </mrow> </mrow> </semantics></math>.</p>
Full article ">Figure 4
<p>The exact and numerical solution of Equation (31) by implicit at <math display="inline"><semantics> <mrow> <mi>t</mi> <mo>=</mo> <mn>0.5</mn> </mrow> </semantics></math> and <math display="inline"><semantics> <mrow> <mi>x</mi> <mo>=</mo> <mn>0.9</mn> </mrow> </semantics></math> for all <math display="inline"><semantics> <mrow> <mi>r</mi> <mo>,</mo> <mi>β</mi> <mo>∈</mo> <mrow> <mo>[</mo> <mrow> <mn>0</mn> <mo>,</mo> <mn>1</mn> </mrow> <mo>]</mo> </mrow> </mrow> </semantics></math>.</p>
Full article ">Figure 5
<p>The exact solution (lower solution) of Equation (33) at <math display="inline"><semantics> <mrow> <mi>t</mi> <mo>=</mo> <mn>0.01</mn> <mo>,</mo> <mi>x</mi> <mn>0.1</mn> </mrow> </semantics></math>, <math display="inline"><semantics> <mrow> <mi>r</mi> <mo>=</mo> <mn>0</mn> <mo> </mo> <mi>and</mi> <mo> </mo> <mi>β</mi> <mo>=</mo> <mn>0</mn> </mrow> </semantics></math>.</p>
Full article ">Figure 6
<p>The exact solution (upper solution) of Equation (33) at <math display="inline"><semantics> <mrow> <mo> </mo> <mi>t</mi> <mo>=</mo> <mn>0.01</mn> <mo>,</mo> <mi>x</mi> <mn>0.1</mn> </mrow> </semantics></math>, <math display="inline"><semantics> <mrow> <mi>r</mi> <mo>=</mo> <mn>0</mn> <mo> </mo> <mi>and</mi> <mo> </mo> <mi>β</mi> <mo>=</mo> <mn>0</mn> <mo>.</mo> </mrow> </semantics></math></p>
Full article ">Figure 7
<p>The exact and numerical solution of Equation (33) implicit at <math display="inline"><semantics> <mrow> <mi>t</mi> <mo>=</mo> <mn>0.05</mn> </mrow> </semantics></math> and <math display="inline"><semantics> <mrow> <mi>x</mi> <mo>=</mo> <mn>0.9</mn> </mrow> </semantics></math> for all <math display="inline"><semantics> <mrow> <mi>r</mi> <mo>,</mo> <mi>β</mi> <mo>∈</mo> <mrow> <mo>[</mo> <mrow> <mn>0</mn> <mo>,</mo> <mn>1</mn> </mrow> <mo>]</mo> </mrow> </mrow> </semantics></math>.</p>
Full article ">
26 pages, 1287 KiB  
Article
Recognition and Analysis of Image Patterns Based on Latin Squares by Means of Computational Algebraic Geometry
by Raúl M. Falcón
Mathematics 2021, 9(6), 666; https://doi.org/10.3390/math9060666 - 21 Mar 2021
Cited by 2 | Viewed by 2027
Abstract
With the particular interest of being implemented in cryptography, the recognition and analysis of image patterns based on Latin squares has recently arisen as an efficient new approach for classifying partial Latin squares into isomorphism classes. This paper shows how the use of [...] Read more.
With the particular interest of being implemented in cryptography, the recognition and analysis of image patterns based on Latin squares has recently arisen as an efficient new approach for classifying partial Latin squares into isomorphism classes. This paper shows how the use of a Computer Algebra System (CAS) becomes necessary to delve into this aspect. Thus, the recognition and analysis of image patterns based on these combinatorial structures benefits from the use of computational algebraic geometry to determine whether two given partial Latin squares describe the same affine algebraic set. This paper delves into this topic by focusing on the use of a CAS to characterize when two partial Latin squares are either partial transpose or partial isotopic. Full article
(This article belongs to the Special Issue Computer Algebra and Its Applications)
Show Figures

Figure 1

Figure 1
<p>Isomorphism classes of Latin squares of order four.</p>
Full article ">Figure 2
<p>Standard <math display="inline"><semantics> <mrow> <mn>90</mn> <mo>×</mo> <mn>90</mn> </mrow> </semantics></math> image patterns associated to the 35 representatives of isomorphism classes of Latin squares of order four described in <a href="#mathematics-09-00666-f001" class="html-fig">Figure 1</a>.</p>
Full article ">Figure 3
<p>Standard <math display="inline"><semantics> <mrow> <mn>3</mn> <mo>×</mo> <mn>3</mn> </mrow> </semantics></math> image patterns associated to <math display="inline"><semantics> <msub> <mi>L</mi> <mrow> <mn>4.3</mn> </mrow> </msub> </semantics></math>, <math display="inline"><semantics> <msub> <mi>L</mi> <mrow> <mn>4.10</mn> </mrow> </msub> </semantics></math>, <math display="inline"><semantics> <msub> <mi>L</mi> <mrow> <mn>4.13</mn> </mrow> </msub> </semantics></math>, <math display="inline"><semantics> <msub> <mi>L</mi> <mrow> <mn>4.16</mn> </mrow> </msub> </semantics></math> and <math display="inline"><semantics> <msub> <mi>L</mi> <mrow> <mn>4.20</mn> </mrow> </msub> </semantics></math>.</p>
Full article ">Figure 4
<p>Standard <math display="inline"><semantics> <mrow> <mn>3</mn> <mo>×</mo> <mn>3</mn> </mrow> </semantics></math> image patterns associated to <math display="inline"><semantics> <msub> <mi>L</mi> <mrow> <mn>4.25</mn> </mrow> </msub> </semantics></math>, <math display="inline"><semantics> <msub> <mi>L</mi> <mrow> <mn>4.26</mn> </mrow> </msub> </semantics></math>, <math display="inline"><semantics> <msub> <mi>L</mi> <mrow> <mn>4.27</mn> </mrow> </msub> </semantics></math>, <math display="inline"><semantics> <msub> <mi>L</mi> <mrow> <mn>4.29</mn> </mrow> </msub> </semantics></math> and <math display="inline"><semantics> <msub> <mi>L</mi> <mrow> <mn>4.30</mn> </mrow> </msub> </semantics></math>.</p>
Full article ">Figure 5
<p>Latin square of order 256 represented by colors.</p>
Full article ">Figure 6
<p>Running time (in seconds) required for computing the cardinality of the set <math display="inline"><semantics> <mrow> <msub> <mi mathvariant="script">V</mi> <mi mathvariant="double-struck">C</mi> </msub> <mrow> <mo>(</mo> <mi>I</mi> <mrow> <mo>(</mo> <msub> <mi mathvariant="script">P</mi> <mrow> <mn>90</mn> <mo>,</mo> <mn>90</mn> <mo>;</mo> <mi>s</mi> </mrow> </msub> <mrow> <mo>(</mo> <mi>L</mi> <mo>)</mo> </mrow> <mo>)</mo> </mrow> <mo>)</mo> </mrow> </mrow> </semantics></math>, with <math display="inline"><semantics> <mrow> <mn>1</mn> <mo>≤</mo> <mi>s</mi> <mo>≤</mo> <mn>256</mn> </mrow> </semantics></math>, and <span class="html-italic">L</span> being the Latin square described in <a href="#mathematics-09-00666-f005" class="html-fig">Figure 5</a>.</p>
Full article ">Figure 7
<p>Standard sets of <math display="inline"><semantics> <mrow> <mn>90</mn> <mo>×</mo> <mn>90</mn> </mrow> </semantics></math> image patterns associated to the dihedral group (<b>top</b>) and the abelian group (<b>bottom</b>) of order six.</p>
Full article ">Figure 8
<p>Standard sets of <math display="inline"><semantics> <mrow> <mn>90</mn> <mo>×</mo> <mn>90</mn> </mrow> </semantics></math> image patterns associated to the complete graph <math display="inline"><semantics> <msub> <mi>K</mi> <mn>4</mn> </msub> </semantics></math> (<b>top</b>) and the cycle <math display="inline"><semantics> <msub> <mi>C</mi> <mn>4</mn> </msub> </semantics></math> (<b>bottom</b>).</p>
Full article ">Figure 9
<p>Running time (in seconds) required for computing the cardinality of the set <math display="inline"><semantics> <mrow> <msub> <mi mathvariant="script">V</mi> <mi mathvariant="double-struck">Q</mi> </msub> <mrow> <mo>(</mo> <msub> <mi>I</mi> <mi>PT</mi> </msub> <mrow> <mo>(</mo> <mi>L</mi> <mo>)</mo> </mrow> <mo>)</mo> </mrow> </mrow> </semantics></math>, for random Latin squares <math display="inline"><semantics> <mrow> <mi>L</mi> <mo>∈</mo> <msub> <mi mathvariant="script">L</mi> <mi>n</mi> </msub> </mrow> </semantics></math>, with <math display="inline"><semantics> <mrow> <mn>1</mn> <mo>≤</mo> <mi>n</mi> <mo>≤</mo> <mn>14</mn> </mrow> </semantics></math>.</p>
Full article ">Figure 10
<p>Running time (in seconds) required for computing the cardinality of the set <math display="inline"><semantics> <mrow> <msub> <mi mathvariant="script">V</mi> <mi mathvariant="double-struck">Q</mi> </msub> <mrow> <mo>(</mo> <msub> <mi>I</mi> <mi>PT</mi> </msub> <mrow> <mo>(</mo> <mi>L</mi> <mo>)</mo> </mrow> <mo>)</mo> </mrow> </mrow> </semantics></math>, for random partial Latin squares <math display="inline"><semantics> <mrow> <mi>L</mi> <mo>∈</mo> <msub> <mi mathvariant="script">L</mi> <mrow> <mn>10</mn> <mo>;</mo> <mi>m</mi> </mrow> </msub> </mrow> </semantics></math>, with <math display="inline"><semantics> <mrow> <mn>1</mn> <mo>≤</mo> <mi>m</mi> <mo>≤</mo> <mn>100</mn> </mrow> </semantics></math>.</p>
Full article ">Figure 11
<p>Running time (in seconds) required for computing the cardinality of the set <math display="inline"><semantics> <mrow> <msub> <mi mathvariant="script">V</mi> <mi mathvariant="double-struck">Q</mi> </msub> <mrow> <mo>(</mo> <msub> <mi>I</mi> <mi>PI</mi> </msub> <mrow> <mo>(</mo> <mi>L</mi> <mo>,</mo> <mi>L</mi> <mo>)</mo> </mrow> <mo>)</mo> </mrow> </mrow> </semantics></math>, for random partial Latin squares <math display="inline"><semantics> <mrow> <mi>L</mi> <mo>∈</mo> <msub> <mi mathvariant="script">L</mi> <mrow> <mn>7</mn> <mo>;</mo> <mi>m</mi> </mrow> </msub> </mrow> </semantics></math>, with <math display="inline"><semantics> <mrow> <mn>1</mn> <mo>≤</mo> <mi>m</mi> <mo>≤</mo> <mn>49</mn> </mrow> </semantics></math>.</p>
Full article ">
Previous Issue
Next Issue
Back to TopTop