[go: up one dir, main page]

Next Issue
Volume 10, March
Previous Issue
Volume 10, January


Coatings, Volume 10, Issue 2 (February 2020) – 106 articles

Cover Story (view full-size image): 
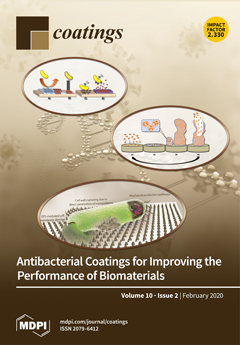
Biomedical devices have become essential in health care. However, the bacterial contamination that can develop in implanted devices can have severe consequences. Commonly, these infections are treated with antibiotics, but biofilm formation on implant surfaces can reduce the effectiveness of these antibiotics. In this context, antibacterial coatings are considered an excellent strategy for avoiding biofilm formation and, therefore, mitigating the resulting complications. Several main strategies are available for the development and successful fabrication of antibacterial coatings, such as steric, electrostatic, contact killing, and biocide release effects. View this paper.
  • Issues are regarded as officially published after their release is announced to the table of contents alert mailing list.
  • You may sign up for e-mail alerts to receive table of contents of newly released issues.
  • PDF is the official format for papers published in both, html and pdf forms. To view the papers in pdf format, click on the "PDF Full-text" link, and use the free Adobe Reader to open them.
Order results
Result details
Section
Select all
Export citation of selected articles as:
13 pages, 3346 KiB  
Article
Increasing the Efficiency of Dye-Sensitized Solar Cells by Adding Nickel Oxide Nanoparticles to Titanium Dioxide Working Electrodes
by Chih-Hung Tsai, Chia-Ming Lin and Yen-Cheng Liu
Coatings 2020, 10(2), 195; https://doi.org/10.3390/coatings10020195 - 24 Feb 2020
Cited by 11 | Viewed by 4317
Abstract
In this study, nickel oxide (NiO) nanoparticles were added to a titanium dioxide (TiO2) nanoparticle paste to fabricate a dye-sensitized solar cell (DSSC) working electrode by using a screen-printing method. The effects of the NiO proportion in the TiO2 paste [...] Read more.
In this study, nickel oxide (NiO) nanoparticles were added to a titanium dioxide (TiO2) nanoparticle paste to fabricate a dye-sensitized solar cell (DSSC) working electrode by using a screen-printing method. The effects of the NiO proportion in the TiO2 paste on the TiO2 working electrode, DSSC devices, and electron transport characteristics were comprehensively investigated. The results showed that adding NiO nanoparticles to the TiO2 working electrode both inhibited electron transport (a negative effect) and prevented electron recombination with the electrolyte (a positive effect). The electron transit time was extended following an increase in the amount of NiO nanoparticles added, confirming that NiO inhibited electron transport. Furthermore, the energy level difference between TiO2 and NiO generated a potential barrier that prevented the recombination of the electrons in the TiO2 conduction band with the I3- ions in the electrolyte. When the TiO2–NiO ratio was 99:1, the positive effects outweighed the negative effects. Therefore, this ratio was the optimal TiO2–NiO ratio in the electrode for electron transport. The DSSCs with a TiO2–NiO (99:1) working electrode exhibited an optimal power conversion efficiency of 8.39%, which was higher than the DSSCs with a TiO2 working electrode. Full article
(This article belongs to the Special Issue Mesoporous Metal Oxide Films)
Show Figures

Figure 1

Figure 1
<p>The SEM images of the (<b>a</b>) TiO<sub>2</sub>, (<b>b</b>) TiO<sub>2</sub>–NiO (99:1), (<b>c</b>) TiO<sub>2</sub>–NiO (98:2), and (<b>d</b>) TiO<sub>2</sub>–NiO (97:3) working electrodes.</p>
Full article ">Figure 2
<p>The SEM cross-sectional image of the working electrode.</p>
Full article ">Figure 3
<p>The EDS results of the (<b>a</b>) TiO<sub>2</sub>, (<b>b</b>) TiO<sub>2</sub>–NiO (99:1), (<b>c</b>) TiO<sub>2</sub>–NiO (98:2), and (<b>d</b>) TiO<sub>2</sub>–NiO (97:3) working electrodes.</p>
Full article ">Figure 4
<p>The XRD analysis results of various working electrodes.</p>
Full article ">Figure 5
<p>The (<b>a</b>) O1s and (<b>b</b>) Ti2p XPS analysis results of various working electrodes.</p>
Full article ">Figure 6
<p>The full spectrum XPS analysis results of various working electrodes.</p>
Full article ">Figure 7
<p>The <span class="html-italic">J</span>–<span class="html-italic">V</span> curves of the dye-sensitized solar cells (DSSCs) based on various working electrodes.</p>
Full article ">Figure 8
<p>The incident photon-to-electron conversion efficiency (IPCE) results of the DSSCs based on various working electrodes.</p>
Full article ">Figure 9
<p>The electrochemical impedance spectroscopy (EIS) results of the DSSCs based on various working electrodes.</p>
Full article ">Figure 10
<p>The (<b>a</b>) intensity-modulated photocurrent spectroscopy (IMPS) and (<b>b</b>) intensity-modulated photovoltage spectroscopy (IMVS) results of the DSSCs based on various working electrodes.</p>
Full article ">Figure 11
<p>The mechanism of electron transport in TiO<sub>2</sub> and TiO<sub>2</sub>–NiO working electrodes.</p>
Full article ">
11 pages, 3630 KiB  
Article
Forward Current Transport Properties of AlGaN/GaN Schottky Diodes Prepared by Atomic Layer Deposition
by Hogyoung Kim, Seok Choi and Byung Joon Choi
Coatings 2020, 10(2), 194; https://doi.org/10.3390/coatings10020194 - 24 Feb 2020
Cited by 9 | Viewed by 3275
Abstract
Atomic layer deposited AlGaN on GaN substrate with different thicknesses was prepared and the electron transport mechanism of AlGaN/GaN Schottky diodes was investigated. Above 348 K, both 5 and 10 nm thick AlGaN showed that the thermionic emission model with inhomogeneous Schottky barrier [...] Read more.
Atomic layer deposited AlGaN on GaN substrate with different thicknesses was prepared and the electron transport mechanism of AlGaN/GaN Schottky diodes was investigated. Above 348 K, both 5 and 10 nm thick AlGaN showed that the thermionic emission model with inhomogeneous Schottky barrier could explain the forward current transport. Analysis using a dislocation-related tunneling model showed that the current values for 10 nm thick AlGaN was matched well to the experimental data while those were not matched for 5 nm thick AlGaN. The higher density of surface (and interface) states was found for 5 nm thick AlGaN. In other words, a higher density of surface donors, as well as a thinner AlGaN layer for 5 nm thick AlGaN, enhanced the tunneling current. Full article
Show Figures

Figure 1

Figure 1
<p>(<b>a</b>) X-ray photoelectron spectroscopy (XPS) Al 2<span class="html-italic">p</span> core-level spectrum obtained from 10 nm thick AlGaN surface and (<b>b</b>) schematic layer structures of the devices.</p>
Full article ">Figure 2
<p>Current–voltage (<span class="html-italic">I</span>–<span class="html-italic">V</span>) data obtained at various temperatures: (<b>a</b>) 5 nm and (<b>b</b>) 10 nm thick AlGaN samples. The inset in (<b>a</b>) shows the reverse leakage current densities at −10 V.</p>
Full article ">Figure 3
<p>(<b>a</b>) Barrier height vs. 1/2<span class="html-italic">kT</span> plots and (<b>b</b>) modified Richardson plots. The inset in (<b>a</b>) shows the ideality factors.</p>
Full article ">Figure 4
<p>The fitting results of the forward <span class="html-italic">I</span>–<span class="html-italic">V</span> data at 298 K for a 10 nm thick AlGaN sample are shown.</p>
Full article ">Figure 5
<p>(<b>a</b>) Barrier heights obtained from thermionic emission (TE) component and (<b>b</b>) flat-band barrier heights. The inset in (<b>a</b>) shows the series resistances obtained from the fitting.</p>
Full article ">Figure 6
<p>Tunneling saturation current and barrier energy vs. temperature.</p>
Full article ">Figure 7
<p>Atomic force microscope (AFM) images of (<b>a</b>) 5 nm and (<b>b</b>) 10 nm thick AlGaN surface scanned over 1 μm × 1 μm.</p>
Full article ">Figure 8
<p>(<b>a</b>) Capacitance–voltage (<span class="html-italic">C</span>–<span class="html-italic">V</span>) characteristics measured at 100 kHz and (<b>b</b>) carrier concentration profiles vs. depth.</p>
Full article ">Figure 9
<p>The energy distribution curves of the interface states obtained from the high- and low-frequency <span class="html-italic">C</span>–<span class="html-italic">V</span> characteristics.</p>
Full article ">Figure 10
<p>Schematic band diagrams presenting the dominant current transport under forward bias conditions for (<b>a</b>) 5 and (<b>b</b>) 10 nm thick AlGaN.</p>
Full article ">
34 pages, 11659 KiB  
Review
Percolation Model for Renewable-Carbon Doped Functional Composites in Packaging Application: A Brief Review
by Bo Sun, Fangong Kong, Min Zhang, Weijun Wang, Birat Singh KC, Jimi Tjong and Mohini Sain
Coatings 2020, 10(2), 193; https://doi.org/10.3390/coatings10020193 - 24 Feb 2020
Cited by 8 | Viewed by 4502
Abstract
This review summarizes the application of percolation theory for the behavior simulation of renewable-carbon in its doped packaging composites. Such dopant-reinforced materials have sparked considerable interest due to the significant improvement on the aesthetic and mechanical properties at considerable low filler content (<1% [...] Read more.
This review summarizes the application of percolation theory for the behavior simulation of renewable-carbon in its doped packaging composites. Such dopant-reinforced materials have sparked considerable interest due to the significant improvement on the aesthetic and mechanical properties at considerable low filler content (<1% in some cases), which would further boost their potential use in the food and pharmaceutical packaging industries. We focused mainly on the percolation behavior, which is closely related to the distribution of renewable carbon particles in the presence of polymeric matrix. The effect of geometry, alignment and surface property is of particular relevance to the percolation threshold of composites containing carbon fillers. Validity, as well as limitations of the mostly used percolation models, is further discussed. Finally, despite its recent emergence as functional filler, carbon-based nanocellulose has been extensively developed for a wide range of applications. This inspired the concept to use nanocellulose as a secondary bio-additive for packaging purposes, such as functional nanocellulose-coated film where primarily synthetic polymers are used. The microstructure and functionality of rod-like nanocellulose in its use for film composite are specifically discussed. Full article
(This article belongs to the Special Issue Bio-Based Active Packaging for Shelf Life Extension)
Show Figures

Figure 1

Figure 1
<p>Chemical modification of CNT or graphene via four typical schemes [<a href="#B12-coatings-10-00193" class="html-bibr">12</a>].</p>
Full article ">Figure 2
<p>SEM images of carbonized bamboo (<b>a</b>), and bamboo-derived granular renewable carbon with magnification of ×100 (<b>b</b>), ×1500 (<b>c</b>) and ×5000 (<b>d</b>) [<a href="#B14-coatings-10-00193" class="html-bibr">14</a>].</p>
Full article ">Figure 3
<p>Mechanism for granular carbon in enriching the hydrogen-utilizing methanogens, Geobacter and other methanogens capable of direct interspecies electron transfer, to accelerate the methane generation and sludge consumption [<a href="#B16-coatings-10-00193" class="html-bibr">16</a>].</p>
Full article ">Figure 4
<p>SEM images of a typical powdered renewable carbon (<b>a</b>,<b>b</b>) and transmission electron microscopy (TEM) images corresponding to its pore structure (<b>c</b>,<b>d</b>). Insets in (<b>c</b>,<b>d</b>) show the FFT pattern which confirms the amorphous structure of renewable carbon [<a href="#B17-coatings-10-00193" class="html-bibr">17</a>].</p>
Full article ">Figure 5
<p>Rod-like CNT/graphene doped composites with anticipated enhanced properties [<a href="#B12-coatings-10-00193" class="html-bibr">12</a>].</p>
Full article ">Figure 6
<p>Incorporation of CNT into PHBV: PLA blends and their corresponding properties [<a href="#B24-coatings-10-00193" class="html-bibr">24</a>].</p>
Full article ">Figure 7
<p>Schematic diagram of site percolation (<b>a</b>) and probability of percolation (<b>b</b>) [<a href="#B32-coatings-10-00193" class="html-bibr">32</a>].</p>
Full article ">Figure 8
<p>Schematic of finite and infinite clusters with a percolation concept (<b>a</b>), and series/parallel springs model for mechanical response of the percolated composite (<b>b</b>) [<a href="#B29-coatings-10-00193" class="html-bibr">29</a>].</p>
Full article ">Figure 9
<p>Three fundamental geometries of plates (<b>a</b>–<b>c</b>), and computer realization of one hundred circular plates in 3D space (<b>d</b>) [<a href="#B34-coatings-10-00193" class="html-bibr">34</a>].</p>
Full article ">Figure 10
<p>Scaled particle concentration c<sub>p</sub> = πDL<sup>2</sup>ρ<sub>p</sub>/4 at the percolation threshold as a function of the dimensionless field strength, <span class="html-italic">βK</span>. Where D refers to the diameter (particles were presumed mutually impenetrable rigid cylinders), L refers to the length and ρ<sub>p</sub> is percolation threshold). Solid lines— connectivity percolation; dashed curves—contact-volume approach for λ/D = 0.3 (top), 0.6 (middle) and 1 (bottom). The percolating network only existed in the enclosed areas. The shaded area is the region of coexisting isotropic (paranematic) and nematic phases. Inset (<b>a</b>): calculated percolation thresholds scaled to the zero-field value c<sup>0</sup><sub>p</sub>. Inset (<b>b</b>): order parameter S<sub>2</sub> with, from steepest to flattest, λ/D = 0.3, 0.6 and 1. The dots indicate the largest value of |<span class="html-italic">βK|</span> that allows for a percolation threshold [<a href="#B38-coatings-10-00193" class="html-bibr">38</a>].</p>
Full article ">Figure 11
<p>Alignment of MWCNT in epoxy nanocomposites (<b>a</b>), and Raman spectra of aligned MWCNT/epoxy composites, showing different G-band peak intensities as the change of the direction of applied polarized light against the CNT alignment (<b>b</b>) [<a href="#B41-coatings-10-00193" class="html-bibr">41</a>].</p>
Full article ">Figure 12
<p>Quasi-static fracture surface morphologies of neat epoxy (<b>a</b>), 0.3 wt% of randomly distributed MWCNT-nanocomposites (<b>b</b>), 0.3 wt% of aligned MWCNT-nanocomposites (<b>c</b> and <b>d</b>), crack bridged by aligned single and bundle MWCNT (<b>e</b>) and after MWCNT pull-out (<b>f</b>) [<a href="#B41-coatings-10-00193" class="html-bibr">41</a>].</p>
Full article ">Figure 13
<p>Schematic representation of nanocomposite cylinder with functionally graded (FG) distribution along with CNT coordinates (<b>A</b>), and representative volume element (RVE) with Eshelby cluster model of agglomerated CNT (<b>B</b>) [<a href="#B42-coatings-10-00193" class="html-bibr">42</a>].</p>
Full article ">Figure 14
<p>Polymeric composite which consists of both continuous carbon nanotube (CNT) and chemically modified CNT or graphene carbon as matrix modifiers (<b>A</b>), and loss modulus and electrical conductivity with respect to interfacial volume fraction in CNT or graphene carbon nanocomposites (<b>B</b>) [<a href="#B12-coatings-10-00193" class="html-bibr">12</a>].</p>
Full article ">Figure 14 Cont.
<p>Polymeric composite which consists of both continuous carbon nanotube (CNT) and chemically modified CNT or graphene carbon as matrix modifiers (<b>A</b>), and loss modulus and electrical conductivity with respect to interfacial volume fraction in CNT or graphene carbon nanocomposites (<b>B</b>) [<a href="#B12-coatings-10-00193" class="html-bibr">12</a>].</p>
Full article ">Figure 15
<p>The preparation procedure of polyimide composite film with MWNT carbon (<b>a</b>), and Young’s modulus of PI-MWNT composites films against the MWNT content (<b>b</b>) [<a href="#B48-coatings-10-00193" class="html-bibr">48</a>].</p>
Full article ">Figure 16
<p>SEM pattern of the cross-section of PI-MWNT (MWNT = 1.14 vol%) composite film (<b>a</b>), and the enlargement of its selected area (<b>b</b>) [<a href="#B48-coatings-10-00193" class="html-bibr">48</a>].</p>
Full article ">Figure 17
<p>A semi-directed site percolation cluster on the square lattice, containing N = 17 sites (filled circles) on a strip of width n = 5, due to periodic boundary conditions the sites denoted by 1 and 1′, are identified. The strip is infinite along the horizontal axis (the preferred direction). In contrast to the case of fully directed percolation, vertical lines of the lattice are not directed, which means that the set of all semi-directed percolation clusters includes the set of all possible fully directed clusters [<a href="#B54-coatings-10-00193" class="html-bibr">54</a>].</p>
Full article ">Figure 18
<p>Increased alignment of prolate ellipsoids at various nematic order parameter &lt;S&gt; of (<b>a</b>) 0, (<b>b</b>) 0.25, (<b>c</b>) 0.5 and (<b>d</b>) 0.9. The green fillers are percolating clusters, while red fillers are other isolated clusters. The m value is equal to m<sub>min</sub> (m≥m<sub>min</sub>=3〈S〉/(1−〈S〉)) [<a href="#B40-coatings-10-00193" class="html-bibr">40</a>].</p>
Full article ">Figure 19
<p>Schematic diagram of dual percolation network constructed by the cooperation of EG and MWCNT in the matrix. Follow the direction of the arrows, MWCNT content inside of the PP/EG-MWCNT ternary composites is increasing [<a href="#B58-coatings-10-00193" class="html-bibr">58</a>].</p>
Full article ">Figure 20
<p>Infrared camera images of samples that represent the effect of dual percolation [<a href="#B59-coatings-10-00193" class="html-bibr">59</a>].</p>
Full article ">Figure 21
<p>Tensile strength of SiO<sub>2</sub>-g-PS/PP composites as a function of the volume fraction of SiO<sub>2</sub> (<b>a</b>), and area under the tensile stress–strain curve of SiO<sub>2</sub>-g-PS/PP composites as a function of the stress volume fraction of φ<sub>s</sub> (<b>b</b>) [<a href="#B60-coatings-10-00193" class="html-bibr">60</a>].</p>
Full article ">Figure 22
<p>Interfacial debonding model [<a href="#B67-coatings-10-00193" class="html-bibr">67</a>].</p>
Full article ">Figure 23
<p>Representative microscale volume element (RVE) containing straight carbon fillers [<a href="#B79-coatings-10-00193" class="html-bibr">79</a>].</p>
Full article ">Figure 24
<p>Sketch of volume element (RVE) with ellipsoidal bundles of carbon fillers [<a href="#B79-coatings-10-00193" class="html-bibr">79</a>].</p>
Full article ">Figure 25
<p>Molecular structure of nanocellulose macromolecule (<b>a</b>), TEM image of nanocellulose (<b>b</b>) and nanocellulose-SO compounds (<b>c</b>) [<a href="#B9-coatings-10-00193" class="html-bibr">9</a>,<a href="#B87-coatings-10-00193" class="html-bibr">87</a>,<a href="#B88-coatings-10-00193" class="html-bibr">88</a>].</p>
Full article ">Figure 26
<p>Swelling kinetics (Q<sub>t</sub>) and linear plotting (t/Q<sub>t</sub>) of BE film and co-blended film at different submerse time (t) (tests were conducted inside of distilled water at room temperature) (<b>A</b>), gas diffusion dynamic as the relative humidity (RH) increases (<b>B</b>), and effect of relative humidity (RH, %) on the gas permeability and gas selectivity of the BE film (Bottom Side, test was conducted at the temperature of 25 °C) (<b>C</b>) [<a href="#B9-coatings-10-00193" class="html-bibr">9</a>].</p>
Full article ">Figure 27
<p>Interaction between oxidized nanocellulose and pulp fibrils (<b>a</b>), and tensile strength of composites made from unmodified nanocellulose-fibrils, modified nanocellulose-fibrils and PEI-fibrils (<b>b</b>) [<a href="#B89-coatings-10-00193" class="html-bibr">89</a>].</p>
Full article ">
14 pages, 4487 KiB  
Article
Effect of the Compactness on the Texture and Friction of Asphalt Concrete Intended for Wearing Course of the Road Pavement
by Tengda Wang, Liqun Hu, Xiaodong Pan, Song Xu and Di Yun
Coatings 2020, 10(2), 192; https://doi.org/10.3390/coatings10020192 - 24 Feb 2020
Cited by 9 | Viewed by 3147
Abstract
Maintaining good friction performance of highway pavement is important for road safety. The friction is affected by many factors, and the present study investigates the effect of the compactness on the texture and friction of asphalt concrete during the polishing process. Two three-dimensional [...] Read more.
Maintaining good friction performance of highway pavement is important for road safety. The friction is affected by many factors, and the present study investigates the effect of the compactness on the texture and friction of asphalt concrete during the polishing process. Two three-dimensional (3D) texture parameters and the mean texture depth (MTD) were used to characterize the surface texture of AC-13 asphalt concrete. The differences of surface texture are then being analyzed among the pavement in the field, rutting slabs with 97% compactness (RS-97), rutting slabs with 100% compactness (RS-100), and rutting slabs with 103% (RS-103). The rutting slabs were polished by a circular vehicle simulator (CVS). The 3D surface topography, British pendulum number (BPN), and MTD were obtained during the polishing process. Test results show that the surface of the rutting slab can be smoother as the compactness increased from 97% to 103%. During the whole polishing process, the rutting slab with smaller compactness had higher value of the MTD. The impact of compactness on the BPN is insignificant during the polishing process, but rutting slabs with smaller compactness had better friction at high speed as the result of the higher MTD. Full article
(This article belongs to the Collection Pavement Surface Coatings)
Show Figures

Figure 1

Figure 1
<p>Gradation curve.</p>
Full article ">Figure 2
<p>Wheel roller compactor.</p>
Full article ">Figure 3
<p>The three-dimensional (3D) surface topography acquisition process. (<b>a</b>) Field setup. (<b>b</b>) Laboratory setup for the rutting slabs.</p>
Full article ">Figure 4
<p>Circular vehicle simulator (CVS) configuration.</p>
Full article ">Figure 5
<p>CVS working scene.</p>
Full article ">Figure 6
<p>British pendulum tester.</p>
Full article ">Figure 7
<p>Reconstructed 3D surfaces topography. (<b>a</b>) Pavement in the field; (<b>b</b>) rutting slabs (RS)-97; (<b>c</b>) RS-100; and (<b>d</b>) RS-103.</p>
Full article ">Figure 8
<p>Surface texture parameters without load repetitions. (<b>a</b>) MTD; (<b>b</b>) <math display="inline"><semantics> <mrow> <mi>S</mi> <mi>q</mi> </mrow> </semantics></math> ; and (<b>c</b>) <math display="inline"><semantics> <mrow> <mi>S</mi> <mi>d</mi> <mi>r</mi> </mrow> </semantics></math>.</p>
Full article ">Figure 9
<p>Change of texture parameters with load repetitions. (<b>a</b>) MTD; (<b>b</b>) <math display="inline"><semantics> <mrow> <mi>S</mi> <mi>q</mi> </mrow> </semantics></math> ; and (<b>c</b>) <math display="inline"><semantics> <mrow> <mi>S</mi> <mi>d</mi> <mi>r</mi> </mrow> </semantics></math>.</p>
Full article ">Figure 9 Cont.
<p>Change of texture parameters with load repetitions. (<b>a</b>) MTD; (<b>b</b>) <math display="inline"><semantics> <mrow> <mi>S</mi> <mi>q</mi> </mrow> </semantics></math> ; and (<b>c</b>) <math display="inline"><semantics> <mrow> <mi>S</mi> <mi>d</mi> <mi>r</mi> </mrow> </semantics></math>.</p>
Full article ">Figure 10
<p>General polishing mechanisms.</p>
Full article ">Figure 11
<p>Fixed area of the RS-97 after different load repetitions.</p>
Full article ">Figure 12
<p>Changes of British pendulum number (BPN) with load repetitions.</p>
Full article ">Figure 13
<p>Changes of friction parameter (<span class="html-italic">F</span><sub>60</sub>) with load repetitions.</p>
Full article ">
11 pages, 2221 KiB  
Article
Development of Apatite Nuclei Precipitated Carbon Nanotube-Polyether Ether Ketone Composite with Biological and Electrical Properties
by Chihiro Ishizaki, Takeshi Yabutsuka and Shigeomi Takai
Coatings 2020, 10(2), 191; https://doi.org/10.3390/coatings10020191 - 24 Feb 2020
Cited by 7 | Viewed by 3183
Abstract
We aimed to impart apatite-forming ability to carbon nanotube (CNT)-polyether ether ketone (PEEK) composite (CNT-PEEK). Since CNT possesses electrical conductivity, CNT-PEEK can be expected to useful not only for implant materials but also biosensing devices. First of all, in this study, CNT-PEEK was [...] Read more.
We aimed to impart apatite-forming ability to carbon nanotube (CNT)-polyether ether ketone (PEEK) composite (CNT-PEEK). Since CNT possesses electrical conductivity, CNT-PEEK can be expected to useful not only for implant materials but also biosensing devices. First of all, in this study, CNT-PEEK was treated with sulfuric acid to form fine pores on its surface. Then, the hydrophilicity of the substrate was improved by oxygen plasma treatment. After that, the substrate was promptly immersed in simulated body fluid (SBF) which was adjusted at pH 8.40, 25.0 °C (alkaline SBF) and held in an incubator set at 70.0 °C for 1 day to deposit fine particles of amorphous calcium phosphate, which we refer to as ‘apatite nuclei’. When thus-treated CNT-PEEK was immersed in SBF, its surface was spontaneously covered with hydroxyapatite within 1 day by apatite nuclei deposited in the fine pores and high apatite-forming ability was successfully demonstrated. The CNT-PEEK also showed conductivity even after the above treatment and showed smaller impedance than that of the untreated CNT-PEEK substrate. Full article
(This article belongs to the Special Issue Synthetic and Biological-Derived Hydroxyapatite Implant Coatings)
Show Figures

Figure 1

Figure 1
<p>(<b>a</b>,<b>c</b>,<b>e</b>,<b>g</b>) SEM micrographs and (<b>b</b>,<b>d</b>,<b>f</b>,<b>h</b>) EDX profiles of the surfaces of (<b>a</b>,<b>b</b>) Sample N, (<b>c</b>,<b>d</b>) Sample S, (<b>e</b>,<b>f</b>) Sample SG, (<b>g</b>,<b>h</b>) Sample SGA.</p>
Full article ">Figure 2
<p>XPS narrow spectra around binding energy of (<b>a</b>) S2<span class="html-italic">p</span>, (<b>b</b>) C1<span class="html-italic">s</span>, (<b>c</b>) P2<span class="html-italic">p</span> and (<b>d</b>) Ca2<span class="html-italic">p</span> on the surface of Samples N, S, SG and SGA.</p>
Full article ">Figure 3
<p>Water contact angle on the surface of Samples N, S, SG and SGA. The symbol ‘**’ indicates <span class="html-italic">p</span> &lt; 0.01 and the no symbol indicates <span class="html-italic">p</span> &gt; 0.05 by one-way ANOVA followed by the Tukey’s tests.</p>
Full article ">Figure 4
<p>TF-XRD profiles of on the surface of Sample SGA before and after immersion in SBF for 1 day, 4 days and 7 days.</p>
Full article ">Figure 5
<p>(<b>a</b>,<b>c</b>,<b>e</b>) SEM micrographs and (<b>b</b>,<b>d</b>,<b>f</b>) EDX profiles of the surface of Sample SGA after immersion in SBF for (<b>a</b>,<b>b</b>) 1 day, (<b>c</b>,<b>d</b>) 4 days and (<b>e</b>,<b>f</b>) 7 days.</p>
Full article ">Figure 6
<p>Nyquist plots of Samples N, S, SG and SGA.</p>
Full article ">
28 pages, 8045 KiB  
Article
Production of High Silicon-Doped Hydroxyapatite Thin Film Coatings via Magnetron Sputtering: Deposition, Characterisation, and In Vitro Biocompatibility
by Samuel C. Coe, Matthew D. Wadge, Reda M. Felfel, Ifty Ahmed, Gavin S. Walker, Colin A. Scotchford and David M. Grant
Coatings 2020, 10(2), 190; https://doi.org/10.3390/coatings10020190 - 23 Feb 2020
Cited by 15 | Viewed by 5246
Abstract
In recent years, it has been found that small weight percent additions of silicon to HA can be used to enhance the initial response between bone tissue and HA. A large amount of research has been concerned with bulk materials, however, only recently [...] Read more.
In recent years, it has been found that small weight percent additions of silicon to HA can be used to enhance the initial response between bone tissue and HA. A large amount of research has been concerned with bulk materials, however, only recently has the attention moved to the use of these doped materials as coatings. This paper focusses on the development of a co-RF and pulsed DC magnetron sputtering methodology to produce a high percentage Si containing HA (SiHA) thin films (from 1.8 to 13.4 wt.%; one of the highest recorded in the literature to date). As deposited thin films were found to be amorphous, but crystallised at different annealing temperatures employed, dependent on silicon content, which also lowered surface energy profiles destabilising the films. X-ray photoelectron spectroscopy (XPS) was used to explore the structure of silicon within the films which were found to be in a polymeric (SiO2; Q4) state. However, after annealing, the films transformed to a SiO44−, Q0, state, indicating that silicon had substituted into the HA lattice at higher concentrations than previously reported. A loss of hydroxyl groups and the maintenance of a single-phase HA crystal structure further provided evidence for silicon substitution. Furthermore, a human osteoblast cell (HOB) model was used to explore the in vitro cellular response. The cells appeared to prefer the HA surfaces compared to SiHA surfaces, which was thought to be due to the higher solubility of SiHA surfaces inhibiting protein mediated cell attachment. The extent of this effect was found to be dependent on film crystallinity and silicon content. Full article
(This article belongs to the Special Issue Physical Vapor Deposited Biomedical Coatings)
Show Figures

Graphical abstract

Graphical abstract
Full article ">Figure 1
<p>Bright field TEM image of (<b>A</b>) the tungsten/HA/Ti lamellar showing the HA thin film deposited on a CPTi substrate with associated selected area electron diffraction (SAED) patterns of the crystalline W protective coating, polycrystalline HA coating and crystalline Ti substrate and (<b>B</b>) the tungsten/SiHA3/Ti lamellar showing an amorphous SiHA3 coating on a CPTi substrate and associated SAED.</p>
Full article ">Figure 2
<p>Representative SEM micrographs displaying the surface morphology of HA and SiHA thin films where (<b>A</b>) is an as deposited thin film on a CPTi substrate, (<b>B</b>) annealed at 600 °C in flowing argon for 2 h and (<b>C</b>) 700 °C in flowing argon for 2 h. Images taken from HA samples.</p>
Full article ">Figure 3
<p>(<b>A</b>) and (<b>B</b>) Representative XRD plots of as deposited HA (unannealed), and HA and SiHA thin films on silicon (100) wafers heat treated at 600 °C and 700 °C in argon, respectively. (<b>C</b>) XRD plots of successive heat treatments on SiHA3 on silicon (100) wafer. Planes refer to ICDD 09-432 HA.</p>
Full article ">Figure 4
<p>RHEED diffraction patterns of HA and SiHA thin films sputtered onto CPTi discs and annealed at 600 °C and 700 °C for A-D and E-H, respectively. Images were obtained at 200 keV. (<b>A</b>) and (<b>E</b>) HA, (<b>B</b>) and (<b>F</b>) SiHA1, (<b>C</b>) and (<b>G</b>) SiHA2 and (<b>D</b>) and (<b>H</b>) SiHA3.</p>
Full article ">Figure 5
<p>Comparisons of RHEED patterns for (<b>A</b>) SiHA1 film on a CPTi disc annealed at 700 °C in flowing argon for 2 h and (<b>B)</b> CPTi sample annealed in air at 750 °C for 1 h. All indexed planes match to ICDD card 76-1939 (Rutile) unless indexed with a superscript a plus diagonal arrows indicating possible HA reflections matching to ICDD card 09-432 (HA).</p>
Full article ">Figure 6
<p>Representative high-resolution XPS spectra for HA, SiHA3 and 600 °C annealed SiHA3 samples, demonstrating the binding energy data for O 1s, Ca 2p, P 2p and Si 2p spectra, where appropriate.</p>
Full article ">Figure 7
<p>FTIR Spectra of (<b>A</b>) as deposited HA and SiHA thin films on CPTi substrates and (<b>B</b>) HA and SiHA thin films on CPTi substrates heat treated at 600 °C for 2 h in argon.</p>
Full article ">Figure 8
<p>R<sub>a</sub> roughness values for CPTi, HA and SiHA thin films as received and heat treated at 600 and 700 °C in flowing argon for 2 h.</p>
Full article ">Figure 9
<p>Measured contact angles of water droplets on HA and SiHA thin sputtered films. Mean ± standard error of the mean where n ≥ 6. Also shown are digitally enhanced representative grayscale photographs of water droplets on (<b>A</b>) HA (<b>B</b>) SiHA1 (<b>C</b>) SiHA2 and (<b>D</b>) SiHA3 thin sputtered films, showing the effect of silicon doping on the contact angle of water. Photographs taken from as deposited sample set.</p>
Full article ">Figure 10
<p>Combined elusion testing results showing: (<b>A<sub>1</sub></b>) Metabolic activity and (<b>A<sub>2</sub></b>) DNA content of pre-seeded HOB cells exposed to dissolution media of HA and SiHA samples for 24 h (Both expressed as mean ± standard error; n = 6); (<b>B</b>–<b>D</b>) SEM micrographs of HOB cell morphology on thermanox slides after 24 h of culture in media containing the dissolution products of (<b>B</b>) HA, (<b>C</b>) SiHA1, (<b>D</b>) SiHA2 and (<b>E</b>) SiHA3 thin films (insert image in B shows cells culture in fresh media for reference).</p>
Full article ">Figure 11
<p>The 90 min attachment of HOB cells to as deposited and heat treated HA and SiHA films at 600 °C. Values are mean ± standard error where n = 6.</p>
Full article ">Figure 12
<p>Combined cellular proliferation data showing: AlamarBlue™ assay of HOBs on HA and SiHA surfaces heat treated at (<b>A</b>) 600 °C and (<b>B</b>) 700 °C; DNA content of HOBs on HA and SiHA surfaces heat treated at (<b>C</b>) 600 °C and (<b>D</b>) 700 °C; ALP activity of HOBs on HA and SiHA surfaces heat treated at (<b>E</b>) 600 °C and (<b>F</b>) 700 °C (All graphs are plotted with mean ± standard error of the mean where n = 6); SEM micrographs of cellular morphology showing 14 day incubation on 600 °C annealed (<b>G</b>) Thermanox (Control), (<b>H</b>) HA, and (<b>I</b>) SiHA3; Further SEM micrographs of cell morphology on 700 °C annealed HA and SiHA1 samples incubated at day (<b>J</b>),(<b>M</b>) 1, (<b>K</b>),(<b>N</b>) 7 and (<b>L)</b>,(<b>O</b>) 14, respectively.</p>
Full article ">Figure A1
<p>Percentage of HA and SiHA thin films annealed at 600 °C remaining as a percentage of original coating Ca content. Data plotted is mean ± standard error of the mean; n = 4. Non-linear one-phase decay regression plots were calculated using GraphPad Prism software based on the data shown. Due to the high variance of the SiHA1 sample, a suitable regression line was unable to be plotted, hence a probable area has manually been fitted for visual enhancement.</p>
Full article ">Figure A2
<p>XRD plot for a Plasma Biotal plasma sprayed copper backed target. All major diffraction planes are indexed. Arrows indicate potential β-TCP secondary phase, however, with the low intensity accurate quantification is difficult.</p>
Full article ">
15 pages, 4383 KiB  
Article
Graphene Oxide Reinforcing Genipin Crosslinked Chitosan-Gelatin Blend Films
by George Mihail Vlasceanu, Livia Elena Crica, Andreea Madalina Pandele and Mariana Ionita
Coatings 2020, 10(2), 189; https://doi.org/10.3390/coatings10020189 - 23 Feb 2020
Cited by 29 | Viewed by 4362
Abstract
This study was targeted towards the synthesis and characterization of new chitosan–gelatin biocomposite films reinforced with graphene oxide and crosslinked with genipin. The composites’ mode of structuration was characterized by Fourier Transform Infrared spectroscopy and X-ray diffraction, while morphology and topography were investigated [...] Read more.
This study was targeted towards the synthesis and characterization of new chitosan–gelatin biocomposite films reinforced with graphene oxide and crosslinked with genipin. The composites’ mode of structuration was characterized by Fourier Transform Infrared spectroscopy and X-ray diffraction, while morphology and topography were investigated by scanning electron microscopy, nano-computer tomography and profilometry. Eventually, thermal stability was evaluated through thermogravimetrical analysis, mechanical properties assessment was carried out to detect potential improvements as a result of graphene oxide (GO) addition and in vitro enzyme degradation was performed to discern the most promising formulations for the maturation of the study towards in vivo assays. In accordance with similar works, results indicated the possibility of using GO as an agent for adjusting films’ roughness, chemical stability and polymer structuration. The enzymatic stability of chitosan–gelatin (CHT-GEL) films was also improved by genipin (GEN) crosslinking and GO supplementation, with the best results being obtained for CHT-GEL-GEN and CHT-GEL-GEN-GO3 (crosslinked formulation with 3 wt.% GO). Yet, contrary to previous reports, no great enhancement of CHT-GEN-GEL-GO thermal performances was obtained by the incorporation of GO. Full article
(This article belongs to the Special Issue Advances in Graphene Based Composite for Bio-Applications)
Show Figures

Figure 1

Figure 1
<p>FTIR spectra of CHT-GEL (<b>A</b>), CHT-GEL-GEN (<b>B</b>), CHT-GEL-GEN-GO05 (<b>C</b>), CHT-GEL-GEN-GO1 (<b>D</b>), CHT-GEL-GEN-GO2 (<b>E</b>), CHT-GEL-GEN-GO3 (<b>F</b>), graphene oxide powder (<b>G</b>).</p>
Full article ">Figure 2
<p>XRD spectra of CHT-GEL (<b>A</b>), CHT-GEL-GEN (<b>B</b>), CHT-GEL-GEN-GO05 (<b>C</b>), CHT-GEL-GEN-GO1 (<b>D</b>), CHT-GEL-GEN-GO2 (<b>E</b>), CHT-GEL-GEN-GO3 (<b>F</b>), graphene oxide powder (<b>G</b>).</p>
Full article ">Figure 3
<p>TGA curves obtained for the biopolymer–GO composite films and control.</p>
Full article ">Figure 4
<p>SEM images of CHT-GEL (<b>A1</b>,<b>A2</b>), CHT-GEL-GEN (<b>B1</b>,<b>B2</b>), CHT-GEL-GEN-GO05 (<b>C1</b>,<b>C2</b>), CHT-GEL-GEN-GO1 (<b>D1</b>,<b>D2</b>), CHT-GEL-GEN-GO2 (<b>E1</b>,<b>E2</b>), CHT-GEL-GEN-GO3 (<b>F1</b>,<b>F2</b>) films at two different magnifications (1—10,000×, 2—20,000×).</p>
Full article ">Figure 4 Cont.
<p>SEM images of CHT-GEL (<b>A1</b>,<b>A2</b>), CHT-GEL-GEN (<b>B1</b>,<b>B2</b>), CHT-GEL-GEN-GO05 (<b>C1</b>,<b>C2</b>), CHT-GEL-GEN-GO1 (<b>D1</b>,<b>D2</b>), CHT-GEL-GEN-GO2 (<b>E1</b>,<b>E2</b>), CHT-GEL-GEN-GO3 (<b>F1</b>,<b>F2</b>) films at two different magnifications (1—10,000×, 2—20,000×).</p>
Full article ">Figure 5
<p>Tensile modulus and tensile strength of CHT-GEL and CHT-GEL-GEN-GO composite films.</p>
Full article ">Figure 6
<p>NanoCT images of CHT-GEL (<b>A</b>), CHT-GEL-GEN (<b>B</b>), CHT-GEL-GEN-GO05 (<b>C</b>), CHT-GEL-GEN–GO1 (<b>D</b>), CHT-GEL-GEN-GO2 (<b>E</b>), CHT-GEL-GEN-GO3 (<b>F</b>).</p>
Full article ">Figure 7
<p>Time-dependent enzyme degradation weight loss of the composite films and controls.</p>
Full article ">
11 pages, 2689 KiB  
Article
Acrylic Pressure-Sensitive Adhesive Reinforced with Aluminum Nitride and Its Thermal Properties: Effect of Surface Treatment and Particle Size
by Garima Mittal, Soo Jin Park and Kyong Yop Rhee
Coatings 2020, 10(2), 188; https://doi.org/10.3390/coatings10020188 - 22 Feb 2020
Cited by 6 | Viewed by 4627
Abstract
Thermal interface materials (TIMs) are very crucial for better heat-transfer in electronics working as an interfacial connection between heat generators and heat sinks. This study is focused on the pressure-sensitive acrylic adhesive tape reinforced with micron-sized and nano-sized aluminum nitride (AlN) particles where [...] Read more.
Thermal interface materials (TIMs) are very crucial for better heat-transfer in electronics working as an interfacial connection between heat generators and heat sinks. This study is focused on the pressure-sensitive acrylic adhesive tape reinforced with micron-sized and nano-sized aluminum nitride (AlN) particles where the surface modification of AlN particles is done using (3-Aminopropyl) triethoxysilane (3-APTES). The physicochemical analysis of the silanized AlN particles is done using FTIR spectroscopy and scanning electron microscopy (SEM). Furthermore, thermal properties along with thermal conductivity and thermal diffusion are also studied. The main outcome of this study shows that the sample containing surface-treated AlN particles exhibits better thermal conductivity than that of the samples containing µ and nano-sized of AlN due to the comparatively better interactions with the matrix. Full article
(This article belongs to the Special Issue Advances in Nanoscale Coatings for Composites)
Show Figures

Figure 1

Figure 1
<p>Schematic representation of the synthesis of acrylic pressure-sensitive/ aluminum nitride (AlN) composites.</p>
Full article ">Figure 2
<p>Fourier-transform infrared spectroscopy (FTIR) spectra of non-treated aluminum nitride (AlN) and Si–AlN.</p>
Full article ">Figure 3
<p>FE-SEM images of (<b>a</b>) non-treated AlN and (<b>b</b>) Si–AlN (Inset: 100 KX).</p>
Full article ">Figure 4
<p>FE-SEM images of (<b>a</b>,<b>b</b>) µ-AlN/n-AlN/PSA, (<b>c</b>,<b>d</b>) Si-µ-AlN/n-AlN/PSA, and (<b>e</b>,<b>f</b>) Si-µ-AlN/PSA, respectively, where (<b>a</b>,<b>c</b>, and <b>e</b>) are showing surface morphology, while (<b>b</b>,<b>d</b>, and <b>f</b>) are the cutting edge of samples.</p>
Full article ">Figure 5
<p>TGA thermograms of PSA, µ-AlN/n-AlN/PSA, Si-µ-AlN/n-AlN/PSA, and Si-µ-AlN/PSA, respectively.</p>
Full article ">Figure 6
<p>(<b>a</b>) Thermal conductivity, (<b>b</b>) thermal diffusivity, and (<b>c</b>) specific heat of µ-AlN/n-AlN/PSA, Si-µ-AlN/n-AlN/PSA, and Si-µ-AlN/PSA, respectively (where * represents the p-value &lt; 0.05, i.e., significant value).</p>
Full article ">Figure 7
<p>Schematic representation of the heat conduction path in different PSA composites: (<b>a</b>,<b>d</b>) µ-AlN/n-AlN/PSA, (<b>b</b>,<b>e</b>) Si-µ-AlN/n-AlN/PSA, and (<b>c</b>,<b>f</b>) Si-µ-AlN/PSA, respectively.</p>
Full article ">
14 pages, 6908 KiB  
Article
Synchronous Shot Peening Applied on HVOF for Improvement on Wear Resistance of Fe-based Amorphous Coating
by Zhidan Zhou, Junchao Shang, Yongxiong Chen, Xiubing Liang, Baolong Shen and Zhibin Zhang
Coatings 2020, 10(2), 187; https://doi.org/10.3390/coatings10020187 - 20 Feb 2020
Cited by 9 | Viewed by 2917
Abstract
Shot peening was used synchronously to improve Fe-based amorphous coating performance by delivering ZrO2 ceramic particles into a low-temperature region of a flame during the high velocity oxygen flame (HVOF) spray process. The coating became denser, and its hardness became higher via [...] Read more.
Shot peening was used synchronously to improve Fe-based amorphous coating performance by delivering ZrO2 ceramic particles into a low-temperature region of a flame during the high velocity oxygen flame (HVOF) spray process. The coating became denser, and its hardness became higher via the new process. Moreover, the compressive residual stress was induced by shot peening. The results from the dry friction test indicated that the coating’s wear resistance was enhanced obviously. The wear mechanism of coatings with and without shot peening is an abrasive wear combined with an oxidation wear at wear test conditions of a low load and a low frequency. The coating with the best wear resistance did not have the strongest microhardness but had the highest compressive residual stress. The compressive residual stress had a significant positive influence on the wear resistance at a low frequency, while its effect is weakened at a high frequency. Full article
(This article belongs to the Section Corrosion, Wear and Erosion)
Show Figures

Figure 1

Figure 1
<p>Micromorphologies of powders: (<b>a</b>) Fe-based amorphous powders; (<b>b</b>) ZrO<sub>2</sub> powders.</p>
Full article ">Figure 2
<p>Diagrammatic drawing of a particle-assisted high velocity oxygen flame (HVOF) spray process.</p>
Full article ">Figure 3
<p>XRD patterns of powder and coatings.</p>
Full article ">Figure 4
<p>Residual stresses of coatings.</p>
Full article ">Figure 5
<p>Three-dimensionally (3D) microprofiles of different shot peening tracks.</p>
Full article ">Figure 6
<p>Micromorphologies of the cross-sections of C0 (<b>a</b>), C1 (<b>b</b>), and C2 (<b>c</b>).</p>
Full article ">Figure 7
<p>Porosity and microhardness of coatings.</p>
Full article ">Figure 8
<p>COF versus sliding time curves for C0 (<b>a</b>), C1 (<b>b</b>), and C2 (<b>c</b>). Test conditions: (<b>a</b>) a load of 5 N and a frequency of 5 Hz; (<b>b</b>) a load of 10 N and a frequency of 5 Hz; and (<b>c</b>) a load of 10 N and a frequency of 10 Hz. (<b>d</b>) Frequency coefficients under different conditions.</p>
Full article ">Figure 9
<p>Wear rates of coatings.</p>
Full article ">Figure 10
<p>Micromorphologies of a worn surface: C0 (<b>a</b>), C1 (<b>b</b>), and C2 (<b>c</b>) obtained with a load of 5 N and a frequency of 5 Hz; C0 (<b>d</b>), C1 (<b>e</b>), and C2 (<b>f</b>) obtained with a load of 10 N and a frequency of 5 Hz; C0 (<b>g</b>), C1 (<b>h</b>), and C2 (<b>i</b>) obtained with a load of 10 N and a frequency of 10 Hz.</p>
Full article ">Figure 11
<p>Schematic diagram of a wear test (<b>a</b>). The cross-sections of the worn surfaces of C1 (<b>b</b>) and C2 (<b>c</b>) obtained with a load of 10 N and a frequency of 10 Hz.</p>
Full article ">
28 pages, 8489 KiB  
Article
MHD Effects on Ciliary-Induced Peristaltic Flow Coatings with Rheological Hybrid Nanofluid
by M. Awais, Zahir Shah, N. Perveen, Aamir Ali, Poom Kumam, Habib ur Rehman and Phatiphat Thounthong
Coatings 2020, 10(2), 186; https://doi.org/10.3390/coatings10020186 - 19 Feb 2020
Cited by 61 | Viewed by 4855
Abstract
Present theoretical investigation is a mathematical illustration of an application to endoscopy by incorporating hybrid nanoparticles and an induced magnetic field with a rheological fluid model for more realistic results. Rheological fluid behavior is characterized by the Ostwald-de-Waele power-law model. A hybrid nanofluid [...] Read more.
Present theoretical investigation is a mathematical illustration of an application to endoscopy by incorporating hybrid nanoparticles and an induced magnetic field with a rheological fluid model for more realistic results. Rheological fluid behavior is characterized by the Ostwald-de-Waele power-law model. A hybrid nanofluid mechanism is considered comprising platelet-shaped nanoparticles since nanoparticles are potential drug transportation tools in biomedical applications. Moreover, ciliary activity is encountered regarding their extensive applications in performing complex functions along with buoyancy effects. An endoscope is inserted inside a ciliated tube and peristalsis occurred due to ciliary activity in the gap between tube and endoscope. A non-Newtonian model is developed by mathematical formulation which is tackled analytically using homotopy analysis. The outcomes are interpreted graphically along with the pressure rise and streamlining configuration for the case of negligible inertial forces and long wavelength. A three-dimensional graphical interpretation of axial velocity is studied as well. Moreover, tables are prepared and displayed for a more physical insight. Full article
(This article belongs to the Special Issue Recent Trends in Coatings and Thin Film–Modeling and Application)
Show Figures

Figure 1

Figure 1
<p>Geometry of the physical problem.</p>
Full article ">Figure 2
<p><span class="html-italic">h</span>-curve for the <math display="inline"><semantics> <mi mathvariant="sans-serif">ψ</mi> </semantics></math> at <math display="inline"><semantics> <mrow> <mi mathvariant="normal">z</mi> <mo>=</mo> <mn>1</mn> <mo>,</mo> <mi mathvariant="normal">Q</mi> <mo>=</mo> <mn>2</mn> <mo>,</mo> <mi mathvariant="sans-serif">ε</mi> <mo>=</mo> <mn>0.2</mn> </mrow> </semantics></math>.</p>
Full article ">Figure 3
<p><span class="html-italic">h</span>-curve for the <math display="inline"><semantics> <mi mathvariant="sans-serif">ϕ</mi> </semantics></math> at <math display="inline"><semantics> <mrow> <mi mathvariant="normal">z</mi> <mo>=</mo> <mn>1</mn> <mo>,</mo> <mi mathvariant="normal">Q</mi> <mo>=</mo> <mn>2</mn> <mo>,</mo> <mi mathvariant="sans-serif">ε</mi> <mo>=</mo> <mn>0.2</mn> </mrow> </semantics></math>.</p>
Full article ">Figure 4
<p><span class="html-italic">h</span>-curve for the <math display="inline"><semantics> <mi mathvariant="sans-serif">θ</mi> </semantics></math> at <math display="inline"><semantics> <mrow> <mi mathvariant="normal">z</mi> <mo>=</mo> <mn>1</mn> <mo>,</mo> <mi mathvariant="normal">Q</mi> <mo>=</mo> <mn>2</mn> <mo>,</mo> <mi mathvariant="sans-serif">ε</mi> <mo>=</mo> <mn>0.2</mn> </mrow> </semantics></math>.</p>
Full article ">Figure 5
<p>Variation in <span class="html-italic">w</span>(<span class="html-italic">r</span>) towards <span class="html-italic">R</span>.</p>
Full article ">Figure 6
<p>Variation in <span class="html-italic">w</span>(<span class="html-italic">r</span>) towards <span class="html-italic">Gr</span>.</p>
Full article ">Figure 7
<p>Variation in <span class="html-italic">w</span>(<span class="html-italic">r</span>) towards <span class="html-italic">M</span>.</p>
Full article ">Figure 8
<p>Variation in <span class="html-italic">H<sub>z</sub></span>(<span class="html-italic">r</span>) towards <span class="html-italic">R</span>.</p>
Full article ">Figure 9
<p>Variation in <math display="inline"><semantics> <mrow> <mi>θ</mi> <mrow> <mo>(</mo> <mi mathvariant="normal">r</mi> <mo>)</mo> </mrow> </mrow> </semantics></math> towards <span class="html-italic">G<sub>r</sub></span>.</p>
Full article ">Figure 10
<p>Variation in <math display="inline"><semantics> <mrow> <mi>θ</mi> <mrow> <mo>(</mo> <mi mathvariant="normal">r</mi> <mo>)</mo> </mrow> </mrow> </semantics></math> towards <span class="html-italic">R</span>.</p>
Full article ">Figure 11
<p>Three-dimensional (3-D) velocity profile towards <span class="html-italic">R</span>.</p>
Full article ">Figure 12
<p>Three-dimensional (3-D) velocity profile towards <span class="html-italic">Gr</span>.</p>
Full article ">Figure 13
<p>Three-dimensional (3-D) velocity profile towards <span class="html-italic">M</span>.</p>
Full article ">Figure 14
<p>Pressure rise versus <span class="html-italic">Q</span> for <span class="html-italic">Ω</span>.</p>
Full article ">Figure 15
<p>Pressure rise versus <span class="html-italic">Q</span> for <span class="html-italic">M</span>.</p>
Full article ">Figure 16
<p>Pressure rise versus <span class="html-italic">Q</span> for <span class="html-italic">Gr</span>.</p>
Full article ">Figure 17
<p>Pressure rise versus <span class="html-italic">Q</span> for <span class="html-italic">R</span>.</p>
Full article ">Figure 18
<p>Pressure gradient for Ω.</p>
Full article ">Figure 19
<p>Pressure gradient for <span class="html-italic">M</span>.</p>
Full article ">Figure 20
<p>Pressure gradient for <span class="html-italic">R</span>.</p>
Full article ">Figure 21
<p>Pressure gradient for <span class="html-italic">Gr</span>.</p>
Full article ">Figure 22
<p>Behavior of streamlines for different values of magnetic Reynold number (<b>a</b>–<b>d</b>).</p>
Full article ">Figure 22 Cont.
<p>Behavior of streamlines for different values of magnetic Reynold number (<b>a</b>–<b>d</b>).</p>
Full article ">Figure 23
<p>Behavior of streamlines for different values of Grashof number (<b>a</b>–<b>d</b>).</p>
Full article ">Figure 23 Cont.
<p>Behavior of streamlines for different values of Grashof number (<b>a</b>–<b>d</b>).</p>
Full article ">Figure 24
<p>Behavior of streamlines for different values of Hartmann number (<b>a</b>–<b>d</b>).</p>
Full article ">Figure 24 Cont.
<p>Behavior of streamlines for different values of Hartmann number (<b>a</b>–<b>d</b>).</p>
Full article ">Figure 25
<p>Behaviorof streamlines for different values of amplitude ratio (<b>a</b>–<b>d</b>).</p>
Full article ">Figure 25 Cont.
<p>Behaviorof streamlines for different values of amplitude ratio (<b>a</b>–<b>d</b>).</p>
Full article ">
23 pages, 5044 KiB  
Article
Impact of Degree of Hydrophilicity of Pyridinium Bromide Derivatives on HCl Pickling of X-60 Mild Steel: Experimental and Theoretical Evaluations
by Nurudeen A. Odewunmi, Mohammad A. Jafar Mazumder, Shaikh A. Ali, Norah A. Aljeaban, Bader G. Alharbi, Abdulaziz A. Al-Saadi and Ime B. Obot
Coatings 2020, 10(2), 185; https://doi.org/10.3390/coatings10020185 - 19 Feb 2020
Cited by 17 | Viewed by 3092
Abstract
Dodecyl pyridinium bromide (DDPB), tetradecyl pyridinium bromide (TDPB) and dodecyl 1,1′-bispyridinium dibromide (DDBPB) were successfully synthesized, characterized and evaluated for HCl pickling of X-60 low carbon steel. Order of corrosion inhibitions efficiencies, as revealed by both electrochemical and gravimetric studies, is TDPB > [...] Read more.
Dodecyl pyridinium bromide (DDPB), tetradecyl pyridinium bromide (TDPB) and dodecyl 1,1′-bispyridinium dibromide (DDBPB) were successfully synthesized, characterized and evaluated for HCl pickling of X-60 low carbon steel. Order of corrosion inhibitions efficiencies, as revealed by both electrochemical and gravimetric studies, is TDPB > DDPB > DDBPB. The degree of hydrophilicity of inhibitors as predicted by a partition coefficient (Log P) and supported by a contact angle measurement was found to be responsible for their order of corrosion inhibition efficiencies. Adsorption of DDPB, TDPB, and DDBPB through the pyridinium nitrogen on mild steel surface was confirmed by ATR-FTIR and SEM-EDX analyses. The pyridinium nitrogen was found not to be the only factor responsible for their efficiency, but hydrophobes and the orientation of the hydrophilic ring were responsible, which incline to the deviation of experimental results and the order of Monte Carlo simulation adsorption energies. DDPB, TDPB, and DDBPB obey the Langmuir isotherm model despite major contributions of the film formed on the surface of X-60 mild steel on their overall inhibition corrosion resistance. Full article
(This article belongs to the Special Issue Innovative Organic Coatings)
Show Figures

Graphical abstract

Graphical abstract
Full article ">Figure 1
<p>(<b>a</b>) Inhibition efficiency and (<b>b</b>) corrosion rate variations of X-60 mild steel in absence and presence of different concentrations of DDPB, TDPB and DDBPB from gravimetric measurement for 24 h immersion time in 1 M HCl solution at 25 °C.</p>
Full article ">Figure 2
<p>Gravimetric measurement for 24 h immersion time of 30 mg/L of DDPB, TDPB and DDBPB X-60 mild steel in 1 M HCl solution at different temperatures; (<b>a</b>) inhibition efficiency and (<b>b</b>) corrosion rate at 25 °C, 45 °C and 60 °C.</p>
Full article ">Figure 3
<p>Open circuit potential plots for X-60 mild steel in 1 M HCl solution at 25 °C in the absence and presence of (<b>a</b>) DDPB, (<b>b</b>) TDPB and (<b>c</b>) DDBPB.</p>
Full article ">Figure 4
<p>Nyquist plots for X-60 mild steel in 1 M HCl solution at 25 °C in the absence and presence of different concentrations of (<b>a</b>) DDPB, (<b>b</b>) TDPB and (<b>c</b>) DDBPB.</p>
Full article ">Figure 5
<p>Bode plots for X-60 mild steel in 1 M HCl solution at 25 °C in the absence and presence of different concentrations of (<b>a</b>,<b>b</b>) DDPB, (<b>c</b>,<b>d</b>) TDPB and (<b>e</b>,<b>f</b>) DDBPB modulus and phase angle, respectively.</p>
Full article ">Figure 6
<p>Equivalent circuit diagrams for impedance data fittings in 1 M HCl solution in the (<b>a</b>) absence and (<b>b</b>) presence of DDPB, TDPB and DDBPB.</p>
Full article ">Figure 7
<p>Potentiodynamic polarization plots of X-60 mild steel in 1 M HCl solution at 25 °C in the absence and presence of different concentrations of (<b>a</b>) DDPB, (<b>b</b>) TDPB and (<b>c</b>) DDBPB.</p>
Full article ">Figure 8
<p>Most stable energy configurations of (<b>a</b>) DDPB, (<b>b</b>) TDPB and (<b>c</b>) DDBPB adsorptions on the Fe (110)/30 H<sub>2</sub>O system by Monte Carlo simulation.</p>
Full article ">Figure 9
<p>FTIR-ATR spectra showing adsorption of DDPB, TDPB and DDBPB on X-60 mild steel after complete immersion in the absence and presence of 30 mg/L inhibitors for 24 h at 25 °C.</p>
Full article ">Figure 10
<p>SEM images of X-60 mild steel in the absence and presence of 30 mg/L inhibitors after complete immersion in 1 M HCl for 24 h at 25 °C; (<b>a</b>) polished X-60 mild steel, (<b>b</b>) X-60 in 1 M HCl in the absence of inhibitor, and X-60 in 1 M HCl in the presence of (<b>c</b>) DDPB, (<b>d</b>) TDPB and (<b>e</b>) DDBPB.</p>
Full article ">Figure 11
<p>Water droplet images during contact angle measurements of X-60 mild steel in the absence and presence of 30 mg/L inhibitors after complete immersion in 1 M HCl for 24 h at 25 °C; (<b>a</b>) polished X-60 mild steel, (<b>b</b>) X-60 in 1 M HCl in the absence of inhibitor, and X-60 in 1 M HCl in the presence of (<b>c</b>) DDPB, (<b>d</b>) TDPB and (<b>e</b>) DDBPB.</p>
Full article ">Scheme 1
<p>Synthesis route of dodecyl pyridinium bromide (DDPB) (1), tetradecylpyridinium bromide (TDPB) (2) and dodecyl 1,1′-bispyridinium dibromide (DDBPB) (3) corrosion inhibitors.</p>
Full article ">
17 pages, 6499 KiB  
Article
One-Step Deposition of Polyester/TiO2 Coatings by Atmospheric Pressure Plasma Jet on Wood Surfaces for UV and Moisture Protection
by Ghiath Jnido, Gisela Ohms and Wolfgang Viöl
Coatings 2020, 10(2), 184; https://doi.org/10.3390/coatings10020184 - 19 Feb 2020
Cited by 13 | Viewed by 4352
Abstract
In this work, polyester/TiO2 coatings on wood surfaces were prepared in one step via two deposition methods by using an atmospheric pressure plasma jet technique with the aim to further enhance the stabilization of the wood surfaces against UV-radiation and moisture. The [...] Read more.
In this work, polyester/TiO2 coatings on wood surfaces were prepared in one step via two deposition methods by using an atmospheric pressure plasma jet technique with the aim to further enhance the stabilization of the wood surfaces against UV-radiation and moisture. The first method, based on the combination of plasma spray powder (PSP) coating and liquid precursor plasma spraying (LPPS) coating techniques, used polyester powder and titanium tetraisopropoxide (TTIP) liquid precursor as feedstock. In the second method, the polyester/TiO2 coatings were prepared by using a mixed powder of polyester micro-particles and TiO2 nano-particles as feedstock and applied via plasma spray powder coating technique. The surface topology and morphology of the wood samples were observed by scanning electron microscopy (SEM). The SEM results showed the presence of a rough structure after coating with polyester/TiO2. The surface chemical compositions of the samples were characterized by X-ray photoelectron spectroscopy and by Fourier transform infrared spectroscopy. The wetting behaviour of the coated wood surfaces was studied by measuring the water contact angle. After coating a hydrophilic wood surface with polyester/TiO2 prepared via (PSP + LPPS), it showed excellent water repellency; the wood surfaces were transformed from hydrophilic to superhydrophobic, while the polyester/TiO2 coating prepared via (PSP) was hydrophilic. Protection against UV radiation-induced colour changes was determined by UV tests and photo-assisted analysis using the CIELab colour system. The abrasion test results indicated that the polyester-containing films had good abrasion resistance and good adhesion to the wood substrates. Full article
Show Figures

Graphical abstract

Graphical abstract
Full article ">Figure 1
<p>Scheme of the experimental setup for the deposition of polyester/TiO<sub>2</sub> films on wood substrate.</p>
Full article ">Figure 2
<p>SEM-images with a magnification of 100× (scale bar 100 µm): (<b>a</b>) uncoated wood beech; (<b>b</b>) TiO<sub>2</sub> film; (<b>c</b>) polyester thick film; (<b>d</b>) polyester/TiO<sub>2</sub> thick film; (<b>e</b>) polyester/TiO<sub>2</sub> thin film; (<b>f</b>) polyester/TiO<sub>2</sub> film via (PSP).</p>
Full article ">Figure 3
<p>SEM-images with a magnification of 2000× (scale bar 10 µm): (<b>a</b>) uncoated wood beech; (<b>b</b>) TiO<sub>2</sub> film; (<b>c</b>) polyester thick film; (<b>d</b>) polyester/TiO<sub>2</sub> thick film; (<b>e</b>) polyester/TiO<sub>2</sub> thin film; (<b>f</b>) polyester/TiO<sub>2</sub> film via (PSP).</p>
Full article ">Figure 4
<p>(<b>a</b>) FTIR–ATR spectra for uncoated wood and coated wood; (<b>b</b>) FTIR spectra for polyester and polyester/TiO<sub>2</sub> films; (<b>c</b>) FTIR spectra for polyester powder reference and polyester film; (<b>d</b>) FTIR spectra for polyester/TiO<sub>2</sub> powder reference and polyester/TiO<sub>2</sub> films.</p>
Full article ">Figure 5
<p>XPS survey spectra and high resolution XPS spectra of the uncoated wood, polyester-coated wood and polyester/TiO<sub>2</sub>-coated wood; (<b>a</b>) survey spectra; (<b>b</b>) high-resolution XPS spectra of Ti 2p; (<b>c</b>) O 1s for polyester/TiO<sub>2</sub> film; (<b>d</b>) O 1s for polyester film; (<b>e</b>) C 1s for polyester/TiO<sub>2</sub> film; (<b>f</b>) C 1s for polyester film.</p>
Full article ">Figure 6
<p>Change of total colour <span class="html-italic">ΔE*</span> of coated and uncoated wood samples depending upon the time of irradiation of (<b>a</b>) beech and (<b>b</b>) pine.</p>
Full article ">Figure 7
<p>Visual appearance of coated and uncoated samples, before and after 50, 100, 150, and 200 h of UV- irradiation: (<b>a</b>) control beech wood; (<b>b</b>) control pine wood; (<b>c</b>) beech wood coated with polyester/TiO<sub>2</sub> thick film; (<b>d</b>) pine wood coated with polyester/TiO<sub>2</sub> thick film; (<b>e</b>) beech wood coated with polyester/TiO<sub>2</sub> film via (PSP); (<b>f</b>) pine wood coated with polyester/TiO<sub>2</sub> film via (PSP).</p>
Full article ">Figure 8
<p>SEM images at magnification of 100× (scale bar 100 µm) of coatings on wood substrates before and after abrasion test. (<b>a</b>) polyester thick film; (<b>b</b>) polyester thin film; (<b>c</b>) polyester/TiO<sub>2</sub> thick film (<b>d</b>) polyester/TiO<sub>2</sub> thin film; (<b>e</b>) polyester/TiO<sub>2</sub> thin film via (PSP); (<b>f</b>) TiO<sub>2</sub> film.</p>
Full article ">Figure 9
<p>SEM images at magnification of 200x (scale bar 100 µm) of cross-sections before and after abrasion test of: (<b>a</b>) polyester thick film; (<b>b</b>) polyester/TiO<sub>2</sub> thick film.</p>
Full article ">Figure 10
<p>Water contact angle on different surfaces. (<b>a</b>) uncoated wood beech; (<b>b</b>) polyester thick film; (<b>c</b>) TiO<sub>2</sub> film; (<b>d</b>) polyester/TiO<sub>2</sub> thick film; (<b>e</b>) polyester/TiO<sub>2</sub> thin film; (<b>f</b>) polyester/TiO<sub>2</sub> film via (PSP).</p>
Full article ">
14 pages, 4501 KiB  
Article
Properties of a Plasma-Nitrided Coating and a CrNx Coating on the Stainless Steel Bipolar Plate of PEMFC
by Meiling Xu, Shumei Kang, Jinlin Lu, Xinyong Yan, Tingting Chen and Zimeng Wang
Coatings 2020, 10(2), 183; https://doi.org/10.3390/coatings10020183 - 17 Feb 2020
Cited by 27 | Viewed by 3393
Abstract
PEMFC are considered to be the most promising for automotive energy because of their good working effect, low temperature, high efficiency, and zero pollution. Stainless steel as a PEMFC bipolar plate has unparalleled advantages in strength, cost, and processability, but it is easy [...] Read more.
PEMFC are considered to be the most promising for automotive energy because of their good working effect, low temperature, high efficiency, and zero pollution. Stainless steel as a PEMFC bipolar plate has unparalleled advantages in strength, cost, and processability, but it is easy to corrode in a PEMFC working environment. In order to improve the corrosion resistance, the surface modification of 316L stainless steel is a feasible solution for PEMFC bipolar plates. In the present study, the plasma-nitrided coating and CrNx coating were prepared by the plasma-enhanced balanced magnetron sputtering technology on the 316L stainless steel surface. The microstructures, phase compositions, and corrosion resistance behavior of the coatings were investigated. The corrosion behavior of the prepared plasma-nitrided coating and CrNx coating was investigated by potentiodynamic polarization, potentiostatic polarization, and electrochemical impedance spectroscopy (EIS) in both cathodic and anodic environments. The experimental results show that corrosion resistance of the CrNx coating was better than the plasma-nitrided coating. It was indicated that the technology process of nitriding first and then depositing Cr was better than nitriding only. Full article
(This article belongs to the Section Surface Characterization, Deposition and Modification)
Show Figures

Figure 1

Figure 1
<p>X-ray diffraction (XRD) patterns of the plasma-nitrided coating under different bias voltages.</p>
Full article ">Figure 2
<p>XRD patterns of the CrN<span class="html-italic"><sub>x</sub></span> coating under different filament currents.</p>
Full article ">Figure 3
<p>Surface morphologies of the plasma-nitrided coating under different bias voltages: (<b>a</b>) −400 V, (<b>b</b>) −500 V, (<b>c</b>) −600 V.</p>
Full article ">Figure 4
<p>Surface morphologies of the CrN<span class="html-italic"><sub>x</sub></span> coating under different filament currents: (<b>a</b>) 3 A, (<b>b</b>) 4 A, (<b>c</b>) 5 A.</p>
Full article ">Figure 5
<p>Potentiodynamic polarization curves of the plasma-nitrided coating in the working environment of the PEMFC bipolar plate ((<b>a</b>) cathodic working environment, (<b>b</b>) anodic working environment).</p>
Full article ">Figure 6
<p>Electrochemical impedance spectroscopy (EIS) analysis of the plasma-nitrided coating under different bias voltages.</p>
Full article ">Figure 7
<p>Potentiodynamic polarization curves of the CrN<span class="html-italic"><sub>x</sub></span> coating in the working environment of the PEMFC bipolar plate ((<b>a</b>) cathodic working environment, (<b>b</b>) anodic working environment).</p>
Full article ">Figure 8
<p>Potentiostatic polarization curves of the CrN<span class="html-italic"><sub>x</sub></span> coating in the working environment of the PEMFC bipolar plate ((<b>a</b>) cathodic working environment, (<b>b</b>) anodic working environment).</p>
Full article ">Figure 9
<p>EIS analysis of CrN<span class="html-italic"><sub>x</sub></span> coating under different filament currents.</p>
Full article ">Figure 10
<p>Bode curves of the CrN<span class="html-italic"><sub>x</sub></span> coating under different filament currents ((<b>a</b>) Impedance mode value (|<span class="html-italic">Z</span>|) versus frequency (f) curves, (<b>b</b>) Phase angle versus frequency (f) curves).</p>
Full article ">Figure 11
<p>Equivalent analog circuit diagram of EIS under different filament currents (<span class="html-italic">R</span><sub>s</sub>, Corrosion solution resistance; <span class="html-italic">R</span><sub>p</sub>, Corrosion product resistance of coating; <span class="html-italic">Q</span><sub>1</sub>, Corrosion product capacitance of coating; <span class="html-italic">R</span><sub>t</sub>, Charge transfer resistance; <span class="html-italic">Q</span><sub>2</sub>, Double layer capacitance; <span class="html-italic">W</span>, Warburg resistance).</p>
Full article ">Figure 12
<p>Contact resistances of the CrN<span class="html-italic"><sub>x</sub></span> coating under different filament currents.</p>
Full article ">
13 pages, 2935 KiB  
Article
Iron-Doped Titanium Dioxide Nanoparticles As Potential Scaffold for Hydrazine Chemical Sensor Applications
by Ahmad Umar, Farid A. Harraz, Ahmed A. Ibrahim, Tubia Almas, Rajesh Kumar, M. S. Al-Assiri and Sotirios Baskoutas
Coatings 2020, 10(2), 182; https://doi.org/10.3390/coatings10020182 - 17 Feb 2020
Cited by 19 | Viewed by 3734
Abstract
Herein, we report the fabrication of a modified glassy carbon electrode (GCE) with high-performance hydrazine sensor based on Fe-doped TiO2 nanoparticles prepared via a facile and low-cost hydrothermal method. The structural morphology, crystalline, crystallite size, vibrational and scattering properties were examined through [...] Read more.
Herein, we report the fabrication of a modified glassy carbon electrode (GCE) with high-performance hydrazine sensor based on Fe-doped TiO2 nanoparticles prepared via a facile and low-cost hydrothermal method. The structural morphology, crystalline, crystallite size, vibrational and scattering properties were examined through different characterization techniques, including FESEM, XRD, FTIR, UV–Vis, Raman and photoluminescence spectroscopy. FESEM analysis revealed the high-density synthesis of Fe-doped TiO2 nanoparticles with the average diameter of 25 ± 5 nm. The average crystallite size of the synthesized nanoparticles was found to be around 14 nm. As-fabricated hydrazine chemical sensors exhibited 1.44 μA µM−1 cm−2 and 0.236 µM sensitivity and limit of detection (LOD), respectively. Linear dynamic ranged from 0.2 to 30 µM concentrations. Furthermore, the Fe-doped TiO2 modified GCE showed a negligible inference behavior towards ascorbic acid, uric acid, glucose, SO42−, NO3, Pb2+ and Ca2+ ions on the hydrazine sensing performance. Thus, Fe-doped TiO2 modified GCE can be efficiently used as an economical, easy to fabricate and selective sensing of hydrazine and its derivatives. Full article
(This article belongs to the Special Issue Mesoporous Metal Oxide Films)
Show Figures

Graphical abstract

Graphical abstract
Full article ">Figure 1
<p>XRD pattern of Fe-doped TiO<sub>2</sub> nanoparticles.</p>
Full article ">Figure 2
<p>(<b>a</b>) and (<b>b</b>) Low magnification and (<b>c</b>) and (<b>d</b>) high magnification FESEM images for Fe-doped TiO<sub>2</sub> nanoparticles.</p>
Full article ">Figure 3
<p>(<b>a</b>) UV–Vis absorption spectrum, (<b>b</b>) room temperature Raman spectrum, (<b>c</b>) FTIR and (<b>d</b>) PL spectrum of Fe-doped TiO<sub>2</sub> nanoparticles.</p>
Full article ">Figure 4
<p>Cyclic voltammograms measured at 50 mVs<sup>−1</sup> in 0.1 M phosphate buffer solution (PBS) (pH 7.4) (<b>a</b>) with absence of hydrazine and (<b>b</b>) in presence of 0.5 mM hydrazine using bare glassy carbon electrode (GCE), TiO<sub>2</sub> modified GCE and Fe-doped TiO<sub>2</sub> modified GCE.</p>
Full article ">Figure 5
<p>(<b>a</b>) Current–time (i–t) response of Fe-doped TiO<sub>2</sub> modified GCE for 0.2–30 µM hydrazine concentrations at a constant potential +0.45V vs. Ag/AgCl. Inset shows an enlarged part of the early stage addition (0.2–1.2 µM). (<b>b</b>) The corresponding current–concentration calibration graph.</p>
Full article ">Figure 6
<p>Proposed mechanism for the hydrazine sensing by Fe-doped TiO<sub>2</sub> nanoparticles.</p>
Full article ">Figure 7
<p>Amperometric (i–t) measurement showing the interference behavior of the Fe-doped TiO<sub>2</sub> coated GCE upon the successive injections of 10 or 5 µM hydrazine and each 100 µM of AA, glucose, UA, SO<sub>4</sub><sup>2−</sup>, NO<sub>3</sub><sup>−</sup>, Pb<sup>2+</sup> and Ca<sup>2+</sup> into a continuously stirred 0.1 M PBS (pH 7.4) solution operating at +0.45 V vs. Ag/AgCl.</p>
Full article ">
13 pages, 2327 KiB  
Article
The Antibacterial Effects of Quaternary Ammonium Salts in the Simulated Presence of Inhibitors in Root Canals: A Preliminary In-Vitro Study
by Sanjay Kumar Tiwari, Suping Wang, Yannan Huang, Xuedong Zhou, Hockin H. K. Xu, Biao Ren, Xian Peng, Michael D. Weir, Mingyun Li and Lei Cheng
Coatings 2020, 10(2), 181; https://doi.org/10.3390/coatings10020181 - 16 Feb 2020
Cited by 5 | Viewed by 3066
Abstract
To investigate the antibacterial effects of two newly developed quaternary ammonium salts (QAMs)-dimethylaminododecyl methacrylate (DMADDM) and dimethylaminohexadecyl methacrylate (DMAHDM), in the presence of various root canal inhibitors. Streptococcus gordonii, Enterococcus faecalis, Lactobacillus acidophilus and Actinomyces naeslundii were used. Dentine, dentine matrix [...] Read more.
To investigate the antibacterial effects of two newly developed quaternary ammonium salts (QAMs)-dimethylaminododecyl methacrylate (DMADDM) and dimethylaminohexadecyl methacrylate (DMAHDM), in the presence of various root canal inhibitors. Streptococcus gordonii, Enterococcus faecalis, Lactobacillus acidophilus and Actinomyces naeslundii were used. Dentine, dentine matrix and dead bacteria were selected as inhibitors. The antimicrobial efficacy of monomers of DMADDM and DMAHDM was tested against suspensions formed by mixtures of four bacterial species in or without the presence of inhibitors. The inhibition results were compared with chlorhexidine (CHX) and sodium hypochlorite (NaOCl). One-way analyses of variance (ANOVA) followed by Tukey’s multiple comparison test was performed to determine significant differences. The antibacterial effects of DMADDM and DMAHDM were variably inhibited dentine, dentine matrix and dead bacteria. CHX and NaOCl showed substantivity and they inhibited bacteria present in suspension. The concentration of compound decreased in the dentine block due to constant release. Bacterial colonies on the dentine surface and dentine tubules were significantly inhibited by DMADDM and DMAHDM. The antibacterial effects of DMADDM and DMAHDM could be inactivated by dentine, dentine matrix and dead bacteria, while DMADDM and DMAHDM could inhibit bacteria colonization on the dentine surface and kill bacteria present in dentinal tubules. The antibacterial effects of DMADDM and DMAHDM as free monomers in the presence of inhibitors was evaluated for the first time. They could help inhibit the residual bacteria on the dentine surface and in dentinal tubules that may cause persisting infection. Therefore the novel QAMs showed great potentials as root canal medication. Full article
(This article belongs to the Special Issue Recent Developments in Antibacterial and/or Antifouling Surfaces)
Show Figures

Figure 1

Figure 1
<p>Flow-chart of the methods used for the study.</p>
Full article ">Figure 2
<p>Elimination of bacteria from suspension by DMADDM, DMAHDM, CHX and NaOCl in the absence or presence of inhibiting factors. The bar represents the mean value ± standard deviation (n = 9) (* <span class="html-italic">p</span> &lt; 0.05).</p>
Full article ">Figure 3
<p>The changes in log colony forming units (CFUs)/mL in suspensions from the eppendorf tube containing dentine blocks treated with four antimicrobials compounds (DMADDM, DMAHDM, CHX and NaOCl), and the untreated dentine block (control group). The data is present in mean CFUs ± standard deviation (* <span class="html-italic">p</span> &lt; 0.05).</p>
Full article ">Figure 4
<p>Representative SEM micrographs of the typical biofilms in different groups. SEM images of dentine blocks containing no antimicrobial compounds, positive control group (<b>A</b>), 300 µg/mL DMADDM group (<b>B</b>), 37.5 µg/mL DMAHDM group (<b>C</b>), negative control group (<b>D</b>), 2.0% CHX group (<b>E</b>), and 5.25% NaOCl group (<b>F</b>). CFU counts of bacteria in different group are shown in (<b>G</b>). Compared to control group, all antimicrobial compounds showed more significant anti-biofilm effects than CHX (<span class="html-italic">p</span> &lt; 0.05), with few bacteria on the surface. Among antimicrobial compounds, DMADDM, DMAHDM and NaOCl showed more significant anti-biofilm effects than CHX (* <span class="html-italic">p</span> &lt; 0.05). The blue arrow referred to biofilm.</p>
Full article ">Figure 5
<p>CFU counts of bacteria on dentine blocks after treatment with antimicrobial compounds for 10 min. Bacteria were inoculated in dentinal tubules of dentine blocks by centrifugation. The other four groups had fewer CFU counts compared to the control group. The result is presented in mean CFUs ± standard deviation (* <span class="html-italic">p</span> &lt; 0.05).</p>
Full article ">
12 pages, 10604 KiB  
Article
A Tunable Beamforming Ferroelectric Lens for Millimeter Wavelength Ranges
by Roman Platonov, Andrey Altynnikov and Andrey Kozyrev
Coatings 2020, 10(2), 180; https://doi.org/10.3390/coatings10020180 - 16 Feb 2020
Cited by 7 | Viewed by 3722
Abstract
The advanced design of a millimeter-wave quasi-optical beamforming device (QOBD) based on the ferroelectric ceramic was elaborated and considered. Among the advantages of the proposed design are simplicity and cost-effectiveness in contrast to conventional analog and digital beamforming devices based on array antennas. [...] Read more.
The advanced design of a millimeter-wave quasi-optical beamforming device (QOBD) based on the ferroelectric ceramic was elaborated and considered. Among the advantages of the proposed design are simplicity and cost-effectiveness in contrast to conventional analog and digital beamforming devices based on array antennas. The use of ferroelectric ceramic in the QOBD design allows operating in a wide frequency range up to 100 GHz. The advanced topology of discrete radiotransparent electrodes to provide a realization of different beamforming functions such as beam focusing and beam scanning was considered. The prototype of the proposed QOBD was designed to operate at 60 GHz. The measured radiation pattern of the QOBD prototype is in good agreement with the simulated one. Measurements demonstrate decreasing of beamwidth of the primary antenna radiation pattern by the lens prototype operating in the beam focusing regime. Full article
(This article belongs to the Special Issue Ferroelectric Thin Films and Devices)
Show Figures

Figure 1

Figure 1
<p>Comparison of (<b>a</b>) the linear dielectric lens and (<b>b</b>) the electrically tunable FE lens.</p>
Full article ">Figure 2
<p>The FE lens schematics with different radiotransparent electrodes’ topologies: (<b>a</b>) continuous and (<b>b</b>) discrete.</p>
Full article ">Figure 3
<p>Schematic of proposed model: (<b>a</b>) simplified 2D model of the FE QOBD and (<b>b</b>) the phase distribution on the FE lens plane of the wave radiated by the feed antenna and (<b>c</b>) the FE lens EET.</p>
Full article ">Figure 4
<p>Measured ferroelectric ceramic sample permittivity and tunability dependencies on the electric field.</p>
Full article ">Figure 5
<p>The prototype design: (<b>a</b>) Exploded-view of lens prototype without ABS holder structure; (<b>b</b>) the photograph of manufactured FE lens without matching layers.</p>
Full article ">Figure 6
<p>Spatial distributions of the K-factor of the ferroelectric lens for focusing radiation of (<b>a</b>) the isotropic source and (<b>b</b>) of the horn antenna; and for (<b>c</b>) the deflection of the focused horn beam.</p>
Full article ">Figure 7
<p>Wave electric field distribution in case of (<b>a</b>) the beam focusing and (<b>b</b>) the beam scanning.</p>
Full article ">Figure 8
<p>Comparison of the simulated and measured of (<b>a</b>) beam focusing, and simulation results of (<b>b</b>) the beam scanning capability.</p>
Full article ">Figure 9
<p>Simulation of (<b>a</b>) the reflection coefficient and (<b>b</b>) the directivity of the radiation source with and without the FE lens.</p>
Full article ">
11 pages, 11228 KiB  
Article
Study of TiO2-Modified Sol Coating Material in the Protection of Stone-Built Cultural Heritage
by Hui Shu, Ming Yang, Qiang Liu and Maobin Luo
Coatings 2020, 10(2), 179; https://doi.org/10.3390/coatings10020179 - 15 Feb 2020
Cited by 14 | Viewed by 2817
Abstract
Coating materials can effectively protect stone-built cultural heritage and, as such, research into coating materials has gained comprehensive attention from researchers. The aim of this work is to prepare a TiO2-modified sol coating material (TSCM) and study its protective effects on [...] Read more.
Coating materials can effectively protect stone-built cultural heritage and, as such, research into coating materials has gained comprehensive attention from researchers. The aim of this work is to prepare a TiO2-modified sol coating material (TSCM) and study its protective effects on stone-built cultural heritage. TSCM and pure TiO2 sol (p-sol, unmodified; for comparison) were applied evenly over the entire surface of stone samples. The prepared stone samples included untreated stone, stone treated with pure sol, and stone treated with TSCM. The protective effects of TSCM were evaluated by water absorption, water vapor permeability, acid resistance, and weather resistance experiments. The results show that stone treated with TSCM has excellent water absorption and water vapor permeability, strong acid resistance, and good weather resistance, compared with untreated stone or stone treated with p-sol. The acid resistance of stone treated by TSCM was 1.75 times higher than that treated with traditional coating materials. The weather resistance cycle number of stone treated by TSCM was four times higher than that treated with organic protective materials. These findings are expected to provide useful suggestions for the protection of stone-built cultural heritage. Full article
(This article belongs to the Section Surface Characterization, Deposition and Modification)
Show Figures

Figure 1

Figure 1
<p>X-ray diffraction (XRD) spectra of TiO<sub>2</sub>-modified sol coating material (TSCM) (<b>a</b>) and p-sol (<b>b</b>).</p>
Full article ">Figure 2
<p>Scanning electron microscopy (SEM) images of sample 1<sup>#</sup> (<b>a</b>) 100 um, (<b>b</b>) 20 um; sample 2<sup>#</sup> (<b>c</b>) 100 um, (<b>d</b>) 10 um; and sample 3<sup>#</sup> (<b>e</b>) 100 um, (<b>f</b>) 10 um.</p>
Full article ">Figure 3
<p>Water absorption curves.</p>
Full article ">Figure 4
<p>Water vapor permeability results.</p>
Full article ">Figure 5
<p>Acid resistance curves.</p>
Full article ">Figure 6
<p>Three stone samples after eight cycles: (<b>a</b>) sample 1<sup>#</sup>, (<b>b</b>) sample 2<sup>#</sup>, and (<b>c</b>) sample 3<sup>#</sup>.</p>
Full article ">Figure 7
<p>Three stone samples after 14 cycles: (<b>a</b>,<b>b</b>) sample 1<sup>#</sup>, (<b>c</b>) sample 2<sup>#</sup>, and (<b>d</b>) sample 3<sup>#</sup>.</p>
Full article ">Figure 8
<p>The relationship of mass change rate of samples with the number of cycles.</p>
Full article ">
16 pages, 27122 KiB  
Article
Influence of a Biocompatible Hydrophilic Needle Surface Coating on a Puncture Biopsy Process for Biomedical Applications
by Fan Gao, Qinghua Song, Zhanqiang Liu, Yonghang Jiang and Xiuqing Hao
Coatings 2020, 10(2), 178; https://doi.org/10.3390/coatings10020178 - 15 Feb 2020
Cited by 8 | Viewed by 3237
Abstract
A puncture biopsy is a widely used, minimally invasive surgery process. During the needle insertion process, the needle body is always in direct contact with a biological soft tissue. Tissue adhesion and different degrees of tissue damage occur frequently. Optimization of the needle [...] Read more.
A puncture biopsy is a widely used, minimally invasive surgery process. During the needle insertion process, the needle body is always in direct contact with a biological soft tissue. Tissue adhesion and different degrees of tissue damage occur frequently. Optimization of the needle surface, and especially the lubrication of the needle surface, can deal with these problems efficiently. Therefore, in this paper, a biocompatible hydrophilic coating was applied onto the surface of a needle to improve the surface quality of the needle surface. Further, a simplified finite element model of insertion was established, and extracorporeal insertion experiments were used to verify the accuracy of the model. Then, by analyzing a simulation model of a coated needle and a conventional needle, the influence of the application of the coated needle on the insertion process was obtained. It can be seen from the results that the coating application relieved the force on the needle and the soft tissue during the insertion process and could significantly reduce friction during the insertion process. At the same time, the deformation of biological soft tissue was reduced, and the adhesion situation between the needle and tissue improved, which optimized the puncture needle. Full article
(This article belongs to the Section Surface Coatings for Biomedicine and Bioengineering)
Show Figures

Figure 1

Figure 1
<p>The puncture needle.</p>
Full article ">Figure 2
<p>Microscopic view of the needle surface: (<b>a</b>) surface morphologies of the coated needle; (<b>b</b>) surface morphologies of the uncoated needle.</p>
Full article ">Figure 3
<p>Major components of biological soft tissue: (<b>a</b>) muscle fibers; (<b>b</b>) connective tissue.</p>
Full article ">Figure 4
<p>Friction coefficient measuring device.</p>
Full article ">Figure 5
<p>Experimental data for the measurement of the friction coefficient.</p>
Full article ">Figure 6
<p>The model of tissue and a needle.</p>
Full article ">Figure 7
<p>Device for verifying the experiments.</p>
Full article ">Figure 8
<p>Standard deviation of data obtained from the experiment.</p>
Full article ">Figure 9
<p>Comparison between model results and experimental results: (<b>a</b>) <span class="html-italic">x</span> axial force measured by a sensor in the experiment and obtained by simulation; (<b>b</b>) <span class="html-italic">y</span> axial force measured by a sensor in the experiment and obtained by simulation.</p>
Full article ">Figure 10
<p>Strain contours of the biological soft tissue: (<b>a</b>) puncture process using a coated needle; (<b>b</b>) puncture process using an uncoated needle.</p>
Full article ">Figure 11
<p>Frictional dissipated energy for the whole model.</p>
Full article ">Figure 12
<p>Microscopic image of the needle body surface: (<b>a</b>) coated needle; (<b>b</b>) uncoated needle.</p>
Full article ">Figure 13
<p>von Mises stress contours: (<b>a</b>) the maximum force on the needle at the same time point (coated needle, left, uncoated needle, right); (<b>b</b>) maximum force on the tissue at the same time point (coated needle, down, uncoated needle, up).</p>
Full article ">Figure 14
<p>Maximum stress on the biological soft tissue.</p>
Full article ">Figure 15
<p>The deformation in the <span class="html-italic">x</span> direction at the maximum stress point.</p>
Full article ">
14 pages, 6070 KiB  
Article
Property of TiO2-15MgAl2O4 Electrical-Heating Coating Prepared by Atmospheric Plasma Spraying and Hydrogen Heat Treatment
by Xiyang Li, Kun Yang, Dezhi Wang, Chunming Deng and Yanzhe Zhou
Coatings 2020, 10(2), 177; https://doi.org/10.3390/coatings10020177 - 14 Feb 2020
Cited by 1 | Viewed by 2215
Abstract
Using TiO2-15MgAl2O4 mixed powder as spray-feed, an electrical-heating coating was successfully fabricated by atmospheric plasma spraying technology. The phase composition, microstructure, and electrical-heating performance of the coating were characterized by XRD, SEM, and cyclic electrification tests, respectively. The [...] Read more.
Using TiO2-15MgAl2O4 mixed powder as spray-feed, an electrical-heating coating was successfully fabricated by atmospheric plasma spraying technology. The phase composition, microstructure, and electrical-heating performance of the coating were characterized by XRD, SEM, and cyclic electrification tests, respectively. The coating samples were heat-treated at 350 °C in a hydrogen atmosphere. The results show that TiO2-15MgAl2O4 coating can be heated over 300 °C within 30 m at 55.1 V which preserves heat for a long time. Before heat treatment, the available heating temperature of the coating decreases significantly with electrification cycles. The resistivity of coating rises rapidly during the cyclic electricity test. After hydrogen heat treatment, the electrical-heating property of coatings is significantly enhanced. Full article
(This article belongs to the Section Plasma Coatings, Surfaces & Interfaces)
Show Figures

Figure 1

Figure 1
<p>Structure schematic diagram of the coating system sprayed on steel pipe.</p>
Full article ">Figure 2
<p>XRD patterns of TiO<sub>2</sub>-15MgAl<sub>2</sub>O<sub>4</sub> powder and coating.</p>
Full article ">Figure 3
<p>SEM images of TiO<sub>2</sub>-15MgAl<sub>2</sub>O<sub>4</sub> coating surface. (<b>a</b>) low magnification; (<b>b</b>) high magnification.</p>
Full article ">Figure 4
<p>Cross-sectional morphology of electrical-heating coating and EDS analysis.</p>
Full article ">Figure 5
<p>Backscatter electron imaging of TiO<sub>2</sub>-15MgAl<sub>2</sub>O<sub>4</sub> coating and EDS analysis.</p>
Full article ">Figure 6
<p>Photograph of electrical-heating coating sample (<b>a</b>) and infrared thermal image of coating during the holding stage (<b>b</b>).</p>
Full article ">Figure 7
<p>Temperature–time curves of electrical-heating coating cyclic electrification tests.</p>
Full article ">Figure 8
<p>The coating resistivity of five electricity tests in the heat preservation stage.</p>
Full article ">Figure 9
<p>Resistivity–time curves of the coating cyclic electricity test (<b>a</b>) and graph of the corresponding heating stage 0-60min (<b>b</b>).</p>
Full article ">Figure 10
<p>The resistivity–temperature curves of coating in the heating stage.</p>
Full article ">Figure 11
<p>Cross-sectional morphology of electrical-heating coating after cyclic electricity test and EDS analysis.</p>
Full article ">Figure 12
<p>Temperature–time curves of the cyclic electrification test of heat-treated coatings.</p>
Full article ">Figure 13
<p>Resistivity–time curves of the cyclic electrification test of heat-treated coatings.</p>
Full article ">Figure 14
<p>XRD patterns of TiO<sub>2–</sub>15MgAl<sub>2</sub>O<sub>4</sub> coating before and after hydrogen heat treatment.</p>
Full article ">
13 pages, 9748 KiB  
Article
Preparation of WC Reinforced Co-Based Alloy Gradient Coatings on a H13 Mold Steel Substrate by Laser Cladding
by Chenchen Li, Xuefeng Yang, Shouren Wang, Yanjun Wang and Jinlong Cao
Coatings 2020, 10(2), 176; https://doi.org/10.3390/coatings10020176 - 14 Feb 2020
Cited by 7 | Viewed by 2972
Abstract
H13 die steel often fails as a result of physical and chemical effects such as wear, erosion and cyclic stress. Accordingly, the study evaluates Co-based gradient coating on an H13 steel featuring a stress-relieving effect. Scanning electron microscope and X-ray diffraction were used [...] Read more.
H13 die steel often fails as a result of physical and chemical effects such as wear, erosion and cyclic stress. Accordingly, the study evaluates Co-based gradient coating on an H13 steel featuring a stress-relieving effect. Scanning electron microscope and X-ray diffraction were used to analyze the microstructure and phase of the coatings. A microhardness tester and friction and wear tester were used to compare the hardness and wear resistance of the coatings and the substrate, and the wear morphology was observed. A pendulum impact test was used to compare the impact resistance of the coatings and the substrate, and the fracture morphology was observed. Finally, a corrosion test was used to compare the corrosion resistance of coatings and substrate. The results show that the Co-based gradient coatings have good combinations with the substrate, the hard phase content gradually increases from the bottom to the top of the coating, and the crystal microstructure generally maintains a distribution trend from coarse to fine. The hardness of the gradient coatings is significantly higher than the substrate, and from the coating surface to the substrate, the hardness decreases slowly. The wear loss of the coatings is much lower than that of the substrate, the main wear mechanism of the substrate is abrasive wear, and the main wear mechanism of the coatings is brittle spalling. While the gradient coatings increase the surface hardness, the brittleness also increases, the impact resistance of the coatings is lower than that of the substrate, the fracture form of the substrate is a ductile fracture, and the fracture form of the coating is a brittle fracture. The gradient coatings effectively improve the corrosion resistance of the substrate surface, and the higher the content of the reinforcing phase, the better the corrosion resistance of the coatings. Full article
Show Figures

Figure 1

Figure 1
<p>Schematic diagram of the impact test.</p>
Full article ">Figure 2
<p>SEM morphology of cross section of Co-based gradient coating: (<b>a</b>) morphology of the bonding area magnified 400 times; (<b>b</b>) morphology of the bonding area magnified 1000 times.</p>
Full article ">Figure 3
<p>Metallographic microstructure of the Co-based gradient coating cross section: (<b>a</b>) crystal microstructure of binding zone with magnification of 1000 times; (<b>b</b>) crystal microstructure of coating with magnification of 500 times; (<b>c</b>) crystal microstructure of coating with magnification of 1000 times.</p>
Full article ">Figure 4
<p>X-ray diffraction pattern of Co-based gradient coating surface.</p>
Full article ">Figure 5
<p>Microhardness distribution of the cross section of Co-based gradient coating.</p>
Full article ">Figure 6
<p>Friction coefficients of H13 steel substrate and Co-based gradient coating: (<b>a</b>) friction coefficient curve of H13 steel substrate; (<b>b</b>) friction coefficient curves of gradient coatings.</p>
Full article ">Figure 7
<p>Wear morphology of H13 steel substrate surface: (<b>a</b>) Surface wear morphology of the substrate at a magnification of 200 times; (<b>b</b>) Surface wear morphology of the substrate at a magnification of 200 times.</p>
Full article ">Figure 8
<p>Abrasion morphology of Co-based gradient coating surface: (<b>a</b>) Wear morphology of the gradient coating with WC content of 5% + 10% + 15%; (<b>b</b>) wear morphology of the gradient coatings with WC content of 10% + 15% + 20%; (<b>c</b>) wear morphology of the gradient coatings with WC content of 15% + 20% + 25%.</p>
Full article ">Figure 9
<p>Comparison of wear loss between substrate and Co-based gradient coating.</p>
Full article ">Figure 10
<p>Comparison of impact resistance of substrate and Co-based gradient coatings.</p>
Full article ">Figure 11
<p>SEM morphology of impact fracture of H13 steel substrate: (<b>a</b>) Fracture morphology of the substrate at a magnification of 1000 times; (<b>b</b>) Fracture morphology of the substrate at a magnification of 500 times.</p>
Full article ">Figure 12
<p>SEM morphology of impact fracture of Co-based gradient coating: (<b>a</b>,<b>b</b>) fracture morphology of binding zone; (<b>c</b>,<b>d</b>) fracture morphology of gradient coating.</p>
Full article ">Figure 13
<p>Corrosion rate comparison of substrate and Co-based gradient coatings.</p>
Full article ">Figure 14
<p>Corrosion morphology of substrate and Co-based gradient coating: (<b>a</b>) corrosion morphology of the substrate; (<b>b</b>) corrosion morphology of the gradient coating with WC content of 5% + 10% + 15%; (<b>c</b>) corrosion morphology of the gradient coating with WC content of 10% + 15% + 20%; (<b>d</b>) corrosion morphology of the gradient coating with WC content of 15% + 20% + 25%.</p>
Full article ">Figure 14 Cont.
<p>Corrosion morphology of substrate and Co-based gradient coating: (<b>a</b>) corrosion morphology of the substrate; (<b>b</b>) corrosion morphology of the gradient coating with WC content of 5% + 10% + 15%; (<b>c</b>) corrosion morphology of the gradient coating with WC content of 10% + 15% + 20%; (<b>d</b>) corrosion morphology of the gradient coating with WC content of 15% + 20% + 25%.</p>
Full article ">
13 pages, 9835 KiB  
Article
High Temperature Tribological Properties of Al2O3/NCD Films Investigated Under Ambient Air Conditions
by Vitali Podgursky, Maxim Yashin, Taivo Jõgiaas, Mart Viljus, Asad Alamgir, Mati Danilson and Andrei Bogatov
Coatings 2020, 10(2), 175; https://doi.org/10.3390/coatings10020175 - 14 Feb 2020
Cited by 3 | Viewed by 2929
Abstract
Comparative analysis of dry sliding wear behavior of nanocrystalline diamond (NCD) films and NCD films coated with a thin Al2O3 layer (Al2O3/NCD) is the main goal of the present study. Plasma-enhanced chemical vapor deposition (PECVD) and [...] Read more.
Comparative analysis of dry sliding wear behavior of nanocrystalline diamond (NCD) films and NCD films coated with a thin Al2O3 layer (Al2O3/NCD) is the main goal of the present study. Plasma-enhanced chemical vapor deposition (PECVD) and atomic layer deposition (ALD) methods were used to prepare the NCD and alumina films, respectively. Sliding wear tests were conducted at room temperature (RT), 300 and 450 °C in air. Independent of type of specimen, superlubricating behavior with the coefficient of friction (COF) in the range of 0.004‒0.04 was found for the tests at 300 °C. However, the COF value measured on the Al2O3/NCD films in the tests at 450 °C is lower than that for the NCD film. A relatively short run-in period and a stable COF value of about 0.15 were observed at this temperature for the Al2O3/NCD films. The width of the wear scars measured on the Al2O3/NCD films after the tests at 450 °C is significantly smaller in comparison with the NCD film. The apparent wear volume of the wear scar on the NCD film tested at 450 °C was noticeably higher than that on the Al2O3/NCD films. Full article
(This article belongs to the Section Tribology)
Show Figures

Figure 1

Figure 1
<p>(<b>a</b>) SEM images of the NCD and (<b>b</b>) Al<sub>2</sub>O<sub>3</sub> /NCD films.</p>
Full article ">Figure 2
<p>XRD pattern measured on the as-deposited Al<sub>2</sub>O<sub>3</sub> /NCD film.</p>
Full article ">Figure 3
<p>COF vs number of cycle curves taken on the NCD, Al<sub>2</sub>O<sub>3</sub>/NCD and A-Al<sub>2</sub>O<sub>3</sub>/NCD films at (<b>a</b>) RT, (<b>b</b>) 300 °C and (<b>c</b>) 450 °C.</p>
Full article ">Figure 4
<p>Surface morphology of the wear scars after the tests on the NCD film at (<b>a</b>) 300 °C and (<b>b</b>) 450 °C, and on the Al<sub>2</sub>O<sub>3</sub>/NCD film at (<b>c</b>) 300 °C and (<b>d</b>) 450 °C.</p>
Full article ">Figure 5
<p>SEM images taken on the wear scar after the test at RT on the Al<sub>2</sub>O<sub>3</sub>/NCD film. The images were taken from (<b>a</b>) the center of the wear scar (<b>b</b>,<b>c</b>) were taken in the middle of the wear scar to (<b>d</b>) the border of the wear scar images.</p>
Full article ">Figure 6
<p>Line scans across the wear scars taken on the (<b>a</b>) NCD, (<b>b</b>) Al<sub>2</sub>O<sub>3</sub>/NCD and (<b>c</b>) A-Al<sub>2</sub>O<sub>3</sub>/NCD films.</p>
Full article ">Figure 7
<p>SEM images of the wear scars after sliding tests on the NCD film at (<b>a</b>) RT, (<b>b</b>) 300 °C and (<b>c</b>) 450 °C; Al<sub>2</sub>O<sub>3</sub> /NCD film at (<b>d</b>) RT, (<b>e</b>) 300 °C and (<b>f</b>) 450 °C; and A-Al<sub>2</sub>O<sub>3</sub> /NCD film at (<b>g</b>) RT, (<b>h</b>) 300 °C and (<b>i</b>) 450 °C.</p>
Full article ">Figure 8
<p>SEM images of the worn surface on the balls after sliding tests against the NCD film at (<b>a</b>) RT, (<b>b</b>) 300 °C and (<b>d</b>) 450 °C; Al<sub>2</sub>O<sub>3</sub> /NCD film at (<b>d</b>) RT, (<b>e</b>) 300 °C and (<b>f</b>) 450 °C; and A-Al<sub>2</sub>O<sub>3</sub> /NCD film at (<b>g</b>) RT, (<b>h</b>) 300 °C and (<b>i</b>) 450 °C.</p>
Full article ">Figure 9
<p>Apparent wear volumes of the wear scars measured on the NCD, Al<sub>2</sub>O<sub>3</sub>/NCD and A-Al<sub>2</sub>O<sub>3</sub>/NCD films.</p>
Full article ">Figure 10
<p>Raman spectra taken on the (<b>a</b>) NCD and (<b>b</b>) Al<sub>2</sub>O<sub>3</sub>/NCD films.</p>
Full article ">Figure 11
<p>XPS spectra of the O 1s peak (WS-wear scar) taken on the (<b>a</b>) NCD and (<b>b</b>) Al<sub>2</sub>O<sub>3</sub>/NCD films.</p>
Full article ">Figure 12
<p>XPS spectra of the C 1s peak taken on the (<b>a</b>) NCD and (<b>b</b>) Al<sub>2</sub>O<sub>3</sub>/NCD films.</p>
Full article ">Figure 13
<p>XPS spectra of the C 1s peak taken on the NCD film native surface at (<b>a</b>) RT and after the heating at (<b>b</b>) 450 °C.</p>
Full article ">Figure 14
<p>XPS spectra of the Si 2p peak taken on the (<b>a</b>) NCD and (<b>b</b>) Al<sub>2</sub>O<sub>3</sub>/NCD films.</p>
Full article ">
11 pages, 5438 KiB  
Article
Fabrication of Cotton Fabric with Superoleophilic/Superhydrophobic Characteristic on the Modified Surface by Using Fluoroalkylated Oligomeric Silica/Triazine Derivative Nanocomposites
by Katsumi Yamashita, Akemi Yasukawa and Hideo Sawada
Coatings 2020, 10(2), 174; https://doi.org/10.3390/coatings10020174 - 14 Feb 2020
Cited by 6 | Viewed by 2654
Abstract
Two fluoroalkylated vinyltrimethoxysilane oligomer (RF-(CH2CHSi(OMe)3)n-RF; n = 2, 3; RF = CF(CF3)OC3F7:RF-VMSi) in methanol reacted with aqueous sodium carbonate solution containing 2-hydroxy-4,6-dichloro-1,3,5-triazine sodium salt [...] Read more.
Two fluoroalkylated vinyltrimethoxysilane oligomer (RF-(CH2CHSi(OMe)3)n-RF; n = 2, 3; RF = CF(CF3)OC3F7:RF-VMSi) in methanol reacted with aqueous sodium carbonate solution containing 2-hydroxy-4,6-dichloro-1,3,5-triazine sodium salt (TAZ) to provide two fluoroalkylated oligomeric silica/TAZ nanocomposites (RF-VMSiO2/TAZ). The original cotton fabric gives an oleophilic/hydrophilic property on its surface; however, modified cotton fabric surface with RF-VMSiO2/TAZ composites was demonstrated to provide highly oleophobic/superhydrophobic property on the surface. We can observe a remarkable time-dependent decrease of the contact angle of dodecane (oil) on the modified surfaces, and the contact angles of dodecane were found to decrease effectively from 55 –83 to 0 over 5–30 s to supply superoleophilicity with keeping the superhydrophobic property on the surfaces. The modified cotton fabric having superoleophilic/superhydrophobic property was applicable to the separation membrane to separate oil and water. Interestingly, modified cotton fabric was found to adsorb efficiently only droplets of oil spread on the water interface due to its unique surface wettability. Full article
(This article belongs to the Section Surface Characterization, Deposition and Modification)
Show Figures

Graphical abstract

Graphical abstract
Full article ">Figure 1
<p>Photograph of original cotton fabric (<b>A</b>) and modified cotton swatch with R<sub>F</sub>-VMSiO<sub>2</sub>/TAZ nanocomposites (<b>B</b>); used oligomer: 30 mg; 10% aq. TAZ solution: 100 mg (Run 1 in <a href="#coatings-10-00174-t001" class="html-table">Table 1</a>).</p>
Full article ">Figure 2
<p>Photograph of the droplet of dodecane (<b>A</b>) and the droplet of water (<b>B</b>) on the modified cotton fabric surface with R<sub>F</sub>-VMSiO<sub>2</sub>/TAZ composites (Run 1 in <a href="#coatings-10-00174-t002" class="html-table">Table 2</a>): (*) “0 s” approximately corresponds to “a few seconds.” (<b>a</b>) Water drop on the needlepoint, (<b>b</b>) water drop on the fabric surface, (<b>c</b>) pull-up of needlepoint from the modified cotton fabric surface.</p>
Full article ">Figure 3
<p>SEM pictures of pristine cotton swatch (<b>A</b>), the modified cotton watch with R<sub>F</sub>-VMSiO<sub>2</sub>/TAZ composites (Run 1 in <a href="#coatings-10-00174-t002" class="html-table">Table 2</a>) (<b>B</b>,<b>C</b>).</p>
Full article ">Figure 4
<p>Relationship between the dodecane contact angle values on the modified cotton swatch and cycle of washing the modified cotton swatch with water.</p>
Full article ">Figure 5
<p>FE-SEM pictures of the parent cotton swatch (<b>A</b>) and modified cotton swatch with R<sub>F</sub>-VMSiO<sub>2</sub>/TAZ nanocomposites (<b>B</b>), and EDX mapping micrograph of the fluorine atoms on the cotton surface with R<sub>F</sub>-VMSiO<sub>2</sub>/TAZ nanocomposites after three cycles of washing with water (<b>C</b>).</p>
Full article ">Figure 6
<p>Stress–strain plots of the parent cotton swatch and the modified cotton swatch treated with R<sub>F</sub>-VMSiO<sub>2</sub>/TAZ nanocomposites (Run 1 in <a href="#coatings-10-00174-t002" class="html-table">Table 2</a>).</p>
Full article ">Figure 7
<p>Separation of blue-colored water that was colored with CuSO<sub>4</sub>·5H<sub>2</sub>O and 1,2-dichloroethane using pristine cotton fabric (<b>A</b>) and the modified cotton fabric with R<sub>F</sub>-VMSiO<sub>2</sub>/TAZ composites (Run 1 in <a href="#coatings-10-00174-t002" class="html-table">Table 2</a>) (<b>B</b>).</p>
Full article ">Figure 8
<p>Adsorption of red-colored oil (dodecane) droplets spread on yellow-colored water interface using pristine cotton fabric (<b>A</b>) and the modified cotton swatch with R<sub>F</sub>-VMSiO<sub>2</sub>/TAZ nanocomposites (Run 1 in <a href="#coatings-10-00174-t002" class="html-table">Table 2</a>) (<b>B</b>).</p>
Full article ">Scheme 1
<p>Synthesis of R<sub>F</sub>-VMSiO<sub>2</sub>/TAZ nanocomposites.</p>
Full article ">
16 pages, 13270 KiB  
Article
The Microstructure and Selected Mechanical Properties of Al2O3 + 13 wt % TiO2 Plasma Sprayed Coatings
by Monika Michalak, Leszek Łatka, Paweł Sokołowski, Aneta Niemiec and Andrzej Ambroziak
Coatings 2020, 10(2), 173; https://doi.org/10.3390/coatings10020173 - 13 Feb 2020
Cited by 16 | Viewed by 3200
Abstract
The Al2O3 + TiO2 coatings are of the interest of surface technology and tribology due to their good wear resistance and enhanced toughness comparing to pure Al2O3 coatings. However, the detailed effect of the used feedstock [...] Read more.
The Al2O3 + TiO2 coatings are of the interest of surface technology and tribology due to their good wear resistance and enhanced toughness comparing to pure Al2O3 coatings. However, the detailed effect of the used feedstock powder, is often neglected. Here, this work focuses on the deposition of Al2O3 + 13 wt % TiO2 coatings by atmospheric plasma spraying (APS) method as well as on their microstructure, phase composition and selected mechanical properties, in the reference to the route of the powder feedstock preparation. The commercial powder Metco 6221 in agglomerated and sintered form was used as a feedstock material during spraying, due to the fact that, so far, sintered or cladded powders are the most studied ones. The 2k + 1 spray experiment allowed to evaluate the influence of two variables, namely spray distance and torch linear velocity, on the coating microstructure. Afterwards, the coating adhesion was measured by the means of pull-off test. The correlations between Vickers microhardness, fracture toughness (Kc) as well as the coating morphology and phase composition were investigated. Finally, the dry sliding wear resistance was studied by using Ball-on-Disc method. Full article
Show Figures

Figure 1

Figure 1
<p>SEM image of Al<sub>2</sub>O<sub>3</sub> + 13 wt% TiO<sub>2</sub> powder in the delivery condition.</p>
Full article ">Figure 2
<p>The spray process configuration scheme (inspired by [<a href="#B22-coatings-10-00173" class="html-bibr">22</a>] copyright Elsevier 2008).</p>
Full article ">Figure 3
<p>Geometry and vertical section of cracks around Vickers print [<a href="#B28-coatings-10-00173" class="html-bibr">28</a>]: (<b>a</b>) radial-median mode, (<b>b</b>) Palmqvist mode, and (<b>c</b>) exemplary crack after Vickers indentation [<a href="#B29-coatings-10-00173" class="html-bibr">29</a>].</p>
Full article ">Figure 4
<p>Free surface (left side) and cross sections (right side) of produced coatings: (<b>a</b>,<b>b</b>)—AT13-1 (L = 80 mm; V = 300 mm/s); (<b>c</b>,<b>d</b>)—AT13-2 (L = 80 mm; V = 500 mm/s); (<b>e</b>,<b>f</b>)—AT13-3 (L = 90 mm; V = 400 mm/s); (<b>g</b>,<b>h</b>)—AT13-4 (L = 100 mm; V = 300 mm/s); (<b>i</b>,<b>j</b>)—AT13-5 (L = 100 mm; V = 500 mm/s); 1—fully melted splats, 2—non-melted powder particles.</p>
Full article ">Figure 4 Cont.
<p>Free surface (left side) and cross sections (right side) of produced coatings: (<b>a</b>,<b>b</b>)—AT13-1 (L = 80 mm; V = 300 mm/s); (<b>c</b>,<b>d</b>)—AT13-2 (L = 80 mm; V = 500 mm/s); (<b>e</b>,<b>f</b>)—AT13-3 (L = 90 mm; V = 400 mm/s); (<b>g</b>,<b>h</b>)—AT13-4 (L = 100 mm; V = 300 mm/s); (<b>i</b>,<b>j</b>)—AT13-5 (L = 100 mm; V = 500 mm/s); 1—fully melted splats, 2—non-melted powder particles.</p>
Full article ">Figure 5
<p>The correlation between spray process parameters and (<b>a</b>) free-surface topography and (<b>b</b>) microstructure of coatings cross sections.</p>
Full article ">Figure 6
<p>Mean values of coatings porosity.</p>
Full article ">Figure 7
<p>XRD of as-sprayed coatings and as-delivered powder.</p>
Full article ">Figure 8
<p>Adhesion strength of AT13 coatings.</p>
Full article ">Figure 9
<p>AT13-1 coatings after pull-off tests.</p>
Full article ">Figure 10
<p>Mean values of coating’s microhardness.</p>
Full article ">Figure 11
<p>The fracture toughness of AT13 coatings.</p>
Full article ">Figure 12
<p>The results of Ball-on-Disc test for AT13 coatings.</p>
Full article ">Figure 13
<p>The wear track surface of: (<b>a</b>) AT13-1 (L = 80 mm; V = 300 mm/s), (<b>b</b>) AT13-3 (L = 90 mm; V = 400 mm/s), and (<b>c</b>) AT13-5 coating (L = 100 mm; V = 500 mm/s): 1—smooth wear track, 2—rough debris.</p>
Full article ">
20 pages, 3967 KiB  
Article
The Effect of the Methyl and Ethyl Group of the Acrylate Precursor in Hybrid Silane Coatings Used for Corrosion Protection of Aluminium Alloy 7075-T6
by Damir Hamulić, Peter Rodič, Matic Poberžnik, Marjan Jereb, Janez Kovač and Ingrid Milošev
Coatings 2020, 10(2), 172; https://doi.org/10.3390/coatings10020172 - 13 Feb 2020
Cited by 24 | Viewed by 4363
Abstract
This study investigated polysiloxane hybrid sol-gel coatings synthesized from tetraethyl orthosilicate (TEOS), 3-(trimethoxysilyl)propyl methacrylate (MAPTMS) and two different precursors, i.e., methyl- or ethyl- methacrylate (MMA or EMA), as corrosion protection of aluminium alloy 7075-T6. The hypothesis was that the additional alkyl group might [...] Read more.
This study investigated polysiloxane hybrid sol-gel coatings synthesized from tetraethyl orthosilicate (TEOS), 3-(trimethoxysilyl)propyl methacrylate (MAPTMS) and two different precursors, i.e., methyl- or ethyl- methacrylate (MMA or EMA), as corrosion protection of aluminium alloy 7075-T6. The hypothesis was that the additional alkyl group might affect the chemical properties and, consequently, the corrosion properties. Synthesis of the sols proceeded in two steps, each involving either MMA or EMA in the same molar ratio. The resulting sols, siloxane-(poly(methyl methacrylate-co-MAPTMS)) or siloxane-(poly(ethyl methacrylate-co-MAPTMS)), were applied on aluminium alloy followed by characterization in terms of chemical structure and composition, topography, wettability, adhesion and corrosion resistance in 0.1 M sodium chloride solution. The chemical properties of sols, monoliths and coatings were investigated using Fourier transform infrared spectrometry, solid state nuclear magnetic resonance spectrometry, X-ray photoelectron spectroscopy and time-of-flight secondary ion mass spectrometry. Coatings were similar in terms of surface topography, while the wettability of the coating with EMA showed 6° greater water contact angle compared to the coating with MMA. Both coatings were shown, by electrochemical impedance spectroscopy in 0.1 M NaCl solution, to act as barriers to protect the underlying substrate in which coating with EMA exhibits better protection properties after 2 months of immersion. Adhesion tests confirmed the highest grade of adhesion to the substrate for both coatings. Testing in a salt-spray chamber demonstrated excellent corrosion protection, where coatings remaining intact after more than 600 h of exposure. Full article
(This article belongs to the Special Issue Corrosion Science and Surface Engineering)
Show Figures

Graphical abstract

Graphical abstract
Full article ">Figure 1
<p>FTIR absorption spectra of (<b>a</b>) MMA, (<b>b</b>) EMA, (<b>c</b>) MAPTMS, (<b>d</b>) TEOS, (<b>e</b>) THF, (<b>f</b>) EtOH, (<b>g</b>) siloxane-PMMA and (<b>h</b>) siloxane-PEMA sols. Spectra were recorded for freshly prepared sols without further curing treatment.</p>
Full article ">Figure 2
<p>Solid state <sup>13</sup>C CP/MAS NMR spectra of the siloxane-hybrid monoliths prepared from TEOS, MAPTMS and two acrylates: methyl methacrylate (MMA) and ethyl methacrylate (EMA). Spectra were recorded for sols treated thermally for 1 h at 60 °C and 1 h at 180 °C.</p>
Full article ">Figure 3
<p>Fitted solid state <sup>29</sup>Si CP/MAS NMR spectra of siloxane-PMMA and siloxane-PEMA monoliths prepared from TEOS, MAPTMS and two acrylates: methyl methacrylate (MMA) and ethyl methacrylate (EMA). After synthesis, sols were treated thermally for 1 h at 60 °C then 1 h at 180 °C to obtain monoliths. The experimental curve (blue line), fitted curve (yellow line) and individual component peaks used for fitting the experimental curve. Experimental curves were fitted using three component peaks described by pseudo-Voigt functions, using a non-linear least squares method<sup>a</sup>. An estimate of a 1% error in the determination of the fraction of each component peak can be predicted. Absolute and relative proportions of T and Q species obtained by deconvolution of spectra are given in <a href="#coatings-10-00172-t003" class="html-table">Table 3</a>. a. <a href="https://docs.scipy.org/doc/scipy/reference/generated/scipy.optimize.curve_fit.html" target="_blank">https://docs.scipy.org/doc/scipy/reference/generated/scipy.optimize.curve_fit.html</a>.</p>
Full article ">Figure 4
<p>XPS C 1s, O 1s and Si 2p spectra recorded for siloxane-PMMA and siloxane-PEMA hybrid sol-gel coatings deposited on AA7075-T6. Spectra were deconvoluted using fitted components sub-peaks corresponding to particular species present in the coatings. The composition deduced from survey spectra is given in <a href="#coatings-10-00172-t004" class="html-table">Table 4</a>.</p>
Full article ">Figure 5
<p>ToF-SIMS spectra of positive secondary ions at mass to charge ratios (<span class="html-italic">m/z</span>) around 31 and 45 with indicated methoxy CH<sub>3</sub>O<sup>+</sup> and ethoxy C<sub>2</sub>H<sub>5</sub>O<sup>+</sup> fragments. Spectra were recorded for siloxane-PMMA and siloxane-PEMA hybrid sol-gel coatings.</p>
Full article ">Figure 6
<p>Postulated mechanism of polymerization, hydrolysis and polycondensation reactions in the formation of siloxane-PMMA and siloxane-PEMA sols. Different T and Q species are denoted in organoalkoxysilane (i.e., MAPTMS) with two (T<sup>1</sup>), one (T<sup>2</sup>) or none (T<sup>3</sup>) silanol groups, and in inorganoalkoxysilane (i.e., TEOS) with three (Q<sup>1</sup>), two (Q<sup>2</sup>), one (Q<sup>3</sup>) or no (Q<sup>4</sup>) silanol groups. Methyl- and ethyl- methacrylate are denoted as MMA and EMA, respectively. (<b>a</b>) Sol 1: Polymerization; (<b>b</b>) Sol 2: Hydrolysis; (<b>c</b>) Sol 1 + Sol 2 – Network formation.</p>
Full article ">Figure 7
<p>(<b>a</b>–<b>c</b>) 3D topography images of bare AA7075 and AA7075 coated with siloxane-PMMA and siloxane-PEMA. Colour scale bar denotes the span of ±0.3 μm. (<b>d</b>–<b>e</b>) X-cut surfaces of AA7075-T6 substrates coated with siloxane-PMMA and siloxane-PEMA following the adhesion test - imaged by confocal microscope.</p>
Full article ">Figure 8
<p>Bode plots of impedance magnitude and phase angle of bare AA7075-T6, and AA7075-T6 coated with siloxane-PMMA and of siloxane-PEMA coatings measured after immersion in 0.1 M NaCl for 1 day.</p>
Full article ">Figure 9
<p>Bode plot of impedance magnitude and phase angle of AA7075-T6 coated with siloxane-PMMA measured after immersion in 0.1 M NaCl for up to 2 months. Symbols correspond to the experimental data and lines to the fitted curves. Electrical equivalent circuit used to fit the experimental data is given in inset; fitted parameters are presented in <a href="#coatings-10-00172-t005" class="html-table">Table 5</a>.</p>
Full article ">Figure 10
<p>Bode plot of impedance magnitude and phase angle of AA7075-T6 coated with siloxane-PEMA measured after immersion in 0.1 M NaCl for up to 2 months. Symbols correspond to the experimental data and lines to the fitted curves. Electrical equivalent circuit used to fit the experimental data is given in inset; fitted parameters are presented in <a href="#coatings-10-00172-t005" class="html-table">Table 5</a>.</p>
Full article ">Figure 11
<p>Images of bare and coated AA7075-T6 after 0, 24 and 600 h exposed to salt spray test (ASTM B117-07A).</p>
Full article ">
18 pages, 4831 KiB  
Review
Optimization of Performance Parameters and Mechanism of Bionic Texture on Friction Surface
by Qimin Hou, Xuefeng Yang, Jian Cheng, Shouren Wang, Derong Duan, Jupeng Xiao and Wanyang Li
Coatings 2020, 10(2), 171; https://doi.org/10.3390/coatings10020171 - 13 Feb 2020
Cited by 34 | Viewed by 4263
Abstract
In this paper, a variety of micro-textures made by imitating the biological body surface are mentioned, and four common biomimetic texture types—convex hull, pit, groove and corrugation—are summarized by referring to a large number of literatures. These texture types that are widely used [...] Read more.
In this paper, a variety of micro-textures made by imitating the biological body surface are mentioned, and four common biomimetic texture types—convex hull, pit, groove and corrugation—are summarized by referring to a large number of literatures. These texture types that are widely used are those of the grooves and the pits of non-smooth surface because their viscosity drag reduction effects are relatively optimal for wear-resistance; in view of these two types of textures (with others including pit diameter, groove width, depth and area of share, and morphology spacing), we use data analysis and comparisons to find optimal parameter values in order to find the optimal effect of drag reduction and anti-sticking wear-resistance. Several texture processing methods are briefly introduced through case analysis and an illustration of the viscosity drag reduction mechanism of wear-resistance, and general fluid dynamic pressure is deduced from a theory formula in order to facilitate future research work on the basis of the optimal parameters to further improve the friction, wear lubrication, and hydrophobic properties, thus improving the bionic texture surface efficiency of saving energy and reducing consumption in industrial applications. Full article
Show Figures

Figure 1

Figure 1
<p>Dynamic pressure lubrication.</p>
Full article ">Figure 2
<p>Micro-textured morphology of typical organisms and surfaces.</p>
Full article ">Figure 3
<p>Non-smooth texture. (<b>a</b>) Pit; (<b>b</b>) convex hull; (<b>c</b>) corrugation; and (<b>d</b>) groove.</p>
Full article ">Figure 4
<p>Microscopic morphology of wear scars of different pit diameters under dry friction.</p>
Full article ">Figure 5
<p>Microscopic morphology of wear scars of different pit diameters under oil shortage.</p>
Full article ">Figure 6
<p>The coefficients of friction corresponding to each pit depth under different load conditions.</p>
Full article ">Figure 7
<p>Effect of width on the coefficient of friction under different spacings.</p>
Full article ">Figure 7 Cont.
<p>Effect of width on the coefficient of friction under different spacings.</p>
Full article ">Figure 8
<p>Wear loss of pit surfaces with different spacings.</p>
Full article ">Figure 9
<p>Effect of spacing on the coefficient of friction under different widths.</p>
Full article ">Figure 10
<p>Schematic diagram of pit texture.</p>
Full article ">Figure 11
<p>Coefficients of friction corresponding to different occupancy rates.</p>
Full article ">Figure 11 Cont.
<p>Coefficients of friction corresponding to different occupancy rates.</p>
Full article ">Figure 12
<p>Schematic diagram of groove texture.</p>
Full article ">Figure 13
<p>Effect of groove density on the coefficient of friction.</p>
Full article ">
20 pages, 831 KiB  
Article
Analysis of Magnetic Properties of Nano-Particles Due to a Magnetic Dipole in Micropolar Fluid Flow over a Stretching Sheet
by Liaqat Ali, Xiaomin Liu, Bagh Ali, Saima Mujeed, Sohaib Abdal and Shahid Ali Khan
Coatings 2020, 10(2), 170; https://doi.org/10.3390/coatings10020170 - 13 Feb 2020
Cited by 67 | Viewed by 3246
Abstract
This article explores the impact of a magnetic dipole on the heat transfer phenomena of different nano-particles Fe (ferromagnetic) and Fe3O4 (Ferrimagnetic) dispersed in a base fluid ( 60 % water + 40 % ethylene glycol) on micro-polar fluid flow [...] Read more.
This article explores the impact of a magnetic dipole on the heat transfer phenomena of different nano-particles Fe (ferromagnetic) and Fe3O4 (Ferrimagnetic) dispersed in a base fluid ( 60 % water + 40 % ethylene glycol) on micro-polar fluid flow over a stretching sheet. A magnetic dipole in the presence of the ferrities of nano-particles plays an important role in controlling the thermal and momentum boundary layers. The use of magnetic nano-particles is to control the flow and heat transfer process through an external magnetic field. The governing system of partial differential equations is transformed into a system of coupled nonlinear ordinary differential equations by using appropriate similarity variables, and the transformed equations are then solved numerically by using a variational finite element method. The impact of different physical parameters on the velocity, the temperature, the Nusselt number, and the skin friction coefficient is shown. The velocity profile decreases in the order Fe (ferromagnetic fluid) and Fe3O4 (ferrimagnetic fluid). Furthermore, it was observed that the Nusselt number is decreasing with the increasing values of boundary parameter ( δ ) , while there is controversy with respect to the increasing values of radiation parameter ( N ) . Additionally, it was observed that the ferromagnetic case gained maximum thermal conductivity, as compared to ferrimagnetic case. In the end, the convergence of the finite element solution was observed; the calculations were found by reducing the mesh size. Full article
Show Figures

Figure 1

Figure 1
<p>Configuration of the flow model.</p>
Full article ">Figure 2
<p>Impact of magnetic nano-particles and suction/injection (<math display="inline"><semantics> <msub> <mi>f</mi> <mn>0</mn> </msub> </semantics></math>) on the velocity profile <math display="inline"><semantics> <mrow> <msup> <mi>f</mi> <mo>′</mo> </msup> <mrow> <mo stretchy="false">(</mo> <mi>η</mi> <mo stretchy="false">)</mo> </mrow> </mrow> </semantics></math>.</p>
Full article ">Figure 3
<p>Impact of magnetic nano-particles and suction/injection (<math display="inline"><semantics> <msub> <mi>f</mi> <mn>0</mn> </msub> </semantics></math>) on the microrotaion velocity <math display="inline"><semantics> <mrow> <mi>g</mi> <mo stretchy="false">(</mo> <mi>η</mi> <mo stretchy="false">)</mo> </mrow> </semantics></math>.</p>
Full article ">Figure 4
<p>Impact of magnetic nano-particles and suction/injection (<math display="inline"><semantics> <msub> <mi>f</mi> <mn>0</mn> </msub> </semantics></math>) on the temperature profile <math display="inline"><semantics> <mrow> <msub> <mi>θ</mi> <mn>1</mn> </msub> <mrow> <mo stretchy="false">(</mo> <mi>η</mi> <mo stretchy="false">)</mo> </mrow> </mrow> </semantics></math>.</p>
Full article ">Figure 5
<p>Impact of magnetic nano-particles and ferromagnetic parameter (<math display="inline"><semantics> <mi>β</mi> </semantics></math>) on the velocity profile <math display="inline"><semantics> <mrow> <msup> <mi>f</mi> <mo>′</mo> </msup> <mrow> <mo stretchy="false">(</mo> <mi>η</mi> <mo stretchy="false">)</mo> </mrow> </mrow> </semantics></math>.</p>
Full article ">Figure 6
<p>Impact of magnetic nano-particles and ferromagnetic parameter (<math display="inline"><semantics> <mi>β</mi> </semantics></math>) on the micro-rotaion velocity <math display="inline"><semantics> <mrow> <mi>g</mi> <mo stretchy="false">(</mo> <mi>η</mi> <mo stretchy="false">)</mo> </mrow> </semantics></math>.</p>
Full article ">Figure 7
<p>Impact of magnetic nano-particles and ferromagnetic parameter (<math display="inline"><semantics> <mi>β</mi> </semantics></math>) on the temperature profile <math display="inline"><semantics> <mrow> <msub> <mi>θ</mi> <mn>1</mn> </msub> <mrow> <mo stretchy="false">(</mo> <mi>η</mi> <mo stretchy="false">)</mo> </mrow> </mrow> </semantics></math>.</p>
Full article ">Figure 8
<p>Impact of magnetic nano-particles and micro-rotation parameter (<span class="html-italic">K</span>) on the velocity profile <math display="inline"><semantics> <mrow> <msup> <mi>f</mi> <mo>′</mo> </msup> <mrow> <mo stretchy="false">(</mo> <mi>η</mi> <mo stretchy="false">)</mo> </mrow> </mrow> </semantics></math>.</p>
Full article ">Figure 9
<p>Impact of magnetic nano-particles and micro-rotation parameter (<span class="html-italic">K</span>) on the micro-rotaion velocity <math display="inline"><semantics> <mrow> <mi>g</mi> <mo stretchy="false">(</mo> <mi>η</mi> <mo stretchy="false">)</mo> </mrow> </semantics></math>.</p>
Full article ">Figure 10
<p>Impact of magnetic nano-particles and micro-rotation parameter (<span class="html-italic">K</span>) on the temperature profile <math display="inline"><semantics> <mrow> <msub> <mi>θ</mi> <mn>1</mn> </msub> <mrow> <mo stretchy="false">(</mo> <mi>η</mi> <mo stretchy="false">)</mo> </mrow> </mrow> </semantics></math>.</p>
Full article ">Figure 11
<p>Impact of magnetic nano-particles and Prandtl Number (<math display="inline"><semantics> <mrow> <mi>P</mi> <mi>r</mi> </mrow> </semantics></math>) on the temperature profile <math display="inline"><semantics> <mrow> <msub> <mi>θ</mi> <mn>1</mn> </msub> <mrow> <mo stretchy="false">(</mo> <mi>η</mi> <mo stretchy="false">)</mo> </mrow> </mrow> </semantics></math>.</p>
Full article ">Figure 12
<p>Impact of magnetic nano-particles and thermal radiation (<span class="html-italic">N</span>) on the temperature profile <math display="inline"><semantics> <mrow> <msub> <mi>θ</mi> <mn>1</mn> </msub> <mrow> <mo stretchy="false">(</mo> <mi>η</mi> <mo stretchy="false">)</mo> </mrow> </mrow> </semantics></math>.</p>
Full article ">Figure 13
<p>Impact of magnetic nano-particles and <span class="html-italic">R</span> (the ratio of <span class="html-italic">Q</span> and <span class="html-italic">S</span>) on the velocity profile <math display="inline"><semantics> <mrow> <msup> <mi>f</mi> <mo>′</mo> </msup> <mrow> <mo stretchy="false">(</mo> <mi>η</mi> <mo stretchy="false">)</mo> </mrow> </mrow> </semantics></math>.</p>
Full article ">Figure 14
<p>Impact of magnetic nano-particles and <span class="html-italic">R</span> (the ratio of <span class="html-italic">Q</span> and <span class="html-italic">S</span>) on the micro-rotation velocity <math display="inline"><semantics> <mrow> <mi>g</mi> <mo stretchy="false">(</mo> <mi>η</mi> <mo stretchy="false">)</mo> </mrow> </semantics></math>.</p>
Full article ">Figure 15
<p>Impact of magnetic nano-particles and viscous dissipation (<math display="inline"><semantics> <mi>λ</mi> </semantics></math>) on the temperature profile <math display="inline"><semantics> <mrow> <msub> <mi>θ</mi> <mn>1</mn> </msub> <mrow> <mo stretchy="false">(</mo> <mi>η</mi> <mo stretchy="false">)</mo> </mrow> </mrow> </semantics></math>.</p>
Full article ">Figure 16
<p>Impact of magnetic nano-particles and thermal radiation (<span class="html-italic">N</span>) on the Nusselt number.</p>
Full article ">Figure 17
<p>Impact of magnetic nano-particles and boundary parameter (<math display="inline"><semantics> <mi>δ</mi> </semantics></math>) on the Nusselt number.</p>
Full article ">Figure 18
<p>Impact of magnetic nano-particles and ferromagnetic parameter (<math display="inline"><semantics> <mi>β</mi> </semantics></math>) on skin friction.</p>
Full article ">Figure 19
<p>Impact of magnetic nano-particles and boundary parameter (<math display="inline"><semantics> <mi>δ</mi> </semantics></math>) on skin friction.</p>
Full article ">
20 pages, 5034 KiB  
Article
Titanium Dioxide Coatings Doubly-Doped with Ca and Ag Ions as Corrosion Resistant, Biocompatible, and Bioactive Materials for Medical Applications
by Barbara Burnat, Patrycja Olejarz, Damian Batory, Michal Cichomski, Marta Kaminska and Dorota Bociaga
Coatings 2020, 10(2), 169; https://doi.org/10.3390/coatings10020169 - 13 Feb 2020
Cited by 9 | Viewed by 3237
Abstract
The aim of this study was to develop a multifunctional biomedical coating that is highly corrosion resistant, biocompatible, and reveals the bioactive properties. For that purpose, titanium dioxide coatings doubly-doped with Ca and Ag ions were deposited by dip-coating onto M30NW biomedical steel. [...] Read more.
The aim of this study was to develop a multifunctional biomedical coating that is highly corrosion resistant, biocompatible, and reveals the bioactive properties. For that purpose, titanium dioxide coatings doubly-doped with Ca and Ag ions were deposited by dip-coating onto M30NW biomedical steel. The influence of different ratios of Ca and Ag dopants on morphology, surface structure, corrosion resistance, bioactivity, wettability, and biological properties of TiO2-based sol-gel coatings was studied and discussed. Comprehensive measurements were performed including atomic force microscopy (AFM), scanning electron microscopy (SEM), X-ray diffraction (XRD), X-ray reflectivity (XRR), corrosion tests, immersion test, contact angle, as well as biological evaluation. The obtained results confirmed that anatase-based coatings containing Ca and Ag ions, independently of their molar ratio in the coating, are anticorrosive, hydrophilic, and bioactive. The results of the biological evaluation indicated that investigated coatings are biocompatible and do not reduce the proliferation ability of the osteoblasts cells. Full article
(This article belongs to the Special Issue Functional Ceramic Coatings)
Show Figures

Figure 1

Figure 1
<p>The general view of the coated samples, and atomic force microscopy (AFM) images (scan sizes of 5 µm × 5 µm and 1 µm × 1 µm) for all types of coatings.</p>
Full article ">Figure 2
<p>XRD patterns for TiO<sub>2</sub>-based coatings doped with Ca and Ag ions in different molar ratios.</p>
Full article ">Figure 3
<p>Values of (<b>a</b>) corrosion potential, E<sub>cor</sub>, (<b>b</b>) polarization resistance, R<sub>p</sub>, and corrosion rate, CR, determined for TiO<sub>2</sub>-based coatings doped with Ca and Ag ions in different molar ratios.</p>
Full article ">Figure 4
<p>Potentiodynamic polarization curves of TiO<sub>2</sub>-based coatings in phosphate buffered saline (PBS) solution (scan rate 1 mV·s<sup>−1</sup>).</p>
Full article ">Figure 5
<p>Post-polarization SEM images (1000× mag., bar 50 µm) and optical microscopic images (50× mag., bar 1000 µm).</p>
Full article ">Figure 6
<p>SEM micrographs of apatite formed on: (<b>a</b>) undoped TiO<sub>2</sub>, (<b>b</b>) Ca_TiO<sub>2</sub>, (<b>c</b>) 75Ca25Ag_TiO<sub>2</sub>, and (<b>d</b>) Ag_TiO<sub>2</sub> after soaking for 28 days in simulated body fluid (SBF) solution (detector TLD, mag 50,000×, bar 1 µm).</p>
Full article ">Figure 7
<p>Contact angles Θ of the titania-based coatings on M30NW alloy samples depending on doped ions.</p>
Full article ">Figure 8
<p>Surface free energy γ values (with distinction between dispersive and polar components) of the titania-based coatings doped with Ca and Ag ions in different molar ratios.</p>
Full article ">Figure 9
<p>The results of (<b>a</b>) the live/dead test and (<b>b</b>) the cells’ proliferation evaluation for all the examined coatings after 48 h of direct contact (conducted according to the protocol of ISO 10993-5: Tests for Cytotoxicity—In Vitro Methods).</p>
Full article ">Figure 10
<p>The osteoblast cells images (fluorescent stained, live cells—green colour, bar 200 µm) after 48 h of growing on samples (direct contact) modified by coatings with different composition and nanostructure.</p>
Full article ">
14 pages, 4768 KiB  
Article
Effect of Emulsifier on the Structure and Properties of Waterborne Silicone Antifouling Coating
by Sikui Liu, Zhanping Zhang and Yuhong Qi
Coatings 2020, 10(2), 168; https://doi.org/10.3390/coatings10020168 - 12 Feb 2020
Cited by 12 | Viewed by 4112
Abstract
Three-component waterborne silicone antifouling coatings, which could cured at room temperature, were prepared, respectively, with cationic (stearyl trimethyl ammonium bromide) or anionic (sodium dodecyl benzene sulfonate) silicone emulsion as a film-forming substance, γ-methacryloxypropyltrimethoxysilane as a curing agent and dibutyltin dilaurate as a catalyst. [...] Read more.
Three-component waterborne silicone antifouling coatings, which could cured at room temperature, were prepared, respectively, with cationic (stearyl trimethyl ammonium bromide) or anionic (sodium dodecyl benzene sulfonate) silicone emulsion as a film-forming substance, γ-methacryloxypropyltrimethoxysilane as a curing agent and dibutyltin dilaurate as a catalyst. The effect of emulsifier on the structure and properties of silicone coating was studied. The results showed that the coating with cationic silicone emulsion had high crosslinking density, and its surface is smooth. The surface of the coating prepared by the anionic silicone emulsion is rough. Emulsifier type had no obvious effect on the surface free energy of the waterborne silicone coating. The coatings have the characteristics of low surface energy and excellent bacterial desorption properties. Stearyl trimethyl ammonium bromide in the cured coating can reduce the adhesion of marine bacteria on the coating surface. Both the emulsifiers can inhibit the activity of Navicula Tenera. The waterborne silicone coating prepared by cationic silicone emulsion has better comprehensive mechanical properties and antifouling performance. Full article
(This article belongs to the Special Issue Antimicrobial/Antibiofilm Surfaces)
Show Figures

Figure 1

Figure 1
<p>Molecular structure formula of emulsifier (<b>a</b>) Stearyl trimethyl ammonium bromide (<b>b</b>) Sodium dodecyl benzene sulfonate.</p>
Full article ">Figure 2
<p>Infrared spectrum curve of studied coatings (<b>a</b>) cured (<b>b</b>) cleaned.</p>
Full article ">Figure 3
<p>Schematic model of film formation process of silicone emulsion. (<b>a</b>) the early stage of painting; (<b>b</b>) the early stage of cross-linking reaction; (<b>c</b>) after drying on surface; (<b>d</b>) the cross-linking reaction is completed; (<b>e</b>) completely cured; (<b>f</b>) basic structure of silicone emulsion; (<b>g</b>) structural formula of crosslinker.</p>
Full article ">Figure 4
<p>Chemical reaction principle of waterborne silicone. (<b>a</b>) The curing agent hydrolysis reaction; (<b>b</b>) Crosslinking reaction between silanol and silicone.</p>
Full article ">Figure 5
<p>Schematic diagram of crosslinker entering emulsion particle (<b>a</b>) coating 5011 (<b>b</b>) coating 5012.</p>
Full article ">Figure 6
<p>Morphology of studied coatings (<b>a</b>) coating 5011 (<b>b</b>) coating 5012.</p>
Full article ">Figure 7
<p>Stress–strain curve of coatings.</p>
Full article ">Figure 8
<p>Fracture morphology of coatings (<b>a</b>) coating 5011 (<b>b</b>) coating 5012.</p>
Full article ">Figure 9
<p>Images of bacterial colonies (<b>a</b>) rinsed coating 5011; (<b>b</b>) rinsed coating 5012; (<b>c</b>) rinsed solvent-based silicone coating; (<b>d</b>) washed coating 5011; (<b>e</b>) washed coating 5012; (<b>f</b>) washed solvent-based silicone coating.</p>
Full article ">Figure 10
<p>Concentration of bacterial colonies in test samples.</p>
Full article ">Figure 11
<p>Changes in <span class="html-italic">Navicula Tenera</span> solution during test. (<b>a</b>) at glass slide before test; (<b>b</b>) at coating 5011 for 1 day; (<b>c</b>) at coating 5011 for 2 day; (<b>d</b>) at coating 5012 for 1 day; (<b>e</b>) at coating 5012 for 2 day; (<b>f</b>) at glass slide after test.</p>
Full article ">Figure 12
<p>Schematic diagram of crosslinking agent entering emulsion particle.</p>
Full article ">
20 pages, 6001 KiB  
Article
Water Pipes Corrosion Inhibitors for Q235 Steel in Hydrochloric Acid Medium Using Spiropyrazoles Derivatives
by A. M. Eldesoky, Hala. M. Hassan, Abdu Subaihi, Abeer El Shahawy and Thoraya A. Farghaly
Coatings 2020, 10(2), 167; https://doi.org/10.3390/coatings10020167 - 12 Feb 2020
Cited by 10 | Viewed by 3017
Abstract
Water pipes and drinking water quality deterioration in distribution systems and sea water desalination impose the use of corrosion inhibitors. The protective effect of spiropyrazole derivatives against Q235 steel and its adsorption performance were examined in solution of 1 M HCl utilizing TP [...] Read more.
Water pipes and drinking water quality deterioration in distribution systems and sea water desalination impose the use of corrosion inhibitors. The protective effect of spiropyrazole derivatives against Q235 steel and its adsorption performance were examined in solution of 1 M HCl utilizing TP (Tafel polarization), electrochemical frequency modulation (EFM), and electrochemical impedance spectroscopy (EIS) tests. The outcome data from hindrance efficiency rise with the dose of inhibitor. The orders of %IE of spiropyrazole derivatives are given: (1) > (2) > (3).It was noted that the values of EHOMO and ELUMO dropping in order run parallel to the improvement in %IE, which support the preceding order. EIS spectra exhibited one capacitive loop and approve the protective ability. Molecular docking was utilized to get a full picture on the binding mode among spiropyrazoles derivatives and the receptor of 3tt8-hormone of crystal structure examination of Cu human insulin derivative. The morphology of protected Q235 steel was evaluated by checking electron magnifying instrument innovation with energy dispersive X-beam spectroscopy (SEM–EDX). Full article
Show Figures

Graphical abstract

Graphical abstract
Full article ">Figure 1
<p>TP diagrams for the corrosion of Q235 steel in corrosive environments in the presence and lack of unlike dose of spiropyrazoles (1) at 25 ± 0.1 °C.</p>
Full article ">Figure 2
<p>EIS Nyquist (<b>a</b>) and Bode diagrams (<b>b</b>) for the corrosion of Q235 steel inattendance and lack of unlike dose of compound (1) at 25 ± 0.1 °C.</p>
Full article ">Figure 3
<p>Equivalent circuit utilized to fit EIS data.</p>
Full article ">Figure 4
<p>EFM bends for the corrosion of Q235 steel in corrosive environments attendance and lack of unlike dose of spiropyrazoles (1).</p>
Full article ">Figure 5
<p>Spiropyrazoles derivatives (green in (<b>A</b>) and gray in (<b>B</b>)) in interaction with 3tt8 receptor. (For interpretation of the references to color in this figure legend, the reader is referred to the web version of this article).</p>
Full article ">Figure 5 Cont.
<p>Spiropyrazoles derivatives (green in (<b>A</b>) and gray in (<b>B</b>)) in interaction with 3tt8 receptor. (For interpretation of the references to color in this figure legend, the reader is referred to the web version of this article).</p>
Full article ">Figure 6
<p>HB plot of interaction between spiropyrazoles products with receptor of breast cancer mutant 3tt8.</p>
Full article ">Figure 6 Cont.
<p>HB plot of interaction between spiropyrazoles products with receptor of breast cancer mutant 3tt8.</p>
Full article ">Figure 7
<p>2D plot of interaction among spiropyrazoles products with 3tt8 receptor.</p>
Full article ">Figure 7 Cont.
<p>2D plot of interaction among spiropyrazoles products with 3tt8 receptor.</p>
Full article ">Figure 8
<p>SEM images of Q235 steel in corrosive environments attendance and lack of unlike dose of 11 × 10<sup>−6</sup> M spiropyrazoles.</p>
Full article ">Figure 9
<p>EDS study of Q235 steel after 3 days in corrosive environments attendance and lack of unlike dose of 11 × 10<sup>−6</sup> M spiropyrazoles.</p>
Full article ">Figure 9 Cont.
<p>EDS study of Q235 steel after 3 days in corrosive environments attendance and lack of unlike dose of 11 × 10<sup>−6</sup> M spiropyrazoles.</p>
Full article ">Figure 10
<p>Molecular orbital bends of study spiropyrazoles.</p>
Full article ">Figure 11
<p>Adsorption diagrams for spiropyrazoles additives as inhibitors at: (<b>a</b>) Low concentration, (<b>b</b>) intermediate concentration, (<b>c</b>) high concentration on Q235 steel.</p>
Full article ">
16 pages, 2603 KiB  
Review
The Use of Edible Films Based on Sodium Alginate in Meat Product Packaging: An Eco-Friendly Alternative to Conventional Plastic Materials
by Roxana Gheorghita (Puscaselu), Gheorghe Gutt and Sonia Amariei
Coatings 2020, 10(2), 166; https://doi.org/10.3390/coatings10020166 - 12 Feb 2020
Cited by 91 | Viewed by 16358
Abstract
The amount of plastics used globally today exceeds a million tonnes annually, with an alarming annual growth. The final result is that plastic packaging is thrown into the environment, and the problem of waste is increasing every year. A real alternative is the [...] Read more.
The amount of plastics used globally today exceeds a million tonnes annually, with an alarming annual growth. The final result is that plastic packaging is thrown into the environment, and the problem of waste is increasing every year. A real alternative is the use bio-based polymer packaging materials. Research carried out in the laboratory context and products tested at the industrial level have confirmed the success of replacing plastic-based packaging with new, edible or completely biodegradable foils. Of the polysaccharides used to obtain edible materials, sodium alginate has the ability to form films with certain specific properties: resistance, gloss, flexibility, water solubility, low permeability to O2 and vapors, and tasteless or odorless. Initially used as coatings for perishable or cut fresh fruits and vegetables, these sodium alginate materials can be applied to a wide range of foods, especially in the meat industry. Used to cover meat products, sodium alginate films prevent mass loss and degradation of color and texture. The addition of essential oils prevents microbial contamination with Escherichia coli, Salmonella enterica, Listeria monocytogenes, or Botrytis cinerea. The obtained results promote the substitution of plastic packaging with natural materials based on biopolymers and, implicitly, of sodium alginate, with or without other natural additions. These natural materials have become the packaging of the future. Full article
(This article belongs to the Special Issue Novel Advances in Food Contact Materials)
Show Figures

Figure 1

Figure 1
<p>The sodium alginate gelling mechanism [<a href="#B32-coatings-10-00166" class="html-bibr">32</a>] (adapted from by Hou et al., Copyright 2019 Elsevier).</p>
Full article ">Figure 2
<p>Material characteristics [<a href="#B33-coatings-10-00166" class="html-bibr">33</a>]. (Copyright 2012 Elsevier).</p>
Full article ">Figure 2 Cont.
<p>Material characteristics [<a href="#B33-coatings-10-00166" class="html-bibr">33</a>]. (Copyright 2012 Elsevier).</p>
Full article ">Figure 3
<p>Applications of sodium-alginate-based edible films incorporated with <span class="html-italic">Stevia rebaudiana</span> for (<b>a</b>) soluble coffee, (<b>b</b>) dehydrated vegetables, (<b>c</b>) medicines in powder form, (<b>d</b>) cheese slices, and (<b>e</b>) meat slices—the pictured packaging film (both welded parts and excedentary parts) are entirely based on sodium alginate agar, and were plasticized with glycerol [<a href="#B35-coatings-10-00166" class="html-bibr">35</a>].</p>
Full article ">Figure 3 Cont.
<p>Applications of sodium-alginate-based edible films incorporated with <span class="html-italic">Stevia rebaudiana</span> for (<b>a</b>) soluble coffee, (<b>b</b>) dehydrated vegetables, (<b>c</b>) medicines in powder form, (<b>d</b>) cheese slices, and (<b>e</b>) meat slices—the pictured packaging film (both welded parts and excedentary parts) are entirely based on sodium alginate agar, and were plasticized with glycerol [<a href="#B35-coatings-10-00166" class="html-bibr">35</a>].</p>
Full article ">Figure 4
<p>Ways of obtaining and applying films and coatings (adaptation by Wang, et al., 2018, [<a href="#B54-coatings-10-00166" class="html-bibr">54</a>]).</p>
Full article ">
Previous Issue
Next Issue
Back to TopTop