


Membranes, Volume 10, Issue 6 (June 2020) – 24 articles
Cover Story (view full-size image):
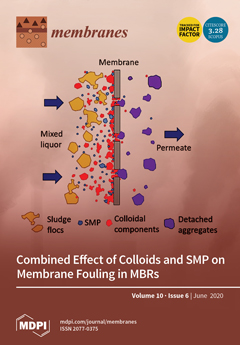
The aim of this work is to study the combined effect of colloids and soluble microbial products (SMP) on membrane fouling. Two MBRs were investigated for treating two types of wastewater (wwt). Domestic wwt presented 5.5 times more SMP proteins and 11 times more SMP carbohydrates compared to the synthetic one. In contrast, synthetic wwt had 20% more colloids with a size lower than membrane pore size than domestic. Finally, the TMP at 36 days reached 16 kPa for synthetic wwt and 11 kPa for domestic. Consequently, the quantity of colloids and possibly their special characteristics play a more important role in membrane fouling compared to the SMP, a novel conclusion that can be used for mitigation of membranes fouling. View this paper
- Issues are regarded as officially published after their release is announced to the table of contents alert mailing list.
- You may sign up for e-mail alerts to receive table of contents of newly released issues.
- PDF is the official format for papers published in both, html and pdf forms. To view the papers in pdf format, click on the "PDF Full-text" link, and use the free Adobe Reader to open them.
Previous Issue
Next Issue