[go: up one dir, main page]

Next Issue
Volume 10, November
Previous Issue
Volume 10, September


Membranes, Volume 10, Issue 10 (October 2020) – 52 articles

Cover Story (view full-size image): 
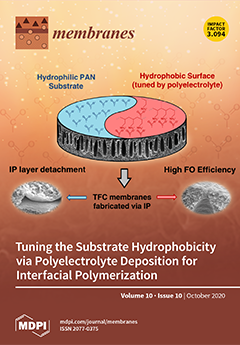
Interfacial polymerization (IP) is widely employed for the fabrication of thin-film composite (TFC) membranes. However, the role of substrate hydrophilicity in forming the IP-film remains a controversial issue. This study characterized the IP films formed on a series of polyacrylonitrile substrates whose hydrophilicities were varied via the deposition of various polycations. It was revealed that delamination could occur when forming the IP film on a relatively hydrophilic surface; the integrity of the TFC membranes was substantially improved when applying the polyelectrolyte deposition. It also affirmed that TFC membranes could have an enhanced efficiency when increasing the substrate hydrophilicity. View this paper
  • Issues are regarded as officially published after their release is announced to the table of contents alert mailing list.
  • You may sign up for e-mail alerts to receive table of contents of newly released issues.
  • PDF is the official format for papers published in both, html and pdf forms. To view the papers in pdf format, click on the "PDF Full-text" link, and use the free Adobe Reader to open them.
Order results
Result details
Section
Select all
Export citation of selected articles as:
14 pages, 45644 KiB  
Article
Fluid-Structure Interaction Analysis on Membrane Behavior of a Microfluidic Passive Valve
by Zhen-hao Lin, Xiao-juan Li, Zhi-jiang Jin and Jin-yuan Qian
Membranes 2020, 10(10), 300; https://doi.org/10.3390/membranes10100300 - 21 Oct 2020
Cited by 10 | Viewed by 3233
Abstract
In this paper, the effect of membrane features on flow characteristics in the microfluidic passive valve (MPV) and the membrane behavior against fluid flow are studied using the fluid-structure interaction (FSI) analysis. Firstly, the microvalve model with different numbers of microholes and pitches [...] Read more.
In this paper, the effect of membrane features on flow characteristics in the microfluidic passive valve (MPV) and the membrane behavior against fluid flow are studied using the fluid-structure interaction (FSI) analysis. Firstly, the microvalve model with different numbers of microholes and pitches of microholes are designed to investigate the flow rate of the MPV. The result shows that the number of microholes on the membrane has a significant impact on the flow rate of the MPV, while the pitch of microholes has little effect on it. The constant flow rate maintained by the microvalve (the number of microholes n = 4) is 5.75 mL/min, and the threshold pressure to achieve the flow rate is 4 kPa. Secondly, the behavior of the membrane against the fluid flow is analyzed. The result shows that as the inlet pressure increases, the flow resistance of the MPV increases rapidly, and the deformation of the membrane gradually becomes stable. Finally, the effect of the membrane material on the flow rate and the deformation of the membrane are studied. The result shows that changes in the material properties of the membrane cause a decrease in the amount of deformation in all stages the all positions of the membrane. This work may provide valuable guidance for the optimization of microfluidic passive valve in microfluidic system. Full article
(This article belongs to the Special Issue Microfluidics and MEMS Technology for Membranes)
Show Figures

Graphical abstract

Graphical abstract
Full article ">Figure 1
<p>(<b>a</b>) Three-dimensional (3D) model of the MPV, (<b>b</b>) critical dimensions of the MPV, (<b>c</b>) fluid domain, and (<b>d</b>) schematic diagram of the MPV actuation under pressurized fluid.</p>
Full article ">Figure 2
<p>The microholes design on the PDMS membrane. (<b>a</b>) Number of microholes (<span class="html-italic">L</span> = 1000 μm), (<b>b</b>) different pitches of microholes (<span class="html-italic">n</span> = 4).</p>
Full article ">Figure 3
<p>Schematic diagram of FSI.</p>
Full article ">Figure 4
<p>(<b>a</b>) Fluid domain mesh, (<b>b</b>) solid domain mesh, (<b>c</b>) refined mesh of microhole, (<b>d</b>) initial state without fluid of MPV, (<b>e</b>,<b>f</b>) mesh moving process of the fluid domain with the membrane deformation.</p>
Full article ">Figure 5
<p>Comparison of experimental results with numerical results varied inlet pressure.</p>
Full article ">Figure 6
<p>Velocity contours for different inlet pressure in symmetry planes, (<b>a</b>) <span class="html-italic">n</span> = 2, (<b>b</b>) <span class="html-italic">n</span> = 4.</p>
Full article ">Figure 6 Cont.
<p>Velocity contours for different inlet pressure in symmetry planes, (<b>a</b>) <span class="html-italic">n</span> = 2, (<b>b</b>) <span class="html-italic">n</span> = 4.</p>
Full article ">Figure 7
<p>Flow rates and maximum deformation of the MPV with different numbers of microholes under varied inlet pressures (<span class="html-italic">L</span> = 1000 μm).</p>
Full article ">Figure 8
<p>Flow rates and maximum deformation of the MPV with different pitches of microholes under varied inlet pressures (<span class="html-italic">n</span> = 4).</p>
Full article ">Figure 9
<p>Pressure distribution for lower surface of the membrane in microvalve. (<b>a</b>) Different inlet pressure with <span class="html-italic">n</span> = 2, (<b>b</b>) different number of microholes with inlet pressure of 4 kPa.</p>
Full article ">Figure 10
<p>Equivalent stress of the membrane in various time step. (<b>a</b>) Lower surface of membrane, (<b>b</b>) upper surface of membrane.</p>
Full article ">Figure 11
<p>Deformation of the membrane in the path with <span class="html-italic">n</span> = 4 and <span class="html-italic">L</span> = 1000 μm.</p>
Full article ">Figure 12
<p>Flow rates and maximum deformation of the membrane with various material properties with <span class="html-italic">n</span> = 4 and <span class="html-italic">L</span> = 1000 μm.</p>
Full article ">Figure 13
<p>Deformation of the membrane at an inlet pressure of 4 kPa.</p>
Full article ">
32 pages, 1194 KiB  
Review
Regulation of Cell Death by Mitochondrial Transport Systems of Calcium and Bcl-2 Proteins
by Natalia Naumova and Radek Šachl
Membranes 2020, 10(10), 299; https://doi.org/10.3390/membranes10100299 - 21 Oct 2020
Cited by 27 | Viewed by 5394
Abstract
Mitochondria represent the fundamental system for cellular energy metabolism, by not only supplying energy in the form of ATP, but also by affecting physiology and cell death via the regulation of calcium homeostasis and the activity of Bcl-2 proteins. A lot of research [...] Read more.
Mitochondria represent the fundamental system for cellular energy metabolism, by not only supplying energy in the form of ATP, but also by affecting physiology and cell death via the regulation of calcium homeostasis and the activity of Bcl-2 proteins. A lot of research has recently been devoted to understanding the interplay between Bcl-2 proteins, the regulation of these interactions within the cell, and how these interactions lead to the changes in calcium homeostasis. However, the role of Bcl-2 proteins in the mediation of mitochondrial calcium homeostasis, and therefore the induction of cell death pathways, remain underestimated and are still not well understood. In this review, we first summarize our knowledge about calcium transport systems in mitochondria, which, when miss-regulated, can induce necrosis. We continue by reviewing and analyzing the functions of Bcl-2 proteins in apoptosis. Finally, we link these two regulatory mechanisms together, exploring the interactions between the mitochondrial Ca2+ transport systems and Bcl-2 proteins, both capable of inducing cell death, with the potential to determine the cell death pathway—either the apoptotic or the necrotic one. Full article
(This article belongs to the Special Issue Membrane Channels and Transporters)
Show Figures

Graphical abstract

Graphical abstract
Full article ">Figure 1
<p>Schematic presentation of Ca<sup>2+</sup> transport systems in mitochondria. (1) Ca<sup>2+</sup> influx and efflux through the outer mitochondrial membrane (OMM) driven via the voltage-dependent anion channel (VDAC). (2) Ca<sup>2+</sup> influx through the inner mitochondrial membrane (IMM) driven by three major transport systems: (i) mitochondrial Ca<sup>2+</sup> uniporter (MCU), (ii) mitochondrial ryanodine receptor (mRyR), (iii) rapid mode of Ca<sup>2+</sup> uptake (RaM) and one mitochondrial system under debate: (iv) leucine zipper- EF-hand containing transmembrane protein (LETM1). Ca<sup>2+</sup> influx through the MCU is established by the electrochemical gradient created by the electron transport chain (ETC). (3) Ca<sup>2+</sup> efflux through the IMM driven by three other major transport systems: (i) Na<sup>+</sup>/Ca<sup>2+</sup>/Li<sup>+</sup> (NCLX) exchanger, (ii) H<sup>+</sup>/Ca<sup>2+</sup> exchanger (HCX), (iii) mitochondrial permeability transition pore complex (mPTPC) and one mitochondrial system under debate: (iv) leucine zipper- EF-hand containing transmembrane protein (LETM1). (4) The core constituents of mPTPC include: the adenine nucleotide translocase (ANT), matrix cyclophilin D (CypD) and phosphate carrier (PiC), which serve as pore regulators, and the pro-apoptotic proteins Bax and Bak, which can induce mitochondrial swelling and rupture during the mPTP opening. ATP-synthase is the key IMM-pore forming unit of mPTPC.</p>
Full article ">Figure 2
<p>Classification of Bcl-2 of proteins based on their apoptotic activity. (<b>A</b>) anti-apoptotic; (<b>B</b>) pro-apoptotic; and (<b>C</b>) apoptotic mediators of the Bcl-2 family proteins containing one BH-3 domain.</p>
Full article ">Figure 3
<p>Bcl-2 proteins and mitochondrial Ca<sup>2+</sup> transport systems determine the necrotic or apoptotic cell death pathways. mPTP-mediated necrosis and MOMP-mediated apoptosis are initiated by various extracellular and intracellular cell death stimuli. Central events for cell death rely on interactions between “activators” and “sensitizers” BH3-only proteins (these proteins are marked by dark blue). Activators (BID, BIM, PUMA, NOXA) bind and activate Bax and Bak and induce a series of their conformational changes and subsequent oligomerization within the OMM, finally resulting in MOMP. Sensitizers (BAD, BIK, BMF, HRK) bind the pro-survival Bcl-2 proteins (Bcl-2, Bcl-XL, Mcl-1) and release them to activate Bax and Bak. MOMP results in the release of pro-apoptogenic factors, formation of an apoptosome, and activation of the cascade that leads to MOMP-mediated apoptosis (these events are marked by orange). In contrast, the central event for mPTP-mediated necrosis is the Ca<sup>2+</sup>-induced formation of mPTPC in the IMM and its mediation by the Bcl-2 members (Bax, Bak, Bcl-XL, Bcl-2, BID). mPTP opening rapidly dissipates the proton gradient across the IMM and induce mPTP-mediated necrosis (all of these events are marked by green). Thus, a possible functional link between Bcl-2 proteins and Ca<sup>2+</sup>-transport systems and between MOMP-mediated apoptosis and mPTP-mediated necrosis may exist. Intracellular or extracellular cell death stimuli may lead to the other types of RCD that are not directly related to the mediation of Ca<sup>2+</sup> homeostasis by Bcl-2 members (including extrinsic apoptosis, necroptosis, ferroptosis, pyroptosis, parthanatos, entotic cell death, NETotic cell death, LDCD, ADCD, ICD) (these events are marked by light blue).</p>
Full article ">
11 pages, 2062 KiB  
Article
Separation of Fructose and Glucose via Nanofiltration in Presence of Fructooligosaccharides
by Zulhaj Rizki, Anja E. M. Janssen, Albert van der Padt and Remko M. Boom
Membranes 2020, 10(10), 298; https://doi.org/10.3390/membranes10100298 - 21 Oct 2020
Cited by 4 | Viewed by 3831
Abstract
Fructose and glucose are commonly present together in mixtures and may need to be separated. Current separation methods for these isomers are complex and costly. Nanofiltration is a cost-effective method that has been widely used for separating carbohydrates of different sizes; however, it [...] Read more.
Fructose and glucose are commonly present together in mixtures and may need to be separated. Current separation methods for these isomers are complex and costly. Nanofiltration is a cost-effective method that has been widely used for separating carbohydrates of different sizes; however, it is not commonly used for such similar molecules. Here, we report the separation of fructose and glucose in a nanofiltration system in the presence of fructooligosaccharides (FOS). Experiments were performed using a pilot-scale filtration setup using a spiral wound nanofiltration membrane with molecular weight cutoff of 1 kDa. We observed three important factors that affected the separation: (1) separation of monosaccharides only occurred in the presence of FOS and became more effective when FOS dominated the solution; (2) better separation was achieved when the monosaccharides were mainly fructose; and (3) the presence of salt improved the separation only moderately. The rejection ratio (Rf/Rg) in a fructose/glucose mixture is 0.92. We reported a rejection ratio of 0.69, which was observed in a mixture of 50 g/L FOS with a fructose to glucose ratio of 4.43. The separation is hypothesized to occur due to selective transport in the FOS layer, resulting in a preferential binding towards fructose. Full article
(This article belongs to the Section Membrane Applications)
Show Figures

Graphical abstract

Graphical abstract
Full article ">Figure 1
<p>Rejection ratio of fructose over glucose (R<sub>f</sub>/R<sub>g</sub>) from various references [<a href="#B13-membranes-10-00298" class="html-bibr">13</a>,<a href="#B15-membranes-10-00298" class="html-bibr">15</a>,<a href="#B17-membranes-10-00298" class="html-bibr">17</a>,<a href="#B18-membranes-10-00298" class="html-bibr">18</a>,<a href="#B21-membranes-10-00298" class="html-bibr">21</a>] under different setups and feeds.</p>
Full article ">Figure 2
<p>Effect of oligosaccharides concentration on selectivity in a nanofiltration system. The dotted line is the reference rejection ratio for a mixture with only fructose and glucose. The dot-dashed line is the reference rejection ratio for the FOS mixture. The dashed line is shown to guide the eye. The 95% confidence interval for concentration ratio and the rejections are shown inside the brackets.</p>
Full article ">Figure 3
<p>Effect of the monosaccharide composition on selectivity in a nanofiltration system. The total oligosaccharide concentration was 35 g/L, and the total monosaccharide concentration was 16 g/L. The dotted line is the reference rejection ratio for a mixture with only fructose and glucose. The dot-dashed line is the reference rejection ratio for the FOS mixture. The dashed line is shown to guide the eye. The 95% confidence interval for concentration ratio and the rejections are shown inside the brackets.</p>
Full article ">Figure 4
<p>The rejection ratio of fructose and glucose in a nanofiltration system with only monosaccharides. The total monosaccharide concentration was 16 g/L. The dotted line is the reference rejection ratio for a mixture with only fructose and glucose. The dot-dashed line is the reference rejection ratio for FOS mixture. The dashed line is shown to guide the eye. The 95% confidence interval for concentration ratio and the rejections are shown inside the brackets.</p>
Full article ">Figure 5
<p>Effect of addition of salt on the separation of fructose and glucose in nanofiltration with only monosaccharides. The total monosaccharide concentration was 16 g/L. The dashed lines are shown to guide the eye.</p>
Full article ">Figure 6
<p>Effects of the addition of salt on the separation of fructose and glucose in the FOS system. The oligosaccharide concentration was 35 g/L, and the monosaccharide concentration was 16 g/L.</p>
Full article ">
29 pages, 5168 KiB  
Review
Nanocomposite Membranes for Liquid and Gas Separations from the Perspective of Nanostructure Dimensions
by Pei Sean Goh, Kar Chun Wong and Ahmad Fauzi Ismail
Membranes 2020, 10(10), 297; https://doi.org/10.3390/membranes10100297 - 21 Oct 2020
Cited by 29 | Viewed by 6690
Abstract
One of the critical aspects in the design of nanocomposite membrane is the selection of a well-matched pair of nanomaterials and a polymer matrix that suits their intended application. By making use of the fascinating flexibility of nanoscale materials, the functionalities of the [...] Read more.
One of the critical aspects in the design of nanocomposite membrane is the selection of a well-matched pair of nanomaterials and a polymer matrix that suits their intended application. By making use of the fascinating flexibility of nanoscale materials, the functionalities of the resultant nanocomposite membranes can be tailored. The unique features demonstrated by nanomaterials are closely related to their dimensions, hence a greater attention is deserved for this critical aspect. Recognizing the impressive research efforts devoted to fine-tuning the nanocomposite membranes for a broad range of applications including gas and liquid separation, this review intends to discuss the selection criteria of nanostructured materials from the perspective of their dimensions for the production of high-performing nanocomposite membranes. Based on their dimension classifications, an overview of the characteristics of nanomaterials used for the development of nanocomposite membranes is presented. The advantages and roles of these nanomaterials in advancing the performance of the resultant nanocomposite membranes for gas and liquid separation are reviewed. By highlighting the importance of dimensions of nanomaterials that account for their intriguing structural and physical properties, the potential of these nanomaterials in the development of nanocomposite membranes can be fully harnessed. Full article
(This article belongs to the Special Issue Advances in Nanocomposite Membranes)
Show Figures

Graphical abstract

Graphical abstract
Full article ">Figure 1
<p>Representative illustrations of dimensionally different nanomaterials applied for gas separation and liquid separation nanocomposite membrane.</p>
Full article ">Figure 2
<p>Transmission electron microscope (TEM) images of (<b>a</b>) 0D platinum loaded N-doped mesoporous carbon nanosphere [<a href="#B34-membranes-10-00297" class="html-bibr">34</a>], (<b>b</b>) 1D iron oxide nanoparticle filled carbon nanotube [<a href="#B35-membranes-10-00297" class="html-bibr">35</a>], (<b>c</b>) 2D metal organic framework nanosheet [<a href="#B36-membranes-10-00297" class="html-bibr">36</a>] and (<b>d</b>) 3D platinum loaded in between a MIL-101(Cr) core and MIL-101(Fe) shell [<a href="#B37-membranes-10-00297" class="html-bibr">37</a>].</p>
Full article ">Figure 3
<p>(<b>a</b>) H<sub>2</sub> permeabilities versus H<sub>2</sub>/CO<sub>2</sub> selectivities mixed matrix membranes (MMMs) containing 20 wt% of MOFs of different dimensions benchmarked with neat polybenzimidazoles (PBI) membrane (NS: nanosheet; NC: nanocube; BC: bulk crystal) [<a href="#B121-membranes-10-00297" class="html-bibr">121</a>], (<b>b</b>) CO<sub>2</sub>/CH<sub>4</sub> separation performance of MMM incorporated with MUF-15 crystal bulk and nanosheets [<a href="#B122-membranes-10-00297" class="html-bibr">122</a>], (<b>c</b>) Segmented (focused ion beam- scanning electrone microscope (FIB–SEM) tomograms of polyimide-based MMM containing bulk-type and nanosheet CuBDC MOF [<a href="#B123-membranes-10-00297" class="html-bibr">123</a>], (<b>d</b>) Schematic illustration of the interlayer functionalization of MXene to tune from a H<sub>2</sub>-selective to CO<sub>2</sub>-selective membrane [<a href="#B124-membranes-10-00297" class="html-bibr">124</a>].</p>
Full article ">Figure 3 Cont.
<p>(<b>a</b>) H<sub>2</sub> permeabilities versus H<sub>2</sub>/CO<sub>2</sub> selectivities mixed matrix membranes (MMMs) containing 20 wt% of MOFs of different dimensions benchmarked with neat polybenzimidazoles (PBI) membrane (NS: nanosheet; NC: nanocube; BC: bulk crystal) [<a href="#B121-membranes-10-00297" class="html-bibr">121</a>], (<b>b</b>) CO<sub>2</sub>/CH<sub>4</sub> separation performance of MMM incorporated with MUF-15 crystal bulk and nanosheets [<a href="#B122-membranes-10-00297" class="html-bibr">122</a>], (<b>c</b>) Segmented (focused ion beam- scanning electrone microscope (FIB–SEM) tomograms of polyimide-based MMM containing bulk-type and nanosheet CuBDC MOF [<a href="#B123-membranes-10-00297" class="html-bibr">123</a>], (<b>d</b>) Schematic illustration of the interlayer functionalization of MXene to tune from a H<sub>2</sub>-selective to CO<sub>2</sub>-selective membrane [<a href="#B124-membranes-10-00297" class="html-bibr">124</a>].</p>
Full article ">Figure 4
<p>(<b>a</b>) Schematic illustration of solvent molecule transport pathway in small-flake graphene oxide (GO) and large-flake GO with different lateral [<a href="#B133-membranes-10-00297" class="html-bibr">133</a>], cross-sectional images of polyethersulfone (PES) support layers templated with (<b>b</b>) ZnO nanoparticles and (<b>c</b>) ZnO nanorods [<a href="#B134-membranes-10-00297" class="html-bibr">134</a>].</p>
Full article ">Figure 5
<p>Optical images of (<b>a</b>) carbon nanotube (CNT) and (<b>b</b>) CNT/GO dual nanofiller dispersed in aqueous-based solution. (<b>c</b>) nanocomposite membranes incorporated with SNF/GO<sub>x</sub> exhibited drastically improved Na<sub>2</sub>SO<sub>4</sub> rejection and flux for the SNF, GO, and membranes [<a href="#B156-membranes-10-00297" class="html-bibr">156</a>] (<b>d</b>) conceptual illustration of water transport path and nanocapillary network jointly created by porous reduced graphene oxide/halloysite nanotubes (PRGO/HNTs) (RB: Reactive Black) [<a href="#B157-membranes-10-00297" class="html-bibr">157</a>] (<b>e</b>) Schematic illustration of cross section and (<b>f</b>) surface image of TFN membrane incorporated with g-C<sub>3</sub>N<sub>4</sub>/HNT. The left part with the PA scraped off revealed the orientation of HNT [<a href="#B158-membranes-10-00297" class="html-bibr">158</a>], (<b>g</b>) Schematic illustration of NH<sub>2</sub>-Fe<sub>2</sub>O<sub>3</sub> intercalated GO nanosheets [<a href="#B159-membranes-10-00297" class="html-bibr">159</a>].</p>
Full article ">Figure 6
<p>(<b>a</b>) Schematic illustration of gas transport pathway across membrane with different thickness [<a href="#B184-membranes-10-00297" class="html-bibr">184</a>] (<b>b</b>) Cross-sectional image of GO nanosheets aligned at parallel direction with membrane surface [<a href="#B184-membranes-10-00297" class="html-bibr">184</a>] (<b>c</b>) Cross-sectional images of nanocomposite membranes showing the protrusion of the tubes [<a href="#B185-membranes-10-00297" class="html-bibr">185</a>]. (<b>d</b>) Schematic illustration of nanomaterials with different aspect ratio (α) (i) coffee-ring effect observed in isotropic nanostructures, (ii) uniform distribution of ellipsoid nanostructures (iii) orientation of nanotubular nanostructure, (iv) evaporation deposition of nanomaterials on a substrate [<a href="#B186-membranes-10-00297" class="html-bibr">186</a>]. (<b>e</b>) Surface image of oriented HNT [<a href="#B186-membranes-10-00297" class="html-bibr">186</a>].</p>
Full article ">
15 pages, 20725 KiB  
Article
Amino Acid Cross-Linked Graphene Oxide Membranes for Metal Ions Permeation, Insertion and Antibacterial Properties
by Lijuan Qian, Haijing Wang, Jingyi Yang, Xiaolei Chen, Xue Chang, Yu Nan, Zhuanyan He, Peizhuo Hu, Wangsuo Wu and Tonghuan Liu
Membranes 2020, 10(10), 296; https://doi.org/10.3390/membranes10100296 - 21 Oct 2020
Cited by 12 | Viewed by 2936
Abstract
Graphene oxide (GO) and its composite membranes have exhibited great potential for application in water purification and desalination. This article reports that a novel graphene oxide membrane (GOM) of ~5 µm thickness was fabricated onto a nylon membrane by vacuum filtration and cross-linked [...] Read more.
Graphene oxide (GO) and its composite membranes have exhibited great potential for application in water purification and desalination. This article reports that a novel graphene oxide membrane (GOM) of ~5 µm thickness was fabricated onto a nylon membrane by vacuum filtration and cross-linked by amino acids (L-alanine, L-phenylalanine, and serine). The GOM cross-linked by amino acids (GOM-A) exhibits excellent stability, high water flux, and high rejection to metal ions. The rejection coefficients to alkali and alkaline earth metal ions through GOM-A were over 94% and 96%, respectively. The rejection coefficients decreased with an increasing H+ concentration. Metal ions (K+, Ca2+, and Fe3+) can be inserted into GOM-A layers, which enlarges the interlayer spacing of GOM-A and neutralizes the electronegativity of the membrane, resulting in the decease in the rejection coefficients to metal ions. Meanwhile, GOM-A showed quite high antibacterial efficiency against E. coli. With the excellent performance as described above, GOM-A could be used to purify and desalt water. Full article
(This article belongs to the Special Issue Membranes: 10th Anniversary)
Show Figures

Graphical abstract

Graphical abstract
Full article ">Figure 1
<p>The Scanning electron microscopy (SEM) images of surface graphene oxide membrane (GOM) (<b>a</b>), graphene oxide (GO)-L-alanine (Ala) (<b>c</b>), GO-serine (Ser) (<b>e</b>), GO- L-phenylalanine (PHE) (<b>g</b>) and cross-section of GOM (<b>b</b>), GO-Ala (<b>d</b>), GO-Ser (<b>f</b>), GO-PHE (<b>h</b>).</p>
Full article ">Figure 2
<p>(<b>a</b>) FT-IR spectra of GO, GO-Ala, GO-Ser, GO-PHE, and (<b>b</b>) X-ray diffraction (XRD) spectra of GO, rGO, GO-Ala, GO-PHE, GO-Ser.</p>
Full article ">Figure 3
<p>X-ray photoelectron spectroscopy (XPS) C1s spectra of GOM (<b>a</b>), GO-Ala (<b>b</b>), GO-Ser (<b>c</b>), and GO-PHE (<b>d</b>).</p>
Full article ">Figure 4
<p>XPS N1s spectra of GO-Ala, GO-PHE, and GO-Ser.</p>
Full article ">Figure 5
<p>The Atomic force microscopy (AFM) images of surface GOM (<b>a</b>), GO-Ala (<b>b</b>), GO-Ser (<b>c</b>), and GO-PHE (<b>d</b>).</p>
Full article ">Figure 6
<p>Microstructure model of GOM cross-linked with amino acids.</p>
Full article ">Figure 7
<p>Rejection coefficient of GO-Ala, GO-PHE, and GO-Ser to alkali metal ion (<b>a</b>,<b>b</b>) and effect of the acidity on to alkali metal ion permeation through GO-PHE (<b>c</b>). [M] = 0.05 mol/L (<b>a</b>–<b>c</b>), [HNO<sub>3</sub>] = 1.0 mol/L (<b>a</b>,<b>b</b>).</p>
Full article ">Figure 7 Cont.
<p>Rejection coefficient of GO-Ala, GO-PHE, and GO-Ser to alkali metal ion (<b>a</b>,<b>b</b>) and effect of the acidity on to alkali metal ion permeation through GO-PHE (<b>c</b>). [M] = 0.05 mol/L (<b>a</b>–<b>c</b>), [HNO<sub>3</sub>] = 1.0 mol/L (<b>a</b>,<b>b</b>).</p>
Full article ">Figure 8
<p>(<b>a</b>) XRD spectra of GO-PHE, GO-PHE-K, GO-PHE-Ca and GO-PHE-Fe. (<b>b</b>) Rejection coefficient of Na<sup>+</sup> through GO-PHE, GO-PHE-K, GO-PHE-Ca and GO-PHE-Fe. [NaNO<sub>3</sub>] = 0.05 mol/L, [HNO<sub>3</sub>] = 1.0 mol/L. GO-PHE-K, GO-PHE-Ca, and GO-PHE-Fe was GO-PHE membranes adsorbing KNO<sub>3</sub>, Ca(NO<sub>3</sub>)<sub>2</sub>, Fe(NO<sub>3</sub>)<sub>3</sub>, respectively.</p>
Full article ">Figure 9
<p>Antibacterial activity of GOMs against <span class="html-italic">E. coli.</span></p>
Full article ">
39 pages, 6018 KiB  
Review
2D Nanocomposite Membranes: Water Purification and Fouling Mitigation
by Lara Loske, Keizo Nakagawa, Tomohisa Yoshioka and Hideto Matsuyama
Membranes 2020, 10(10), 295; https://doi.org/10.3390/membranes10100295 - 20 Oct 2020
Cited by 19 | Viewed by 5056
Abstract
In this study, the characteristics of different types of nanosheet membranes were reviewed in order to determine which possessed the optimum propensity for antifouling during water purification. Despite the tremendous amount of attention that nanosheets have received in recent years, their use to [...] Read more.
In this study, the characteristics of different types of nanosheet membranes were reviewed in order to determine which possessed the optimum propensity for antifouling during water purification. Despite the tremendous amount of attention that nanosheets have received in recent years, their use to render membranes that are resistant to fouling has seldom been investigated. This work is the first to summarize the abilities of nanosheet membranes to alleviate the effect of organic and inorganic foulants during water treatment. In contrast to other publications, single nanosheets, or in combination with other nanomaterials, were considered to be nanostructures. Herein, a broad range of materials beyond graphene-based nanomaterials is discussed. The types of nanohybrid membranes considered in the present work include conventional mixed matrix membranes, stacked membranes, and thin-film nanocomposite membranes. These membranes combine the benefits of both inorganic and organic materials, and their respective drawbacks are addressed herein. The antifouling strategies of nanohybrid membranes were divided into passive and active categories. Nanosheets were employed in order to induce fouling resistance via increased hydrophilicity and photocatalysis. The antifouling properties that are displayed by two-dimensional (2D) nanocomposite membranes also are examined. Full article
Show Figures

Graphical abstract

Graphical abstract
Full article ">Figure 1
<p>Increasing interest in antifouling two-dimensional (2D) nanocomposite membranes; results were obtained from the “Web of Science”.</p>
Full article ">Figure 2
<p>Molecular structures of different 2D nanomaterials. (<b>a</b>) GO and rGO nanosheets. Reproduced with permission from [<a href="#B47-membranes-10-00295" class="html-bibr">47</a>], published by MDPI AG. License CC-BY. (<b>b</b>) Layered structure of HNb<sub>3</sub>O<sub>8</sub> with alternating sheets of interconnected NbO<sub>6</sub> and protons. Reprinted with permission from [<a href="#B48-membranes-10-00295" class="html-bibr">48</a>]. Copyright 2017 American Chemical Society. (<b>c</b>) The 3 major MAX Phases and their respective MXene nanosheets. Copyright (2013) Wiley. Used with permission from [<a href="#B49-membranes-10-00295" class="html-bibr">49</a>]. (<b>d</b>) MoS<sub>2</sub> nanosheet top view and side view of nanosheet single as well as double layers. Adapted with permission from [<a href="#B50-membranes-10-00295" class="html-bibr">50</a>], published by Springer Nature. License CC-BY. (<b>e</b>) From left to right, Liebig’s melon, fully condensed triazine C<sub>3</sub>N<sub>4</sub>, and predicted structure, which is fully condensed polyheptazine (tri-s-triazine) C<sub>3</sub>N<sub>4</sub>. Adapted from [<a href="#B51-membranes-10-00295" class="html-bibr">51</a>] with permission of the PCCP Owner Societies. License CC-BY. (<b>f</b>) Cross-sectional view from phosphorene nanosheets on the left and top, and side views on the right bottom. Adapted with permission from [<a href="#B52-membranes-10-00295" class="html-bibr">52</a>]. Copyright (2014) American Chemical Society.</p>
Full article ">Figure 3
<p>The types of nanosheet membranes that demonstrate improved membrane performance in terms of fouling mitigation. Other types of nanosheet membranes have the nanosheets dispersed in the support layer of a Thin Film Composite (TFC) membrane, or consist of a porous monolayer nanosheet. The illustration depicts as ideal porous polymer substrate with a cross-sectional view. Blue rectangles represent nanosheets that are either immersed in the grey polymer support and the orange PA layer, or stacked on top of the polymer and the PA.</p>
Full article ">Figure 4
<p>Stacking structure of laminar membranes that reject pollutants and yet allow water to pass, illustrated as red and blue circles, respectively. The water pathways are indicated by blue arrows. (<b>a</b>) Corrugated GO membrane with functional groups highlighted in green and located at the nanosheet (grey) edges and on the surface. (<b>b</b>) Transition Metal Dichalcogenides (TMD) membrane with functional groups highlighted in green are located at the nanosheet (yellowish) edges and in the rigid nanostructure. (<b>c</b>) Niobate membranes with small interlayer spacing and vertical separation due to pore formation.</p>
Full article ">Figure 5
<p>(<b>a</b>) The exfoliation process of boron nitride nanosheets from their bulk counterparts. Reprinted from [<a href="#B29-membranes-10-00295" class="html-bibr">29</a>], Copyright (2018), with permission from Elsevier. (<b>b</b>) Fabrication steps of Ti<sub>3</sub>C<sub>2</sub>T<sub><span class="html-italic">x</span></sub> Thin Film Nanocomposite (TFN) membranes via interfacial polymerization of m-phenylenediamine (MPD) and trimesoyl chloride (TMC) on a PSf support. Reprinted from [<a href="#B30-membranes-10-00295" class="html-bibr">30</a>], Copyright (2020), with permission from Elsevier.</p>
Full article ">Figure 6
<p>The passive and active antifouling strategies for non-migratory, spreadable, proliferative and inorganic foulants. Reprinted from [<a href="#B133-membranes-10-00295" class="html-bibr">133</a>], Copyright (2018) with permission from Elsevier.</p>
Full article ">Figure 7
<p>The photocatalytic effect of a catalyst upon light irradiation, including the formation of reactive oxygen species (ROS) and final products. Reproduced from [<a href="#B166-membranes-10-00295" class="html-bibr">166</a>] with permission from The Royal Society of Chemistry, Copyright (2016).</p>
Full article ">Figure 8
<p>(<b>a</b>) Fouled membrane surfaces after testing: unmodified PPA membrane fouled by BSA (top); and, improved BSA fouling resistance of BN-modified PPA (bottom). Adapted from [<a href="#B203-membranes-10-00295" class="html-bibr">203</a>], Copyright (2019), with permission from Elsevier. (<b>b</b>–<b>d</b>) Illustration of a flat sheet nanosheet membrane separating dye molecules based on the sieving effect. The coloration of the flat sheet stacked rGO/TiO<sub>2</sub> membrane, before testing, after dye aggregation, after washing under dark conditions, and almost complete recovery after photocatalytic cleaning. Rejection was maintained with operation cycles whereas permeance slightly decreased. Adapted from [<a href="#B207-membranes-10-00295" class="html-bibr">207</a>], Copyright (2020), with permission from Elsevier.</p>
Full article ">Figure 9
<p>(<b>a</b>) Different structures of the cationic clay montmorillonite (MMT), and anionic clay LDH. (<b>b</b>)Normalized water flux during membrane testing showing different results based on pristine and modified membranes. Reprinted from [<a href="#B200-membranes-10-00295" class="html-bibr">200</a>], Copyright (2015), with permission from Elsevier.</p>
Full article ">Figure 10
<p>(<b>a</b>) Fabrication of an electrospun core-shell nanofiber. Reproduced with permission from [<a href="#B228-membranes-10-00295" class="html-bibr">228</a>], published by MDPI AG. License CC-BY. (<b>b</b>) Changes of the oil contact angle from before membrane testing, to after testing and after photocatalytic cleaning. From left to right, the changing OCA for GO/gCN(H)@TiO<sub>2</sub> and GO. Copyright (2018) Wiley. Adapted and used with permission from [<a href="#B155-membranes-10-00295" class="html-bibr">155</a>].</p>
Full article ">Figure 11
<p>The fabrication process of photocatalytic gCN(H) membranes. Reprinted from [<a href="#B224-membranes-10-00295" class="html-bibr">224</a>], Copyright (2019), with permission from Elsevier.</p>
Full article ">Figure 12
<p>(<b>a</b>) I mproved biofouling and scaling propensity, but reduced flux recovery of GO@PA membranes. Reprinted from [<a href="#B233-membranes-10-00295" class="html-bibr">233</a>], Copyright (2018) with permission from Elsevier. (<b>b</b>,<b>c</b>) Scale layer on the PA RO membrane and the characteristic needle-like crystals shown in the top two pictures. The bottom pictures demonstrate the successful antiscaling PAA-GO functionalized membrane: normalized flux, membrane surface, and illustrated membrane surface modification. Adapted from [<a href="#B234-membranes-10-00295" class="html-bibr">234</a>], Copyright (2020) with permission from Elsevier. License CC-BY.</p>
Full article ">
15 pages, 8366 KiB  
Article
Study of the Interaction of a Novel Semi-Synthetic Peptide with Model Lipid Membranes
by Lucia Sessa, Simona Concilio, Peter Walde, Tom Robinson, Petra S. Dittrich, Amalia Porta, Barbara Panunzi, Ugo Caruso and Stefano Piotto
Membranes 2020, 10(10), 294; https://doi.org/10.3390/membranes10100294 - 19 Oct 2020
Cited by 9 | Viewed by 3257
Abstract
Most linear peptides directly interact with membranes, but the mechanisms of interaction are far from being completely understood. Here, we present an investigation of the membrane interactions of a designed peptide containing a non-natural, synthetic amino acid. We selected a nonapeptide that is [...] Read more.
Most linear peptides directly interact with membranes, but the mechanisms of interaction are far from being completely understood. Here, we present an investigation of the membrane interactions of a designed peptide containing a non-natural, synthetic amino acid. We selected a nonapeptide that is reported to interact with phospholipid membranes, ALYLAIRKR, abbreviated as ALY. We designed a modified peptide (azoALY) by substituting the tyrosine residue of ALY with an antimicrobial azobenzene-bearing amino acid. Both of the peptides were examined for their ability to interact with model membranes, assessing the penetration of phospholipid monolayers, and leakage across the bilayer of large unilamellar vesicles (LUVs) and giant unilamellar vesicles (GUVs). The latter was performed in a microfluidic device in order to study the kinetics of leakage of entrapped calcein from the vesicles at the single vesicle level. Both types of vesicles were prepared from a 9:1 (mol/mol) mixture of POPC (1-palmitoyl-2-oleoyl-sn-glycero-3-phosphocholine) and POPG (1-palmitoyl-2-oleoyl-sn-glycero-3-phospho(1′-rac-glycerol). Calcein leakage from the vesicles was more pronounced at a low concentration in the case of azoALY than for ALY. Increased vesicle membrane disturbance in the presence of azoALY was also evident from an enzymatic assay with LUVs and entrapped horseradish peroxidase. Molecular dynamics simulations of ALY and azoALY in an anionic POPC/POPG model bilayer showed that ALY peptide only interacts with the lipid head groups. In contrast, azoALY penetrates the hydrophobic core of the bilayers causing a stronger membrane perturbation as compared to ALY, in qualitative agreement with the experimental results from the leakage assays. Full article
(This article belongs to the Special Issue Modeling and Simulation of Lipid Membranes)
Show Figures

Graphical abstract

Graphical abstract
Full article ">Figure 1
<p>Density profile of the system ALY-POPC/POPG (9:1) after 45 ns of molecular dynamic (MD) simulation. Cyan line: water molecules; blue line: phosphorous atoms; dashed blue line: nitrogen atoms; dashed black line: carbon chains of the phospholipid, black line: terminal carbons of the phospholipid; red line ALY peptide.</p>
Full article ">Figure 2
<p>Density profile of the system azoALY-POPC/POPG (9:1) after 45 ns of MD simulation. Cyan line: water molecules; blue line: phosphorous atoms; dashed blue line: nitrogen atoms; dashed black line: carbon chains of the phospholipid, black line: terminal carbons of the phospholipid; red line azoALY peptide.</p>
Full article ">Figure 3
<p>Thickness maps of POPC/POPG/ALY (<b>a</b>) and POPC/POPG/azoALY (<b>b</b>) during the last 5 ns of the MD simulation (total time 50 ns). The top panel is the deformation profile as a color map projected onto the surface defined by fitting a grid (spacing 2 Å) to the positions of the phosphate atoms in the top leaflet during the trajectory, followed by time averaging and spatial smoothing.</p>
Full article ">Figure 4
<p>Confocal fluorescence images of calcein leakage from an exemplary POPC/POPG (9:1) GUV with azoALY added externally (50 μM at time 0 min. A single GUV was held in one spatial location using a microfluidic platform; for details, see reference [<a href="#B39-membranes-10-00294" class="html-bibr">39</a>]. Scale bar: 5 μm.</p>
Full article ">Figure 5
<p>Kinetics of calcein release from POPC/POPG (9:1) GUVs for externally added ALY or azoALY (1 and 50 μM) using 3 separate vesicles. Control measurements without the addition of peptide showed no calcein release (data not shown).</p>
Full article ">Figure 6
<p>Horseradish peroxidase isoenzyme C enzyme (HRPC) enzyme leakage from large unilamellar vesicles (LUVs), measured with H<sub>2</sub>O<sub>2</sub> and ABTS<sup>2−</sup>, the latter being membrane impermeable.</p>
Full article ">Figure 7
<p>Enzymatic activity time dependence in four different systems: (grey bar) Blank vesicles with HRPC entrapped without peptides (dilution factor 100×); (green bar) control vesicles with HRPC entrapped, adding Triton X-100 (dilution factor 2000×); (yellow bar) vesicles with HRPC entrapped, adding a solution of ALY at 4 μM (dilution factor 100×); and (blue bar) vesicles with HRPC entrapped, adding a solution of azoALY at 4 μM (dilution factor 100×). Each data point shown is the average from three measurements and the small standard deviation is indicated with a bar.</p>
Full article ">Scheme 1
<p>Synthetic path of amino acid azoTyr.</p>
Full article ">
17 pages, 7073 KiB  
Article
Enhanced Fouling Resistance and Antimicrobial Property of Ultrafiltration Membranes Via Polyelectrolyte-Assisted Silver Phosphate Nanoparticle Immobilization
by Kunal Olimattel, Jared Church, Woo Hyoung Lee, Karin Y. Chumbimuni-Torres, Lei Zhai and A H M Anwar Sadmani
Membranes 2020, 10(10), 293; https://doi.org/10.3390/membranes10100293 - 17 Oct 2020
Cited by 12 | Viewed by 3782
Abstract
Ultrafiltration (UF) is a low-pressure membrane that yields higher permeate flux and saves significant operating costs compared to high-pressure membranes; however, studies addressing the combined improvement of anti-organic and biofouling properties of UF membranes are lacking. This study investigated the fouling resistance and [...] Read more.
Ultrafiltration (UF) is a low-pressure membrane that yields higher permeate flux and saves significant operating costs compared to high-pressure membranes; however, studies addressing the combined improvement of anti-organic and biofouling properties of UF membranes are lacking. This study investigated the fouling resistance and antimicrobial property of a UF membrane via silver phosphate nanoparticle (AgPNP) embedded polyelectrolyte (PE) functionalization. Negatively charged polyacrylic acid (PAA) and positively charged polyallylamine hydrochloride (PAH) were deposited on the membrane using a fluidic layer-by-layer assembly technique. AgPNPs were immobilized within the crosslinked “bilayers” (BL) of PAH/PAA. The effectiveness of AgPNP immobilization was confirmed by microprofile measurements on membrane surfaces using a solid contact Ag micro-ion-selective electrode. Upon stable and uniform BL formation on the membrane surface, the permeate flux was governed by a combined effect of PAH/PAA-derived hydrophilicity and surface/pore coverage by the BLs “tightening” of the membrane. When fouled by a model organic foulant (humic acid), the functionalized membrane exhibited a lower flux decline and a greater flux recovery due to the electrostatic repulsion imparted by PAA when compared to the unmodified membrane. The functionalization rendered antimicrobial property, as indicated by fewer attachments of bacteria that initiate the formation of biofilms leading to biofouling. Full article
(This article belongs to the Section Polymeric Membranes)
Show Figures

Graphical abstract

Graphical abstract
Full article ">Figure 1
<p>Schematic of the ultrafiltration (UF) membrane functionalization process sequence: (<b>a</b>) bilayer coating of virgin UF membrane with polyallylamine hydrochloride (PAH) and polyacrylic acid (PAA); (<b>b</b>) crosslinking of bilayers using 0.5% 1-ethyl-3-(3-dimethylamionopropyl) carbodiimide (EDAC); (<b>c</b>) Ag<sup>+</sup> loading within the bilayers by soaking in 5 mM AgC<sub>2</sub>H<sub>3</sub>O<sub>2</sub> solution; (<b>d</b>) formation of stable silver phosphate nanoparticle (AgPNPs) by soaking in 0.2 M Na<sub>2</sub>HPO<sub>4</sub> solution.</p>
Full article ">Figure 2
<p>Silver (Ag) microprofile measurement setup (inset: closeup of Ag<sup>+</sup> micro-ion-selective electrode (micro-ISE)).</p>
Full article ">Figure 3
<p>Schematic of bench-scale cross-flow membrane filtration setup.</p>
Full article ">Figure 4
<p>SEM images of a virgin membrane surface (<b>a</b>) and cross-section (<b>b</b>); 5 PAH/PAA BL-assisted AgPNP-immobilized UF membrane surface (<b>c</b>) and cross-section (<b>d</b>).</p>
Full article ">Figure 5
<p>EDS spectra of 5 AgPNP-BL UF membrane surface.</p>
Full article ">Figure 6
<p>AFM surface profile of a virgin (<b>a</b>) and a modified (5 BLs) (<b>b</b>) UF membrane.</p>
Full article ">Figure 7
<p>(<b>a</b>) Contact angles of virgin membrane (0 BL) and modified membranes as a function of the number of PAH/PAA BLs deposited (error bars represent standard deviation of 5 measurements); (<b>b</b>) Zeta potential of virgin and 5 AgPNP-BL membrane surfaces as a function of pH.</p>
Full article ">Figure 8
<p>Microprofiling of Ag<sup>+</sup> on and near functionalized UF membrane surfaces using Ag<sup>+</sup> micro-ISE.</p>
Full article ">Figure 9
<p>Effect of the number of PAH/PAA bilayers deposited on membrane permeate flux.</p>
Full article ">Figure 10
<p>Normalized flux as a function of pressure during different stages of the fouling test.</p>
Full article ">Figure 11
<p>Plate counts (<span class="html-italic">E. coli</span>) on a virgin UF membrane at time (t) = 0 h (<b>a</b>) and at t = 24 h (<b>b</b>); plate counts on 5 AgPNP-BL UF membrane at time = 0 h (<b>c</b>) and at time = 24 h (<b>d</b>).</p>
Full article ">Figure 12
<p>SEM images of membrane surface after 24 h exposure to <span class="html-italic">E. coli</span>: (<b>a</b>) virgin UF and (<b>b</b>) 5 AgPNP-BL UF membrane.</p>
Full article ">Figure 13
<p>Raman spectra of membrane surface after 24 h exposure to <span class="html-italic">E. coli</span> for virgin (<b>a</b>) and 5 AgPNP-BL UF (<b>b</b>) membranes.</p>
Full article ">
15 pages, 4574 KiB  
Article
Graphene Oxide-Based Membranes for Water Purification Applications: Effect of Plasma Treatment on the Adhesion and Stability of the Synthesized Membranes
by Omer Alnoor, Tahar Laoui, Ahmed Ibrahim, Feras Kafiah, Ghaith Nadhreen, Sultan Akhtar and Zafarullah Khan
Membranes 2020, 10(10), 292; https://doi.org/10.3390/membranes10100292 - 17 Oct 2020
Cited by 19 | Viewed by 4516
Abstract
The adhesion enhancement of graphene oxide (GO) and reduced graphene oxide (rGO) layer in the underlying polyethersulfone (PES) microfiltration membrane is a crucial step towards developing a high-performance membrane for water purification applications. In the present study, we modified the surface of a [...] Read more.
The adhesion enhancement of graphene oxide (GO) and reduced graphene oxide (rGO) layer in the underlying polyethersulfone (PES) microfiltration membrane is a crucial step towards developing a high-performance membrane for water purification applications. In the present study, we modified the surface of a PES microfiltration membrane with plasma treatment (PT) carried out at different times (2, 10, and 20 min). We studied the effect of PT on the adhesion, stability, and performance of the synthesized GO/rGO-PES membranes. The membranes’ surface morphology and chemistry were characterized using atomic force microscopy, field emission scanning electron microscopy, and Fourier transform infrared spectroscopy. The membrane performance was evaluated by conducting a diffusion test for potassium chloride (KCl) ions through the synthesized membranes. The results revealed that the 2 min PT enhanced the adhesion and stability of the deposited GO/rGO layer when compared to the other plasma-treated membranes. This was associated with an increase in the KCl ion rejection from ~27% to 57%. Surface morphology analysis at a high magnification was performed for the synthesized membranes before and after the diffusion test. Although the membrane’s rejection was improved, the analysis revealed that the GO layers suffered from micro/nano cracks, which negatively affected the membrane’s overall performance. The use of the rGO layer, however, helped in minimizing the GO cracks and enhanced the KCl ion rejection to approximately 94%. Upon increasing the number of rGO deposition cycles from three to five, the performance of the developed rGO-PES membrane was further improved, as confirmed by the increase in its ion rejection to ~99%. Full article
(This article belongs to the Special Issue Advances in Nanocomposite Membranes)
Show Figures

Figure 1

Figure 1
<p>(<b>a</b>) Schematic diagram showing the GO spin coating and reduction process; (<b>b</b>) photographs of the bare-PES, GO-2min PT-PES, and rGO-2min PT-PES membranes.</p>
Full article ">Figure 2
<p>Morphology and characteristics of the bare and treated PES membrane surfaces obtained at various PT exposure times (2, 10, and 20 min). (<b>a</b>–<b>d</b>) SEM, (<b>e</b>–<b>h</b>) AFM, (<b>i</b>) FTIR-ATR, (<b>j</b>) enlarged view of the collected FTIR-ATR spectra shown in panel (i) for the range 1650 to 2000 cm<sup>−1</sup>. The water contact angle (WCA) measurements are indicated in the insets of panels a–d and the surface roughness (RMS) in the insets of panels e–h.</p>
Full article ">Figure 3
<p>SEM micrographs of the PES membrane surface morphology as a function of the PT exposure time: (<b>a</b>) bare-PES, (<b>b</b>) 2 min PT, (<b>c</b>) 10 min PT, and (<b>d</b>) 20 min PT. Yellow ellipses indicate the agglomeration of the inner structure due to the cross-linking effect taking place during the PT process, (<b>e</b>) diffusion study results of KCl ions through bare and PT-PES membranes.</p>
Full article ">Figure 4
<p>Cross-sectional SEM micrographs of GO-PES membranes using (<b>a</b>,<b>b</b>) one deposition cycle and (<b>c</b>,<b>d</b>) three deposition cycles.</p>
Full article ">Figure 5
<p>Surface morphology and KCl ions diffusion study for the developed GO-based membranes at different PT times. SEM micrographs of (<b>a</b>,<b>e</b>) GO/bare-PES, (<b>b</b>,<b>f</b>) GO/2 min PT-PES, (<b>c</b>,<b>g</b>) GO/10 min PT-PES, (<b>d</b>,<b>h</b>) GO/20 min PT-PES. (<b>i</b>) Diffusion test results of the GO/PT-PES samples and (<b>b</b>) KCl ion rejection percent (%). Yellow arrows in the SEM images indicate the induced cracks in the GO layer due to water evaporation.</p>
Full article ">Figure 6
<p>SEM micrographs of the GO/PT-PES membranes after the KCl ion diffusion study: (<b>a</b>,<b>e</b>,<b>i</b>) GO/bare-PES, (<b>b</b>,<b>f,j</b>) GO/2 min PT-PES, (<b>c</b>,<b>g</b>,<b>k</b>) GO/10 min PT-PES, and (<b>d</b>,<b>h</b>,<b>l</b>) GO/20 min PT-PES. Red arrows in panels (<b>a)</b> and (<b>c</b>) indicate the regions of detached GO flakes.</p>
Full article ">Figure 7
<p>FTIR spectra of GO-2min PT-PES and rGO-2min PT-PES membranes.</p>
Full article ">Figure 8
<p>Diffusion study and surface morphology of the rGO-2min PT-PES membrane: (<b>a</b>) The results of the diffusion study for the 1, 3, and 5 spin-coating deposition cycles (D.C) of rGO on PES-2 min PT; (<b>b</b>) the rate of KCl ion diffusion through the rGO-2min PT-PES membrane for different deposition cycles. Surface morphology of the rGO-2min PT-PES membrane (<b>c</b>) before and (<b>d</b>) after the diffusion test.</p>
Full article ">
15 pages, 3495 KiB  
Article
Flux-Reducing Tendency of Pd-Based Membranes Employed in Butane Dehydrogenation Processes
by Thijs A. Peters, Marit Stange and Rune Bredesen
Membranes 2020, 10(10), 291; https://doi.org/10.3390/membranes10100291 - 16 Oct 2020
Cited by 4 | Viewed by 2567
Abstract
We report on the effect of butane and butylene on hydrogen permeation through thin state-of-the-art Pd–Ag alloy membranes. A wide range of operating conditions, such as temperature (200–450 °C) and H2/butylene (or butane) ratio (0.5–3), on the flux-reducing tendency were investigated. [...] Read more.
We report on the effect of butane and butylene on hydrogen permeation through thin state-of-the-art Pd–Ag alloy membranes. A wide range of operating conditions, such as temperature (200–450 °C) and H2/butylene (or butane) ratio (0.5–3), on the flux-reducing tendency were investigated. In addition, the behavior of membrane performance during prolonged exposure to butylene was evaluated. In the presence of butane, the flux-reducing tendency was found to be limited up to the maximum temperature investigated, 450 °C. Compared to butane, the flux-reducing tendency in the presence of butylene was severe. At 400 °C and 20% butylene, the flux decreases by ~85% after 3 h of exposure but depends on temperature and the H2/butylene ratio. In terms of operating temperature, an optimal performance was found at 250–300 °C with respect to obtaining the highest absolute hydrogen flux in the presence of butylene. At lower temperatures, the competitive adsorption of butylene over hydrogen accounts for a large initial flux penalty. Full article
Show Figures

Graphical abstract

Graphical abstract
Full article ">Figure 1
<p>Hydrogen flux and permeability as a function of temperature for the Pd<sub>77</sub>Ag<sub>23</sub> alloy membrane. Feed: 80% H<sub>2</sub> in N<sub>2</sub>.</p>
Full article ">Figure 2
<p>H<sub>2</sub> flux during butane introduction (20%) and overnight exposure to a feed mixture of H<sub>2</sub>:N<sub>2</sub>:C<sub>4</sub>H<sub>10</sub> = 20:60:20. Temperature = 400 °C.</p>
Full article ">Figure 3
<p>Effect of temperature on the obtained relative H<sub>2</sub> flux during butane exposure applying a feed mixture of H<sub>2</sub>:C<sub>4</sub>H<sub>10</sub>:N<sub>2</sub> = 20:20:60.</p>
Full article ">Figure 4
<p>H<sub>2</sub> flux during butylene exposure (20%) to a feed mixture of H<sub>2</sub>:N<sub>2</sub>:C<sub>4</sub>H<sub>10</sub> = 20:60:20, and subsequent air treatment to regenerate the membrane performance. Temperature = 400 °C.</p>
Full article ">Figure 5
<p>H<sub>2</sub> flux during butylene exposure (40%) to a feed mixture of H<sub>2</sub>:N<sub>2</sub>:C<sub>4</sub>H<sub>10</sub> = 20:40:40, and subsequent air treatments to regenerate the membrane performance. Temperature = 400 °C.</p>
Full article ">Figure 6
<p>Effect of the H<sub>2</sub>/butylene ratio in the membrane feed on the obtained relative H<sub>2</sub> flux after the butylene introduction. Temperature = 400 °C.</p>
Full article ">Figure 7
<p>H<sub>2</sub> flux during continuous recovery after butylene exposure (20%) to a feed mixture of H<sub>2</sub>:N<sub>2</sub>:C<sub>4</sub>H<sub>10</sub> = 20:60:20. Subsequent air treatment to regenerate the membrane performance. Temperature = 350 °C.</p>
Full article ">Figure 8
<p>Effect of temperature on the obtained relative H<sub>2</sub> flux after butylene introduction. The H<sub>2</sub>/butylene ratio is equal to 1.</p>
Full article ">Figure 9
<p>H<sub>2</sub> flux during prolonged exposure to butylene (20%) in a feed containing: H<sub>2</sub>:N<sub>2</sub>:C<sub>4</sub>H<sub>10</sub> = 20:60:20. Subsequent air treatment to regenerate the membrane performance. Temperature = 250 °C.</p>
Full article ">Figure 10
<p>Effect of temperature on the obtained relative H<sub>2</sub> flux during prolonged butylene exposure. H<sub>2</sub>:N<sub>2</sub>:C<sub>4</sub>H<sub>10</sub> = 20:60:20.</p>
Full article ">Figure 11
<p>Membrane module #1; 1600 h operation up to 450 °C and 4 bars.</p>
Full article ">Figure 12
<p>SEM images of the Pd<sub>77</sub>Ag<sub>23</sub> film after testing: (<b>a</b>–<b>c</b>) feed (growth side) and (<b>d</b>–<b>f</b>) permeate (silicon side), at different magnifications.</p>
Full article ">
16 pages, 11661 KiB  
Article
Fabrication of Bentonite–Silica Sand/Suspended Waste Palm Leaf Composite Membrane for Water Purification
by Saad A. Aljlil
Membranes 2020, 10(10), 290; https://doi.org/10.3390/membranes10100290 - 16 Oct 2020
Cited by 7 | Viewed by 2821
Abstract
In this study, a method for fabricating tubular ceramic membranes via extrusion using economical and locally available bentonite–silica sand and waste palm leaves was developed as a tool for conducting the necessary task of purifying water polluted with oil and suspended solid materials [...] Read more.
In this study, a method for fabricating tubular ceramic membranes via extrusion using economical and locally available bentonite–silica sand and waste palm leaves was developed as a tool for conducting the necessary task of purifying water polluted with oil and suspended solid materials produced via various industrial processes. The developed tubular ceramic membranes were found to be highly efficient at separating the pollutants from water. The properties of the fabricated membrane were evaluated via mechanical testing, pore size distribution analysis, and contact angle measurements. The water contact angle of the fabricated membrane was determined to be 55.5°, which indicates that the membrane surface is hydrophilic, and the average pore size was found to be 66 nm. The membrane was found to demonstrate excellent corrosion resistance under acidic as well as basic conditions, with weight losses of less than 1% in each case. The membrane surface was found to be negatively charged and it could strongly repulse the negatively charged fine bentonite particles and oil droplets suspended in the water, thereby enabling facile purification through backwashing. The obtained ceramic membranes with desirable hydrophilic properties can thus serve as good candidates for use in ultrafiltration processes. Full article
(This article belongs to the Section Membrane Applications)
Show Figures

Figure 1

Figure 1
<p>Scanning electron micrograph of treated palm leaves (Magnification = 50,000×).</p>
Full article ">Figure 2
<p>Thermogravimetric of waste leaves.</p>
Full article ">Figure 3
<p>Thermogravimetric of the paste of the ceramic membrane.</p>
Full article ">Figure 4
<p>Flow diagram for fabrication of ceramic membrane.</p>
Full article ">Figure 5
<p>Schematic of experimental filtration.</p>
Full article ">Figure 6
<p>Oil droplet size distribution of artificially produced oil-in-water emulsion.</p>
Full article ">Figure 7
<p>Zeta potential of oil droplets as a function of pH.</p>
Full article ">Figure 8
<p>Zeta potential of fine bentonite clay as a function of pH.</p>
Full article ">Figure 9
<p>Zeta potential of fabricated membrane as a function of pH.</p>
Full article ">Figure 10
<p>Pore size distribution of fabricated membrane.</p>
Full article ">Figure 11
<p>Water flux rate and permeability of fabricated membrane at different pressures.</p>
Full article ">Figure 12
<p>Water/synthetic oil flux rate through membrane and percentage rejection by fabricated membrane at different times.</p>
Full article ">Figure 13
<p>Flux rate of a real oil-contaminated water sample through fabricated membrane and percentage rejection at different times.</p>
Full article ">Figure 14
<p>Water/bentonite clay permeate flux rate through fabricated membrane and percentage rejection of suspended materials.</p>
Full article ">Figure 15
<p>Periodic filtration for oil separation.</p>
Full article ">Figure 16
<p>Periodic filtration for the separation of bentonite powder suspended in water.</p>
Full article ">
19 pages, 4847 KiB  
Article
Enhancing the Antibacterial Properties of PVDF Membrane by Hydrophilic Surface Modification Using Titanium Dioxide and Silver Nanoparticles
by Kajeephan Samree, Pen-umpai Srithai, Panaya Kotchaplai, Pumis Thuptimdang, Pisut Painmanakul, Mali Hunsom and Sermpong Sairiam
Membranes 2020, 10(10), 289; https://doi.org/10.3390/membranes10100289 - 15 Oct 2020
Cited by 42 | Viewed by 4738
Abstract
This work investigates polyvinylidene fluoride (PVDF) membrane modification to enhance its hydrophilicity and antibacterial properties. PVDF membranes were coated with nanoparticles of titanium dioxide (TiO2-NP) and silver (AgNP) at different concentrations and coating times and characterized for their porosity, morphology, chemical [...] Read more.
This work investigates polyvinylidene fluoride (PVDF) membrane modification to enhance its hydrophilicity and antibacterial properties. PVDF membranes were coated with nanoparticles of titanium dioxide (TiO2-NP) and silver (AgNP) at different concentrations and coating times and characterized for their porosity, morphology, chemical functional groups and composition changes. The results showed the successfully modified PVDF membranes containing TiO2-NP and AgNP on their surfaces. When the coating time was increased from 8 to 24 h, the compositions of Ti and Ag of the modified membranes were increased from 1.39 ± 0.13 to 4.29 ± 0.16 and from 1.03 ± 0.07 to 3.62 ± 0.08, respectively. The water contact angle of the membranes was decreased with increasing the coating time and TiO2-NP/AgNP ratio. The surface roughness and permeate fluxes of coated membranes were increased due to increased hydrophilicity. Antimicrobial and antifouling properties were investigated by the reduction of Escherichia coli cells and the inhibition of biofilm formation on the membrane surface, respectively. Compared with that of the original PVDF membrane, the modified membranes exhibited antibacterial efficiency up to 94% against E. coli cells and inhibition up to 65% of the biofilm mass reduction. The findings showed hydrophilic improvement and an antimicrobial property for possible wastewater treatment without facing the eminent problem of biofouling. Full article
(This article belongs to the Special Issue CESE-2019: Applications of Membranes for Sustainability)
Show Figures

Graphical abstract

Graphical abstract
Full article ">Figure 1
<p>Schematic diagram for TiO<sub>2</sub>-NP/AgNP dipped coating of 75 cm<sup>2</sup> of flat sheet PVDF membrane into 1L solution.</p>
Full article ">Figure 2
<p>The water contact angle (WCA) of M1 (original), M2 (8 h), M3 (16 h), M4 (24 h) at mixed 10 ppm TiO<sub>2</sub>-NP/10 ppm AgNP, and M5 (10 ppm TiO<sub>2</sub>-NP/20 ppm AgNP) and M6 (20 ppm TiO<sub>2</sub>-NP/10 ppm AgNP) at coating time of 24 h.</p>
Full article ">Figure 3
<p>Scanning electron microscope (SEM) images of the membranes modified by different coating times: (<b>a</b>) M1 (original); (<b>b</b>) M2 (8 h); (<b>c</b>) M3 (16 h); (<b>d</b>) M4 (24 h) at mixed 10 ppm TiO<sub>2</sub>-NP/10 ppm AgNP; (<b>e</b>) M5 (10 ppm TiO<sub>2</sub>-NP/20 ppm AgNP); and (<b>f</b>) M6 (20 ppm TiO<sub>2</sub>-NP/10 ppm AgNP) at coating time of 24 h (magnification ×5000).</p>
Full article ">Figure 4
<p>Mapping of particle distribution of modified membrane with 10 ppm TiO<sub>2</sub> and 10 ppm AgNP for 24 h (M4): (<b>a</b>) TiO<sub>2</sub>-NP on membrane surface; (<b>b</b>) AgNP on membrane surface; and (<b>c</b>) TiO<sub>2</sub>-NP and AgNP of X-section (magnification ×10,000).</p>
Full article ">Figure 5
<p>Atomic force microscopy (AFM) image topography of membranes: (<b>a</b>) M1 (original); (<b>b</b>) M2 (8 h); (<b>c</b>) M3 (16 h); (<b>d</b>) M4 (24 h) at mixed 10 ppm TiO<sub>2</sub>-NP/10 ppm AgNP; (<b>e</b>) M5 (10 ppm TiO<sub>2</sub>-NP/20 ppm AgNP); and (<b>f</b>) M6 (20 ppm TiO<sub>2</sub>-NP/10 ppm AgNP) at coating time of 24 h.</p>
Full article ">Figure 6
<p>Water fluxes of original PVDF membrane and modified membranes (M1, M2 and M4).</p>
Full article ">Figure 7
<p>Morphology and functional groups of membrane after pure water flux testing: (<b>a</b>) SEM image of M4; and (<b>b</b>) Raman spectra of membrane.</p>
Full article ">Figure 8
<p>Antibacterial properties and biofilm inhibition test of membranes: (<b>a</b>) the number of viable <span class="html-italic">E. coli</span> cells and (<b>b</b>) biofilm formation on membranes.</p>
Full article ">
17 pages, 2864 KiB  
Article
Scaling Risk Assessment in Nanofiltration of Mine Waters
by Krzysztof Mitko, Ewa Laskowska, Marian Turek, Piotr Dydo and Krzysztof Piotrowski
Membranes 2020, 10(10), 288; https://doi.org/10.3390/membranes10100288 - 15 Oct 2020
Cited by 11 | Viewed by 2657
Abstract
Nanofiltration can be applied for the treatment of mine waters. One of the main problems is the risk of crystallization of sparingly soluble salts on the membrane surface (scaling). In this work, a series of batch-mode nanofiltration experiments of the mine waters was [...] Read more.
Nanofiltration can be applied for the treatment of mine waters. One of the main problems is the risk of crystallization of sparingly soluble salts on the membrane surface (scaling). In this work, a series of batch-mode nanofiltration experiments of the mine waters was performed in a dead-end Sterlitech® HP 4750X Stirred Cell. Based on the laboratory results, the concentration profiles of individual ions along the membrane length in a single-pass industrial-scale nanofiltration (NF) unit was calculated, assuming the tanks-in-series flow model inside the membrane module. These calculations also propose a method for estimating the maximum achievable recovery before the occurrence of the calcium sulfate dihydrate scaling in a single-pass NF 40″ length spiral wound module, simultaneously allowing metastable supersaturation of calcium sulfate dihydrate. The performance of three membrane types (NF270, NFX, NFDL) has been evaluated for the nanofiltration of mine water. Full article
(This article belongs to the Special Issue Membranes for Water and Wastewater Treatment)
Show Figures

Graphical abstract

Graphical abstract
Full article ">Figure 1
<p>Scheme of an elementary NF module unit.</p>
Full article ">Figure 2
<p>Saturation vs. position along the membrane for mine water A (0.384 g/L as Cl<sup>−</sup>, 1.02 g/L as SO<sub>4</sub><sup>2−</sup>, 0.107 g/L as Na<sup>+</sup>, 0.142 g/L as Mg<sup>2+</sup>, 0.312 g/L as Ca<sup>2+</sup>) and NF270 nanofiltration membrane.</p>
Full article ">Figure 3
<p>Saturation vs. position along the membrane for mine water B (33.2 g/L as Cl<sup>−</sup>, 0.937 g/L as SO<sub>4</sub><sup>2−</sup>, 19.5 g/L as Na<sup>+</sup>, 0.990 g/L as Mg<sup>2+</sup>, 0.771 g/L as Ca<sup>2+</sup>) and NF270 nanofiltration membrane.</p>
Full article ">Figure 4
<p>Saturation vs. position along the membrane for mine water A (0.384 g/L as Cl<sup>−</sup>, 1.02 g/L as SO<sub>4</sub><sup>2−</sup>, 0.107 g/L as Na<sup>+</sup>, 0.142 g/L as Mg<sup>2+</sup>, 0.312 g/L as Ca<sup>2+</sup>) and NFX nanofiltration membrane.</p>
Full article ">Figure 5
<p>Saturation vs. position along the membrane for mine water B (33.2 g/L as Cl<sup>−</sup>, 0.937 g/L as SO<sub>4</sub><sup>2−</sup>, 19.5 g/L as Na<sup>+</sup>, 0.990 g/L as Mg<sup>2+</sup>, 0.771 g/L as Ca<sup>2+</sup>) and NFX nanofiltration membrane.</p>
Full article ">Figure 6
<p>Saturation vs. position along the membrane for mine water A (0.384 g/L as Cl<sup>−</sup>, 1.02 g/L as SO<sub>4</sub><sup>2−</sup>, 0.107 g/L as Na<sup>+</sup>, 0.142 g/L as Mg<sup>2+</sup>, 0.312 g/L as Ca<sup>2+</sup>) and NFDL nanofiltration membrane.</p>
Full article ">Figure 7
<p>Saturation vs. position along the membrane for mine water B (33.2 g/L as Cl<sup>−</sup>, 0.937 g/L as SO<sub>4</sub><sup>2−</sup>, 19.5 g/L as Na<sup>+</sup>, 0.990 g/L as Mg<sup>2+</sup>, 0.771 g/L as Ca<sup>2+</sup>) and NFDL nanofiltration membrane.</p>
Full article ">Figure A1
<p>Rejection coefficient, R, of SO<sub>4</sub><sup>2−</sup> as a function of permeate recovery, Y, for NFX, NF270 and NFDL nanofiltration membranes and mine waters “A” (0.384 g/L as Cl<sup>−</sup>, 1.02 g/L as SO<sub>4</sub><sup>2−</sup>, 0.107 g/L as Na<sup>+</sup>, 0.142 g/L as Mg<sup>2+</sup>, 0.312 g/L as Ca<sup>2+</sup>) and “B” (33.2 g/L as Cl<sup>−</sup>, 0.937 g/L as SO<sub>4</sub><sup>2−</sup>, 19.5 g/L as Na<sup>+</sup>, 0.990 g/L as Mg<sup>2+</sup>, 0.771 g/L as Ca<sup>2+</sup>).</p>
Full article ">Figure A2
<p>Rejection coefficient, R, of Cl<sup>-</sup> as a function of permeate recovery, Y, for NFX, NF270 and NFDL nanofiltration membranes and mine waters “A” (0.384 g/L as Cl<sup>−</sup>, 1.02 g/L as SO<sub>4</sub><sup>2−</sup>, 0.107 g/L as Na<sup>+</sup>, 0.142 g/L as Mg<sup>2+</sup>, 0.312 g/L as Ca<sup>2+</sup>) and “B” (33.2 g/L as Cl<sup>-</sup>, 0.937 g/L as SO<sub>4</sub><sup>2−</sup>, 19.5 g/L as Na<sup>+</sup>, 0.990 g/L as Mg<sup>2+</sup>, 0.771 g/L as Ca<sup>2+</sup>).</p>
Full article ">Figure A3
<p>Rejection coefficient, R, of Ca<sup>2+</sup> as a function of permeate recovery, Y, for NFX, NF270 and NFDL nanofiltration membranes and mine waters “A” (0.384 g/L as Cl<sup>−</sup>, 1.02 g/L as SO<sub>4</sub><sup>2−</sup>, 0.107 g/L as Na<sup>+</sup>, 0.142 g/L as Mg<sup>2+</sup>, 0.312 g/L as Ca<sup>2+</sup>) and “B” (33.2 g/L as Cl<sup>−</sup>, 0.937 g/L as SO<sub>4</sub><sup>2−</sup>, 19.5 g/L as Na<sup>+</sup>, 0.990 g/L as Mg<sup>2+</sup>, 0.771 g/L as Ca<sup>2+</sup>).</p>
Full article ">Figure A4
<p>Rejection coefficient, R, of Mg<sup>2+-</sup> as a function of permeate recovery, Y, for NFX, NF270 and NFDL nanofiltration membranes and mine waters “A” (0.384 g/L as Cl<sup>−</sup>, 1.02 g/L as SO<sub>4</sub><sup>2−</sup>, 0.107 g/L as Na<sup>+</sup>, 0.142 g/L as Mg<sup>2+</sup>, 0.312 g/L as Ca<sup>2+</sup>) and “B” (33.2 g/L as Cl<sup>−</sup>, 0.937 g/L as SO<sub>4</sub><sup>2−</sup>, 19.5 g/L as Na<sup>+</sup>, 0.990 g/L as Mg<sup>2+</sup>, 0.771 g/L as Ca<sup>2+</sup>).</p>
Full article ">Figure A5
<p>Rejection coefficient, R, of Na<sup>+</sup> as a function of permeate recovery, Y, for NFX, NF270 and NFDL nanofiltration membranes and mine waters “A” (0.384 g/L as Cl<sup>−</sup>, 1.02 g/L as SO<sub>4</sub><sup>2−</sup>, 0.107 g/L as Na<sup>+</sup>, 0.142 g/L as Mg<sup>2+</sup>, 0.312 g/L as Ca<sup>2+</sup>) and “B” (33.2 g/L as Cl<sup>−</sup>, 0.937 g/L as SO<sub>4</sub><sup>2−</sup>, 19.5 g/L as Na<sup>+</sup>, 0.990 g/L as Mg<sup>2+</sup>, 0.771 g/L as Ca<sup>2+</sup>).</p>
Full article ">
22 pages, 2263 KiB  
Article
Integrating Pressure-Driven Membrane Separation Processes to Improve Eco-Efficiency in Cheese Manufacture: A Preliminary Case Study
by Scott Benoit, Julien Chamberland, Alain Doyen, Manuele Margni, Christian Bouchard and Yves Pouliot
Membranes 2020, 10(10), 287; https://doi.org/10.3390/membranes10100287 - 15 Oct 2020
Cited by 7 | Viewed by 3391
Abstract
Pressure-driven membrane separation processes are commonly used in cheese milk standardization. Using ultrafiltration (UF) or microfiltration (MF), membrane separation processes make it possible to concentrate the milk proteins and increase the yields of cheese vats. However, the contribution of membrane separation processes to [...] Read more.
Pressure-driven membrane separation processes are commonly used in cheese milk standardization. Using ultrafiltration (UF) or microfiltration (MF), membrane separation processes make it possible to concentrate the milk proteins and increase the yields of cheese vats. However, the contribution of membrane separation processes to the environmental impact and economical profitability of dairy processes is still unclear. The objective of this study was to evaluate the contribution of membrane separation processes to the eco-efficiency of cheddar cheese production in Québec (Canada) using process simulation. Three scenarios were compared: two included UF or MF at the cheese milk standardization step, and one did not incorporate membrane separation processes. The results showed that even if membrane separation processes make it possible to increase vat yields, they do not improve the eco-efficiency of cheddar cheese processes. However, membrane separation processes may benefit the eco-efficiency of the process more when used for byproduct valorization. Full article
Show Figures

Graphical abstract

Graphical abstract
Full article ">Figure 1
<p>Process flow diagram of scenarios A and B. In scenario A, the concentration step is carried out using ultrafiltration membranes (10 kDa) until a volume concentration factor (VCF) of 3.5 is reached, followed by continuous diafiltration (2.0 DV). In scenario B, the concentration step is carried out using microfiltration membranes (0.1 µm) until a VCF of 3.0 is reached, followed by discontinuous diafiltration (2.0 DV each).</p>
Full article ">Figure 2
<p>Process flow diagram of scenario C. Based on the information from Tetra Pak [<a href="#B18-membranes-10-00287" class="html-bibr">18</a>].</p>
Full article ">Figure 3
<p>Distribution of the dairy fluids at the standardization step for scenarios A, B, and C.</p>
Full article ">Figure 4
<p>Process flow diagram of the multistage filtration units of scenarios A and B.</p>
Full article ">Figure 5
<p>Comparisons of the net margin generated per ton of raw milk received as a function of the selling prices (<span>$</span>CAD·kg<sup>−1</sup>) of the product and coproducts from scenarios A, B, and C for whey powder selling prices lower in scenario C than in scenarios A and B. (<b>a</b>) All permeate powder (PP) prices. (<b>b</b>) Lowest PP price. (<b>c</b>) Highest PP price. WP: Whey Powder, Sc.: Scenario, PP: Permeate Powder.</p>
Full article ">
11 pages, 7181 KiB  
Article
Enhanced Selective Hydrogen Permeation through Graphdiyne Membrane: A Theoretical Study
by Quan Liu, Long Cheng and Gongping Liu
Membranes 2020, 10(10), 286; https://doi.org/10.3390/membranes10100286 - 15 Oct 2020
Cited by 13 | Viewed by 3260
Abstract
Graphdiyne (GDY), with uniform pores and atomic thickness, is attracting widespread attention for application in H2 separation in recent years. However, the challenge lies in the rational design of GDYs for fast and selective H2 permeation. By MD and DFT calculations, [...] Read more.
Graphdiyne (GDY), with uniform pores and atomic thickness, is attracting widespread attention for application in H2 separation in recent years. However, the challenge lies in the rational design of GDYs for fast and selective H2 permeation. By MD and DFT calculations, several flexible GDYs were constructed to investigate the permeation properties of four pure gas (H2, N2, CO2, and CH4) and three equimolar binary mixtures (H2/N2, H2/CO2, and H2/CH4) in this study. When the pore size is smaller than 2.1 Å, the GDYs acted as an exceptional filter for H2 with an approximately infinite H2 selectivity. Beyond the size-sieving effect, in the separation process of binary mixtures, the blocking effect arising from the strong gas–membrane interaction was proven to greatly impede H2 permeation. After understanding the mechanism, the H2 permeance of the mixtures of H2/CO2 was further increased to 2.84 × 10⁵ GPU by reducing the blocking effect with the addition of a tiny amount of surface charges, without sacrificing the selectivity. This theoretical study provides an additional atomic understanding of H2 permeation crossing GDYs, indicating that the GDY membrane could be a potential candidate for H2 purification. Full article
(This article belongs to the Special Issue Polymer Membranes for Gas Separation)
Show Figures

Graphical abstract

Graphical abstract
Full article ">Figure 1
<p>Membrane models. Atomic structures of graphdiyne (GDY) membranes with different pore structures: (<b>a</b>) GDY_1.5Å_p3%; (<b>b</b>) GDY_1.5Å_p7%; (<b>c</b>) GDY_2.1Å; and (<b>d</b>) GDY_2.5Å. The first two membranes have different porosities of 3% and 7%, respectively. (<b>e</b>–<b>h</b>) The criterion for the definition of the pore diameter in each GDY membranes.</p>
Full article ">Figure 2
<p>Simulation system of the equimolar binary mixture of H<sub>2</sub>/CO<sub>2</sub> permeating through the GDY_2.1Å membrane. Atom: C (Cyan); O (red); H (white).</p>
Full article ">Figure 3
<p>Pure gas permeation. (<b>a</b>) The time evolution of permeated H<sub>2</sub> molecules; (<b>b</b>) The permeance of H<sub>2</sub> through different GDYs; (<b>c</b>) The permeation of four gases in GDY_2.5Å.</p>
Full article ">Figure 4
<p>DFT calculations of gases crossing the membrane of GDY_2.1Å. (<b>a</b>) Minimum energy pathways of four gases. (<b>b</b>) Ideal selectivities of H<sub>2</sub> over N<sub>2</sub>, CO<sub>2</sub>, and CH<sub>4</sub> as functions of temperature.</p>
Full article ">Figure 5
<p>H<sub>2</sub> permeation of three equimolar binary mixtures crossing the GDY_2.1Å. The final snapshots: (<b>a</b>) H<sub>2</sub>/N<sub>2</sub>, (<b>b</b>) H<sub>2</sub>/CH<sub>4</sub>, and (<b>c</b>) H<sub>2</sub>/CO<sub>2</sub>. Blue: N; cyan: C; red: O; white: H. (<b>d</b>) The H<sub>2</sub> permeance of different binary mixtures.</p>
Full article ">Figure 6
<p>Blocking effect on the surface of GDY_2.1Å. (<b>a</b>) Radial distribution function (RDF) of gases around the membrane. Density contours of the impermeable gases on the surface: (<b>b</b>) N<sub>2</sub> (H<sub>2</sub>/N<sub>2</sub>); (<b>c</b>) CH<sub>4</sub> (H<sub>2</sub>/CH<sub>4</sub>); (<b>d</b>) CO<sub>2</sub> (H<sub>2</sub>/CO<sub>2</sub>). The unit of density (N<sub>w</sub>/uc) is 1/(1.25Å<sup>3</sup>).</p>
Full article ">Figure 7
<p>Permeation behavior of H<sub>2</sub> in binary mixtures. (<b>a</b>) The number distributions along the z-direction in the last 10 ns. The membrane is located at the green dotted line; (<b>b</b>) The mean square displacement (MSD) curves of H<sub>2</sub> crossing the GDY_2.1Å membrane. (Inset) The region within 0.5 nm of the membrane surface for MSD calculation.</p>
Full article ">Figure 8
<p>The effect of the surface charges on gas permeation. (<b>a</b>) The distribution of charges on the network of GDY_2.1Å; (<b>b</b>) H<sub>2</sub> permeance of the binary mixture of H<sub>2</sub>/CO<sub>2</sub> as a function of surface charges. (Inset) The time evolution of permeated H<sub>2</sub> molecules through the charged GDYs.</p>
Full article ">
30 pages, 2765 KiB  
Review
A Review of CFD Modelling and Performance Metrics for Osmotic Membrane Processes
by Kang Yang Toh, Yong Yeow Liang, Woei Jye Lau and Gustavo A. Fimbres Weihs
Membranes 2020, 10(10), 285; https://doi.org/10.3390/membranes10100285 - 15 Oct 2020
Cited by 32 | Viewed by 6940
Abstract
Simulation via Computational Fluid Dynamics (CFD) offers a convenient way for visualising hydrodynamics and mass transport in spacer-filled membrane channels, facilitating further developments in spiral wound membrane (SWM) modules for desalination processes. This paper provides a review on the use of CFD modelling [...] Read more.
Simulation via Computational Fluid Dynamics (CFD) offers a convenient way for visualising hydrodynamics and mass transport in spacer-filled membrane channels, facilitating further developments in spiral wound membrane (SWM) modules for desalination processes. This paper provides a review on the use of CFD modelling for the development of novel spacers used in the SWM modules for three types of osmotic membrane processes: reverse osmosis (RO), forward osmosis (FO) and pressure retarded osmosis (PRO). Currently, the modelling of mass transfer and fouling for complex spacer geometries is still limited. Compared with RO, CFD modelling for PRO is very rare owing to the relative infancy of this osmotically driven membrane process. Despite the rising popularity of multi-scale modelling of osmotic membrane processes, CFD can only be used for predicting process performance in the absence of fouling. This paper also reviews the most common metrics used for evaluating membrane module performance at the small and large scales. Full article
(This article belongs to the Section Membrane Physics and Theory)
Show Figures

Figure 1

Figure 1
<p>Schematic diagram of a spiral wound membrane (SWM) module [<a href="#B2-membranes-10-00285" class="html-bibr">2</a>].</p>
Full article ">Figure 2
<p>Schematic figures illustrating the principles of (<b>a</b>) forward osmosis (FO), (<b>b</b>) reverse osmosis (RO) and (<b>c</b>) pressure retarded osmosis (PRO).</p>
Full article ">Figure 3
<p>Spacer geometry configurations for (<b>a</b>) conventional spacer [<a href="#B68-membranes-10-00285" class="html-bibr">68</a>], (<b>b</b>) triply periodic minimal surface (TPMS) spacer [<a href="#B52-membranes-10-00285" class="html-bibr">52</a>], (<b>c</b>) perforated spacer [<a href="#B55-membranes-10-00285" class="html-bibr">55</a>] and (<b>d</b>) submerged spacer with nodes [<a href="#B58-membranes-10-00285" class="html-bibr">58</a>].</p>
Full article ">Figure 4
<p>Experimental setup for flow visualisation of PIV [<a href="#B59-membranes-10-00285" class="html-bibr">59</a>].</p>
Full article ">Figure 5
<p>Velocity vector obtained from particle image velocimetry (PIV) imaging at centre of membrane channel for (<b>a</b>) ladder orientation and (<b>b</b>) normal orientation [<a href="#B59-membranes-10-00285" class="html-bibr">59</a>].</p>
Full article ">Figure 6
<p>Concentration profile across an FO membrane showing the different types of concentration polarisation.</p>
Full article ">Figure 7
<p>Examples of (<b>a</b>) FO–RO [<a href="#B132-membranes-10-00285" class="html-bibr">132</a>], (<b>b</b>) PRO–RO [<a href="#B14-membranes-10-00285" class="html-bibr">14</a>] and (<b>c</b>) FO–RO–PRO hybrid systems [<a href="#B22-membranes-10-00285" class="html-bibr">22</a>].</p>
Full article ">
40 pages, 1800 KiB  
Review
Forward Osmosis as Concentration Process: Review of Opportunities and Challenges
by Gaetan Blandin, Federico Ferrari, Geoffroy Lesage, Pierre Le-Clech, Marc Héran and Xavier Martinez-Lladó
Membranes 2020, 10(10), 284; https://doi.org/10.3390/membranes10100284 - 14 Oct 2020
Cited by 60 | Viewed by 10222
Abstract
In the past few years, osmotic membrane systems, such as forward osmosis (FO), have gained popularity as “soft” concentration processes. FO has unique properties by combining high rejection rate and low fouling propensity and can be operated without significant pressure or temperature gradient, [...] Read more.
In the past few years, osmotic membrane systems, such as forward osmosis (FO), have gained popularity as “soft” concentration processes. FO has unique properties by combining high rejection rate and low fouling propensity and can be operated without significant pressure or temperature gradient, and therefore can be considered as a potential candidate for a broad range of concentration applications where current technologies still suffer from critical limitations. This review extensively compiles and critically assesses recent considerations of FO as a concentration process for applications, including food and beverages, organics value added compounds, water reuse and nutrients recovery, treatment of waste streams and brine management. Specific requirements for the concentration process regarding the evaluation of concentration factor, modules and design and process operation, draw selection and fouling aspects are also described. Encouraging potential is demonstrated to concentrate streams more than 20-fold with high rejection rate of most compounds and preservation of added value products. For applications dealing with highly concentrated or complex streams, FO still features lower propensity to fouling compared to other membranes technologies along with good versatility and robustness. However, further assessments on lab and pilot scales are expected to better define the achievable concentration factor, rejection and effective concentration of valuable compounds and to clearly demonstrate process limitations (such as fouling or clogging) when reaching high concentration rate. Another important consideration is the draw solution selection and its recovery that should be in line with application needs (i.e., food compatible draw for food and beverage applications, high osmotic pressure for brine management, etc.) and be economically competitive. Full article
(This article belongs to the Special Issue Membrane Technologies for Resource Recovery)
Show Figures

Figure 1

Figure 1
<p>Basic principles of forward osmosis as concentration process.</p>
Full article ">Figure 2
<p>Yearly and accumulated numbers of publication on forward osmosis for concentration (database: Scopus, search parameters: “forward osmosis concentration” in title, abstract and keywords and after removing results from “forward osmosis concentration polarization”.</p>
Full article ">Figure 3
<p>Integration of FO as a concentration process in the WW treatment line to combine water reuse and nutrients concentration.</p>
Full article ">Figure 4
<p>Modelling of WCF<sub>a</sub> as function of (<b>a</b>) draw solute concentration and initial feed osmotic pressure (feed draw ratio 1), (<b>b</b>) feed draw ratio and draw osmotic pressure for <span class="html-italic">π<sub>F</sub></span> = 1 bar.</p>
Full article ">Figure 5
<p>Description of osmotic pressure of feed and draw stream in along a FO module, depending on operation in co- and counter-current (adapted from [<a href="#B224-membranes-10-00284" class="html-bibr">224</a>]).</p>
Full article ">
16 pages, 6615 KiB  
Article
Analysis of Dynamics Targeting CNT-Based Drug Delivery through Lung Cancer Cells: Design, Simulation, and Computational Approach
by Nafiseh Sohrabi, Afshar Alihosseini, Vahid Pirouzfar and Maysam Zamani Pedram
Membranes 2020, 10(10), 283; https://doi.org/10.3390/membranes10100283 - 14 Oct 2020
Cited by 18 | Viewed by 3033
Abstract
Nowadays, carbon nano (CN) structures and specifically carbon nanotubes (CNTs), because of the nanotube’s nanoscale shape, are widely used in carrier and separation applications. The conjugation of CNTs with polysaccharide, proteins, drugs, and magnetic nanoparticles provides a chance for smart targeting and trajectory [...] Read more.
Nowadays, carbon nano (CN) structures and specifically carbon nanotubes (CNTs), because of the nanotube’s nanoscale shape, are widely used in carrier and separation applications. The conjugation of CNTs with polysaccharide, proteins, drugs, and magnetic nanoparticles provides a chance for smart targeting and trajectory manipulation, which are used in the crucial field of life science applications, including for cancer disease diagnostics and treatments. Providing an optimal procedure for delivering a drug to a specific area based on mathematical criteria is key in systemic delivery design. Trajectory guidance and applied force control are the main parameters affected by systemic delivery. Moreover, a better understanding of the tissue parameters and cell membrane molecular behaviour are other factors that can be indirectly affected by the targeted delivery. Both sides are an essential part of successful targeting. The lung is one of the challenging organs for drug delivery inside the human body. It has a large surface area with a thin epithelium layer. A few severe diseases directly involve human lung cells, and optimal and successful drug delivery to the lung for the treatment procedure is vital. In this paper, we studied functionalized CNTs’ targeted delivery via crossing through the lung cell membrane. Molecular dynamics (MD) software simulated all the interaction forces. Mathematical modelling of the cell membrane and proposed delivery system based on the relation of velocity and force has been considered. Dynamics equations for CNTs were defined in the time and frequency domain using control theory methods. The proposed delivery system consists of two main parts: crossing through the cell membrane and targeting inside the cell. For both steps, a mathematical model and a proper magnetic field profile have been proposed. The designed system provides criteria for crossing through the cell membrane within 30 s to 5 min and a translocation profile of 1 to 100 Å. Full article
(This article belongs to the Special Issue Study on Drug-Membrane Interactions)
Show Figures

Graphical abstract

Graphical abstract
Full article ">Figure 1
<p>CNTs cross through membrane structure. Functionalized CNTs with drugs and magnetic nanoparticles (MNPs) are guided with a magnetic field to cross through the cell membrane. By applying a predefined external magnetic field profile on the MNPs, the exerted force leads CNTs across the membrane.</p>
Full article ">Figure 2
<p>Functionalized CNTs crossing through the membrane. With a predefined magnetic field, CNTs can be guided through a desired trajectory inside the cell. The magnetic forces needed in this step are lower than those needed later, as the resistance forces are lower than they are inside the cell and cytoplasm.</p>
Full article ">Figure 3
<p>The process of conjugating a carbon nanotube with chemical compounds. Single-wall carbon nanotube (SWCNT) conjugated with sodium alginate (ALG), chitosan (CHI), folic acid, and doxorubicin hydrochloride.</p>
Full article ">Figure 4
<p>Single-wall carbon nanotube (SWCNT) conjugated with sodium alginate (ALG), chitosan (CHI), folic acid, and doxorubicin hydrochloride. (<b>a</b>–<b>c</b>) The structure in various orientations.</p>
Full article ">Figure 5
<p>Carbon nanotube above membrane: (<b>a</b>) simple CNT above the membrane, (<b>b</b>,<b>c</b>) functionalized CNT above the cell membrane in two different orientations, (<b>d</b>) lung cell membrane and a functionalized CNT above the membrane.</p>
Full article ">Figure 6
<p>Concept of frequency domain modelling of the molecular-scale system. (<b>a</b>) Based on the designed molecular-scale model, functionalized CNTs cross through the lung cell membrane with various velocities and the interaction forces are recorded, which can be seen as a resistance force. (<b>b</b>) With the recorded interaction forces as the output and the velocity as the input, a frequency domain mathematical model is fitted on the data. The PEM system, parameters, and coefficient will be updated, and the desired parameters are extracted.</p>
Full article ">Figure 7
<p>Free diagram of forces flowing inside the cell. In this diagram, the drag force is created by flow and the actuation force is applied by the external magnetic field device. Buoyancy forces and Brownian forces are shown in the figure. The total forces regarding the gravity and buoyancy are neglectable. Brownian forces create random motion, which depends on the medium temperature.</p>
Full article ">Figure 8
<p>Snapshot of the crossing of functionalized CNT through the membrane. This figure shows the orientation of functionalized CNT while crossing through the membrane.</p>
Full article ">Figure 9
<p>Force needed for crossing through the membrane. This shows the interaction of the force created to cross functionalized carbon nanotubes through the membrane at various velocities between 1 and 2 angstroms per second. This diagram shows an increase in the rate of passage while the crossing velocity is increased. It clearly shows that by increasing the rate of crossing, the interaction forces are increased. The X-axis is the steps, and Y-axis is the force [N].</p>
Full article ">Figure 10
<p>System dynamics response comparison and bode diagram. (<b>a</b>) Best fit of the system identification. In this figure, the estimated mathematical model and the real recorded data are illustrated in the same coordinate. This shows that the system behaviour and dynamics in both are similar. (<b>b</b>) Bode diagram of the identified system. In the bode diagram, there is information on the magnitude and phase vs. frequency, which provides the behaviour of the system based on frequency.</p>
Full article ">Figure 11
<p>Optimal region for the crossing of functionalized CNT through the cell membrane: (<b>a</b>) region of the magnetic field and gradient for crossing within 30 s; (<b>b</b>) region of the magnetic field and gradient for crossing within 60 s; (<b>c</b>) region of the magnetic field and gradient for crossing within 90 s; (<b>d</b>) region of the magnetic field and gradient for crossing within 120 s; (<b>e</b>) region of the magnetic field and gradient for crossing within 300 s.</p>
Full article ">Figure 12
<p>Position control of functionalized CNT inside the cell (<b>a</b>) z-position of the particle inside the cell for translocating around 1 Å and the maximum magnetic field of 200 mT. (<b>b</b>) z-position of the particle inside the cell for translocating around 1000 Å and the maximum magnetic field of 180 T. (<b>c</b>) z-position of the particle inside the cell for translocating around 10 Å and the maximum magnetic field of 180 mT. (<b>d</b>) z-position of the particle inside the cell for translocating around 100 Å and the maximum magnetic field of 18 T.</p>
Full article ">Figure 13
<p>Effect of the controller parameters on the settling time and magnetic field peak. (<b>a</b>) Maximum magnetic field peak needed when the <math display="inline"><semantics> <mi>m</mi> </semantics></math> parameters change from 0 to 10 (<b>b</b>). Settling time corresponds to <math display="inline"><semantics> <mi>m</mi> </semantics></math> parameters, showing that, by increasing the <math display="inline"><semantics> <mi>m</mi> </semantics></math>, settling time is reduced. Lower settling time means a higher speed of reaching the targets.</p>
Full article ">
12 pages, 2124 KiB  
Article
Performance and Microbial Community of Different Biofilm Membrane Bioreactors Treating Antibiotic-Containing Synthetic Mariculture Wastewater
by Huining Zhang, Xin Yuan, Hanqing Wang, Shuoqi Ma and Bixiao Ji
Membranes 2020, 10(10), 282; https://doi.org/10.3390/membranes10100282 - 14 Oct 2020
Cited by 8 | Viewed by 2828
Abstract
The performance of pollutant removals, tetracycline (TC) and norfloxacin (NOR) removals, membrane fouling mitigation and the microbial community of three Anoxic/Oxic membrane bioreactors (AO-MBRs), including a moving bed biofilm MBR (MBRa), a fixed biofilm MBR (MBRb) and an AO-MBR (MBRc) for control, were [...] Read more.
The performance of pollutant removals, tetracycline (TC) and norfloxacin (NOR) removals, membrane fouling mitigation and the microbial community of three Anoxic/Oxic membrane bioreactors (AO-MBRs), including a moving bed biofilm MBR (MBRa), a fixed biofilm MBR (MBRb) and an AO-MBR (MBRc) for control, were compared in treating antibiotic-containing synthetic mariculture wastewater. The results showed that MBRb had the best effect on antibiotic removal and membrane fouling mitigation compared to the other two bioreactors. The maximum removal rate of TC reached 91.65% and the maximum removal rate of NOR reached 45.46% in MBRb. The addition of antibiotics had little effect on the removal of chemical oxygen demand (COD) and ammonia nitrogen (NH4+-N)—both maintained more than 90% removal rate during the entire operation. High-throughput sequencing demonstrated that TC and NOR resulted in a significant decrease in the microbial diversity and the microbial richness MBRs. Flavobacteriia, Firmicutes and Azoarcus, regarded as drug-resistant bacteria, might play a crucial part in the removal of antibiotics. In addition, the dynamics of microbial community had a great change, which included the accumulation of resistant microorganisms and the gradual reduction or disappearance of other microorganisms under antibiotic pressure. The research provides an insight into the antibiotic-containing mariculture wastewater treatment and has certain reference value. Full article
Show Figures

Graphical abstract

Graphical abstract
Full article ">Figure 1
<p>Configurations of membrane bioreactors MBRa, MBRb, and MBRc.</p>
Full article ">Figure 2
<p>Removal performance of different reactors in different operating phases, COD removal rate in (<b>a</b>), NH<sub>4</sub><sup>+</sup>-N removal rate in (<b>b</b>), NO<sub>2</sub><sup>−</sup>-N influent and effluent components in (<b>c</b>) and NO<sub>3</sub><sup>−</sup>-N influent and effluent components in (<b>d</b>).</p>
Full article ">Figure 3
<p>TC removal rates (<b>a</b>) and NOR removal rates, (<b>b</b>) in reactors at stable state in P1 and P2.</p>
Full article ">Figure 4
<p>Variations in transmembrane pressure (TMP) in each MBRs.</p>
Full article ">Figure 5
<p>Microbial community structure in sludge samples in P0 (C) in MBRc, and P1 (MBRa-1, MBRb-1 and MBRc-1) and P2 (MBRa-2, MBRb-2 and MBRc-2). Results are shown at the (<b>a</b>) phylum level and (<b>b</b>) class levels.</p>
Full article ">
29 pages, 3493 KiB  
Review
Application of Hybrid Membrane Processes Coupling Separation and Biological or Chemical Reaction in Advanced Wastewater Treatment
by Raffaele Molinari, Cristina Lavorato and Pietro Argurio
Membranes 2020, 10(10), 281; https://doi.org/10.3390/membranes10100281 - 13 Oct 2020
Cited by 33 | Viewed by 5050
Abstract
The rapid urbanization and water shortage impose an urgent need in improving sustainable water management without compromising the socioeconomic development all around the world. In this context, reclaimed wastewater has been recognized as a sustainable water management strategy since it represents an alternative [...] Read more.
The rapid urbanization and water shortage impose an urgent need in improving sustainable water management without compromising the socioeconomic development all around the world. In this context, reclaimed wastewater has been recognized as a sustainable water management strategy since it represents an alternative water resource for non-potable or (indirect) potable use. The conventional wastewater remediation approaches for the removal of different emerging contaminants (pharmaceuticals, dyes, metal ions, etc.) are unable to remove/destroy them completely. Hybrid membrane processes (HMPs) are a powerful solution for removing emerging pollutants from wastewater. On this aspect, the present paper focused on HMPs obtained by the synergic coupling of biological and/or chemical reaction driven processes with membrane processes, giving a critical overview and particular emphasis on some case studies reported in the pertinent literature. By using these processes, a satisfactory quality of treated water can be achieved, permitting its sustainable reuse in the hydrologic cycle while minimizing environmental and economic impact. Full article
Show Figures

Graphical abstract

Graphical abstract
Full article ">Figure 1
<p>Schematic diagram utilizing ultrafiltration (UF) (<b>a</b>) and direct contact membrane distillation (DCMD) (<b>b</b>) [<a href="#B31-membranes-10-00281" class="html-bibr">31</a>].</p>
Full article ">Figure 2
<p>Schematic diagram of the cross-flow membrane filtration system [<a href="#B50-membranes-10-00281" class="html-bibr">50</a>].</p>
Full article ">Figure 3
<p>Flow-through optical fiber (OF)/LED reactor design [<a href="#B58-membranes-10-00281" class="html-bibr">58</a>].</p>
Full article ">Figure 4
<p>Submerged photocatalytic membrane reactor (SMPR) reactor set up [<a href="#B59-membranes-10-00281" class="html-bibr">59</a>].</p>
Full article ">Figure 5
<p>Lithium permeability (P<sub>Li</sub>) and sodium permeability (P<sub>Na</sub>) versus initial sodium/lithium molar ratio in the aqueous feed phase. Feed phase: LiCl (1 mmol L<sup>−1</sup>), NaCl (variable), pH = 12 [<a href="#B74-membranes-10-00281" class="html-bibr">74</a>].</p>
Full article ">Figure 6
<p>(<b>a</b>) Extraction, stripping, and (<b>b</b>) transport data of Am(III) from 3.0 M HNO<sub>3</sub> aqueous phase using the three N-pivot tripodal diglycolamide (DGA) extractants (organic phase: 1.0 × 10<sup>−3</sup> M extractant in 95% n-dodecane + 5% isodecanol) (data from [<a href="#B75-membranes-10-00281" class="html-bibr">75</a>]).</p>
Full article ">Figure 7
<p>Schematization of flowing liquid membrane system. F, E, and R: feed, organic, and strip compartments; M: separation membranes. 1 and 2: inlet and outlet of the feed, organic, and strip solutions [<a href="#B97-membranes-10-00281" class="html-bibr">97</a>].</p>
Full article ">Figure 8
<p>Schematic representation of the stagnant sandwich liquid membranes (SSwLM) [<a href="#B71-membranes-10-00281" class="html-bibr">71</a>].</p>
Full article ">Figure 9
<p>Schematization of the overall complexation–ultrafiltration (CP–UF) process.</p>
Full article ">Figure 10
<p>Schematization of the rotating disk enhancing CP–UF process [<a href="#B105-membranes-10-00281" class="html-bibr">105</a>].</p>
Full article ">Figure 11
<p>Conceptual coupling of photocatalysis and CP–UF (PR = photoreactor, MS = membrane separation; PMR = photocatalytic membrane reactor) [<a href="#B116-membranes-10-00281" class="html-bibr">116</a>].</p>
Full article ">
16 pages, 2063 KiB  
Perspective
Membrane and Electrochemical Processes for Water Desalination: A Short Perspective and the Role of Nanotechnology
by Moon Son, Kyung Hwa Cho, Kwanho Jeong and Jongkwan Park
Membranes 2020, 10(10), 280; https://doi.org/10.3390/membranes10100280 - 12 Oct 2020
Cited by 9 | Viewed by 3852
Abstract
In the past few decades, membrane-based processes have become mainstream in water desalination because of their relatively high water flux, salt rejection, and reasonable operating cost over thermal-based desalination processes. The energy consumption of the membrane process has been continuously lowered (from >10 [...] Read more.
In the past few decades, membrane-based processes have become mainstream in water desalination because of their relatively high water flux, salt rejection, and reasonable operating cost over thermal-based desalination processes. The energy consumption of the membrane process has been continuously lowered (from >10 kWh m−3 to ~3 kWh m−3) over the past decades but remains higher than the theoretical minimum value (~0.8 kWh m−3) for seawater desalination. Thus, the high energy consumption of membrane processes has led to the development of alternative processes, such as the electrochemical, that use relatively less energy. Decades of research have revealed that the low energy consumption of the electrochemical process is closely coupled with a relatively low extent of desalination. Recent studies indicate that electrochemical process must overcome efficiency rather than energy consumption hurdles. This short perspective aims to provide platforms to compare the energy efficiency of the representative membrane and electrochemical processes based on the working principle of each process. Future water desalination methods and the potential role of nanotechnology as an efficient tool to overcome current limitations are also discussed. Full article
(This article belongs to the Special Issue Nanotechnology in Engineered Membranes)
Show Figures

Graphical abstract

Graphical abstract
Full article ">Figure 1
<p>Schematic and working principle of (<b>a</b>) pressure-driven (RO) or (<b>b</b>) osmotic-driven (FO) membrane processes. (<b>c</b>) Membrane-based renewable energy production process (PRO) using a turbine (black) driven by pressurized water flow.</p>
Full article ">Figure 2
<p>Schematic and working principle of (<b>a</b>) capacitive deionization (CDI), (<b>b</b>) membrane capacitive deionization (MCDI), and (<b>c</b>) flow-electrode capacitive deionization (FCDI) systems.</p>
Full article ">Figure 3
<p>Schematic and working principle of (<b>a</b>) cation intercalate battery deionization (BDI) (symmetric) and (<b>b</b>) cation/anion (asymmetric) intercalate BDI processes.</p>
Full article ">Figure 4
<p>Schematic and working principle of electrodialysis (ED) that becomes the reverse electrodialysis (RED) mode where current flows in the external circuit when solutions with different salinities flow without applying current to the system.</p>
Full article ">Figure 5
<p>Current role and remaining challenges of nanotechnology for water desalination using membranes and electrochemical cells.</p>
Full article ">
15 pages, 2300 KiB  
Article
Solid-State Membrane Sensors Based on Man-Tailored Biomimetic Receptors for Selective Recognition of Isoproturon and Diuron Herbicides
by Ayman H. Kamel, Abd El-Galil E. Amr, Mohamed A. Al-Omar and Abdulrahman A. Almehizia
Membranes 2020, 10(10), 279; https://doi.org/10.3390/membranes10100279 - 12 Oct 2020
Cited by 6 | Viewed by 2774
Abstract
Solid-contact ion-selective electrodes (SC-ISEs) have shown great potential for routine and portable ion detection. The introduction of nanomaterials as ion-to-electron transducers and the adoption of different performance-enhancement strategies have significantly promoted the development of SC-ISEs. Herein, new solid-contact ion-selective electrodes, along with the [...] Read more.
Solid-contact ion-selective electrodes (SC-ISEs) have shown great potential for routine and portable ion detection. The introduction of nanomaterials as ion-to-electron transducers and the adoption of different performance-enhancement strategies have significantly promoted the development of SC-ISEs. Herein, new solid-contact ion-selective electrodes, along with the implementation of multiwalled carbon nanotubes (MWCNTs) as ion-to-electron transducers and potassium tetrakis (p-chlorophenyl) borate (KTpClB) as lipophilic ionic additives, were presented for the detection of isoproturon (IPU) and diuron (DU) herbicides. Molecularly imprinted polymers (MIPs), with special molecule recognition properties for isoproturon (IPU) and diuron (DU), were prepared, characterized, and introduced as sensory recognition materials in the presented electrodes. Sensors revealed a near-Nernstian response for both isoproturon (IPU) and diuron (DU) with slopes of 53.1 ± 1.2 (r2 = 0.997) and 57.2 ± 0.3 (r2 = 0.998) over the linear ranges of 2.2 × 10⁻⁶–1.0 × 10⁻³ M and 3.2 × 10⁻⁶–1.0 × 10⁻³ M with detection limits of 8.3 × 10⁻⁷ and 1.4 × 10⁻⁶ M, respectively. The response time of the presented sensors was found to be <5 s and the lifetime was at least eight weeks. The sensors exhibited good selectivity towards isoproturon (IPU) and diuron (DU) in comparison with some other herbicides, alkali, alkaline earth, and heavy metal ions. The presented sensors were successfully applied for the direct determination of isoproturon (IPU) and diuron (DU) in real water samples. Full article
(This article belongs to the Special Issue Membrane-Based Sensors)
Show Figures

Figure 1

Figure 1
<p>Chemical structure of the studied compounds.</p>
Full article ">Figure 2
<p>Response mechanism of the proposed solid-contact ion-selective electrodes (ISEs).</p>
Full article ">Figure 3
<p>Binding isotherm (<b>A</b>) and Scatchard plot (<b>B</b>) for both isoproturon (IPU)- and diuron (DU)-imprinted polymers. <span class="html-italic">Q</span> = herbicide bound to 20.0 mg of the corresponding polymer; temperature = 25 °C; volume = 10.0 mL; binding time = 12 h.</p>
Full article ">Figure 4
<p>SEM images of (<b>a</b>) molecularly imprinted polymers (MIP)/IPU, (<b>b</b>) MIP/DU, and (<b>c</b>) nonimprinted polymer (NIP) beads. Conditions: scale bar = 2.00 µm, 3.0 kv; 27 mm x20.0kv.</p>
Full article ">Figure 5
<p>Calibration plots for all solid-contact ISEs in the Britton–Robinson (BR) buffer solution (pH = 3.0).</p>
Full article ">Figure 6
<p>pH plot for (A) MIP(IPU)/multiwalled carbon nanotubes (MWCNTs)-ISEs and (B) MIP(DU)/MWCNTs-ISEs.</p>
Full article ">Figure 7
<p>Time response for (A) MIP(IPU)/MWCNTs-ISEs and (B) MIP(DU)/MWCNTs-ISEs.</p>
Full article ">Figure 8
<p>(<b>A</b>) Impedance plots of MIP (IPU)/MWCNTs-ISEs (red) and MIP (IPU)-coated-wire electrodes (CWEs) (black) in the 10<sup>−4</sup> M IPU solution. (<b>B</b>) Impedance plots of MIP (DU)/MWCNTs-ISEs (red) and MIP (DU)-CWE (black) in the 10<sup>−4</sup> M DU solution. Conditions: the frequency ranges from 100 kHz to 0.01 Hz and the disturbance amplitude is 10 mV.</p>
Full article ">Figure 9
<p>Chronopotentiometric plots of (<b>A</b>) MIP (IPU)/MWCNTs-ISEs (red) and MIP (IPU)-CWE (black) in the 10<sup>−4</sup> M IPU solution. (<b>B</b>) MIP (DU)/MWCNTs-ISEs (red) and MIP (DU)-CWE (black) in the 10<sup>−4</sup> M DU solution.</p>
Full article ">
14 pages, 3558 KiB  
Article
Preparation of Shellac Resin Microcapsules Coated with Urea Formaldehyde Resin and Properties of Waterborne Paint Films for Tilia amurensis Rupr.
by Xiaoxing Yan and Lin Wang
Membranes 2020, 10(10), 278; https://doi.org/10.3390/membranes10100278 - 12 Oct 2020
Cited by 18 | Viewed by 2415
Abstract
A two-step in situ polymerization method was utilized to fabricate urea formaldehyde (UF) resin-coated shellac resin microcapsules. The morphology and composition of microcapsules with different core-wall ratios were analyzed by scanning electron microscope (SEM) and infrared (IR) spectrum. The effects of different concentrations [...] Read more.
A two-step in situ polymerization method was utilized to fabricate urea formaldehyde (UF) resin-coated shellac resin microcapsules. The morphology and composition of microcapsules with different core-wall ratios were analyzed by scanning electron microscope (SEM) and infrared (IR) spectrum. The effects of different concentrations of microcapsules on gloss, color difference, hardness, adhesion, and impact resistance of waterborne paint films were studied. At the same time, the self-healing effect of the prepared microcapsules applied to waterborne paint film was discussed. The results revealed that the shellac resin microcapsules coated with UF resin were successfully prepared. At the 0.67:1 and 0.75:1 core-wall ratios, the color differences of the paint film with 0–20.0% (weight percent) microcapsules were small and the color was uniform. Under the condition of 60° incident angle and the same microcapsule concentration, a good gloss was obtained. When the concentration was 20.0%, the hardness of paint film reached the maximum value. The adhesion of paint film was better, which was not affected by microcapsule concentration. When the concentration was 5.0% and 10.0%, the microstructure of paint film was good. The paint film with a 10.0% concentration of the shellac resin microcapsules coated with UF resin had better self-healing performance and the comprehensive performance was better. This paper provides the basis for the industrial application of self-healing waterborne wood paint films. Full article
(This article belongs to the Section Membrane Chemistry)
Show Figures

Figure 1

Figure 1
<p>SEM of microcapsules with different core-wall ratios: (<b>A</b>) 0.42:1, (<b>B</b>) 0.67:1, (<b>C</b>) 0.75:1.</p>
Full article ">Figure 2
<p>FTIR of microcapsules with different core-wall ratios.</p>
Full article ">Figure 3
<p>Effect of microcapsule concentration (0.42:1, 0.67:1, and 0.75:1 core-wall ratios) on color difference.</p>
Full article ">Figure 4
<p>Effect of microcapsule concentration (0.42:1, 0.67:1, and 0.75:1 core-wall ratios) on hardness.</p>
Full article ">Figure 5
<p>Effect of microcapsule concentration (0.42:1, 0.67:1, and 0.75:1 core-wall ratios) on adhesion.</p>
Full article ">Figure 6
<p>Effect of microcapsule concentration (0.42:1, 0.67:1, and 0.75:1 core-wall ratios) on impact resistance.</p>
Full article ">Figure 7
<p>SEM of paint films corresponding to microcapsule (0.75:1 core-wall ratio) concentrations of: (<b>A</b>) 0%, (<b>B</b>) 5.0%, (<b>C</b>) 10.0%, (<b>D</b>) 15.0%, (<b>E</b>) 20.0%.</p>
Full article ">Figure 8
<p>FTIR of paint films corresponding to microcapsule concentration.</p>
Full article ">Figure 9
<p>Effect of microcapsule with 0.75:1 core-wall ratio on the paint film gloss.</p>
Full article ">
16 pages, 4997 KiB  
Article
Hyperbranch-Crosslinked S-SEBS Block Copolymer Membranes for Desalination by Pervaporation
by Mengyu Yan, Yunyun Lu, Na Li, Feixiang Zeng, Qinzhuo Wang, Hongcun Bai and Zongli Xie
Membranes 2020, 10(10), 277; https://doi.org/10.3390/membranes10100277 - 10 Oct 2020
Cited by 16 | Viewed by 3457
Abstract
Sulfonated aromatic polymer (SAP) featuring hydrophilic nanochannels for water transport is a promising membrane material for desalination. SAPs with a high sulfonation degree favor water transport but suffer from reduced mechanical strength and membrane swelling. In this work, a hyperbranched polyester, H302, was [...] Read more.
Sulfonated aromatic polymer (SAP) featuring hydrophilic nanochannels for water transport is a promising membrane material for desalination. SAPs with a high sulfonation degree favor water transport but suffer from reduced mechanical strength and membrane swelling. In this work, a hyperbranched polyester, H302, was introduced to crosslink a sulfonated styrene-ethylene/butylene-styrene (S-SEBS) copolymer membrane. The effects of crosslinking temperature and amount of H302 on the microstructure, and the pervaporation desalination performance of the membrane, were investigated. H302/S-SEBS copolymer membranes with different crosslinking conditions were characterized by various techniques including FTIR, DSC, EA, SEM, TEM and SAXS, and tensile strength, water sorption and contact angle measurements. The results indicate that the introduction of hyperbranched polyester enlarged the hydrophilic microdomain of the S-SEBS membrane. Crosslinking with hyperbranched polyester with heat treatment effectively enhanced the mechanical strength of the S-SEBS membrane, with the tensile strength being increased by 140–200% and the swelling ratio reduced by 45–70%, while reasonable water flux was maintained. When treating 5 wt% hypersaline water at 65 °C, the optimized crosslinked membrane containing 15 wt% H302 and heated at 100 °C reached a water flux of 9.3 kg·m−2·h−1 and a salt rejection of 99.9%. The results indicate that the hyperbranched-S-SEBS membrane is promising for use in PV desalination. Full article
(This article belongs to the Special Issue Membranes for Water, Gas and Ion Separation)
Show Figures

Graphical abstract

Graphical abstract
Full article ">Figure 1
<p>Schematic of pervaporation testing unit.</p>
Full article ">Figure 2
<p>FTIR spectra of H302/S-SEBS membranes (<b>a</b>) without thermal treatment; (<b>b</b>) with thermal treatment (H302:S-SEBS = 0.15:1); (<b>c</b>) DSC of membranes with different contents of H302; (<b>d</b>) change of sulfur content in H302/S-SEBS membranes after thermal treatment.</p>
Full article ">Figure 3
<p>Mechanism of thermal crosslinking.</p>
Full article ">Figure 4
<p>SEM (<b>a</b>,<b>b</b>) and TEM (<b>c</b>,<b>d</b>) images of (<b>a</b>,<b>c</b>) pristine S-SEBS and (<b>b</b>,<b>d</b>) H302:S-SEBS = 0.30:1 membrane.</p>
Full article ">Figure 5
<p>SAXS profiles of H302/S-SEBS membranes (<b>a</b>) without thermal treatment (<b>b</b>) with thermal treatment.</p>
Full article ">Figure 6
<p>Water contact angle measurement for membranes. (<b>a</b>) Water droplets on membrane surface and (<b>b</b>) water contact angle with drop age (A: pristine S-SEBS; B: H302:S-SEBS = 0.15:1; C: H302:S-SEBS = 0.15:1 crosslinked at 100 °C; D: H302:S-SEBS = 0.15:1 crosslinked at 130 °C).</p>
Full article ">Figure 7
<p>IEC (<b>a</b>,<b>b</b>), water uptake (<b>c</b>,<b>d</b>) and swelling ratio (<b>e</b>,<b>f</b>) of membranes as a function of crosslinking temperature and H302 content.</p>
Full article ">Figure 8
<p>Schematic diagram of (<b>a</b>) thermal-crosslinking of S-SEBS without crosslinker and (<b>b</b>) H-bonding interaction between H302 in thermal-crosslinking with S-SEBS.</p>
Full article ">Figure 9
<p>TG (<b>a</b>,<b>b</b>) and tensile strength (<b>c</b>,<b>d</b>) of membranes with different treating temperatures and H302 contents.</p>
Full article ">Figure 10
<p>Pervaporation performance of (<b>a</b>) without thermal treatment; (<b>b</b>) with thermal treatment at different temperatures (H302: S-SEBS = 0.15:1); (<b>c</b>) at different mass ratios of H302: S-SEBS; (<b>d</b>) stability test for membrane (H302:S-SEBS = 0.15:1, thermal treatment at 100 °C). (All PV test with 5 wt% NaCl feed solution at 65 °C).</p>
Full article ">
18 pages, 6057 KiB  
Article
Performance Evaluation and Kinetic Analysis of Photocatalytic Membrane Reactor in Wastewater Treatment
by Zeyad Zeitoun, Ahmed H. El-Shazly, Shaaban Nosier, Mohamed R. Elmarghany, Mohamed S. Salem and Mahmoud M. Taha
Membranes 2020, 10(10), 276; https://doi.org/10.3390/membranes10100276 - 8 Oct 2020
Cited by 9 | Viewed by 3749
Abstract
The objectives of the current study are to assess and compare the performance of a developed photocatalytic membrane reactor (PMR) in treating industrial waste (e.g., organic dye waste) against membrane distillation. The current PMR is composed of a feed tank, which is a [...] Read more.
The objectives of the current study are to assess and compare the performance of a developed photocatalytic membrane reactor (PMR) in treating industrial waste (e.g., organic dye waste) against membrane distillation. The current PMR is composed of a feed tank, which is a continuous stirred photocatalytic reactor containing slurry Titanium dioxide (TiO2) particles that are activated by using ultraviolet lamp irradiation at a wavelength of 365 nm, and a poly-vinylidene flouride (PVDF) membrane cell. The experimental setup was designed in a flexible way to enable both separate and integrated investigations of the photocatalytic reactor and the membrane, separately and simultaneously. The experimental work was divided into two phases. Firstly, the PVDF membrane was fabricated and characterized to examine its morphology, surface charge, and hydrophobicity by using a scanning electron microscope, surface zeta potential, and contact angle tests, respectively. Secondly, the effects of using different concentrations of the TiO2 photocatalyst and feed (e.g., dye concentration) were examined. It is found that the PMR can achieve almost 100% dye removal and pure permeate is obtained at certain conditions. Additionally, a kinetic analysis was performed and revealed that the photocatalytic degradation of dye follows a pseudo-first-order reaction. Full article
Show Figures

Graphical abstract

Graphical abstract
Full article ">Figure 1
<p>The four membrane distillation configurations.</p>
Full article ">Figure 2
<p>Electrospinning device and mechanism.</p>
Full article ">Figure 3
<p>SEM image for PVDF membrane.</p>
Full article ">Figure 4
<p>Zeta potential of the PVDF membrane surface.</p>
Full article ">Figure 5
<p>Contact angle: (<b>a</b>) water droplet on PVDF membrane surface [<a href="#B36-membranes-10-00276" class="html-bibr">36</a>]; (<b>b</b>) methylene blue droplet on PVDF membrane surface.</p>
Full article ">Figure 6
<p>Images of dye and water droplets on PVDF membrane.</p>
Full article ">Figure 7
<p>Particle size distribution of <math display="inline"><semantics> <mrow> <msub> <mrow> <mi>TiO</mi> </mrow> <mn>2</mn> </msub> </mrow> </semantics></math>.</p>
Full article ">Figure 8
<p>XRD patterns for <math display="inline"><semantics> <mrow> <msub> <mrow> <mi>TiO</mi> </mrow> <mn>2</mn> </msub> </mrow> </semantics></math> nanoparticles.</p>
Full article ">Figure 9
<p>Hybrid system diagram: (1) magnetic stirrer; (2) feed tank; (3)UV-lamp; (4) feed pump; (5) heating unit; (6) membrane cell; (7) feed compartment; (8) PVDF membrane; (9) permeate compartment; (10) permeate tank; (11) cooling jacket; (12) permeate pump; (13) thermocouples; (14) PC data acquisition system.</p>
Full article ">Figure 10
<p>Results for <math display="inline"><semantics> <mrow> <mn>4</mn> <mrow> <mtext> </mtext> <mi>ppm</mi> </mrow> </mrow> </semantics></math> methylene blue (MB) experiments: (<b>a</b>) flux vs. amount of <math display="inline"><semantics> <mrow> <msub> <mrow> <mi>TiO</mi> </mrow> <mn>2</mn> </msub> <mo>;</mo> </mrow> </semantics></math> (<b>b</b>) permeate concentration vs. time.</p>
Full article ">Figure 11
<p>Results for <math display="inline"><semantics> <mrow> <mn>7</mn> <mrow> <mtext> </mtext> <mi>ppm</mi> </mrow> </mrow> </semantics></math> MB experiments: (<b>a</b>) flux vs. amount of <math display="inline"><semantics> <mrow> <msub> <mrow> <mi>TiO</mi> </mrow> <mn>2</mn> </msub> <mo>;</mo> </mrow> </semantics></math> (<b>b</b>) permeate concentration vs. time.</p>
Full article ">Figure 12
<p>SEM for PVDF membrane after dye treatment.</p>
Full article ">Figure 13
<p>Results for <math display="inline"><semantics> <mrow> <mn>11</mn> <mrow> <mtext> </mtext> <mi>ppm</mi> </mrow> </mrow> </semantics></math> MB experiments: (<b>a</b>) flux vs. amount of <math display="inline"><semantics> <mrow> <msub> <mrow> <mi>TiO</mi> </mrow> <mn>2</mn> </msub> <mo>;</mo> </mrow> </semantics></math> (<b>b</b>) permeate concentration vs. time.</p>
Full article ">Figure 14
<p>Results for <math display="inline"><semantics> <mrow> <mn>15</mn> <mrow> <mtext> </mtext> <mi>ppm</mi> </mrow> </mrow> </semantics></math> MB experiments: (<b>a</b>) flux vs. amount of <math display="inline"><semantics> <mrow> <msub> <mrow> <mi>TiO</mi> </mrow> <mn>2</mn> </msub> <mo>;</mo> </mrow> </semantics></math> (<b>b</b>) permeate concentration vs. time.</p>
Full article ">Figure 15
<p>Feed concentration vs. time: (<b>a</b>) 4 ppm; (<b>b</b>) 7 ppm; (<b>c</b>) 11 ppm; (<b>d</b>) 15 ppm.</p>
Full article ">Figure 16
<p>Kinetic data fitting: (<b>a</b>) pseudo-first-order kinetic model fitting; (<b>b</b>) pseudo-second-order kinetic model fitting.</p>
Full article ">Figure 17
<p>Comparison between: (<b>a</b>) PVDF/TiO<sub>2</sub>, polypropylene (PP)/carbon-coated TiO<sub>2</sub>, and PP/TiO<sub>2</sub> systems; (<b>b</b>) PMR, wetted wall photocatalytic reactor (WWPR), and tubular reactor (TR).</p>
Full article ">
9 pages, 1291 KiB  
Article
A Critical Study of the Effect of Polymeric Fibers on the Performance of Supported Liquid Membranes in Sample Microextraction for Metals Analysis
by Rafael J. González-Álvarez, José A. López-López, Juan J. Pinto and Carlos Moreno
Membranes 2020, 10(10), 275; https://doi.org/10.3390/membranes10100275 - 5 Oct 2020
Cited by 1 | Viewed by 2026
Abstract
Popularity of hollow fiber-supported liquid membranes (HF-SLM) for liquid-phase microextraction (HF-LPME) has increased in the last decades. In particular, HF-SLM are applied for sample treatment in the determination and speciation of metals. Up to the date, optimization of preconcentration systems has been focused [...] Read more.
Popularity of hollow fiber-supported liquid membranes (HF-SLM) for liquid-phase microextraction (HF-LPME) has increased in the last decades. In particular, HF-SLM are applied for sample treatment in the determination and speciation of metals. Up to the date, optimization of preconcentration systems has been focused on chemical conditions. However, criteria about fiber selection are not reflected in published works. HFs differ in pore size, porosity, wall thickness, etc., which can affect efficiency and/or selectivity of chemical systems in extraction of metals. In this work, Ag+ transport using tri-isobutylphosphine sulfide (TIBPS) has been used as a model to evaluate differences in metal transport due to the properties of three different fibers. Accurel PP 50/280 fibers, with a higher effective surface and smaller wall thickness, showed the highest efficiency for metal transport. Accurel PP Q3/2 exhibited intermediate efficiency but easier handling and, finally, Accurel PP S6/2 fibers, with a higher wall thickness, offered poorer efficiency but the highest stability and capability for metal speciation. Summarizing, selection of the polymeric support of HF-SLM is a key factor in their applicability of LPME for metals in natural waters. Full article
Show Figures

Figure 1

Figure 1
<p>Variation of enrichment factor (<span class="html-italic">EF</span>) with (<b>a</b>) NO<sub>3</sub><sup>−</sup> for tri-isobutylphosphine sulfide (TIBPS) 0.01 M, S<sub>2</sub>O<sub>3</sub><sup>2−</sup> 0.1 M, (<b>b</b>) TIBPS for NO<sub>3</sub><sup>−</sup> 0.1 M, S<sub>2</sub>O<sub>3</sub><sup>2−</sup> 0.1 M, and (<b>c</b>) S<sub>2</sub>O<sub>3</sub><sup>2−</sup> for NO<sub>3</sub><sup>−</sup> 0.1 M, TIBPS 0.1 M for tested hollow fibers: ♦ Accurel PP 50/280, ■ Accurel PP Q3/2 ▲ Accurel PP S6/2. <b>Dotted line</b> represents 20 μL acceptor solution and <b>S</b><b>olid line</b> represents 40 μL acceptor solution.</p>
Full article ">Figure 2
<p>Variation of <span class="html-italic">EF</span> with (<b>a</b>) stirring speed and (<b>b</b>) time for the three evaluated hollow fiber types: ♦ Accurel PP 50/280, ■ Accurel PP Q3/2, and ▲ Accurel PP S6/2. <b>Dotted line</b> represents 20 μL acceptor solution and <b>S</b><b>olid line</b> represents 40 μL acceptor solution.</p>
Full article ">Figure 3
<p>Variation of <span class="html-italic">EF</span> against DOC concentration in samples for the three evaluated hollow fiber types: ♦ Accurel PP 50/280, ■ Accurel PP Q3/2, and ▲ Accurel PP S6/2. Time of extraction 120 min. <b>Dotted line</b> represents 20 μL acceptor solution and <b>S</b><b>olid line</b> represents 40 μL acceptor solution</p>
Full article ">Figure 4
<p>Variation of <span class="html-italic">EF</span> against Cl<sup>−</sup> concentration in samples for the three evaluated hollow fiber types: ♦ Accurel PP 50/280, ■ Accurel PP Q3/2, and ▲ Accurel PP S6/2. Time of extraction 120 min. <b>Dotted line</b> represents 20 μL acceptor solution and <b>S</b><b>olid line</b> represents 40 μL acceptor solution.</p>
Full article ">
12 pages, 1817 KiB  
Article
Membranes for Modelling Cardiac Tissue Stiffness In Vitro Based on Poly(trimethylene carbonate) and Poly(ethylene glycol) Polymers
by Iris Allijn, Marcelo Ribeiro, André Poot, Robert Passier and Dimitrios Stamatialis
Membranes 2020, 10(10), 274; https://doi.org/10.3390/membranes10100274 - 3 Oct 2020
Cited by 15 | Viewed by 3113
Abstract
Despite the increased expenditure of the pharmaceutical industry on research and development, the number of drugs for cardiovascular diseases that reaches the market is decreasing. A major issue is the limited ability of the current in vitro and experimental animal models to accurately [...] Read more.
Despite the increased expenditure of the pharmaceutical industry on research and development, the number of drugs for cardiovascular diseases that reaches the market is decreasing. A major issue is the limited ability of the current in vitro and experimental animal models to accurately mimic human heart disease, which hampers testing of the efficacy of potential cardiac drugs. Moreover, many non-heart-related drugs have severe adverse cardiac effects, which is a major cause of drugs’ retraction after approval. A main hurdle of current in vitro models is their inability to mimic the stiffness of in vivo cardiac tissue. For instance, poly(styrene) petri dishes, which are often used in these models, have a Young’s modulus in the order of GPa, while the stiffness of healthy human heart tissue is <50 kPa. In pathological conditions, such as scarring and fibrosis, the stiffness of heart tissue is in the >100 kPa range. In this study, we focus on developing new membranes, with a set of properties for mimicry of cardiac tissue stiffness in vitro, based on methacrylate-functionalized macromers and triblock-copolymers of poly(trimethylene carbonate) and poly(ethylene glycol). The new membranes have Young’s moduli in the hydrated state ranging from 18 kPa (healthy tissue) to 2.5 MPa (pathological tissue), and are suitable for cell contraction studies using human pluripotent stem-cell-derived cardiomyocytes. The membranes with higher hydrophilicity have low drug adsorption and low Young’s moduli and could be suitable for drug screening applications. Full article
(This article belongs to the Special Issue Membrane Systems for Tissue Engineering 2020)
Show Figures

Graphical abstract

Graphical abstract
Full article ">Figure 1
<p>Ring-opening polymerization and functionalization schematic for photo-crosslinkable macromers. (<b>a</b>) Hexanediol was used as an initiator for the ring-opening polymerization of trimethylene carbonate (TMC), resulting in two-armed poly-TMC (PTMC), which was functionalized with MAAh, giving PTMC-dMA. (<b>b</b>) Commercial polyethylene glycol (PEG) (<span class="html-italic">M</span>n = 10 kg/mol) was used as an initiator for TMC polymerization, resulting in a triblock-copolymer, which subsequently was functionalized into PTMC-PEG-PTMC-dMA. (<b>c</b>) Commercial PEG (<span class="html-italic">M</span>n = 10 kg/mol) was functionalized, resulting in PEG-dMA.</p>
Full article ">Figure 2
<p>Mechanical properties and buffer uptake of the membranes. (<b>a</b>) Stress-strain curves of the membranes, with an inset of the first 300% strain. (<b>b</b>) Ashby plot of the Young’s modulus (bars, left Y-axis) vs. the buffer uptake (dots, right Y-axis) of the membranes. The dotted line indicates the maximum physiological stiffness of 50 kPa (<b>c</b>) Elongation at break of the membranes. * <span class="html-italic">p</span> &lt; 0.05, ** <span class="html-italic">p</span> &lt; 0.01, *** <span class="html-italic">p</span> &lt; 0.001.</p>
Full article ">Figure 3
<p>Verapamil adsorption to the membranes. (<b>a</b>) Chemical structure of verapamil hydrochloride and important physicochemical properties for drug development and adsorption studies. (<b>b</b>) Verapamil adsorption to the uncoated membranes and PDMS as control after 3 h. Data are the results of three experiments and depicted as mean ± SEM.</p>
Full article ">Figure 4
<p>Cardiomyocyte (CM) contraction behavior and shape. (<b>a</b>) Degree of contraction of the CMs (bars, left Y-axis) in relation to the Young’s modulus (dots, right Y-axis) shows an increased contraction for a decreased Young’s modulus. (<b>b</b>) Cell-spreading circumference of the relaxed CMs is significantly lower for the stiff substrates glass and PTMC (M1). (<b>c</b>) Shape as defined by the CM circumferences. * <span class="html-italic">p</span> &lt; 0.05, ** <span class="html-italic">p</span> &lt; 0.01, *** <span class="html-italic">p</span> &lt; 0.001 (<a href="#app1-membranes-10-00274" class="html-app">Supplementary Video</a>).</p>
Full article ">
31 pages, 3711 KiB  
Review
Vertically Aligned Carbon Nanotube Membranes: Water Purification and Beyond
by Jeong Hoon Lee, Han-Shin Kim, Eun-Tae Yun, So-Young Ham, Jeong-Hoon Park, Chang Hoon Ahn, Sang Hyup Lee and Hee-Deung Park
Membranes 2020, 10(10), 273; https://doi.org/10.3390/membranes10100273 - 2 Oct 2020
Cited by 18 | Viewed by 6483
Abstract
Vertically aligned carbon nanotube (VACNT) membranes have attracted significant attention for water purification owing to their ultra-high water permeability and antibacterial properties. In this paper, we critically review the recent progresses in the synthesis of VACNT arrays and fabrication of VACNT membrane methods, [...] Read more.
Vertically aligned carbon nanotube (VACNT) membranes have attracted significant attention for water purification owing to their ultra-high water permeability and antibacterial properties. In this paper, we critically review the recent progresses in the synthesis of VACNT arrays and fabrication of VACNT membrane methods, with particular emphasis on improving water permeability and anti-biofouling properties. Furthermore, potential applications of VACNT membranes other than water purification (e.g., conductive membranes, electrodes in proton exchange membrane fuel cells, and solar electricity–water generators) have been introduced. Finally, future outlooks are provided to overcome the limitations of commercialization and desalination currently faced by VACNT membranes. This review will be useful to researchers in the broader scientific community as it discusses current and new trends regarding the development of VACNT membranes as well as their potential applications. Full article
(This article belongs to the Special Issue Carbon-Based Nanocomposite Membranes)
Show Figures

Figure 1

Figure 1
<p>Schematic of a vertically aligned carbon nanotube (VACNT) membrane used for water treatment. The image shows water molecules, unwanted molecules, and an impermeable material filling the interstitial spaces between carbon nanotubes (CNTs) and VACNTs.</p>
Full article ">Figure 2
<p>Three major methods to synthesize vertically-aligned carbon nanotubes (VACNT): (<b>a</b>) arc discharge, (<b>b</b>) laser ablation, and (<b>c</b>) chemical vapor deposition (CVD).</p>
Full article ">Figure 3
<p>Illustration of possible pathways for water transportation in a CNT/polymer blend membrane due to (<b>1</b>) hydrophobic effect-enhanced transport, (<b>2</b>) nano-confinement-enhanced flux, (<b>3</b>) ultrafast transport through the CNT pores, and (<b>4</b>) direct transport through the membrane matrix [<a href="#B79-membranes-10-00273" class="html-bibr">79</a>].</p>
Full article ">Figure 4
<p>General schematic of vertically aligned carbon nanotube (VACNT) arrays synthesis and the VACNT membrane fabrication process without densification.</p>
Full article ">Figure 5
<p>Analysis of water permeability according to pore densities of vertically aligned carbon nanotube (VACNT) membranes reported in the literature [<a href="#B17-membranes-10-00273" class="html-bibr">17</a>,<a href="#B18-membranes-10-00273" class="html-bibr">18</a>,<a href="#B70-membranes-10-00273" class="html-bibr">70</a>,<a href="#B73-membranes-10-00273" class="html-bibr">73</a>,<a href="#B75-membranes-10-00273" class="html-bibr">75</a>,<a href="#B86-membranes-10-00273" class="html-bibr">86</a>,<a href="#B95-membranes-10-00273" class="html-bibr">95</a>,<a href="#B96-membranes-10-00273" class="html-bibr">96</a>,<a href="#B97-membranes-10-00273" class="html-bibr">97</a>,<a href="#B98-membranes-10-00273" class="html-bibr">98</a>].</p>
Full article ">Figure 6
<p>Analysis of water permeability according to the average carbon nanotube (CNT) inner diameter of vertically aligned CNT (VACNT) membranes [<a href="#B17-membranes-10-00273" class="html-bibr">17</a>,<a href="#B18-membranes-10-00273" class="html-bibr">18</a>,<a href="#B70-membranes-10-00273" class="html-bibr">70</a>,<a href="#B73-membranes-10-00273" class="html-bibr">73</a>,<a href="#B75-membranes-10-00273" class="html-bibr">75</a>,<a href="#B86-membranes-10-00273" class="html-bibr">86</a>,<a href="#B95-membranes-10-00273" class="html-bibr">95</a>,<a href="#B96-membranes-10-00273" class="html-bibr">96</a>,<a href="#B97-membranes-10-00273" class="html-bibr">97</a>,<a href="#B98-membranes-10-00273" class="html-bibr">98</a>].</p>
Full article ">Figure 7
<p>Antibacterial activities of vertically aligned carbon nanotube (VACNT) membranes. Scanning electron microscope (SEM) images of interaction between the L929 fibroblasts cells and the aligned multi-wall carbon nanotube (MWCNT) (<b>a</b>) after 48 h of incubation and (<b>b</b>) after 7 days of incubation [<a href="#B105-membranes-10-00273" class="html-bibr">105</a>]. Confocal laser scanning microscopy (CLSM) images after biofouling occurrence for 600 min on the (<b>c</b>) VACNT membrane and (<b>d</b>) UF membrane (green: live cells, red: dead cells) [<a href="#B17-membranes-10-00273" class="html-bibr">17</a>]. (<b>e</b>) Flux (J/J<sub>0</sub>) declines over time for the VACNT membrane and the ultrafiltration (UF) membrane operated with the feed solutions of activated sludge. (<b>f</b>) Fouling resistance (R<sub>f</sub>) of the UF and VACNT membranes fouled by <span class="html-italic">Pseudomonas aeruginosa</span> (PA14), <span class="html-italic">Staphylococcus aureus</span> (SA) and activated sludge (AS) solution [<a href="#B104-membranes-10-00273" class="html-bibr">104</a>].</p>
Full article ">Figure 8
<p>Applications of vertically aligned carbon nanotube (VACNT) membranes exploiting their electrical conductivity. (<b>a</b>) Nyquist plots of VACNT and Nafion membranes under ambient (left) and wet (right) conditions [<a href="#B93-membranes-10-00273" class="html-bibr">93</a>]. (<b>b</b>) Peak photocurrent generated in a VACNT membrane upon irradiation with 440 nm light (blue). Troughs occur when the light source is physically blocked, preventing irradiation. The red signal corresponds to the same experiment performed as a control on a VACNT membrane without quantum dots on the surface [<a href="#B77-membranes-10-00273" class="html-bibr">77</a>]. (<b>c</b>) Simultaneous 2,4,6-trichlorophenol (TCP) oxidation and peroxymonosulfate (PMS) reduction in the reaction system partitioned into two chambers by a VACNT membrane [<a href="#B129-membranes-10-00273" class="html-bibr">129</a>].</p>
Full article ">Figure 9
<p>Concept of VACNT electrodes [<a href="#B131-membranes-10-00273" class="html-bibr">131</a>].</p>
Full article ">Figure 10
<p>Schematic of synergistic tandem solar electricity–water generator and photograph of the VACNT-embedded ethylene vinyl acetate membrane [<a href="#B135-membranes-10-00273" class="html-bibr">135</a>].</p>
Full article ">Figure 11
<p>Various fabrication methods for large-scale manufacturing of vertically aligned carbon nanotube (VACNT) membranes. (<b>a</b>) Side-view SEM image of carbon nanotubes placed vertically on a polyvinylidene fluoride (PVDF) membrane filter [<a href="#B76-membranes-10-00273" class="html-bibr">76</a>]. (<b>b</b>) Schematic of the fabrication procedure of a zwitterion-functionalized single-walled CNT/polyamide (Z-SWNT/PA) nanocomposite membrane [<a href="#B140-membranes-10-00273" class="html-bibr">140</a>]. (<b>c</b>) SEM images of membranes with SWNT bundles protruding from the bottom surface. (<b>d</b>) Schematic representation of the E-field-assisted solvent deposition technique [<a href="#B88-membranes-10-00273" class="html-bibr">88</a>]. (<b>e</b>) Flexible VACNT membrane obtained by in-situ polymerization [<a href="#B74-membranes-10-00273" class="html-bibr">74</a>].</p>
Full article ">
14 pages, 1683 KiB  
Article
Hydration and Diffusion of H+, Li+, Na+, Cs+ Ions in Cation-Exchange Membranes Based on Polyethylene- and Sulfonated-Grafted Polystyrene Studied by NMR Technique and Ionic Conductivity Measurements
by Vitaliy I. Volkov, Alexander V. Chernyak, Daniil V. Golubenko, Vladimir A. Tverskoy, Georgiy A. Lochin, Ervena S. Odjigaeva and Andrey B. Yaroslavtsev
Membranes 2020, 10(10), 272; https://doi.org/10.3390/membranes10100272 - 1 Oct 2020
Cited by 23 | Viewed by 4416
Abstract
The main particularities of sulfonate groups hydration, water molecule and alkaline metal cation translation mobility as well as ionic conductivity were revealed by NMR and impedance spectroscopy techniques. Cation-exchange membranes MSC based on cross-linked sulfonated polystyrene (PS) grafted on polyethylene with ion-exchange capacity [...] Read more.
The main particularities of sulfonate groups hydration, water molecule and alkaline metal cation translation mobility as well as ionic conductivity were revealed by NMR and impedance spectroscopy techniques. Cation-exchange membranes MSC based on cross-linked sulfonated polystyrene (PS) grafted on polyethylene with ion-exchange capacity of 2.5 mg-eq/g were investigated. Alkaline metal cation hydration numbers (h) calculated from temperature dependences of 1H chemical shift of water molecule for membranes equilibrated with water vapor at RH = 95% are 5, 6, and 4 for Li+, Na+, and Cs+ ions, respectively. These values are close to h for equimolar aqueous salt solutions. Water molecules and counter ions Li+, Na+, and Cs+ diffusion coefficients were measured by pulsed field gradient NMR on the 1H, 7Li, 23Na, and 133Cs nuclei. For membranes as well as for aqueous chloride solutions, cation diffusion coefficients increased in the following sequence: Li+ < Na+ < Cs+. Cation and water molecule diffusion activation energies in temperature range from 20 °C to 80 °C were close to each other (about 20 kJ/mol). The cation conductivity of MSC membranes is in the same sequence, Li+ < Na+ < Cs+ << H+. The conductivity values calculated from the NMR diffusion coefficients with the use of the Nernst–Einstein equation are essentially higher than experimentally determined coefficients. The reason for this discrepancy is the heterogeneity of membrane pore and channel system. Ionic conductivity is limited by cation transfer in narrow channels, whereas the diffusion coefficient characterizes ion mobility in wide pores first of all. Full article
(This article belongs to the Special Issue Membranes for Water and Wastewater Treatment)
Show Figures

Figure 1

Figure 1
<p>Stimulated echo pulse sequence with the magnetic field gradient pulses.</p>
Full article ">Figure 2
<p>Spin echo attenuation (diffusion decay) of water molecule <sup>1</sup>H nuclei in Li<sup>+</sup> ionic form (<b>a</b>), Na<sup>+</sup> ionic form (<b>b</b>) and Cs<sup>+</sup> ionic form (<b>c</b>) of MSC membrane; RH = 95%, T = 293K. Dots are experimental curves; straight lines are decomposition on D<sub>1</sub>, D<sub>2</sub>, D<sub>3</sub> components from Equation (4). Components of diffusion coefficients D<sub>1</sub>, D<sub>2</sub>, and D<sub>3</sub> and relative parts p<sub>1</sub>, p<sub>2</sub>, and p<sub>3</sub> are the next. For Li<sup>+</sup> ionic form, MSC D<sub>1</sub> = (2.4 ± 0.5) 10<sup>−13</sup> m<sup>2</sup>/s, D<sub>2</sub> = (5.0 ± 0.5)·10<sup>−10</sup> m<sup>2</sup>/s, D<sub>3</sub> = (1.3 ± 0.5)∙10<sup>−9</sup> m<sup>2</sup>/s and (0.08 ± 0.01), (0.53 ± 0.05), (0.39 ± 0.05), correspondingly. For Na<sup>+</sup> ionic form, MSC (4.5 ± 0.5)·10<sup>−13</sup> m<sup>2</sup>/s, (7.8 ± 1)·10<sup>−10</sup> m<sup>2</sup>/s, (1.5 ± 0.5)·10<sup>−9</sup> m<sup>2</sup>/s and (0.1 ± 0.015), (0.44 ± 0.05), (0.46 ± 0.05), correspondingly. For Cs<sup>+</sup> ionic form MSC D<sub>1</sub> = (3.4 ± 0.3) 10<sup>−13</sup> m<sup>2</sup>/s, D<sub>2</sub> = (1.1 ± 0.2)·10<sup>−9</sup> m<sup>2</sup>/s, D<sub>3</sub> = (1.7 ± 0.2)·10<sup>−9</sup> m<sup>2</sup>/s, and (0.13 ± 0.1), (0.49 ± 0.05), (0.38 ± 0.04), correspondingly.</p>
Full article ">Figure 3
<p>Chemical shift of water molecule <sup>1</sup>H nuclear temperature dependences in Li<sup>+</sup>(1), Na<sup>+</sup>(2) Cs<sup>+</sup>(3) ionic forms at RH = 95%.</p>
Full article ">Figure 4
<p>Water molecule and cation diffusion coefficient concentration dependences in lithium, sodium, cesium chloride aqueous solutions. 1–H<sub>2</sub>O in LiCl, 2–H<sub>2</sub>O in NaCl, 3–H<sub>2</sub>O in CsCl. 1′–Li<sup>+</sup> in LiCl, 2′–Na<sup>+</sup> in NaCl, 3′–Cs<sup>+</sup> in CsCl.</p>
Full article ">Figure 5
<p>Diffusion decays of <sup>7</sup>Li (<b>a</b>), <sup>23</sup>Na (<b>b</b>), <sup>133</sup>Cs (<b>c</b>) nuclei NMR signals in appropriate ionic form of MSC membrane at RH = 95% and different temperatures 1–20 °C, 2–30 °C, 3–40 °C, 4–50 °C, 5–60 °C, 6–70 °C, 7–80 °C.</p>
Full article ">Figure 6
<p>Temperature dependences of Cs+, Na+, and Li+ diffusion coefficients in appropriate ionic form of MSC membrane at RH = 95%: 1–Cs+ ionic form, Ea = 18.1 kJ/mol; 2–Na+ ionic form, Ea = 16.5 kJ/mol; 3–Li<sup>+</sup> ionic form, E<sub>a</sub> = 17.6 kJ/mol.</p>
Full article ">Figure 7
<p>Temperature dependences of experimental σ<sub>exp</sub> (1–4) and calculated σ<sub>calc</sub> (2′–4′) ionic conductivities in H<sup>+</sup> (1), Li<sup>+</sup> (2) and (2‘), Na<sup>+</sup> (3) and (3′), and Cs<sup>+</sup> (4) and (4′) ionic forms of MSC membrane at RH = 95%.</p>
Full article ">Figure 8
<p>1H chemical shift dependences on concentration of LiCl (1), NaCl (2), and CsCl (3) aqueous solutions.</p>
Full article ">Figure 9
<p><sup>7</sup>Li (1), <sup>23</sup>Na (2), and <sup>133</sup>Cs (3) nuclear NMR chemical shift concentration dependences in lithium, sodium, cesium chloride aqueous solutions.</p>
Full article ">
14 pages, 2259 KiB  
Article
An Efficient Method to Determine Membrane Molecular Weight Cut-Off Using Fluorescent Silica Nanoparticles
by Mariam Fadel, Yvan Wyart and Philippe Moulin
Membranes 2020, 10(10), 271; https://doi.org/10.3390/membranes10100271 - 1 Oct 2020
Cited by 6 | Viewed by 4480
Abstract
Membrane processes have revolutionized many industries because they are more energy and environmentally friendly than other separation techniques. This initial selection of the membrane for any application is based on its Molecular Weight Cut-Off (MWCO). However, there is a lack of a quantitative, [...] Read more.
Membrane processes have revolutionized many industries because they are more energy and environmentally friendly than other separation techniques. This initial selection of the membrane for any application is based on its Molecular Weight Cut-Off (MWCO). However, there is a lack of a quantitative, liable, and rapid method to determine the MWCO of the membrane. In this study, a methodology to determine the MWCO, based on the retention of fluorescent silica nanoparticles (NPs), is presented. Optimized experimental conditions (Transmembrane pressure, filtration duration, suspension concentration, etc.) have been performed on different membranes MWCO. Filtrations with suspension of fluorescent NPs of different diameters 70, 100, 200 and 300 nm have been examined. The NPs sizes were selected to cover a wide range in order to study NPs diameters larger, close to, and smaller than the membrane pore size. A particle tracking analysis with a nanosight allows us to calculate the retention curves at all times. The retention rate curves were shifted over the filtration process at different times due to the fouling. The mechanism of fouling of the retained NPs explains the determined value of the MWCO. The reliability of this methodology, which presents a rapid quantitative way to determine the MWCO, is in good agreement with the value given by the manufacturer. In addition, this methodology gives access to the retention curve and makes it possible to determine the MWCO as a function of the desired retention rate. Full article
(This article belongs to the Special Issue Membranes: 10th Anniversary)
Show Figures

Graphical abstract

Graphical abstract
Full article ">Figure 1
<p>Schematic representation of various fouling mechanisms by particulate foulants [<a href="#B36-membranes-10-00271" class="html-bibr">36</a>].</p>
Full article ">Figure 2
<p>Nanoparticle size distribution curves (NPs) of the initial solutions (feed): NPs 70; 100; 200 and 300 nm, used in the filtrations.</p>
Full article ">Figure 3
<p>Schematic diagram of the vertical cross flow filtration set-up.</p>
Full article ">Figure 4
<p>Concentration distribution for each NP size of suspension of NPs100 nm using the Nanosight N300 analytical technique.</p>
Full article ">Figure 5
<p>(<b>A</b>) Particle size distribution of the feed and the permeate of NPs100 at 30 min of the filtration process with membrane M2, and (<b>B</b>) associated retention rate at 30 min of filtration of M2-NPs100 [Room temperature, TMP ~0.5 bar].</p>
Full article ">Figure 6
<p>Retention rate of NPs100 in function of NPs size for the filtration with membrane M2 over the time realized [TMP 0.5 bar].</p>
Full article ">Figure 7
<p>Retention rates of the different size of NPs with two membranes: (<b>A</b>) Membrane M1 with the initial suspension solution of NPs 200, NPs 100 and NPs 70 nm, and (<b>B</b>) Membrane M2 with the initial suspension solution of NPs 300, NPs200 and NPs100 nm. [TMP ~ 0.5 bar, room temperature].</p>
Full article ">Figure 8
<p>Retention rates of NPs 100 filtrated with membrane M2 of the two performed experiments: 1st and 2nd experiments carried out at same operating conditions.</p>
Full article ">Figure 9
<p>Fouling models found for NPs filtrations of (<b>A</b>) NPs 200 with membrane M1, (<b>B</b>) NPs 300 nm with membrane M2, (<b>C</b>) NPs 100 with membrane M1, (<b>D</b>) NPs 200 nm with membrane M2, (<b>E</b>) NPs 70 with membrane M1, and (<b>F</b>) NPs100 with membrane M2. The experiments are performed at same experimental conditions [TMP ~ 0.5 bar, room temperature].</p>
Full article ">
Previous Issue
Next Issue
Back to TopTop