[go: up one dir, main page]

Next Issue
Volume 8, September
Previous Issue
Volume 8, March


Vaccines, Volume 8, Issue 2 (June 2020) – 196 articles

Cover Story (view full-size image): 
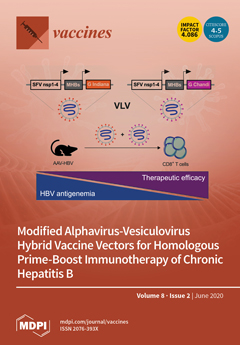
Virus-like vesicles (VLV) are a hybrid virus-based vaccine platform composed of Semliki Forest virus nonstructural proteins (NSP) and vesicular stomatitis virus glycoprotein (G). Using dual subgenomic promoters and an envelope glycoprotein switch, prime-boost immunization with VLV expressing the hepatitis B virus (HBV) middle S protein (MHBs) showed enhanced immunogenicity and efficacy in a chronic HBV mouse model based on HBV genome delivery to the liver with adeno-associated virus (AAV). Mice with lower or intermediate HBV antigen levels had a sustained reduction of HBV following VLV prime-boost immunization. However, mice with higher HBV antigen levels showed no changes in HBV persistence, emphasizing the importance of HBV antigenemia for implementing immunotherapies against chronic hepatitis B. View this paper.
  • Issues are regarded as officially published after their release is announced to the table of contents alert mailing list.
  • You may sign up for e-mail alerts to receive table of contents of newly released issues.
  • PDF is the official format for papers published in both, html and pdf forms. To view the papers in pdf format, click on the "PDF Full-text" link, and use the free Adobe Reader to open them.
Order results
Result details
Section
Select all
Export citation of selected articles as:
9 pages, 855 KiB  
Article
CD19+ CD24hi CD38hi Regulatory B Cells and Memory B Cells in Periodontitis: Association with Pro-Inflammatory and Anti-Inflammatory Cytokines
by Helal F. Hetta, Ibrahim M. Mwafey, Gaber El-Saber Batiha, Suliman Y. Alomar, Nahed A. Mohamed, Maggie A. Ibrahim, Abeer Elkady, Ahmed Kh. Meshaal, Hani Alrefai, Dina M. Khodeer and Asmaa M. Zahran
Vaccines 2020, 8(2), 340; https://doi.org/10.3390/vaccines8020340 - 26 Jun 2020
Cited by 24 | Viewed by 3924
Abstract
Regulatory B cells (Bregs) are unique subpopulations of B cells with immune-regulating or immune-suppressing properties and play a role in peripheral tolerance. Due to the current limitations of human Breg studies among periodontal diseases, in the present study, we tried to analyze the [...] Read more.
Regulatory B cells (Bregs) are unique subpopulations of B cells with immune-regulating or immune-suppressing properties and play a role in peripheral tolerance. Due to the current limitations of human Breg studies among periodontal diseases, in the present study, we tried to analyze the change in circulating Bregs, pro-inflammatory, and anti-inflammatory cytokines in patients with periodontitis. Peripheral blood from 55 patients with stage 2 periodontitis and 20 healthy controls was analyzed using flow cytometry to evaluate the frequency of CD19+CD24+CD38+ Breg cells. ELISA was used to assess the serum levels of the pro-inflammatory cytokines, including interleukins (IL)-1β, IL-6, TNF-α, and anti-inflammatory cytokines including IL-10, IL-35, and TGF-β. Increased proportions of Breg cells were observed in patients with stage 2 periodontitis compared to controls. Serum levels of cytokines were significantly higher in patients with periodontitis compared to controls. A significant positive correlation was observed between the frequencies of Breg cells and IL35 levels, IL10 levels, and TGF-β. In conclusion, our results suggest that the increase in peripheral Breg cells and serum cytokine levels among periodontitis patients seems to be closely associated with disease progression, a possible link between periodontitis, and systemic inflammatory process. Full article
(This article belongs to the Special Issue B and T Cell-Mediated Immunity)
Show Figures

Figure 1

Figure 1
<p>Flow cytometric detection of regulatory B cells and memory B cells. <b>A</b>: Forward and side scatter plot was used to define the lymphocytes population (R1). <b>B</b>: The CD19<sup>+</sup> cells (R2) were assessed within the lymphocyte population and then gated. <b>C</b>: The expression of CD24 and CD38 was assessed on CD19<sup>+</sup> cells to define CD19<sup>+</sup>CD24<sup>+high</sup>CD38<sup>+high</sup> cells (regulatory B cells). <b>D</b>: The expression of CD27 was assessed on CD19 to detect memory B cells (CD19<sup>+</sup> CD27<sup>+</sup>).</p>
Full article ">Figure 2
<p>A significant positive correlation between the frequency of Breg cells and (<b>a</b>) IL10 levels (r = 0.35, <span class="html-italic">p</span> = 0.008), (<b>b</b>) TGF-β (r = 0.55, <span class="html-italic">p</span> = 0.004), (<b>c</b>) IL35 levels (r = 0.3, <span class="html-italic">p</span> = 0.002).</p>
Full article ">
13 pages, 1614 KiB  
Article
Cross-Sectional Study on the Sero- and Viral Dynamics of Porcine Circovirus Type 2 in the Field
by Chao-Nan Lin, Ni-Jyun Ke and Ming-Tang Chiou
Vaccines 2020, 8(2), 339; https://doi.org/10.3390/vaccines8020339 - 26 Jun 2020
Cited by 10 | Viewed by 3260
Abstract
Porcine circovirus-associated diseases (PCVADs) cause considerable economic losses in industrial pork production in the field. To minimize the economic losses due to PCVAD, porcine circovirus type 2 (PCV2) vaccines have been developed, and there is widespread vaccination worldwide today. However, limited information is [...] Read more.
Porcine circovirus-associated diseases (PCVADs) cause considerable economic losses in industrial pork production in the field. To minimize the economic losses due to PCVAD, porcine circovirus type 2 (PCV2) vaccines have been developed, and there is widespread vaccination worldwide today. However, limited information is available concerning the current status of PCV2 infection in the field on the Asian continent. The present study aimed to assess sero- and viral dynamics of PCV2 from 12 PCV2-contaminated pig herds with vaccination against PCV2 in Southern and Central Taiwan. In particular, the level of PCV2 load during the window period for seroconversion using real-time polymerase chain reaction and a commercial enzyme-linked immunosorbent assay (ELISA) kit. Our results revealed that pig herds showed slight or no seroconversion after three to four weeks post-PCV2 immunization. The presence of PCV2 was observed during the window period for seroconversion in all herds. In conclusion, natural exposure of PCV2 occurs in the growing to fattening period, and viremia can last until slaughter. Additionally, our findings indicate that using ELISA showed the level of antibodies and aided in the understanding and surveillance of the current PCV2 status in the field. Full article
(This article belongs to the Section Veterinary Vaccines)
Show Figures

Figure 1

Figure 1
<p>Comparison of maternally derived antibodies (MDA) of porcine circovirus type 2 (PCV2) on suckling piglets (only from 3 to 4-week-old piglets without PCV2 vaccination) born from different sow immunization programs against PCV2. A: sows without PCV2 vaccination; B: sows with mass vaccination; C: sow vaccination at 2–4 weeks pre-farrowing. Student’s <span class="html-italic">t</span>-test was used to assess differences in the presence of PCV2 MDA from suckling piglets born from different sow vaccination programs against PCV2. <span class="html-italic">p</span> values &lt;0.05, &lt;0.01, and &lt;0.001 were considered statistically significant, highly significant, and very highly significant, respectively.</p>
Full article ">Figure 2
<p>Serodynamic profile of porcine circovirus type 2 (PCV2) measured by BioCheck ELISA in different aged pigs born from different sow immunization programs against PCV2 from different farms. (<b>a</b>) sows without PCV2 vaccination (Farms A, B, C, and D); (<b>b</b>) sows with mass PCV2 vaccination (Farms E, F, G, and H); (<b>c</b>) PCV2 vaccination in sows at 2-4 weeks pre-farrowing (Farms I, J, K, and L).</p>
Full article ">Figure 3
<p>Viremia loads (line graph, left Y axis) and detection rate (bar chart, right Y axis) of porcine circovirus type 2 (PCV2) in pigs born from sows without PCV2 vaccination group, Farms A, B, C, and D. The error bars show the standard deviation (SD) of positive samples.</p>
Full article ">Figure 4
<p>Viremia loads (line graph, left Y axis) and detection rate (bar chart, right Y axis) of porcine circovirus type 2 (PCV2) in pigs born from the sow mass PCV2 vaccination group, Farms E, F, G, and H. The error bars show the standard deviation (SD) of positive samples.</p>
Full article ">Figure 5
<p>Viremia loads (line graph, left Y axis) and detection rate (bar chart, right Y axis) of porcine circovirus type 2 (PCV2) in pigs born from PCV2 vaccination in sows at 2–4 weeks pre-farrowing, Farms I, J, K, and L. The error bars show the standard deviation (SD) of positive samples.</p>
Full article ">
24 pages, 1926 KiB  
Article
Establishing a Robust Manufacturing Platform for Recombinant Veterinary Vaccines: An Adenovirus-Vector Vaccine to Control Newcastle Disease Virus Infections of Poultry in Sub-Saharan Africa
by Omar Farnós, Esayas Gelaye, Khaled Trabelsi, Alice Bernier, Kumar Subramani, Héla Kallel, Martha Yami and Amine A. Kamen
Vaccines 2020, 8(2), 338; https://doi.org/10.3390/vaccines8020338 - 26 Jun 2020
Cited by 9 | Viewed by 6442
Abstract
Developing vaccine technology platforms to respond to pandemic threats or zoonotic diseases is a worldwide high priority. The risk of infectious diseases transmitted from wildlife and domestic animals to humans makes veterinary vaccination and animal health monitoring highly relevant for the deployment of [...] Read more.
Developing vaccine technology platforms to respond to pandemic threats or zoonotic diseases is a worldwide high priority. The risk of infectious diseases transmitted from wildlife and domestic animals to humans makes veterinary vaccination and animal health monitoring highly relevant for the deployment of public health global policies in the context of “one world, one health” principles. Sub-Saharan Africa is frequently impacted by outbreaks of poultry diseases such as avian influenza and Newcastle Disease (ND). Here, an adenovirus-vectored vaccine technology platform is proposed for rapid adaptation to ND or other avian viral threats in the region. Ethiopian isolates of the Newcastle Disease virus (NDV) were subjected to sequence and phylogenetic analyses, enabling the construction of antigenically matched vaccine candidates expressing the fusion (F) and hemagglutinin-neuraminidase (HN) proteins. A cost-effective vaccine production process was developed using HEK293 cells in suspension and serum-free medium. Productive infection in bioreactors (1–3 L) at 2 × 10⁶ cells/mL resulted in consistent infectious adenoviral vector titers of approximately 5–6 × 10⁸ TCID50/mL (approximately 1011VP/mL) in the harvest lysates. Groups of chickens were twice immunized with 1 × 10¹⁰ TCID50 of the vectors, and full protection against a lethal NDV challenge was provided by the vector expressing the F antigen. These results consolidate the basis for a streamlined and scalable-vectored vaccine manufacturing process for deployment in low- and medium-income countries. Full article
Show Figures

Figure 1

Figure 1
<p>Nonreplicating chicken codon-optimized recombinant adenovirus constructions as vaccine candidates against Newcastle Disease virus (NDV): The schematic representation of the adenoviral constructs shows the regulatory regions for the control of expression and the fusion and hemagglutinin-neuraminidase proteins of NDV. The expression of the foreign antigens is driven either by a fragment of the human Cytomegalovirus (CMV) enhancer/promoter or by the avian β-actin promoter, as indicated. The adenoviral vectors have been designed to carry one or two (head-to-tail oriented) expression units for the individual expression or the co-expression of the NDV antigens. One of the constructs carries both the hemagglutinin-neuraminidase protein and the green fluorescent protein for monitoring and quantification during the process development steps implemented at different scales.</p>
Full article ">Figure 2
<p>Effect of two different culture media and feeding supplements on HEK293SF cell density and viability (in percent) in shake flask experiments: HyCell TransFx-H media (Hyclone Laboratories Inc) and HEK-GM (Xell AG, Bielefeld, Germany) were used in the assay for comparative purposes, including the use of feeding supplements following essentially each manufacturer’s recommendations. Supplements consisted of a bolus addition. The feeding supplement HEK-FS (Xell AG, Bielefeld, Germany) was added starting from day 2 of the culture at 3% (v/v), then increasing to 4, then 5% (v/v), and finally 10% until the end of the culture at day 12. The HyCell TransFx-H medium was supplemented with CellBoost 5 (GE Healthcare, Chicago, IL, USA, USA) every two days by adding the feeding bolus at 5% (v/v). The higher cell densities were achieved with the HEK-GM basal medium and with the HEK-GM + HEK-FS combination, in which 1 × 10<sup>7</sup> cells/mL and 1.3 × 10<sup>7</sup> cells/mL were reached, respectively, after 9 days in culture. High cell densities (around 1 × 10<sup>7</sup> cells/mL) were also reached by day 8 with the combination of HyCell TransFx-H and its feeding supplement. The complete assessment was conducted in duplicate, and each point corresponds to the mean ± standard deviation (bars in both senses are shown in the figure).</p>
Full article ">Figure 3
<p>Adenovirus production in shake flasks experiments and evaluation of cell culture parameters and infection conditions for increased virus per cell production yields: Infection experiments were conducted with the recombinant Ad-HN-GFP-CMV adenoviral vector in order to monitor parameters in both phases of the culture. Two different culture media were evaluated: HyCell TransFx-H and Xell AG HEK-GM. In this approach, cells were cultured in batch until reaching densities of 1, 2, 4, and 6 × 10<sup>6</sup>/mL (this last value is only for HEK-GM), and viral infection was initiated at each of these points. The effect of cell density on the specific cell yield was evident when a decrease in specific production was observed at higher cell densities, indicating a metabolic limitation. A feed supplement was added at each cell concentration at the time of infection, using paralleled cultures and following the regimens explained in Materials and Methods. It was demonstrated at every cell density analyzed that feeding significantly increased the specific production yield (IVP/cell) of the cultures compared to the non-supplemented cultures. The highest values of cell specific yields (calculated from fluorescence values detected by flow cytometry) were reached in both media by infection at 2M cells/mL. The combination HEK-GM + HEK FS resulted in the highest specific production and was used either in shake flasks or for the scale-up to bioreactors. The experiment was conducted in duplicate and deviations between replicates are indicated in the figure by standard deviations bars in the positive sense.</p>
Full article ">Figure 4
<p>Adenoviral vector production in 1 L controlled bioreactors operated in batch mode: (<b>A</b>) Time course of viable cell growth and cell viability during the production of the three recombinant adenoviral vectors encoding the F, HN, and F-HN antigens from NDV under the regulation of the CMV enhancer/promoter. The culture medium was Xell AG HEK-GM and the operational parameters were described in the Materials and Methods section. The time of infection was set at a cell density of 2 × 10<sup>6</sup> cells/mL as indicated in the figure, and the cultures were harvested when cell viability reached approximately 60–70%. The cell density data are shown by solid symbols and solid lines, and the percentage of cell viability is shown by empty symbols and dotted lines. The infections were conducted with the different adenoviral vectors; ∆, Ad-F-CMV; —, Ad-HN-CMV; ◊, Ad-F-HN-CMV. (<b>B</b>) Production of infectious viral particles per mL in the cell culture lysate supernatants analyzed at different time points using culture samples taken during the run. Calculations of TCID<sub>50</sub>/mL values were performed as described. They were in the range of 1.3 to 2.2 × 10<sup>8</sup> TCID<sub>50</sub>/mL.</p>
Full article ">Figure 5
<p>Adenoviral vector production in a 3 L controlled bioreactor operated in fed-batch mode for the production of one adenoviral vector as vaccine candidate: (<b>A</b>) Time course of the viable and total cell growth in Xell AG HEK-GM medium in which the feed supplement was initiated at a cell concentration of 1 × 10<sup>6</sup> cells/mL as indicated in the figure. The infection was set at a cell density of 2 × 10<sup>6</sup> cells/mL, and the final cell density during the virus production phase reached 4.56 × 10<sup>6</sup> cells/mL. The cultures were strictly monitored and harvested when the cell viability reached approximately 60–70%. At harvest, the infectious viral particles of the Ad-F-HN-CMV produced reached 5.8 × 10<sup>8</sup> TCID<sub>50</sub>/mL in the cell culture lysate supernatants. In addition, the curve of the capacitance values (<b>B</b>) measured in-line shows the evident changes registered after infection with the adenoviral vector as the cells undergo the productive phase. The profile of various bioreactor sensors and process parameters are also shown (speed of agitation, pH, dissolved oxygen concentration, cumulative oxygen, and temperature). The onset of feeding supplementation is indicated with an arrow in panel A. The dotted line in both panels indicates the time point of infection and the shift in the culture phase.</p>
Full article ">Figure 6
<p>Analysis of the humoral immune response generated in mice against NDV after vaccination with the recombinant adenoviral vectors Ad-F-CMV, Ad-HN-CMV, Ad-F-HN-CMV, and Ad-GFP-CMV (negative control): Enzyme-Linked Immunosorbent Assays (ELISA) and Hemagglutination Inhibition Assay (HIA) assays were conducted for the detection of anti-F IgG antibodies and antibodies with HI activity, respectively, in the serum of vaccinated mice. Mice were immunized via i.m. injections at days 0 and 21 with doses of 10<sup>7</sup> TCID<sub>50</sub>. (<b>A</b>) The mean ± standard deviations of anti-F IgG antibody titers measured at days 0 and 60 of the experiment. Specific titers elicited by the Ad-F-CMV and the Ad-F-HN-CMV vectors increased over the indicated cutoff (&gt;993) for existence of protective immunity (dotted line). Both groups of animals, injected with the Ad-F-CMV or Ad-F-HN-CMV viruses, showed statistically significant differences compared to the negative controls. (<b>B</b>) The generation of antibodies with hemagglutination inhibition capacity in vitro is shown. Mean titers were calculated from values of antibodies with HI activity detected in serum of animals using the logarithm base 2 of the titer. In animals vaccinated with the Ad-HN-CMV and Ad-F-HN-CMV, this response was statistically superior to measurements in the negative control group. According to the routine practices at the NVI, different degrees of protection against NDV are achieved in chickens when HI titers over Log<sub>2</sub>(3) (dotted line). Statistically significant differences (<span class="html-italic">p</span> &lt; 0.05) are represented with one asterisk in the figure and two for <span class="html-italic">p</span> &lt; 0.01.</p>
Full article ">Figure 7
<p>Analysis of the humoral immune response generated in chickens against NDV-encoded antigens and assessment of the protective efficacy: The level of anti-NDV antibodies after immunization with the recombinant adenoviral vectors Ad-F-β-actin, Ad-F-CMV, and Ad-F-HN-CMV were evaluated by ELISA (<b>A</b>) for the detection of IgY-specific antibodies in the serum of chickens vaccinated via i.m. with two doses of 10<sup>10</sup>TCID<sub>50</sub>. Mean optical values were calculated from serum of individual animals. The figure shows the means ± standard deviations of optical density values representing the S/P ratio calculated as previously described. Specific antibodies were detected until the last determination, prior to the lethal challenge with NDV and were found to be over the S/P cutoff value of 0.3, one indicative of protective efficacy. Specific antibodies were not detected in the negative control groups. Statistically significant differences (<span class="html-italic">p</span> &lt; 0.05) are represented in the figure with an asterisk. (<b>B</b>) Eight weeks after the primary immunization, all chickens were intramuscularly challenged with 0.5 × 10<sup>6.5</sup> ELD<sub>50</sub> of the NDV isolate Debre/zeit/2018 (MN909678). A positive control group vaccinated with NDV live vaccine according to the manufacturer’s instructions as well as one group of non-vaccinated animals were included in the challenge. All chickens were monitored for 15 days to record the appearance of clinical signs of the disease and the total number of deaths. After this period, the percent survival was 100% for the groups vaccinated with the Ad-F-CMV and the NDV live vaccine, 80% for the group of chickens receiving the Ad-F-βactin vector, and 10% in the group vaccinated with the Ad-F-HN-CMV. One hundred percent of mortality and the typical signs of the disease were recorded in the group of non-immunized animals.</p>
Full article ">
21 pages, 3021 KiB  
Article
Features of the Human Antibody Response against the Respiratory Syncytial Virus Surface Glycoprotein G
by Kristina Borochova, Katarzyna Niespodziana, Katarina Stenberg Hammar, Marianne van Hage, Gunilla Hedlin, Cilla Söderhäll, Margarete Focke-Tejkl and Rudolf Valenta
Vaccines 2020, 8(2), 337; https://doi.org/10.3390/vaccines8020337 - 25 Jun 2020
Cited by 5 | Viewed by 3547
Abstract
Respiratory syncytial virus (RSV) infections are a major cause of serious respiratory disease in infants. RSV occurs as two major subgroups A and B, which mainly differ regarding the surface glycoprotein G. The G protein is important for virus attachment and G-specific antibodies [...] Read more.
Respiratory syncytial virus (RSV) infections are a major cause of serious respiratory disease in infants. RSV occurs as two major subgroups A and B, which mainly differ regarding the surface glycoprotein G. The G protein is important for virus attachment and G-specific antibodies can protect against infection. We expressed the surface-exposed part of A2 strain-derived G (A2-G) in baculovirus-infected insect cells and synthesized overlapping peptides spanning complete A2-G. The investigation of the natural IgG response of adult subjects during a period of one year showed that IgG antibodies (i) recognize G significantly stronger than the fusion protein F0, (ii) target mainly non-conformational, sequential peptide epitopes from the exposed conserved region but also buried peptides, and (iii) exhibit a scattered but constant recognition profile during the observation period. The IgG subclass reactivity profile (IgG1 > IgG2 > IgG4 = IgG3) was indicative of a mixed Th1/Th2 response. Two strongly RSV-neutralizing sera including the 1st WHO standard contained high IgG anti-G levels. G-specific IgG increased strongly in children after wheezing attacks suggesting RSV as trigger factor. Our study shows that RSV G and G-derived peptides are useful for serological diagnosis of RSV-triggered exacerbations of respiratory diseases and underlines the importance of G for development of RSV-neutralizing vaccines. Full article
Show Figures

Figure 1

Figure 1
<p>(<b>A</b>) Alignment of the amino acid sequences of G proteins from distantly related strains from subgroup A and B. Subgroup A and B sequences as indicated on the left margins (gene identifier-gi-numbers indicated) were aligned with the G protein sequence from A2 strain (subgroup A) on the top. Dots show identical amino acids and dashes indicate gaps. The membrane-anchored form (Gm) starts with methionine M-1 and the secreted form (Gs) with M-48. The two mucin-like regions are indicated by a black (mucin-like region I) and by a green (mucin-like region II) frame. Conserved cysteine residues are denoted by red boxes and predicted N- and O-linked glycosylation sites by highlighting the consensus sequence NXT/S in green and with small blue ovals, respectively. A CX3C-like motif similar to one in the chemokine CX3CL1 (fraktalkine) is indicated by a brown bar in the Cysteine noose which is stabilized by two disulfide bonds in the center of the protein. The N-terminal cytoplasmic tail (CT) is boxed in blue, the hydrophobic transmembrane anchor (TM) in brown, the Heparin-binding domain (HBD) in pale orange and the central conserved domain in green. The pink regions in subgroup B RSV strains are duplicated. Synthetic peptides (GP1–GP16) used for epitope mapping spanning the G protein sequence are indicated by black horizontal lines. (<b>B</b>) Overview of the G protein structure showing the different domains and N- as well as O-linked glycans. Below, the recombinant G protein construct and overlapping peptides 1–16 (IgG-reactive peptides in blue) are indicated. Blue * represents the Cytoplasmic Tail and is described in figure legends.</p>
Full article ">Figure 1 Cont.
<p>(<b>A</b>) Alignment of the amino acid sequences of G proteins from distantly related strains from subgroup A and B. Subgroup A and B sequences as indicated on the left margins (gene identifier-gi-numbers indicated) were aligned with the G protein sequence from A2 strain (subgroup A) on the top. Dots show identical amino acids and dashes indicate gaps. The membrane-anchored form (Gm) starts with methionine M-1 and the secreted form (Gs) with M-48. The two mucin-like regions are indicated by a black (mucin-like region I) and by a green (mucin-like region II) frame. Conserved cysteine residues are denoted by red boxes and predicted N- and O-linked glycosylation sites by highlighting the consensus sequence NXT/S in green and with small blue ovals, respectively. A CX3C-like motif similar to one in the chemokine CX3CL1 (fraktalkine) is indicated by a brown bar in the Cysteine noose which is stabilized by two disulfide bonds in the center of the protein. The N-terminal cytoplasmic tail (CT) is boxed in blue, the hydrophobic transmembrane anchor (TM) in brown, the Heparin-binding domain (HBD) in pale orange and the central conserved domain in green. The pink regions in subgroup B RSV strains are duplicated. Synthetic peptides (GP1–GP16) used for epitope mapping spanning the G protein sequence are indicated by black horizontal lines. (<b>B</b>) Overview of the G protein structure showing the different domains and N- as well as O-linked glycans. Below, the recombinant G protein construct and overlapping peptides 1–16 (IgG-reactive peptides in blue) are indicated. Blue * represents the Cytoplasmic Tail and is described in figure legends.</p>
Full article ">Figure 2
<p>Characterization of recombinant insect cell-expressed G protein. Coomassie-blue stained SDS-PAGE with recombinant A2-G and a molecular-weight marker (kDa: kilo Dalton) (left). Corresponding immunoblot stained with an anti-His-tag antibody (middle). Immunblotted A2-G separated under non-reducing (lane NR) or reducing conditions (lane R) stained with anti-His antibodies. Molecular weights (kDa) are indicated on the left margins.</p>
Full article ">Figure 3
<p>Analysis of purified recombinant A2-G by size exclusion chromatography (SEC) and dynamic light scattering (DLS). (<b>a</b>) Elution profiles of molecular weight standards (top) and of purified A2-G (bottom, in blue). Absorbances at 225 nm (y-axes) are shown for different retention times (y-axes) with indicated molecular weights in kDa. (<b>b</b>) DLS profile of purified A2-G (y-axis: % mass; <span class="html-italic">x</span>-axis: radius-nm) are shown. (<b>c</b>) Summary of peak features (radius, molecular weight, % intensity, % mass and % Pd).</p>
Full article ">Figure 4
<p>Human antibody responses to recombinant native G, denatured and deglycosylated G and G-derived synthetic peptides. Shown are IgG levels (y-axes: optical density values) in sera from 12 healthy adult individuals obtained at different time points ((<b>a</b>) January-February; (<b>b</b>) April-May; (<b>c</b>) August-September; (<b>d</b>) January-February next year) to recombinant, native G (blue), G denatured by heat and SDS (orange), G denatured by heat, SDS and TCEP (red), deglycosylated G (only for time point a, brown), G-derived peptides (GP1-GP16; buried peptides: yellow; peptides without glycosylation sites: pink) and recombinant F0 (x-axes). Horizontal lines within scatter plots indicate median values. The cut-off (mean of buffer control plus three times standard deviation) is indicated by horizontal red lines. Significant differences between G and F0-specific antibody levels are indicated (**** <span class="html-italic">p</span> &lt; 0.0001).</p>
Full article ">Figure 5
<p>Correlations of IgG levels specific for native G (x-axes) and denatured G (SDS, TCEP and heat) (<span class="html-italic">y</span>-axis) (<b>upper left</b>), deglycosylated G (<span class="html-italic">y</span>-axis) (<b>upper right</b>), the sum of peptide-specific IgG (<span class="html-italic">y</span>-axis) (<b>lower left</b>) and for F0 (<span class="html-italic">y</span>-axis) (<b>lower right</b>) measured in sera from 12 adult individuals in individual scatter plots with Spearman correlation coefficient r and p values.</p>
Full article ">Figure 6
<p>Comparison of G and F0-specific human IgG, IgM and IgA responses. Shown are IgG (<b>a</b>), IgA (<b>b</b>) and IgM (<b>c</b>) levels (y-axes: optical density OD values) against A2-G and F0 measured by ELISA in sera from 18 healthy adult individuals. Horizontal lines within scatter plots indicate median values. The cut-off (mean of buffer control plus three times standard deviation) is indicated by horizontal red lines. Significant differences between G and F0-specific antibody levels are indicated (**** <span class="html-italic">p</span> &lt; 0.0001).</p>
Full article ">Figure 7
<p>Human IgG subclass responses to recombinant native G and F0. Shown are IgG subclass levels, IgG<sub>1</sub> (<b>a</b>), IgG<sub>2</sub> (<b>b</b>), IgG<sub>3</sub> (<b>c</b>) and IgG<sub>4</sub> (<b>d</b>) in sera from 18 healthy adult individuals to recombinant, native G and F0 (x-axes), (y-axis: optical density values; IgG<sub>1</sub>, IgG<sub>2</sub>, IgG<sub>3</sub> and IgG<sub>4</sub>). Horizontal lines within scatter plots indicate median values. The cut-off (mean of buffer control plus three times standard deviation) is indicated by horizontal red lines. Significant differences between G and F0-specific antibody levels are indicated (*** <span class="html-italic">p</span> &lt; 0.001; **** <span class="html-italic">p</span> &lt; 0.0001).</p>
Full article ">Figure 8
<p>IgG responses specific for G and F0 in children with an acute wheezing attack at base-line and in follow-up blood samples. Shown are optical densities (ODs) corresponding to IgG levels specific for A2-G and F0 determined in sera from children attending emergency care at base line (open circles) and in follow-up samples collected several weeks after (black circles). The cut-off (mean of buffer control plus three times standard deviation) is indicated by horizontal red lines. Horizontal lines within the scatter plots indicate median values. Depicted are 12 RSV-positive children according to PCR test. Comparative tests were non-parametric paired (Wilcoxon matched-pairs signed rank test) or unpaired test (Mann-Whitney U test) as appropriate. Significant differences of antibody levels between base-line (acute visit) and follow-up samples are indicated (*** <span class="html-italic">p</span> &lt; 0.001, **** <span class="html-italic">p</span> &lt; 0.0001).</p>
Full article ">Figure 9
<p>IgG responses specific for G and F0 determined in the WHO 1st International Standard for Antiserum to Respiratory Syncytial Virus and another virus-neutralizing human serum. Shown are means of optical density (OD) values (&lt; 5% deviation) corresponding to IgG levels specific for G, F0 and human serum albumin determined for different dilutions (1:50, 1:100). The cut-off (mean of buffer control plus three times standard deviation) is indicated by a horizontal red line.</p>
Full article ">
14 pages, 1682 KiB  
Article
How to Demonstrate Freedom from African Swine Fever in Wild Boar—Estonia as an Example
by Katja Schulz, Christoph Staubach, Sandra Blome, Imbi Nurmoja, Arvo Viltrop, Franz J. Conraths, Maarja Kristian and Carola Sauter-Louis
Vaccines 2020, 8(2), 336; https://doi.org/10.3390/vaccines8020336 - 25 Jun 2020
Cited by 23 | Viewed by 4043
Abstract
Estonia has been combatting African swine fever (ASF) for six years now. Since October 2017, the disease has only been detected in the wild boar population, but trade restrictions had to remain in place due to international regulations. Yet, the epidemiological course of [...] Read more.
Estonia has been combatting African swine fever (ASF) for six years now. Since October 2017, the disease has only been detected in the wild boar population, but trade restrictions had to remain in place due to international regulations. Yet, the epidemiological course of the disease has changed within the last few years. The prevalence of ASF virus (ASFV)-positive wild boar decreased steadily towards 0%. In February 2019, the last ASFV-positive wild boar was detected. Since then, positive wild boar samples have exclusively been positive for ASFV-specific antibodies, suggesting the possible absence of circulating ASFV in the Estonian wild boar population. However, as the role of seropositive animals is controversially discussed and the presence of antibody-carriers is regarded as an indication of virus circulation at EU and OIE level, Estonia remains under trade restrictions. To make the disease status of a country reliable for trading partners and to facilitate the process of declaration of disease freedom, we suggest to monitor the prevalence of seropositive wild boar in absence of ASFV-positive animals. The possibility to include ASF in the list of diseases, for which an official pathway for recognition of disease status is defined by the OIE should be evaluated. Full article
(This article belongs to the Special Issue African Swine Fever Virus Prevention and Control)
Show Figures

Figure 1

Figure 1
<p>Prevalence estimates for ASFV PCR-positive wild boar, irrespective of their serological status for each study month and three different age classes. The whiskers indicate 95% confidence intervals. The broken vertical line highlights February 2019, when ASFV-positive wild boar were last detected by PCR.</p>
Full article ">Figure 2
<p>Prevalence estimates for seropositive wild boar that were ASFV PCR-negative for each study month and three different age classes. The whiskers indicate 95% confidence intervals. The broken vertical line highlights February 2019, when ASFV-positive wild boar were last detected by PCR.</p>
Full article ">Figure 3
<p>Prevalence estimates for ASFV PCR-positive and seropositive wild boar test results for each study month and three age classes. The whiskers indicate 95% confidence intervals. The broken vertical line highlights February 2019, the last month, in which ASFV-positive wild boar were detected.</p>
Full article ">Figure 4
<p>Median temporal effect on the logit prevalence for all samples that tested exclusively serologically positive, 95% Bayesian credible intervals (BCI) are indicated. The broken vertical line highlights February 2019, when the last ASFV-positive wild boar were detected by PCR.</p>
Full article ">
33 pages, 3655 KiB  
Review
SARS-CoV-2: An Update on Potential Antivirals in Light of SARS-CoV Antiviral Drug Discoveries
by Hatem A. Elshabrawy
Vaccines 2020, 8(2), 335; https://doi.org/10.3390/vaccines8020335 - 23 Jun 2020
Cited by 36 | Viewed by 8859
Abstract
Coronaviruses (CoVs) are a group of RNA viruses that are associated with different diseases in animals, birds, and humans. Human CoVs (HCoVs) have long been known to be the causative agents of mild respiratory illnesses. However, two HCoVs associated with severe respiratory diseases [...] Read more.
Coronaviruses (CoVs) are a group of RNA viruses that are associated with different diseases in animals, birds, and humans. Human CoVs (HCoVs) have long been known to be the causative agents of mild respiratory illnesses. However, two HCoVs associated with severe respiratory diseases are Severe Acute Respiratory Syndrome-CoV (SARS-CoV) and Middle East Respiratory Syndrome-CoV (MERS-CoV). Both viruses resulted in hundreds of deaths after spreading to several countries. Most recently, SARS-CoV-2 has emerged as the third HCoV causing severe respiratory distress syndrome and viral pneumonia (known as COVID-19) in patients from Wuhan, China, in December 2019. Soon after its discovery, SARS-CoV-2 spread to all countries, resulting in millions of cases and thousands of deaths. Since the emergence of SARS-CoV, many research groups have dedicated their resources to discovering effective antivirals that can treat such life-threatening infections. The rapid spread and high fatality rate of SARS-CoV-2 necessitate the quick discovery of effective antivirals to control this outbreak. Since SARS-CoV-2 shares 79% sequence identity with SARS-CoV, several anti-SARS-CoV drugs have shown promise in limiting SARS-CoV-2 replication in vitro and in vivo. In this review, we discuss antivirals described for SARS-CoV and provide an update on therapeutic strategies and antivirals against SARS-CoV-2. The control of the current outbreak will strongly depend on the discovery of effective and safe anti-SARS-CoV-2 drugs. Full article
Show Figures

Figure 1

Figure 1
<p>Genomic organization of (<b>A</b>) Severe Acute Respiratory Syndrome-coronavirus (SARS-CoV) and (<b>B</b>) SARS-CoV-2. The structure of SARS-CoV and SARS-CoV-2 genomes includes ORF1a and ORF1b occupying two-thirds of the genomes at the 5′ end. ORF1a and ORF1b are translated through a ribosomal frame shift sequence into two polyproteins 1a and 1b (pp1a and pp1ab) which are processed by 3CLpro and PLpro proteases to produce nonstructural proteins, including RdRp, that are important for viral replication. The other one-third of the genomes is comprised of ORFs that code for structural (S, M, E, and N) and nonstructural proteins. ORF: open reading frame; RdRp: RNA-dependent RNA polymerase; 3CLpro: picornavirus 3-chymotrypsin-like protease; PLpro: papain-like protease 2.</p>
Full article ">Figure 2
<p>Chemical structures of SARS-CoV and SARS-CoV-2 viral entry inhibitors: (<b>A</b>) emodin, (<b>B</b>) imatinib, (<b>C</b>) tetra-O-galloyl-beta-D-glucose (TGG), (<b>D</b>) luteolin, (<b>E</b>) N-(2-aminoethyl)-1-aziridineethanamine (NAAE), (<b>F</b>) chloroquine, (<b>G</b>) chlorpromazine, (<b>H</b>) E-64D, (<b>I</b>) 5705213, (<b>J</b>) camostat mesylate, and (<b>K</b>) nafamostat.</p>
Full article ">Figure 3
<p>Chemical structures of protease inhibitors: (<b>A</b>) lopinavir, (<b>B</b>) ritonavir, (<b>C</b>) nelfinavir, (<b>D</b>) cinanserin, (<b>E</b>) betulinic acid, (<b>F</b>) savinin, (<b>G</b>) dieckol, (<b>H</b>) herbacetin, (<b>I</b>) 6-mercaptopurine, (<b>J</b>) 6-thioguanine, (<b>K</b>) disulfiram, (<b>L</b>) danoprevir, and (<b>M</b>) darunavir.</p>
Full article ">Figure 4
<p>Chemical structures of SARS-CoV and SARS-CoV-2 helicase and RdRp inhibitors: (<b>A</b>) myricetin, (<b>B</b>) scutellarein, (<b>C</b>) SSYA10-001, (<b>D</b>) β-D-N4-hydroxycitidine, (<b>E</b>) galidesivir, (<b>F</b>) 6-azauridine, (<b>G</b>) pyrazofurin, (<b>H</b>) ribavirin, (<b>I</b>) remdesivir, and (<b>J</b>) favipiravir.</p>
Full article ">Figure 5
<p>Chemical structures of miscellaneous drugs against SARS-CoV and SARS-CoV-2: (<b>A</b>) hexmethylene amiloride, (<b>B</b>) aurintricarboxylic acid, (<b>C</b>) rimantadine, (<b>D</b>) niclosamide, (<b>E</b>) amiodarone, (<b>F</b>) DETA NONOate, (<b>G</b>) S-nitroso-N-acetylpenicillamine (SNAP), (<b>H</b>) cyclosporine A, (<b>I</b>) alisporivir, and (<b>J</b>) geldanamycin.</p>
Full article ">Figure 6
<p>Chemical structures of miscellaneous drugs against SARS-CoV and SARS-CoV-2: (<b>A</b>) glycyrrhizin, (<b>B</b>) umifenovir, (<b>C</b>) nitazoxanide, (<b>D</b>) ruxolitinib, (<b>E</b>) baricitinib, (<b>F</b>) valsartan, and (<b>G</b>) telmisartan.</p>
Full article ">Figure 7
<p>Potential therapeutics targeting different steps of the SARS-CoV-2 life cycle. The steps of the SARS-CoV-2 life cycle are (1) attachment to angiotensin-converting enzyme 2 (ACE2) on target cells, (2) entering the cell by endocytosis (cathepsin L-mediated cleavage of S protein) or through the plasma membrane (TMPRSS2-mediated cleavage of S protein), (3) uncoating and release of viral RNA, (4) translation of viral RNA 5’ end (ORF1a and ORF1b), (5) proteolysis of pp1a and pp1ab by 3CLpro and PLpro into nonstructural proteins, (6) formation of replicase complex, (7) replication of viral RNA, (8) transcription of viral genome into subgenomic mRNAs, (9) translation of subgenomic mRNAs into structural and nonstructural proteins, (10) assembly and budding of new viral particles through Golgi apparatus, and (11) exocytosis and exit of new viral particles out of the cell. Antivirals against SARS-CoV-2 include: entry inhibitors such as convalescent plasma and monoclonal antibodies (e.g., 47D11, HA001, B38, H4, and CR3022), chloroquine, camostat mesylate and nafamostat, cathepsin L inhibitors, and soluble ACE2; 3CLpro inhibitors such as HIV protease inhibitors (lopinavir, ritonavir, and darunavir) and the hepatitis C virus (HCV) protease inhibitor danoprevir; and RdRp inhibitors such as remdesivir, favipiravir, and galidesivir. ER; endoplasmic reticulum, ERGIC; endoplasmic reticulum–Golgi intermediate compartment, and ORF; open reading frame.</p>
Full article ">
15 pages, 758 KiB  
Article
Characterization of Physicians That Might Be Reluctant to Propose HIV Cure-Related Clinical Trials with Treatment Interruption to Their Patients? The ANRS-APSEC Study
by Christel Protiere, Lisa Fressard, Marion Mora, Laurence Meyer, Marie Préau, Marie Suzan-Monti, Jean-Daniel Lelièvre, Olivier Lambotte, Bruno Spire and the APSEC Study Group
Vaccines 2020, 8(2), 334; https://doi.org/10.3390/vaccines8020334 - 23 Jun 2020
Cited by 5 | Viewed by 3178
Abstract
HIV cure-related clinical trials (HCRCT) with analytical antiretroviral treatment interruptions (ATIs) have become unavoidable. However, the limited benefits for participants and the risk of HIV transmission during ATI might negatively impact physicians’ motivations to propose HCRCT to patients. Between October 2016 and March [...] Read more.
HIV cure-related clinical trials (HCRCT) with analytical antiretroviral treatment interruptions (ATIs) have become unavoidable. However, the limited benefits for participants and the risk of HIV transmission during ATI might negatively impact physicians’ motivations to propose HCRCT to patients. Between October 2016 and March 2017, 164 French HIV physicians were asked about their level of agreement with four viewpoints regarding HCRCT. A reluctance score was derived from their answers and factors associated with reluctance identified. Results showed the highest reluctance to propose HCRCT was among physicians with a less research-orientated professional activity, those not informing themselves about cure trials through scientific literature, and those who participated in trials because their department head asked them. Physicians’ perceptions of the impact of HIV on their patients’ lives were also associated with their motivation to propose HCRCT: those who considered that living with HIV means living with a secret were more motivated, while those worrying about the negative impact on person living with HIV’s professional lives were more reluctant. Our study highlighted the need to design a HCRCT that minimizes constraints for participants and for continuous training programs to help physicians keep up-to-date with recent advances in HIV cure research. Full article
(This article belongs to the Special Issue Therapeutic Vaccination of HIV-infected Patients)
Show Figures

Figure 1

Figure 1
<p>Distribution of respondents according to the reluctance score (<span class="html-italic">n</span> = 164).</p>
Full article ">Figure A1
<p>Respondents’ levels of agreement with the four viewpoints regarding HCRCT (ANRS-APSEC study, <span class="html-italic">n</span> = 164).</p>
Full article ">
19 pages, 8891 KiB  
Article
Activation of OX40 and CD27 Costimulatory Signalling in Sheep through Recombinant Ovine Ligands
by José Manuel Rojas, Alí Alejo, Jose Miguel Avia, Daniel Rodríguez-Martín, Carolina Sánchez, Antonio Alcamí, Noemí Sevilla and Verónica Martín
Vaccines 2020, 8(2), 333; https://doi.org/10.3390/vaccines8020333 - 22 Jun 2020
Cited by 4 | Viewed by 3515
Abstract
Members of the tumour necrosis factor (TNF) superfamily OX40L and CD70 and their receptors are costimulating signalling axes critical for adequate T cell activation in humans and mice but characterisation of these molecules in other species including ruminants is lacking. Here we cloned [...] Read more.
Members of the tumour necrosis factor (TNF) superfamily OX40L and CD70 and their receptors are costimulating signalling axes critical for adequate T cell activation in humans and mice but characterisation of these molecules in other species including ruminants is lacking. Here we cloned and expressed the predicted ovine orthologues of the receptors OX40 and CD27, as well as soluble recombinant forms of their potential ovine ligands, OaOX40L and OaCD70. Using biochemical and immunofluorescence analyses, we show that both signalling axes are functional in sheep. We show that oligomeric recombinant ligand constructs are able to induce signalling through their receptors on transfected cells. Recombinant defective human adenoviruses were constructed to express the soluble forms of OaOX40L and OaCD70. Both proteins were detected in the supernatant of adenovirus-infected cells and shown to activate NF-κB signalling pathway through their cognate receptor. These adenovirus-secreted OaOX40L and OaCD70 forms could also activate ovine T cell proliferation and enhance IFN-γ production in CD4+ and CD8+ T cells. Altogether, this study provides the first characterisation of the ovine costimulatory OX40L-OX40 and CD70-CD27 signalling axes, and indicates that their activation in vivo may be useful to enhance vaccination-induced immune responses in sheep and other ruminants. Full article
(This article belongs to the Section Cellular/Molecular Immunology)
Show Figures

Figure 1

Figure 1
<p>Purification of recombinant proteins r<span class="html-italic">Oa</span>OX40L and r<span class="html-italic">Oa</span>CD70. (<b>A</b>) Schematic representation of the protein constructs expressed by the recombinant baculoviruses and adenoviruses. They include an insulin derived signal peptide (SP) the ovine (Oa) <span class="html-italic">IgG1</span> Fc domain, the short isoleucine trimerization domain (ILZ) followed by either the predicted extracellular domain from ovine OX40L or ovine CD70. (<b>B</b>) Coomassie-blue stained SDS-PAGE showing immunoaffinity purified recombinant proteins. Molecular Weigth Marker in kilodaltons (kDa) are shown on the right. (<b>C</b>) Western blot analysis of the purified proteins detected by an anti-ovine Fc antibody. MWM (kDa) are shown on the left.</p>
Full article ">Figure 2
<p>Colocalisation of the ovine OX40L and CD70 ligands with their cognate receptors. (<b>A</b>) Immunolocalisation of <span class="html-italic">Oa</span>OX40 and <span class="html-italic">Oa</span>CD27 in transfected HEK293 cells detected by anti-V5 tag antibody and counterstained with DAPI. Cells expressing (<b>B</b>) <span class="html-italic">Oa</span>OX40 or (<b>D</b>) <span class="html-italic">Oa</span>CD27, were incubated with 10 μg of (<b>B</b>) purified r<span class="html-italic">Oa</span>OX40L or (<b>D</b>) purified r<span class="html-italic">Oa</span>CD70 for 15 min before fixation and immunofluorescence. <span class="html-italic">Oa</span>OX40 and <span class="html-italic">Oa</span>CD27 expression was detected using anti-V5 tag antibodies (red); r<span class="html-italic">Oa</span>OX40L and r<span class="html-italic">Oa</span>CD70 presence were detected with an anti-ovine Fc antibody (green). (<b>B</b>,<b>D</b>) Insets show detail of colocalisation in each case. Merge and orthogonal projection were obtained with ImageJ software. Scale bar = 10 μm, indent scale bar = 4 μm. In panel (<b>C</b>) and (<b>E</b>), an enlarged image of corresponding insets in Merge and fluorescence intensity profiles for the indicated white lines on the images are shown. (<b>F</b>) ImageJ Image calculator function was used to evaluate colocalisation of ligand signal with its receptor. Representative images of colocalisation analysis in a Z-plane (presented as 16LUT signal) are shown. The ImageJ calculator tool was used for pixel colocalisation for the fluorescence channels of ligands (r<span class="html-italic">Oa</span>OX40L or r<span class="html-italic">Oa</span>CD70) and their respective receptors (r<span class="html-italic">Oa</span>OX40 or r<span class="html-italic">Oa</span>CD27). (<b>G</b>) The percentage of recombinant ligand signals colocalising with their receptors in (<b>F</b>) was analysed in 25–40 cells for each condition. Mean ± SD are indicated for each condition.</p>
Full article ">Figure 3
<p>Expression and secretion of r<span class="html-italic">Oa</span>OX40L and r<span class="html-italic">Oa</span>CD70 using recombinant adenoviruses. (<b>A</b>) Vero cell monolayers were not infected (mock) or infected with the recombinant Ad5-<span class="html-italic">Oa</span>OX40L, Ad5-<span class="html-italic">Oa</span>CD70, or the control Ad5-DsRed viruses as indicated. At 48 hpi, the cells (C) and media (M) were harvested separately and equivalent amounts analysed by Western blot for the presence of ovine Fc-bearing proteins (upper panel) or tubulin (lower panel). The r<span class="html-italic">Oa</span>OX40L and r<span class="html-italic">Oa</span>CD70 molecules are readily detected both in the cell extracts and in the media, showing that the proteins are secreted from the infected cells. Absence of cellular tubulin in these media was used as a control of the fractionation procedure. (<b>B</b>) The media containing r<span class="html-italic">Oa</span>OX40L and r<span class="html-italic">Oa</span>CD70 from panel A were analysed in the presence or absence of DTT as indicated by Western blot to detect the formation of disulfide linked oligomers in the recombinant proteins. The position of MWM (kDa) is indicated in both panels.</p>
Full article ">Figure 4
<p>The secreted r<span class="html-italic">Oa</span>OX40L and r<span class="html-italic">Oa</span>CD70 expressed from recombinant adenovirus-infected cells colocalise with their cognate ovine receptors. Cells expressing (<b>A</b>) <span class="html-italic">Oa</span>OX40 or (C) <span class="html-italic">Oa</span>CD27, were incubated with conditioned media from cells infected with (<b>A</b>,<b>B</b>) Ad5-<span class="html-italic">Oa</span>OX40L (r<span class="html-italic">Oa</span>OX40L) or (<b>C</b>,<b>D</b>) Ad5-<span class="html-italic">Oa</span>CD70 (r<span class="html-italic">Oa</span>CD70) for 15 min before fixation and immunofluorescence. r<span class="html-italic">Oa</span>OX40L and r<span class="html-italic">Oa</span>CD70 were detected with an anti-Fc antibody (green); <span class="html-italic">Oa</span>OX40 and <span class="html-italic">Oa</span>CD27 expression was detected using anti-V5 tag antibodies (red). (<b>B</b>,<b>D</b>) Insets show detail of colocalisation for each case. Merge and orthogonal projections were obtained with ImageJ software. Scale bar = 10 μm, indent scale bar = 4 μm. In panel (<b>B</b>) and (<b>D</b>), an enlarged image of corresponding insets in Merge and fluorescence intensity profiles for the indicated white lines on the images are shown. (<b>E</b>) Representative images of colocalisation analysis in a Z-plane (presented as 16LUT signal) are shown. The ImageJ calculator tool was used for pixel colocalisation for the fluorescence channels of ligands (r<span class="html-italic">Oa</span>OX40L or r<span class="html-italic">Oa</span>CD70) and their respective receptors (r<span class="html-italic">Oa</span>OX40 or r<span class="html-italic">Oa</span>CD27). (<b>F</b>) The percentage of (<b>E</b>) adenovirus-produced ligands signal colocalising with their receptors was analysed in 25–40 cells for each condition. Mean ± SD are indicated for each condition.</p>
Full article ">Figure 5
<p>The r<span class="html-italic">Oa</span>OX40L and r<span class="html-italic">Oa</span>CD70 specifically elicit signalling through their cognate receptors <span class="html-italic">Oa</span>OX40 and <span class="html-italic">Oa</span>CD27. HEK293-pr(IFNB)-GFP cells were transfected with, (<b>A</b>–<b>C</b>) <span class="html-italic">Oa</span>OX40-V5 and (<b>D</b>–<b>F</b>) <span class="html-italic">Oa</span>CD27-V5. At 24 h post transfection, the cells were stimulated with 10 μg of purified (<b>A</b>) <span class="html-italic">rOa</span>OX40L or (<b>D</b>) <span class="html-italic">rOa</span>CD70 proteins, or equivalent amounts of conditioned media from Ad5-<span class="html-italic">Oa</span>OX40L (<b>B</b>) <span class="html-italic">rOa</span>OX40L, (<b>E</b>) Ad5-<span class="html-italic">Oa</span>CD70, or (<b>C</b>,<b>F</b>) Ad5-DsRed infected Vero cells proteins in conditioned media from Ad5-<span class="html-italic">Oa</span>OX40L, Ad5-<span class="html-italic">Oa</span>CD70, or Ad5-DsRed infections. At 16 h post stimulation, the cells were fixed and an immunofluorescence using anti-V5 (red) to detect the transfected receptors was performed. GFP (green) activity was detected by fluorescence microscopy and DAPI was used to counterstain cells to nuclei (blue). Bars = 20 µm.</p>
Full article ">Figure 6
<p>Dose dependent induction of signalling by r<span class="html-italic">Oa</span>OX40L and r<span class="html-italic">Oa</span>CD70 ligands. HEK-293/prIFNB-GFP cells were transfected with plasmids to express the receptors <span class="html-italic">Oa</span>OX40 or <span class="html-italic">Oa</span>CD27 and stimulated at 24 h post transfection with three equivalent and increasing doses (1×, 2×, and 4×) of conditioned media from Ad5-<span class="html-italic">Oa</span>OX40L (r<span class="html-italic">Oa</span>OX40L) or Ad5-<span class="html-italic">Oa</span>CD70 (r<span class="html-italic">Oa</span>CD70) infected Vero cells. As a positive control of signalling induction, untransfected cells were infected with Sendai virus (SeV) at a multiplicity of infection (moi) of 1 pfu/cell for 16 h. GFP expressing cells were counted on an immunofluorescence microscope on 12 randomly chosen fields and % of GFP expressing cells for each field are plotted. Mean ± SD for each condition are indicated with bars.</p>
Full article ">Figure 7
<p>CD27 expression on ovine PBMC populations. Ovine PBMC, derived from <span class="html-italic">n</span> = 15 animals were costained for CD27 and CD4, CD8, CD335, or B cell markers. Gates were set using the corresponding isotype controls. Isotype control staining and representative dot plots for CD27 staining and CD4; CD8; CD335 or B cell marker are shown. Bar charts show the mean (±SD) percentage of CD27<sup>+</sup> and CD27<sup>-</sup> cells in the CD4/CD8/CD335/B cell marker gates (upper quadrants) in donor sheep PBMC.</p>
Full article ">Figure 8
<p>The r<span class="html-italic">Oa</span>OX40L and r<span class="html-italic">Oa</span>CD70 ligands promote sheep T cell proliferation and IFN-γ production. (<b>A</b>–<b>C</b>) An enriched T cell fraction was obtained from sheep (<span class="html-italic">n</span> = 5) PBMCs, labelled with CFSE and cultured for 4 days with equivalent amounts of conditioned media from Ad5-<span class="html-italic">Oa</span>OX40L-, Ad5-<span class="html-italic">Oa</span>CD70-, or Ad5-DsRed-infected Vero cells. Cell fluorescence was then acquired by flow cytometry. (<b>A</b>) Representative flow cytometry histograms show the reduction in CFSE fluorescence proportional to cell proliferation. (<b>B</b>,<b>C</b>) Proliferation induced by (<b>B</b>) Ad5-<span class="html-italic">Oa</span>OX40L or (<b>C</b>) Ad5-<span class="html-italic">Oa</span>CD70 conditioned media in the T cell fractions obtained from five individual donor sheep. ** <span class="html-italic">p</span> &lt; 0.01 Paired Student’s <span class="html-italic">t</span>-test (Ad5-DsRed vs. Ad5-<span class="html-italic">Oa</span>OX40L or Ad5-<span class="html-italic">Oa</span>CD70). (<b>D–I</b>) Sheep PBMC were stimulated with ConA and cultured with media as indicated for 18 h. IFN-γ production was then evaluated by intracellular cytokine staining and flow cytometry in (<b>D–F</b>) CD4<sup>+</sup> and (<b>G–I</b>) CD8<sup>+</sup> T cells. (<b>D</b>,<b>G</b>) Representative flow cytometry dot-plots showing IFN-γ production in (<b>D</b>) CD4<sup>+</sup> and (<b>G</b>) CD8<sup>+</sup> T cells for unstimulated PBMC and ConA-stimulated PBMC in the presence of Ad-DsRed, Ad-<span class="html-italic">Oa</span>OX40L, or Ad-<span class="html-italic">Oa</span>CD70 conditioned media. Indicated percentages represent the number of positive cells in the CD4<sup>+</sup> or CD8<sup>+</sup> T cell compartment. (<b>E</b>,<b>F</b>,<b>H</b>,<b>I</b>) IFN-γ production in (<b>E</b>,<b>F</b>) CD4<sup>+</sup> and (<b>H</b>,<b>I</b>) CD8<sup>+</sup> T cells induced by (<b>E</b>,<b>H</b>) Ad5-<span class="html-italic">Oa</span>OX40L- or (<b>F</b>,<b>I</b>) Ad-<span class="html-italic">Oa</span>CD70-conditioned media in PBMC obtained from five individual donor sheep. * <span class="html-italic">p</span> &lt; 0.05; ** <span class="html-italic">p</span> &lt; 0.01 Paired Student’s <span class="html-italic">t</span>-test (Ad-DsRed vs. Ad5-<span class="html-italic">Oa</span>OX40L or Ad5-<span class="html-italic">Oa</span>CD70).</p>
Full article ">
16 pages, 1678 KiB  
Article
Nitric Oxide Production and Fc Receptor-Mediated Phagocytosis as Functional Readouts of Macrophage Activity upon Stimulation with Inactivated Poultry Vaccines In Vitro
by Robin H.G.A. van den Biggelaar, Willem van Eden, Victor P.M.G. Rutten and Christine A. Jansen
Vaccines 2020, 8(2), 332; https://doi.org/10.3390/vaccines8020332 - 22 Jun 2020
Cited by 7 | Viewed by 4873
Abstract
Vaccine batches must pass routine quality control to confirm that their ability to induce protection against disease is consistent with batches of proven efficacy from development studies. For poultry vaccines, these tests are often performed in laboratory chickens by vaccination-challenge trials or serological [...] Read more.
Vaccine batches must pass routine quality control to confirm that their ability to induce protection against disease is consistent with batches of proven efficacy from development studies. For poultry vaccines, these tests are often performed in laboratory chickens by vaccination-challenge trials or serological assays. The aim of this study was to investigate innate immune responses against inactivated poultry vaccines and identify candidate immune parameters for in vitro quality tests as alternatives for animal-based quality tests. For this purpose, we set up assays to measure nitric oxide production and phagocytosis by the macrophage-like cell line HD11, upon stimulation with inactivated poultry vaccines for infectious bronchitis virus (IBV), Newcastle disease virus (NDV), and egg drop syndrome virus (EDSV). In both assays, macrophages became activated after stimulation with various toll-like receptor agonists. Inactivated poultry vaccines stimulated HD11 cells to produce nitric oxide due to the presence of mineral oil adjuvant. Moreover, inactivated poultry vaccines were found to enhance Fc receptor-mediated phagocytosis due to the presence of allantoic fluid in the vaccine antigen preparations. We showed that inactivated poultry vaccines stimulated nitric oxide production and Fc receptor-mediated phagocytosis by chicken macrophages. Similar to antigen quantification methods, the cell-based assays described here can be used for future assessment of vaccine batch-to-batch consistency. The ability of the assays to determine the immunopotentiating properties of inactivated poultry vaccines provides an additional step in the replacement of current in vivo batch-release quality tests. Full article
(This article belongs to the Special Issue Poultry Vaccines)
Show Figures

Graphical abstract

Graphical abstract
Full article ">Figure 1
<p>Inactivated poultry vaccines induced nitric oxide production by HD11 cells, whereas inactivated IBV and NDV antigens did not. (<b>a</b>) Nitric oxide production by HD11 cells was assessed upon stimulation with TLR agonists, i.e., 100 ng/mL LPS, 100 ng/mL CpG, and 10 μg/mL R848. (<b>b</b>) In addition, HD11 cells were exposed to inactivated IBV and NDV antigens (companies A and B) in doses ranging from 0.1–10 μL/mL. (<b>c</b>) Finally, HD11 cells were exposed to vaccines, an “empty vaccine” containing allantoic fluid without inactivated viruses, and mineral oil in doses ranging from 1–100 μL/mL. Three independent experiments were performed, and the experimental conditions of each independent experiment were tested in triplicate. Error bars represent the standard error of the mean (SEM). The experimental groups were tested for statistically significant increases in nitric oxide production as compared to unstimulated HD11 cells using a Kruskal–Wallis test and Dunn’s multiple comparisons test. Statistical significance is indicated by * <span class="html-italic">p</span> &lt; 0.05, ** <span class="html-italic">p</span> &lt; 0.01, and *** <span class="html-italic">p</span> &lt; 0.001.</p>
Full article ">Figure 2
<p>TLR agonists stimulated the uptake of IgY-opsonized beads by HD11 cells. (<b>a</b>) Confocal microscopy confirmed the uptake of IgY-opsonized beads by HD11 cells. The surface of unstimulated HD11 cells was made visible by WGA-Alexa Fluor 488 shown in green and IgY-opsonized beads are shown in red. A corresponding video showing the 3-D model of this composition can be found in <a href="#app1-vaccines-08-00332" class="html-app">Supplementary Materials Video S1</a>. (<b>b</b>) Bead uptake by HD11 cells was quantified by flow cytometry. HD11 cells were gated for their scatter profile (FSC/SSC) and viability (zombie aqua live/dead staining). Moreover, HD11 cells with 1 bead/cell were gated to determine the fluorescence of a single bead, from which the average beads/cell for all HD11 cells could be calculated. (<b>c</b>) HD11 cells were stimulated with 300 ng/mL LPS, 500 ng/mL CpG, 10 µg/mL R848, 10 ng/mL Pam3CSK4 (Pam), 5 µg/mL zymosan (Zymo), or left unstimulated (Unst). The results are expressed as fold changes in bead uptake after stimulation in comparison to unstimulated controls. Three independent experiments were performed, and the experimental conditions of each independent experiment were tested in triplicate. Error bars represent the standard error of the mean (SEM). The experimental groups were tested for statistically significant differences in bead uptake between stimulated and unstimulated groups using a one-way ANOVA and Holm–Sidak’s multiple comparisons test. Statistical significance is indicated by *** <span class="html-italic">p</span> &lt; 0.001.</p>
Full article ">Figure 3
<p>Phagocytosis of IgY-opsonized beads by HD11 cells is increased upon exposure to inactivated IBV and NDV antigens. (<b>a</b>) Differences in bead uptake upon exposure to IBV and NDV antigens are expressed as fold changes compared to unstimulated controls. (<b>b</b>) The effects of IBV and NDV antigens on HD11 cell viability, as determined by Zombie Aqua Fixable Viability Dye, is expressed as the percentage of living cells (% alive). Inactivated IBV antigens were provided by three different companies (A–C) and inactivated NDV antigen was provided by one company (B). In addition, the effects of allantoic fluid without virus (provided by company A) on HD11 cell phagocytosis capacity (<b>c</b>) and cell viability (<b>d</b>) were determined. The <span class="html-italic">x</span>-axis shows the titrated doses at which IBV antigens, NDV antigens, or allantoic fluid without antigens were added, expressed as μL dose, added to 1 mL of cell culture medium. Three independent experiments were performed, and the experimental conditions of each independent experiment were tested in duplicate. Error bars represent the SEM. The experimental groups were tested for statistically significant differences in bead uptake and viability between stimulated and unstimulated groups using Kruskal–Wallis tests and Dunn’s multiple comparisons tests. Statistical significance is indicated by * <span class="html-italic">p</span> &lt; 0.05, ** <span class="html-italic">p</span> &lt; 0.01, and *** <span class="html-italic">p</span> &lt; 0.001.</p>
Full article ">Figure 4
<p>Phagocytosis capacity of HD11 cells can be increased upon exposure to inactivated viral <span class="html-italic">w</span>/<span class="html-italic">o</span> vaccines. (<b>a</b>) The fold change in bead uptake by HD11 cells upon stimulation with vaccines is compared to unstimulated controls. The <span class="html-italic">x</span>-axis shows the graded doses at which the vaccines have been added, expressed as μL dose, added to 1 mL of cell culture medium. † indicates that datapoints were missing because the threshold of ≥100 viable cells was not reached. (b) Light microscopy photos show unstimulated HD11 cells (top), HD11 cells exposed to 10 μL/mL inactivated bivalent vaccine B (middle), and 100 μL/mL inactivated bivalent vaccine B (top). (c) A linear correlation curve shows the relationship between the average flow cytometric SSC and number of IgY-opsonized beads/cell for HD11 cells containing 0–4 beads/cell. (d) A non-linear saturation curve shows the relationship between the average SSC and different doses of empty vaccine (without viral antigens) from company B. (e) The flow cytometric SSC of HD11 cells is shown for graded doses of the different vaccines. Three independent experiments were performed, and the experimental conditions of each independent experiment were tested in duplicate. Error bars represent the SEM. The experimental groups were tested for statistically significant differences in bead uptake and SSC between stimulated and unstimulated groups using Kruskal–Wallis tests and Dunn’s multiple comparisons tests. Statistical significance is indicated by * <span class="html-italic">p</span> &lt; 0.05. For figure (e), all data was found to be statistically different from the unstimulated sample with <span class="html-italic">p</span> &lt; 0.001.</p>
Full article ">Figure 5
<p>The induction of phagocytosis after exposure to inactivated IBV antigen is dependent on the IgY Fc receptor CHIR-AB1. (<b>a</b>) Representative histograms show CHIR-AB1 expression by HD11 cells after 24 h without stimulation, stimulation with 100 ng/mL LPS, or stimulation with 10 μL/mL IBV antigen. (<b>b</b>,<b>c</b>) CHIR-AB1 surface expression by HD11 cells was quantified and expressed as the geometric mean fluorescent intensity (gMFI) after 24 h stimulation with different concentrations of LPS (<b>b</b>) and IBV antigen (<b>c</b>). (<b>d</b>) Unstimulated HD11 cells and HD11 cells stimulated with LPS or inactivated IBV antigen for 24 h received the blocking antibody 8D12 specific for chicken CHIR-AB1 10 min before the addition of IgY-opsonized beads. The average number of phagocytosed beads per HD11 cell is shown for different concentrations of blocking antibody. Three independent experiments were performed, and the experimental conditions of each independent experiment were tested in duplicate. Error bars represent the SEM. The experimental groups were tested for statistically significant differences in CHIR-AB1 expression or bead uptake between stimulated and unstimulated groups using one-way ANOVA tests and Holm–Sidak’s multiple comparisons tests. Statistical significance is indicated by * <span class="html-italic">p</span> &lt; 0.05, ** <span class="html-italic">p</span> &lt; 0.01, and *** <span class="html-italic">p</span> &lt; 0.001.</p>
Full article ">
6 pages, 622 KiB  
Communication
Risk Assessment and Virological Monitoring Following an Accidental Exposure to Concentrated Sabin Poliovirus Type 3 in France, November 2018
by Marion Jeannoël, Denise Antona, Clément Lazarus, Bruno Lina and Isabelle Schuffenecker
Vaccines 2020, 8(2), 331; https://doi.org/10.3390/vaccines8020331 - 22 Jun 2020
Cited by 3 | Viewed by 2830
Abstract
The safe and secure containment of infectious poliovirus (PV) in facilities where live PV are handled is the condition to achieve and maintain poliomyelitis eradication. Despite precautions to minimize the risk of release of PV from such facilities to the environment, breaches of [...] Read more.
The safe and secure containment of infectious poliovirus (PV) in facilities where live PV are handled is the condition to achieve and maintain poliomyelitis eradication. Despite precautions to minimize the risk of release of PV from such facilities to the environment, breaches of containment have already been documented. Here, we report the management of an incident that occurred on 30 November 2018 in a French vaccine manufacturing plant. Five adequately vaccinated operators were exposed to a Sabin poliovirus type 3 (PV3) spill. A microbiological risk assessment was conducted and the operators were monitored for PV shedding. On day 5 after exposure, Sabin PV3 was detected only in the stool sample of the most exposed worker. Shedding of Sabin PV3 (as detected by viral culture) was restricted to a very short period (less than 15 days). Monitoring of this incident was an opportunity to assess the relevance of our national response plan. We concluded that the measures undertaken and reported here were appropriate and proportional. Full article
Show Figures

Figure 1

Figure 1
<p>Timeline of the monitoring of vaccine poliovirus-exposed operators following an accidental spill of Sabin PV3, France, November 2018. S1: day 5 samples (throat and stool); S2: day 16 stool samples, S3: day 33 stool sample, S4: day 53 stool sample. The monitoring was performed on the 5 exposed operators from day 5 post-exposure to the end of detection of Sabin PV3 in the stool of the infected operator. Data are presented as a timeline with dates of sampling and tests’ results.</p>
Full article ">
19 pages, 2291 KiB  
Article
Limited Cross-Protection against Infectious Bronchitis Provided by Recombinant Infectious Bronchitis Viruses Expressing Heterologous Spike Glycoproteins
by Sarah Keep, Samantha Sives, Phoebe Stevenson-Leggett, Paul Britton, Lonneke Vervelde and Erica Bickerton
Vaccines 2020, 8(2), 330; https://doi.org/10.3390/vaccines8020330 - 22 Jun 2020
Cited by 10 | Viewed by 4773
Abstract
Gammacoronavirus infectious bronchitis virus (IBV) causes an economically important respiratory disease of poultry. Protective immunity is associated with the major structural protein, spike (S) glycoprotein, which induces neutralising antibodies and defines the serotype. Cross-protective immunity between serotypes is limited and can be difficult [...] Read more.
Gammacoronavirus infectious bronchitis virus (IBV) causes an economically important respiratory disease of poultry. Protective immunity is associated with the major structural protein, spike (S) glycoprotein, which induces neutralising antibodies and defines the serotype. Cross-protective immunity between serotypes is limited and can be difficult to predict. In this study, the ability of two recombinant IBV vaccine candidates, BeauR-M41(S) and BeauR-4/91(S), to induce cross-protection against a third serotype, QX, was assessed. Both rIBVs are genetically based on the Beaudette genome with only the S gene derived from either M41 or 4/91, two unrelated serotypes. The use of these rIBVs allowed for the assessment of the potential of M41 and 4/91 S glycoproteins to induce cross-protective immunity against a heterologous QX challenge. The impact of the order of vaccination was also assessed. Homologous primary and secondary vaccination with BeauR-M41(S) or BeauR-4/91(S) resulted in a significant reduction of infectious QX load in the trachea at four days post-challenge, whereas heterologous primary and secondary vaccination with BeauR-M41(S) and BeauR-4/91(S) reduced viral RNA load in the conjunctiva-associated lymphoid tissue (CALT). Both homologous and heterologous vaccination regimes reduced clinical signs and birds recovered more rapidly as compared with an unvaccinated/challenge control group. Despite both rIBV BeauR-M41(S) and BeauR-4/91(S) displaying limited replication in vivo, serum titres in these vaccinated groups were higher as compared with the unvaccinated/challenge control group. This suggests that vaccination with rIBV primed the birds for a boosted humoral response to heterologous QX challenge. Collectively, vaccination with the rIBV elicited limited protection against challenge, with failure to protect against tracheal ciliostasis, clinical manifestations, and viral replication. The use of a less attenuated recombinant vector that replicates throughout the respiratory tract could be required to elicit a stronger and prolonged protective immune response. Full article
(This article belongs to the Special Issue Development of Cross-Protective Vaccines)
Show Figures

Figure 1

Figure 1
<p>Schematic detailing protocol for the in vivo heterologous vaccine-challenge experiment. Groups of eight-day-old specific-pathogen-free (SPF) Rhode Island Red (RIR) chickens received a primary vaccination of BeauR-M41(S), BeauR-4/91(S), or phosphate buffered saline (PBS). Two weeks (14 days) later, birds received a second vaccination of either BeauR-M41(S), BeauR-4/91(S), or PBS. Nine days post-secondary vaccination (dpsv), birds were challenged with QX or mock challenged with PBS. Clinical signs were assessed for both post-vaccination and post-challenge birds. At defined intervals, randomly chosen birds were culled from each group and a variety of tissues harvested. Serum was collected pre-vaccination, post-vaccination (pre-challenge), and post-challenge. Tracheal ciliary activity was assessed at 4 days post-primary vaccination (dppv) and 4 days post-challenge (dpc). The experiment ended at 14 dpc with all remaining birds culled.</p>
Full article ">Figure 2
<p>The S gene from a pathogenic strain does not confer virulence to a non-pathogenic strain. SPF birds, at eight days of age, were vaccinated with either BeauR-M41(S), BeauR-4/91(S), or PBS for mock vaccination. (<b>a</b>) The number of snicks in each group was assessed from day three to seven days post-primary vaccination (dppv). The numbers of snicks were independently counted over a two-minute period by two or three persons with the average (mean) of these scores presented; (<b>b</b>) Trachea was harvested from five randomly sampled birds four dppv. Each trachea was sectioned in 10 × 1 mm rings and the ciliary activity of each ring was assessed by light microscopy and the percentage activity calculated. Plotted points represent individual birds and the mean activity of the 10 rings assessed. Error bars represent standard error of the mean (SEM). Statistical differences were evaluated using a Kruskal–Wallis test followed by a post hoc Mann–Whitney test corrected for multiple comparisons; no differences were identified; (<b>c</b>) Fourteen days post-primary vaccination, birds received a secondary vaccination of either BeauR-M41(S), BeauR-4/91(S), or PBS for mock vaccination. The numbers of snicks in each group were independently counted over a two-minute period by two or three persons from day three to seven post-secondary vaccination (dpsv) with the average (mean) of these scores presented. Snicking post-secondary vaccination was comparable between the vaccinated groups and the mock vaccinated groups.</p>
Full article ">Figure 3
<p>Vaccination with BeauR-M41(S) or BeauR-4/91(S) reduced the clinical signs observed after challenge with QX but was not able to protect against tracheal ciliostasis. Nine days post-secondary vaccination, birds were challenged with QX or mock challenged with PBS. (<b>a</b>) The numbers of snicks in each group were assessed from 2 to 7 dpc. Snicks were independently counted by two or three persons over a two-minute period with the average of these scores presented; (<b>b</b>) Birds were individually assessed for tracheal rales from 2 to 7 dpc. The percentage of birds per group positive for rales was calculated; (<b>c</b>) Trachea was harvested from 5 or 10 randomly sampled birds at 4 dpc. Each trachea was sectioned in 10 × 1 mm rings and the ciliary activity of each ring was assessed by light microscopy and the percentage activity calculated. Plotted points represent individual birds and the mean activity of the 10 rings assessed. Error bars represent SEM. Statistical differences were evaluated using a Kruskal–Wallis test followed by a post Hoc Mann–Whitney test corrected for multiple comparisons and are highlighted by * (<span class="html-italic">p</span> &lt; 0.0001). Ciliary activity in all groups except BeauR-M41(S)/BeauR-4/91(S) was significantly reduced as compared with the mock vaccinated/mock challenged (Mock/Mock/Mock) group; ciliary activity in all vaccinated groups was comparable to the mock vaccinated/challenged (Mock/Mock/QX) control group.</p>
Full article ">Figure 4
<p>Vaccination with BeauR-M41(S)/BeauR-M41(S) and BeauR-4/91(S)/BeauR-4/91(S) resulted in a reduction in infectious viral load in response to the QX challenge within the trachea 4 dpc. Tissue-derived supernatant prepared from tracheas harvested at 4 dpc were titrated in ex vivo tracheal organ cultures (TOCs). Data points represent individual birds, with lines representing the mean and standard deviation (SD). Statistical differences between vaccinated groups and mock vaccinated/challenged control group (Mock/Mock/QX) highlighted by * (<span class="html-italic">p</span> &lt; 0.05) were evaluated using a one–way ANOVA with a Tukey test for multiple comparisons.</p>
Full article ">Figure 5
<p>Vaccination with BeauR/M41(S)/BeauR-4/91(S) and BeauR-4/91(S)/BeauR-M41(S) resulted in a reduction in viral load in response to a QX challenge in the conjunctiva-associated lymphoid tissue (CALT) at 4 dpc. Relative viral RNA loads (expressed as corrected 40 cycle threshold) were assessed at specific time-points post-challenge. (<b>a</b>) Harderian gland at 2 dpc; (<b>b</b>) CALT at 2 dpc; (<b>c</b>) Harderian gland at 4 dpc; (<b>d</b>) CALT at 4 dpc. Data points are shown as the mean of three technical replicates per individual bird. Lines represent group mean and SEM. Statistical differences between the groups were evaluated using a one-way ANOVA with a TUKEY test for multiple comparisons. Significant differences between vaccinated groups and the mock vaccinated/challenged control group (Mock/Mock/QX) are highlighted by * (<span class="html-italic">p</span> &lt; 0.05).</p>
Full article ">Figure 6
<p>Vaccination with recombinant infectious bronchitis virus (rIBV) BeauR-M41(S) and BeauR-4/91(S) induced the production of IBV-specific antibodies and primed chickens for a boosted humoral response to challenge. Serum anti-IBV antibody titres were assessed by commercial ELISA (BioCheck, Reeuwijk, The Netherlands). (<b>a</b>) Pre-challenge serum samples were diluted 1:80 and dilutions 1:80 through to 1:2560 were investigated for (<b>b</b>) 4 dpc serum samples and (<b>c</b>) 14 dpc serum samples. The mean S/P of four technical replicates of each bird from each group is presented. The cut-off threshold for positive samples is S/P ratio = 0.2. The error bars represent SD. Statistical differences between the group antibody titre means at (a) pre-challenge were assessed using Kruskal–Wallis and Dunn’s multiple comparison test. Post-challenge (b) and (c), antibody titres were assessed using a one-way ANOVA with a Friedman test and Dunn’s multiple comparison test. Significant differences between vaccinated groups and the mock vaccinated/challenged (Mock/Mock/QX) control group are highlighted by * (<span class="html-italic">p</span> &lt; 0.05), ** (<span class="html-italic">p</span> &lt; 0.01), and **** (<span class="html-italic">p</span> &lt; 0.0001).</p>
Full article ">
17 pages, 986 KiB  
Review
Modulation of Anti-Tumour Immune Responses by Probiotic Bacteria
by Georgios Aindelis and Katerina Chlichlia
Vaccines 2020, 8(2), 329; https://doi.org/10.3390/vaccines8020329 - 21 Jun 2020
Cited by 21 | Viewed by 6001
Abstract
There is a growing amount of evidence to support the beneficial role of a balanced intestinal microbiota, or distinct members thereof, in the manifestation and progression of malignant tumours, not only in the gastrointestinal tract but also in distant tissues as well. Intriguingly, [...] Read more.
There is a growing amount of evidence to support the beneficial role of a balanced intestinal microbiota, or distinct members thereof, in the manifestation and progression of malignant tumours, not only in the gastrointestinal tract but also in distant tissues as well. Intriguingly, bacterial species have been demonstrated to be indispensable modulatory agents of widely-used immunotherapeutic or chemotherapeutic regiments. However, the exact contribution of commensal bacteria to immunity, as well as to neoplasia formation and response to treatment, has not been fully elucidated, and most of the current knowledge acquired from animal models has yet to be translated to human subjects. Here, recent advances in understanding the interaction of gut microbes with the immune system and the modulation of protective immune responses to cancer, either naturally or in the context of widely-used treatments, are reviewed, along with the implications of these observations for future therapeutic approaches. In this regard, bacterial species capable of facilitating optimal immune responses against cancer have been surveyed. According to the findings summarized here, we suggest that strategies incorporating probiotic bacteria and/or modulation of the intestinal microbiota can be used as immune adjuvants, aiming to optimize the efficacy of cancer immunotherapies and conventional anti-tumour treatments. Full article
(This article belongs to the Section Cancer Vaccines and Immunotherapy)
Show Figures

Figure 1

Figure 1
<p>Effect of probiotic bacteria on the cancer–immunity cycle. Probiotic bacteria affect and can modulate different stages in the cancer–immunity cycle, such as cancer antigen presentation, the priming and activation of T cells, the trafficking of T cells to tumours and the infiltration of CD8+ cells into tumours, as well as the killing of cancer cells and release of tumour antigens. Several molecules are upregulated (green-blue color) or downregulated [orange color] following the administration of probiotic bacteria. The cancer–immunity cycle is adapted from [<a href="#B4-vaccines-08-00329" class="html-bibr">4</a>] and was designed with Biorender (<a href="http://www.biorender.com" target="_blank">www.biorender.com</a>).</p>
Full article ">
9 pages, 1295 KiB  
Article
Seroprevalence of Neutralizing Antibodies against Japanese Encephalitis Virus among Adolescents and Adults in Korea: A Prospective Multicenter Study
by Byung Ok Kwak, Young Se Kwon, Young Jin Hong, Chung Hyun Nahm, Woori Jang, Young Uh, Yong Gon Cho, Jimyung Kim, Myungshin Kim and Dong Hyun Kim
Vaccines 2020, 8(2), 328; https://doi.org/10.3390/vaccines8020328 - 19 Jun 2020
Cited by 8 | Viewed by 3400
Abstract
The immunization schedule for the Japanese encephalitis (JE) vaccine in Korea is a two-dose primary series at 12–24 months of age, followed by booster doses 12 months after the second dose and at the ages of 6 and 12 years. Although the number [...] Read more.
The immunization schedule for the Japanese encephalitis (JE) vaccine in Korea is a two-dose primary series at 12–24 months of age, followed by booster doses 12 months after the second dose and at the ages of 6 and 12 years. Although the number of JE cases has markedly decreased after the universal vaccination program, JE predominantly occurs in adults. The aim of this study was to assess the age-specific prevalence of the JE-neutralizing antibody (NTAb) among adolescents and adults in Korea. A total of 1603 specimens were collected from a healthy Korean population above 15 years old in five provinces. The JE-NTAb titers were measured with the pseudotyped virus assay and considered to be positive at ≥ 1:50. The seropositivity of JE-NTAb was the highest in the 15–29 years category (>95%) and gradually began to decrease in the age group of 30–44 years (89.42%). The lowest and second lowest JE-NTAb seropositive rates were observed among those aged 70 years or older (59.77%) and those aged 55–59 years (75.24%), respectively. Subjects from Seoul exhibited the highest JE-NTAb titer in all age groups compared to other provinces. In conclusion, the JE-NTAb seropositive rates and titers have maintained appropriate levels in the general Korean population. We propose that adult immunization and boosters at 12 years of age against JE are not strongly recommended in Korea. Full article
(This article belongs to the Section Attenuated/Inactivated/Live and Vectored Vaccines)
Show Figures

Figure 1

Figure 1
<p>Geographical distribution of the study population.</p>
Full article ">Figure 2
<p>Age-specific seropositive rates of neutralizing antibody to Japanese encephalitis.</p>
Full article ">Figure 3
<p>Regression model between the pseudotyped virus (PV) assay and the plaque reduction neutralization test (PRNT). log<sub>10</sub>(PV) = 0.2801 + 0.8502 × log<sub>10</sub>(PRNT).</p>
Full article ">
18 pages, 640 KiB  
Article
Trends, Coverage and Influencing Determinants of Influenza Vaccination in the Elderly: A Population-Based National Survey in Spain (2006–2017)
by Silvia Portero de la Cruz and Jesús Cebrino
Vaccines 2020, 8(2), 327; https://doi.org/10.3390/vaccines8020327 - 19 Jun 2020
Cited by 17 | Viewed by 3852
Abstract
Influenza is a significant public health problem and the elderly are at a greater risk of contracting the disease. The vaccination coverage of the elderly is below the Spanish target of 65% for each influenza season. The aims of this study were to [...] Read more.
Influenza is a significant public health problem and the elderly are at a greater risk of contracting the disease. The vaccination coverage of the elderly is below the Spanish target of 65% for each influenza season. The aims of this study were to report the coverage of influenza vaccination in Spain among the population aged ≥65 years and high-risk groups for suffering chronic diseases, to analyze the time trends from 2006 to 2017 and to identify the factors which affect vaccination coverage. A nationwide cross-sectional study was conducted including 20,753 non-institutionalized individuals aged ≥65 years who had participated in the Spanish National Health Surveys in 2006, 2011/2012, and 2017. Sociodemographic, health-related variables, and influenza vaccination data were used. A logistic regression analysis was performed to determine the variables associated with influenza vaccination. Influenza vaccination coverage was 60%. By chronic condition, older people with high cholesterol levels and cancer had the lowest vaccination coverage (62.41% and 60.73%, respectively). This coverage declined from 2006 to 2017 in both groups. Higher influenza vaccination was associated with males, Spanish nationality, normal social support perceived, polypharmacy, worse perceived health, participation in other preventive measures, and increasing age and the number of chronic diseases. Full article
Show Figures

Graphical abstract

Graphical abstract
Full article ">Figure 1
<p>Patterns of influenza vaccination coverage according to chronic diseases in people aged ≥65 years in Spain. Spanish National Health Surveys 2006–2017.</p>
Full article ">
21 pages, 5934 KiB  
Article
IFN-I Independent Antiviral Immune Response to Vesicular Stomatitis Virus Challenge in Mouse Brain
by Anurag R. Mishra, Siddappa N. Byrareddy and Debasis Nayak
Vaccines 2020, 8(2), 326; https://doi.org/10.3390/vaccines8020326 - 19 Jun 2020
Cited by 7 | Viewed by 5194
Abstract
Type I interferon (IFN-I) plays a pivotal role during viral infection response in the central nervous system (CNS). The IFN-I can orchestrate and regulate most of the innate immune gene expression and myeloid cell dynamics following a noncytopathic virus infection. However, the role [...] Read more.
Type I interferon (IFN-I) plays a pivotal role during viral infection response in the central nervous system (CNS). The IFN-I can orchestrate and regulate most of the innate immune gene expression and myeloid cell dynamics following a noncytopathic virus infection. However, the role of IFN-I in the CNS against viral encephalitis is not entirely clear. Here we have implemented the combination of global differential gene expression profiling followed by bioinformatics analysis to decipher the CNS immune response in the presence and absence of the IFN-I signaling. We observed that vesicular stomatitis virus (VSV) infection induced 281 gene changes in wild-type (WT) mice primarily associated with IFN-I signaling. This was accompanied by an increase in antiviral response through leukocyte vascular patrolling and leukocyte influx along with the expression of potent antiviral factors. Surprisingly, in the absence of the IFN-I signaling (IFNAR−/− mice), a significantly higher (1357) number of genes showed differential expression compared to the WT mice. Critical candidates such as IFN-γ, CCL5, CXCL10, and IRF1, which are responsible for the recruitment of the patrolling leukocytes, are also upregulated in the absence of IFN-I signaling. The computational network analysis suggests the presence of the IFN-I independent pathway that compensates for the lack of IFN-I signaling in the brain. The analysis shows that TNF-α is connected maximally to the networked candidates, thus emerging as a key regulator of gene expression and recruitment of myeloid cells to mount antiviral action. This pathway could potentiate IFN-γ release; thereby, synergistically activating IRF1-dependent ISG expression and antiviral response. Full article
(This article belongs to the Special Issue Virus Immune Escape and Host Immune System)
Show Figures

Figure 1

Figure 1
<p>Vesicular stomatitis virus (VSV) infection in the central nervous system (CNS) induces fatal encephalitis in wild type mice. (<b>A</b>) B6 mice (<span class="html-italic">n</span> = 4 per group) were injected intracerebrally with the designated doses of VSV to induce encephalitis. Intracardially perfused mouse brain was collected after 72 hpi to estimate brain viral load and to collect total cellular RNA. Total cellular RNA was later used for gene microarray analysis as well as for validation of real-time PCR assays. (<b>B</b>) Kaplan–Meier survival curve of animals challenged with the varying doses of VSV (doses represented in plaque-forming units (PFU) of VSV are shown in the panel to the right of the graph). (<b>C</b>) In this experiment, all animals were intracerebrally injected with 10<sup>4</sup> PFU of VSV, and brain viral loads were determined by plaque assay technique conducted in Vero cells at said time points and reported as PFU of VSV per gram of tissue.</p>
Full article ">Figure 2
<p>VSV infection in CNS induces microglia proliferation and myeloid cell recruitment. Mice were either infected with 10<sup>4</sup> PFU of VSV or mock-infected. At day two post-infection, the total CNS myeloid cell populations were analyzed by flow cytometry. (<b>A</b>) Representative dot plot showing the percentage increase in the number of microglia (CD45<sup>low</sup>, Thy1.2<sup>−</sup>, Gr1, and CD11b<sup>+</sup>) population in VSV-infected mice brain (<span class="html-italic">n</span> = 4 per group). An asterisk denotes statistical significance, *** denotes <span class="html-italic">p</span> value &lt; 0.001. (<b>B</b>) The bar graph represents the absolute count of myeloid cells obtained from mice brain (<span class="html-italic">n</span> = 4): microglia, neutrophils (CD45<sup>low</sup>, Thy.12<sup>−</sup>, CD11b<sup>+</sup> Gr1<sup>+</sup>, and Ly6C<sup>med</sup>), monocytes, and macrophages (CD45<sup>low</sup>, Thy.12<sup>−</sup>, Gr1<sup>−</sup>, CD11b<sup>+</sup>, and Ly6C<sup>high</sup>) in the CNS of mice (<span class="html-italic">n</span> = 4 per group) following VSV infection. Note an increase in the CNS myeloid cell number in VSV-infected animals compared to the mock-infected animals (<span class="html-italic">p</span> &gt; 0.05). (<b>C</b>) The two-photon light scanning microscopy (TPLSM) was performed through a surgically thinned skull window in mock-infected LysM-GFP reporter mice (upper row) and compared to VSV-infected mice at day three post-infection (lower row). Representative figure showing an increase in the number of cells infiltrated in the brain parenchyma (see corresponding <a href="#app1-vaccines-08-00326" class="html-app">movies Videos S1 and S2</a>). Blood vessels are represented in red, and macrophages, monocyte, and neutrophils are represented in green. Please note the presence of prominent vascular leakage (damaged blood vessels in red) in the VSV-infected brain. Surrounding this, a cluster of infiltrating cells are observed at the beginning of the movie; these cells later shifted to elsewhere over a time period of 4 h.</p>
Full article ">Figure 3
<p>VSV infection in the brain induces IFN-I-driven antiviral response. Microarray analysis was performed on the total RNA extracted from the mice brain (<span class="html-italic">n</span> = 4) tissue at day three post-infection and compared to the mock-infected mice. (<b>A</b>) A representative bar graph showing the top 10 differentially expressed gene candidates (blue represent upregulation while red represent downregulation). (<b>B</b>) Few selected genes falling to the category of antiviral response (STAT1, IRF-1, CXCL10, IFN-γ, and Viperin) were validated by RT-PCR experiments. The fold change in gene expression was calculated by normalizing the data with the housekeeping gene (β-actin) as an internal control from the same sample using ∆∆Ct method. * denotes <span class="html-italic">p</span>-value &lt; 0.05. (<b>C</b>) Ingenuity pathway analysis tool was used to predict the top biological canonical pathways corresponding to the gene expression profile and are represented here in the bar graph. The negative <span class="html-italic">log p</span> values are plotted on the graph <span class="html-italic">X</span>-axis.</p>
Full article ">Figure 4
<p>VSV infection induces a massive change in the gene expression in the absence of type I interferon. <span class="html-italic">Ifnar</span><sup>−/−</sup> mice (<span class="html-italic">n</span> = 4 per group) were intracerebrally infected with the VSV to induce encephalitis, and comparative CNS gene microarray analysis was performed along with the wild type mice. (<b>A</b>) The upper subset represents a Kaplan–Meier survival curve of animals, which shows a marginal delay in onset death in <span class="html-italic">Ifnar</span><sup>−/−</sup> mice. While the lower subset represents the brain viral titers determined by plaque assay, which shows a significant increase (<span class="html-italic">p</span> &lt; 0.05) in brain viral load in <span class="html-italic">Ifnar</span><sup>−/−</sup> mice. * denotes <span class="html-italic">p</span>-value &lt; 0.05 (<b>B</b>) Global heat map depicting the change in gene expression patterns and clustered based on functional relatedness (see corresponding <a href="#app1-vaccines-08-00326" class="html-app">Table S1</a>). The change in expression level is depicted by blue (upregulation pattern), red (downregulation pattern), and gray (no change in the pattern).</p>
Full article ">Figure 5
<p>VSV infection in the brain induces type I IFN signaling-independent innate immune pathways. Microarray analysis was performed on the total RNA extracted from the mice brains at day three post-infection along with mock-infected control. (<b>A</b>) A representative bar graph showing the top 10 candidates differentially (upregulated in blue and downregulated gene in red). (<b>B</b>) Ingenuity pathway analysis tool was used to find the top biological pathway in the VSV-infected mice brains and are represented in the bar graph. The negative log <span class="html-italic">p</span> values are plotted on the graph <span class="html-italic">X</span>-axis. (<b>C</b>) A few selected genes were subjected to qRT-PCR analysis to validate the temporal change in the expression observed in microarray analysis, e.g., CXCL10, CCL-5 IRFs, BST-2, Viperin, etc. The fold change in these genes was calculated by normalizing the data with housekeeping gene (β-actin) as an internal control from the same sample using ∆∆Ct method.</p>
Full article ">Figure 6
<p>Massive gene expression in the absence of IFN-I signaling during VSV infection. Representative heat maps are shown to differentially regulate genes (<span class="html-italic">p</span> &lt; 0.05, fold expression &gt;1.5) in the absence of the IFN-I signaling associated with the (<b>A</b>) IFN signaling, (<b>B</b>), nervous system, (<b>C</b>), innate immune response, and (<b>D</b>) olfactory related signaling genes at day two post-infection. The aforementioned function was assigned to a gene using the Ingenuity Pathway Analysis (IPA) analysis tool. Blue nodes = upregulated genes, red nodes = downregulated genes, gray nodes = no change.</p>
Full article ">Figure 7
<p>Network analysis of the up-regulated gene in <span class="html-italic">Ifnar</span><sup>−/−</sup> mice reveals a TNF to be a crucial regulator for antiviral immune response. The figure depicts a modular network formed using the upregulated genes. (<b>A</b>) protein-to-protein interaction (PPI) network was developed using the STRING (Search Tool for the Retrieval of Interacting Gene) database. The interaction was divided into four groups using the K-means clustering tool from the STRING database. Each group defines the essential unique function: group 1 includes metabolic pathway genes, group 2 comprises olfactory related gene, group 3 represents the protein translation gene, and group 4 contains antiviral response-related genes. (<b>B</b>) Later, group 4 genes representing the antiviral response were used for the interactome generation by using the STRING database. The network shows the maximum connectivity patterns where Jun was found to have the highest number of connective nodes, followed by that of TNF-α.</p>
Full article ">Figure 7 Cont.
<p>Network analysis of the up-regulated gene in <span class="html-italic">Ifnar</span><sup>−/−</sup> mice reveals a TNF to be a crucial regulator for antiviral immune response. The figure depicts a modular network formed using the upregulated genes. (<b>A</b>) protein-to-protein interaction (PPI) network was developed using the STRING (Search Tool for the Retrieval of Interacting Gene) database. The interaction was divided into four groups using the K-means clustering tool from the STRING database. Each group defines the essential unique function: group 1 includes metabolic pathway genes, group 2 comprises olfactory related gene, group 3 represents the protein translation gene, and group 4 contains antiviral response-related genes. (<b>B</b>) Later, group 4 genes representing the antiviral response were used for the interactome generation by using the STRING database. The network shows the maximum connectivity patterns where Jun was found to have the highest number of connective nodes, followed by that of TNF-α.</p>
Full article ">
14 pages, 265 KiB  
Article
Immunogenicity Measures of Influenza Vaccines: A Study of 1164 Registered Clinical Trials
by Alexander Domnich, Ilaria Manini, Donatella Panatto, Giovanna Elisa Calabrò and Emanuele Montomoli
Vaccines 2020, 8(2), 325; https://doi.org/10.3390/vaccines8020325 - 19 Jun 2020
Cited by 13 | Viewed by 3359
Abstract
Influenza carries an enormous burden each year. Annual influenza vaccination is the best means of reducing this burden. To be clinically effective, influenza vaccines must be immunogenic, and several immunological assays to test their immunogenicity have been developed. This study aimed to describe [...] Read more.
Influenza carries an enormous burden each year. Annual influenza vaccination is the best means of reducing this burden. To be clinically effective, influenza vaccines must be immunogenic, and several immunological assays to test their immunogenicity have been developed. This study aimed to describe the patterns of use of the various immunological assays available to measure the influenza vaccine-induced adaptive immune response and to determine its correlates of protection. A total of 76.5% of the studies included in our analysis measured only the humoral immune response. Among these, the hemagglutination-inhibition assay was by far the most widely used. Other, less common, humoral immune response assays were: virus neutralization (21.7%), enzyme-linked immunosorbent (10.1%), single radial hemolysis (4.6%), and assays able to quantify anti-neuraminidase antibodies (1.7%). By contrast, cell-mediated immunity was quantified in only 23.5% of studies. Several variables were significantly associated with the use of single assays. Specifically, some influenza vaccine types (e.g., adjuvanted, live attenuated and cell culture-derived or recombinant), study phase and study sponsorship pattern were usually found to be statistically significant predictors. We discuss the principal findings and make some suggestions from the point of view of the various stakeholders. Full article
(This article belongs to the Special Issue Progress on Seasonal and Pandemic Influenza Vaccines)
12 pages, 2239 KiB  
Article
The Effect of Vaccination with Live Attenuated Neethling Lumpy Skin Disease Vaccine on Milk Production and Mortality—An Analysis of 77 Dairy Farms in Israel
by Michal Morgenstern and Eyal Klement
Vaccines 2020, 8(2), 324; https://doi.org/10.3390/vaccines8020324 - 19 Jun 2020
Cited by 14 | Viewed by 5206
Abstract
Lumpy skin disease (LSD) is an economically important, arthropod borne viral disease of cattle. Vaccination by the live attenuated homologous Neethling vaccine was shown as the most efficient measure for controlling LSD. However, adverse effects due to vaccination were never quantified in a [...] Read more.
Lumpy skin disease (LSD) is an economically important, arthropod borne viral disease of cattle. Vaccination by the live attenuated homologous Neethling vaccine was shown as the most efficient measure for controlling LSD. However, adverse effects due to vaccination were never quantified in a controlled field study. The aim of this study was to quantify the milk production loss and mortality due to vaccination against LSD. Daily milk production, as well as culling and mortality, were retrieved for 21,844 cows accommodated in 77 dairy cattle farms in Israel. Adjusted milk production was calculated for each day during the 30 days post vaccination. This was compared to the preceding month by fitting mixed effects linear models. Culling and mortality rates were compared between the 60 days periods prior and post vaccination, by survival analysis. The results of the models indicate no significant change in milk production during the 30 days post vaccination period. No difference was observed between the pre- and post-vaccination periods in routine culling, as well as in immediate culling and in-farm mortality. We conclude that adverse effects due to Neethling vaccination are negligible. Full article
(This article belongs to the Special Issue Controlled Clinical Evaluation of Veterinary Vaccines)
Show Figures

Figure 1

Figure 1
<p>Overall number of observations and cows available for milk production analysis in each lactation group in 77 farms.</p>
Full article ">Figure 2
<p>Overall number of observations and cows available for survival analysis in each lactation group in 73 farms.</p>
Full article ">Figure 3
<p>The estimated daily milk change (Kg) per cow in 73 dairy cattle farms in Israel, during a 30-day period after vaccination. Linear mixed effects model was fitted to the milk production gaps (MPG) for each cow with distance from vaccination day (DIV) as a fixed variable and the farm as a random variable. This was performed separately for lactation group 1 (Lac 1), lactation group 2 (Lac 2), lactation group &gt;2 (Lac &gt; 2), and all lactation groups combined (All lactations). For specific details on the model, see text.</p>
Full article ">Figure 4
<p>The estimated daily milk change (Kg) per cow in 4 dairy cattle farms in Israel, during a 30-day period after vaccination. Linear mixed effects model was fitted to the milk production gaps (MPG) for each cow with distance from vaccination day (DIV) as a fixed variable and the farm as a random variable. This was performed separately for lactation group 1 (Lac 1-naive), lactation group 2 (Lac 2-mixed: naïve and vaccinated), lactation group &gt;2 (Lac &gt; 2-vaccinated), and all lactations groups combined (All lactations). For specific details on the model, see text.</p>
Full article ">Figure 5
<p>Kaplan-Meier survival curves as a function of vaccination status in 73 dairy cattle farms in Israel. (<b>a</b>) Event defined as in-farm death or urgent culling. (<b>b</b>) Event defined as in-farm death, urgent culling, or routine culling.</p>
Full article ">
14 pages, 5253 KiB  
Article
Liver Stiffness Hinders Normalization of Systemic Inflammation and Endothelial Activation after Hepatitis C Virus (HCV) Eradication in HIV/HCV Coinfected Patients
by Beatriz Álvarez, Clara Restrepo, Marcial García, María A. Navarrete-Muñoz, María A. Jiménez-Sousa, Laura Prieto, Alfonso Cabello, Sara Nistal, Salvador Resino, Miguel Górgolas, Norma Rallón and José M. Benito
Vaccines 2020, 8(2), 323; https://doi.org/10.3390/vaccines8020323 - 19 Jun 2020
Cited by 6 | Viewed by 3037
Abstract
Systemic inflammation, endothelial dysfunction and coagulopathy are of high clinical relevance in the management of people living with HIV (PLWH), and even more in patients coinfected with hepatitis C virus (HCV). It has been suggested a significant impact of HCV coinfection on these [...] Read more.
Systemic inflammation, endothelial dysfunction and coagulopathy are of high clinical relevance in the management of people living with HIV (PLWH), and even more in patients coinfected with hepatitis C virus (HCV). It has been suggested a significant impact of HCV coinfection on these conditions. However, HCV can be eradicated in most patients with the new direct-acting antivirals (DAAs) therapy. We have analyzed the effect of HCV on systemic inflammation, endothelial activation and coagulopathy in PLWH and its evolution after HCV eradication with DAAs. Twenty-five HIV/HCV coinfected (HIV/HCV group), 25 HIV monoinfected (HIV group) and 20 healthy controls (HC) were included in the study. All patients were on ART and HIV suppressed. Levels of fourteen markers of systemic inflammation, endothelial activation and coagulopathy (IL-1ß, IL-6, IL-12p70, IL-8, TNFα, D-dimer, Eotaxin, IL-18, IP-10, monocyte chemotactic protein-1 (MCP-1), plasminogen activator inhibitor-1 (PAI-1), TNFα receptor 1 (TNFR1), vascular cell adhesion molecule 1 (VCAM-1) and intercellular adhesion molecule 1 (ICAM-1)) were measured on plasma at baseline and after DAAs-mediated HCV eradication. Non-parametric tests were used to establish inter/intra-group differences. At baseline, the HIV/HCV group showed increased levels of IL-18 (p = 0.028), IP-10 (p < 0.0001), VCAM-1 (p < 0.0001) and ICAM-1 (p = 0.045), compared to the HC and HIV groups, with the highest levels for IL18 and IP10 observed in HIV/HCV patients with increased liver stiffness (≥7.1 KPa). Eradication of HCV with DAAs-based therapy restored some but not all the evaluated parameters. VCAM-1 remained significantly increased compared to HC (p = 0.001), regardless of the level of basal liver stiffness in the HIV/HCV group, and IP-10 remained significantly increased only in the HIV/HCV group, with increased level of basal liver stiffness compared to the HC and to the HIV groups (p = 0.006 and p = 0.049, respectively). These data indicate that DAAs therapy in HIV/HCV co-infected patients and HCV eradication does not always lead to the normalization of systemic inflammation and endothelial dysfunction conditions, especially in cases with increased liver stiffness. Full article
(This article belongs to the Special Issue Research on Innate Immunity and Inflammation)
Show Figures

Figure 1

Figure 1
<p>Box-plots graphs showing the levels of IL-18 (<b>A</b>), IP-10 (<b>B</b>), vascular cell adhesion molecule 1 (VCAM-1) (<b>C</b>) and intercellular adhesion molecule 1 (ICAM-1) (<b>D</b>) in healthy controls (HC) donors, HIV monoinfected (HIV), and in HIV/ hepatitis C virus (HCV) coinfected patients before direct-acting antivirals (DAAs) treatment (pre-DAAs HIV/HCV). <span class="html-italic">p</span>-values for global comparison between the groups (Kruskal-Wallis test, K-W) are shown. (<b>*</b>): <span class="html-italic">p</span> &lt; 0.05 with respect to HC donors (Mann-Whitney U test). (<b>¶</b>): <span class="html-italic">p</span> &lt; 0.05 with respect to the HIV group (Mann-Whitney U test).</p>
Full article ">Figure 2
<p>Box-plots graphs showing the levels of IL-18 (<b>A</b>), IP-10 (<b>B</b>), VCAM-1 (<b>C</b>) and ICAM-1 (<b>D</b>) in HC donors, HIV monoinfected, and HIV/HCV coinfected patients at baseline (before DAAs treatment) stratified according to level of liver stiffness (LS). <span class="html-italic">p</span>-values for global comparison between the groups (Kruskal-Wallis test, K-W) and for the comparison between the two groups of HIV/HCV patients (Mann-Whitney U test) are shown. (<b>*</b>): <span class="html-italic">p</span> &lt; 0.05 with respect to HC donors (Mann-Whitney U test). (<b>¶</b>): <span class="html-italic">p</span> &lt; 0.05 with respect to the HIV group (Mann-Whitney U test).</p>
Full article ">Figure 3
<p>Box-plots graphs showing the levels of IL-18 (<b>A</b>), IP-10 (<b>B</b>), VCAM-1 (<b>C</b>) and ICAM-1 (<b>D</b>) in HC donors, HIV mono-infected, and HIV/HCV co-infected patients at 12 weeks after the end of DAAs therapy (post-DAAs HIV/HCV). <span class="html-italic">p</span>-values for the global comparison between the groups (Kruskal-Wallis test; K-W) are shown. (<b>*</b>): <span class="html-italic">p</span> &lt; 0.05 with respect to the HC group (Mann-Whitney U test).</p>
Full article ">Figure 4
<p>Box-plots graphs showing the levels of IP-10 (<b>A</b>), and VCAM-1 (<b>B</b>), in HC donors (HC), HIV monoinfected (HIV), and HIV/HCV coinfected patients at 12 weeks after the end of DAAs therapy (post-DAAs HIV/HCV), stratified according to the level of liver stiffness (LS) at baseline (before DAAs treatment). <span class="html-italic">p</span>-values for the global comparison between the groups (Kruskal-Wallis test; K-W) are shown. (*): <span class="html-italic">p</span> &lt; 0.05 with respect to HC donors (Mann-Whitney U test). (¶): <span class="html-italic">p</span> &lt; 0.05 with respect to the HIV group (Mann-Whitney U test).</p>
Full article ">
9 pages, 348 KiB  
Review
Livestock and Poultry Production in Nepal and Current Status of Vaccine Development
by Uddab Poudel, Umesh Dahal, Nabin Upadhyaya, Saroj Chaudhari and Santosh Dhakal
Vaccines 2020, 8(2), 322; https://doi.org/10.3390/vaccines8020322 - 19 Jun 2020
Cited by 20 | Viewed by 15833
Abstract
The livestock and poultry sectors are an integral part of Nepalese economy and lifestyle. Livestock and poultry populations have continuously been increasing in the last decade in Nepal and are likely to follow that trend as the interests in this field is growing. [...] Read more.
The livestock and poultry sectors are an integral part of Nepalese economy and lifestyle. Livestock and poultry populations have continuously been increasing in the last decade in Nepal and are likely to follow that trend as the interests in this field is growing. Infectious diseases such as Foot and Mouth Disease (FMD), Peste des Petits Ruminants (PPR), hemorrhagic septicemia (HS), black quarter (BQ), swine fever, avian influenza, and Newcastle disease (ND) constitute one of the major health challenges to the Nepalese livestock and poultry industry. Vaccinations are an efficient means of preventing the occurrence and spread of several diseases in animals and birds. Considering this fact, the government of Nepal began the production of veterinary vaccines in the 1960s. Nepal is self-reliant in producing several vaccines for cattle and buffaloes, sheep and goats, pigs, and poultry. Despite these efforts, the demand for vaccines is not met, especially in the commercial poultry sector, as Nepal spends billions of rupees in vaccine imports each year. There is a need of strengthening laboratory facilities for the isolation and characterization of field strains of pathogens and capacity building for the production of different types of vaccines using the latest technologies to be self-reliant in veterinary vaccine production in the future in Nepal. Full article
(This article belongs to the Section Veterinary Vaccines)
Show Figures

Figure 1

Figure 1
<p>History of vaccination and vaccine production for livestock and poultry in Nepal. Abbreviations: RP—rinderpest, HS—hemorrhagic septicemia, FMD—foot and mouth disease, ND—Newcastle disease, BQ—black quarter, CSF—classical swine fever, PPR—Peste des Petits Ruminants, and IBD—infectious bursal disease.</p>
Full article ">
17 pages, 4355 KiB  
Article
Overcoming Tumor Resistance to Oncolyticvaccinia Virus with Anti-PD-1-Based Combination Therapy by Inducing Antitumor Immunity in the Tumor Microenvironment
by So Young Yoo, Narayanasamy Badrinath, Su-Nam Jeong, Hyun Young Woo and Jeong Heo
Vaccines 2020, 8(2), 321; https://doi.org/10.3390/vaccines8020321 - 19 Jun 2020
Cited by 20 | Viewed by 4365
Abstract
The tumor microenvironment (TME) comprises different types of immune cells, which limit the therapeutic efficacy of most drugs. Although oncolytic virotherapy (OVT) boosts antitumor immunity via enhanced infiltration of tumor-infiltrated lymphocytes (TILs), immune checkpoints on the surface of tumors and TILs protect tumor [...] Read more.
The tumor microenvironment (TME) comprises different types of immune cells, which limit the therapeutic efficacy of most drugs. Although oncolytic virotherapy (OVT) boosts antitumor immunity via enhanced infiltration of tumor-infiltrated lymphocytes (TILs), immune checkpoints on the surface of tumors and TILs protect tumor cells from TIL recognition and apoptosis. OVT and immune checkpoint blockade (ICB)-based combination therapy might overcome this issue. Therefore, combination immunotherapies to modify the immunosuppressive nature of TME and block immune checkpoints of immune cells and tumors are considered. In this study, cancer-favoring oncolytic vaccinia virus (CVV) and anti–programmed cell death protein-1 (anti-PD-1) were used to treat mouse colorectal cancer. Weekly-based intratumoral CVV and intraperitoneal anti-PD-1 injections were performed on Balb/c mice with subcutaneous CT26 tumors. Tumor volume, survival curve, and immunohistochemistry-based analysis demonstrated the benefit of co-treatment, especially simultaneous treatment with CVV and anti-PD-1. Infiltration of CD8+PD-1+ T-cells showed correlation with these results. Splenocytes enumeration also suggested CD4+ and CD8+ T-cell upregulation. In addition, upregulated CD8, PD-1, and CD86 messenger RNA expression was observed in this combination therapy. Therefore, CVV+anti-PD-1 combination therapy induces antitumor immunity in the TME, overcoming the rigidity and resistance of the TME in refractory cancers. Full article
(This article belongs to the Special Issue Cancer Vaccine)
Show Figures

Figure 1

Figure 1
<p>Oncolytic activity of the cancer-favoring oncolytic vaccinia virus (CVV) in different type of cancer cell lines. The viability (%) of four different cancer types (liver, colon, pancreas, bile duct) against the CVV at different multiplicity of infection (MOI).</p>
Full article ">Figure 2
<p>Monotherapy and combination therapy of CVV and anti–programmed cell death protein-1 (anti-PD-1). (<b>a</b>) Combination therapy strategies. To reveal the specific effects of CVV and anti-PD-1 in the therapeutic efficacy of combination therapy, mice were divided into three groups: CVV+anti-PD-1, anti-PD-1→CVV, and CVV→anti-PD-1. (<b>b</b>) Weekly combination therapy schedule. Subcutaneous CT26 tumors were induced in six-week-old male Balb/c mice using 5 × 10<sup>6</sup> CT26 cells/100 µL of 1X phosphate-buffered saline (PBS). After the tumor volume reached 100 mm<sup>3</sup>, mice were separated into different groups for treatment (<span class="html-italic">n</span> = 8–10 in each group). The control group received 100 µL of 1X PBS up to six weeks (D1, D8, D15, D22, D29, D36, and D40). The anti-PD-1 group received 250 µg of RMP1-14 intraperitoneally up to six weeks. The CVV group received 1 × 10<sup>7</sup>pfu of CVV intratumorally up to six weeks. The CVV+anti-PD-1 group received both RMP1-14 and CVV on the same days up to six weeks. The anti-PD-1→CVV group received RMP1-14 consecutively for the first two weeks (D1 and D8), followed by CVV for the next two weeks (D15 and D22) and RMP1-14 injection was repeated for the last two weeks (D36 and 40). The CVV→anti-PD-1 group received CVV consecutively for the first two weeks (D1 and D8), followed by RMP1-14 for the next two weeks (D15 and D22), and CVV injection was repeated for the last two weeks (D36 and 40). The dosage and route of administration were the same as in the monotherapy groups. Two independent experiments were carried out as per the above schedule.</p>
Full article ">Figure 3
<p>Monotherapy and combination therapy of CVV and anti-PD-1 and their therapeutic efficacy. (<b>a</b>) CT26 tumor burden in Balb/c mice after combination therapy. CT26 cells (5 × 10<sup>6</sup> cells/100 µL of 1X PBS) were used to induce subcutaneous tumors in the left flank of Balb/c mice. Tumor burden was monitored twice weekly. When the tumor volume reached &gt;100 mm<sup>3</sup>, treatment was started (solid lines: responders, dashed lines: nonresponders). (<b>b</b>) On the basis of the tumor burden, mice were categorized as responders or nonresponders. Tumor volume in responders. * <span class="html-italic">p</span> &lt; 0.05; ** <span class="html-italic">p</span> &lt; 0.01; *** <span class="html-italic">p</span> &lt; 0.001. CVV, cancer-favoring oncolytic vaccinia virus; PD-1, programmed cell death protein-1; PBS, phosphate-buffered saline; D1, day 1; D8, day 8; D15, day 15; D22, day 22; D29, day 29; D36, day 36; D40, day 40.</p>
Full article ">Figure 4
<p>Survival curve analyses. Kaplan–Meier curves were plotted on the basis of tumor volume. Tumor volume &gt;1000 mm<sup>3</sup> was considered death. (<b>a</b>) Overall survival curve. (<b>b</b>) Overall survival curve: monotherapy vs. combination therapy. * <span class="html-italic">p</span> &lt; 0.05.</p>
Full article ">Figure 5
<p>Simultaneous combination therapy enhanced CD8<sup>+</sup> PD-1<sup>+</sup> T-cell infiltration in the tumor microenvironment (TME). After 40 days, the mice were euthanized and tumors collected for hematoxylin and eosin (H&amp;E) staining, immunohistochemistry (IHC), and immunofluorescence analysis. (<b>a</b>) Representative images of hematoxylin &amp; eosin (H&amp;E) staining and immunohistochemistry (IHC). (<b>b</b>) Immunofluorescence of CT26 tumors. (<b>c</b>) Fluorescence intensity of CD8<sup>+</sup> cells. (<b>d</b>) Fluorescence intensity of PD-1<sup>+</sup> cells. * <span class="html-italic">p</span> &lt; 0.05, one-way analysis of variance (ANOVA).</p>
Full article ">Figure 6
<p>mRNA quantification of PD-1, and PD-L1 from CT26 tumors. After 40 days, tumors derived from responders were harvested, total RNA was extracted, and cDNA was synthesized for mRNA quantification. (<b>a</b>) PD-1 expression. (<b>b</b>) PD-L1 expression from different groups. The relative ratio (β-actin used for normalization) was used to quantify mRNA expression. mRNA, messenger RNA; PD-1, programmed cell death protein-1. * <span class="html-italic">p</span> &lt; 0.05, one-way ANOVA.</p>
Full article ">Figure 7
<p>mRNA expression patterns of M1 (CD86 and iNOS) and M2 (Arg1 and IL10) markers from CT26 tumors. After 40 days, tumors derived from responders were harvested, total RNA was extracted, and cDNA was synthesized for mRNA quantification.* <span class="html-italic">p</span> &lt; 0.05, one-way ANOVA.</p>
Full article ">Figure 8
<p>The central immune system is activated by simultaneous combination therapy. Splenocytes enumeration of CT26 tumor–bearing Balb/c mice. After 40 days, spleens were harvested from responders and a single-cell preparation was made for flow cytometry. CD45<sup>+</sup>, CD8<sup>+</sup>, and CD4<sup>+</sup> cell populations were quantified. (<b>a</b>) Representative images of CD45<sup>+</sup>, CD4<sup>+</sup>, and CD8<sup>+</sup> T-cell histograms in all six groups.(<b>b</b>) Total number of CD45<sup>+</sup> cells in splenocytes.(<b>c</b>) CD4<sup>+</sup> T-cells % in CD45<sup>+</sup> cells in all six groups. (<b>d</b>) CD8<sup>+</sup> T-cells % in CD45<sup>+</sup> cells in all six groups.</p>
Full article ">Figure 9
<p>CVV and anti-PD-1-based combination therapy restores antitumor immunity in the TME. Simultaneous CVV and anti-PD-1 combination therapy induced CD8<sup>+</sup> PD-1<sup>+</sup> T-cell infiltration in the TME. Oncolysis of cancer cells by CVV might activate cancer-specific CD8<sup>+</sup> PD-1<sup>+</sup> T-cells. Oncolysis and decrease of PD-1 and tumor cell interaction by anti-PD-1 might inhibit tumor growth. CVV, cancer-favoring oncolytic vaccinia virus; PD-1, programmed cell death protein-1; TME, tumor microenvironment; TAA, tumor-associated antigen.</p>
Full article ">
4 pages, 192 KiB  
Viewpoint
Merit of an Ursodeoxycholic Acid Clinical Trial in COVID-19 Patients
by Subbaya Subramanian, Tinen Iles, Sayeed Ikramuddin and Clifford J. Steer
Vaccines 2020, 8(2), 320; https://doi.org/10.3390/vaccines8020320 - 19 Jun 2020
Cited by 33 | Viewed by 8127
Abstract
Corona Virus Disease 2019 (COVID-19) has affected over 8 million people worldwide. We underscore the potential benefits of conducting a randomized open-label unblinded clinical trial to evaluate the role of ursodeoxycholic acid (UDCA) in the treatment of COVID-19. Some COVID-19 patients are characterized [...] Read more.
Corona Virus Disease 2019 (COVID-19) has affected over 8 million people worldwide. We underscore the potential benefits of conducting a randomized open-label unblinded clinical trial to evaluate the role of ursodeoxycholic acid (UDCA) in the treatment of COVID-19. Some COVID-19 patients are characterized with cytokine storm syndrome that can cause severe and irreversible damage to organs leading to multi-organ failure and death. Therefore, it is critical to control both programmed cell death (apoptosis) and the hyper-immune inflammatory response in COVID-19 patients to reduce the rising morbidity and mortality. UDCA is an existing drug with proven safety profiles that can reduce inflammation and prevent cell death. National Geographic reported that, “China Promotes Bear Bile as Coronavirus Treatment”. Bear bile is rich in UDCA, comprising up to 40–50% of the total bile acid. UDCA is a logical and attainable replacement for bear bile that is available in pill form and merits clinical trial consideration. Full article
17 pages, 3169 KiB  
Article
Vaccination with Recombinant Subolesin Antigens Provides Cross-Tick Species Protection in Bos indicus and Crossbred Cattle in Uganda
by Paul D. Kasaija, Marinela Contreras, Fredrick Kabi, Swidiq Mugerwa and José de la Fuente
Vaccines 2020, 8(2), 319; https://doi.org/10.3390/vaccines8020319 - 18 Jun 2020
Cited by 33 | Viewed by 4278
Abstract
Cattle tick infestations and transmitted pathogens affect animal health, production and welfare with an impact on cattle industry in tropical and subtropical countries. Anti-tick vaccines constitute an effective and sustainable alternative to the traditional methods for the control of tick infestations. Subolesin (SUB)-based [...] Read more.
Cattle tick infestations and transmitted pathogens affect animal health, production and welfare with an impact on cattle industry in tropical and subtropical countries. Anti-tick vaccines constitute an effective and sustainable alternative to the traditional methods for the control of tick infestations. Subolesin (SUB)-based vaccines have shown efficacy for the control of multiple tick species, but several factors affect the development of new and more effective vaccines for the control of tick infestations. To address this challenge, herein we used a regional and host/tick species driven approach for vaccine design and implementation. The objective of the study was to develop SUB-based vaccines for the control of the most important tick species (Rhipicephalus appendiculatus, R. decoloratus and Amblyomma variegatum) affecting production of common cattle breeds (Bos indicus and B. indicus x B. taurus crossbred) in Uganda. In this way, we addressed the development of anti-tick vaccines as an intervention to prevent the economic losses caused by ticks and tick-borne diseases in the cattle industry in Uganda. The results showed the possibility of using SUB antigens for the control of multiple tick species in B. indicus and crossbred cattle and suggested the use of R. appendiculatus SUB to continue research on vaccine design and formulation for the control of cattle ticks in Uganda. Future directions would include quantum vaccinology approaches based on the characterization of the SUB protective epitopes, modeling of the vaccine E under Ugandan ecological and epidemiological conditions and optimization of vaccine formulation including the possibility of oral administration. Full article
Show Figures

Graphical abstract

Graphical abstract
Full article ">Figure 1
<p>Experimental design. The study design included the cloning and analysis of subolesin (SUB)-coding genes in Ugandan strains of <span class="html-italic">R. appendiculatus</span>, <span class="html-italic">R. decoloratus</span> and <span class="html-italic">A. variegatum</span>, followed by production of recombinant proteins and vaccine formulations with single and all combined antigens. Vaccination trials were conducted in the most common cattle breeds (<span class="html-italic">Bos indicus</span> and <span class="html-italic">B. indicus</span> × <span class="html-italic">B. taurus</span> crossbred) in Uganda using 4 calves/group and infested with <span class="html-italic">R. appendiculatus</span> and <span class="html-italic">A. variegatum</span> larvae, nymphs and adults and <span class="html-italic">R. decoloratus</span> larvae in crossbred cattle only. The effect of vaccination on cattle antibody response and on different tick developmental stages (number of engorged larvae (DL), nymphs (DN) and adult female ticks (DA), molting of tick larvae (DMn) and nymphs (DMa), oviposition (DO) and fertility (DF) was used to evaluate vaccine E.</p>
Full article ">Figure 2
<p>Phylogenetic analysis of SUB protein sequences. The evolutionary analysis was performed using the maximum likelihood method and JTT matrix-based model in Mega X. (<b>A</b>) <span class="html-italic">Rhipicephalus</span> spp.: The tree with the highest log likelihood (−1075.01) is shown. The percentage of trees in which the associated taxa clustered together is shown next to the branches. A discrete Gamma distribution was used to model evolutionary rate differences among sites (5 categories; +G, parameter = 1.7321). The tree is drawn to scale, with branch lengths measured in the number of substitutions per site. This analysis involved 34 amino acid sequences with a total of 192 positions in the final dataset. (<b>B</b>) <span class="html-italic">Amblyomma</span> spp.: The tree with the highest log likelihood (−722.52) is shown. The percentage of trees in which the associated taxa clustered together is shown next to the branches. The tree is drawn to scale, with branch lengths measured in the number of substitutions per site. This analysis involved 8 amino acid sequences with a total of 184 positions in the final dataset. Sequences from Ugandan tick strains are marked with a red arrow.</p>
Full article ">Figure 3
<p>Production of recombinant <span class="html-italic">R. appendiculatus</span>, <span class="html-italic">R. decoloratus</span> and <span class="html-italic">A. variegatum</span> SUB in <span class="html-italic">E. coli</span>. (<b>A</b>) alignment of SUB amino acid protein sequences. Distinctive amino acid residues are highlighted (blue: Identical only between <span class="html-italic">R. appendiculatus</span> and <span class="html-italic">R. decolortus</span>, green: Identical only between <span class="html-italic">A. variegatum</span> and <span class="html-italic">R. appendiculatus</span> and pink: Identical only between <span class="html-italic">A. variegatum</span> and <span class="html-italic">R. decoloratus</span>). Conserved residues between all sequences are indicated with asterisks (*). (<b>B</b>) ten μg per well of purified recombinant proteins were loaded into an SDS-12% polyacrylamide gel. Gels were stained with Coomassie Brilliant Blue or used for Western blot analysis. For Western blot analysis, the gel was transferred to a nitrocellulose membrane and the membrane was incubated with pooled sera collected from vaccinated cattle at day 60. The positions of the monomer and dimer recombinant proteins is indicated with black and grey arrows, respectively. Abbreviation: MW, molecular weight markers (Spectra multicolor broad range protein ladder; Thermo Scientific).</p>
Full article ">Figure 4
<p>Antibody response in SUB-vaccinated and control cattle. (<b>A</b>) <span class="html-italic">B. indicus</span> cattle. (<b>B</b>) crossbred cattle. Blood samples were collected before each vaccination (days 0, 30 and 60; violet arrows), at day 45 between second and third vaccinations and at the end of the experiment (days 180 or 195 for <span class="html-italic">B. indicus</span> and crossbred cattle, respectively). Serum IgG antibody titers were determined using an indirect antigen-specific ELISA. Antibody titers were expressed as the OD<sub>450 nm</sub> values and compared between vaccinated and control groups using a one-way ANOVA test (<a href="https://www.socscistatistics.com/tests/anova/default2.aspx" target="_blank">https://www.socscistatistics.com/tests/anova/default2.aspx</a>) (* <span class="html-italic">p</span> &lt; 0.05, ** <span class="html-italic">p</span> &lt; 0.005; <span class="html-italic">n</span> = 4 biological replicates).</p>
Full article ">Figure 5
<p>Effect of vaccination with SUB on different tick developmental stages. (<b>A</b>) tick developmental stages included in the analysis. (<b>B</b>) vaccination with <span class="html-italic">R. appendiculatus</span> SUB. (<b>C</b>) vaccination with <span class="html-italic">A. variegatum</span> SUB. (<b>D</b>) vaccination with <span class="html-italic">R. decoloratus</span> SUB. (<b>E</b>) vaccination with all combined SUB formulation. The tick developmental stages included DL, DN, DA, DMn, DMa, DO and DF. Only parameters with statistically significant differences (Chi-square test; <span class="html-italic">p</span> &lt; 0.05, <span class="html-italic">n</span> = 4 biological replicates; <a href="#app1-vaccines-08-00319" class="html-app">Data S1</a>) are shown here and were included in the vaccine E calculation.</p>
Full article ">Figure 6
<p>Analysis of vaccine E. Vaccine E (%) was calculated as 100 (1−(DL × DMn × DN × DMa × DA × DO × DF)), and only parameters with statistically significant differences (Chi-square test; <span class="html-italic">p</span> &lt; 0.05, <span class="html-italic">n</span> = 4 biological replicates; <a href="#app1-vaccines-08-00319" class="html-app">Data S1</a>) were included in the analysis. (<b>A</b>) results of the vaccination trials in <span class="html-italic">B. indicus</span> cattle. (<b>B</b>) results of the vaccination trials in crossbred cattle. (<b>C</b>) total vaccine E for each antigen against all tick species was compared between <span class="html-italic">B. indicus</span> and crossbred cattle by a Student’s t-test with unequal variance (<span class="html-italic">p</span> = 0.05; <span class="html-italic">n</span> = 2–3, i.e., three tick species in crossbred cattle or two tick species in <span class="html-italic">B. indicus</span>). (<b>D</b>) a Spearman’s Rho correlation analysis was performed between total vaccine E values for each antigen in all cattle breeds and tick species (f-ratio = 0.31, <span class="html-italic">p</span> = 0.82; <span class="html-italic">n</span> = 5, i.e., three tick species in crossbred cattle plus two tick species in <span class="html-italic">B. indicus</span>).</p>
Full article ">Figure 7
<p>Correlation analysis between anti-SUB antibody titers and vaccination effect on different tick developmental stages. (<b>A</b>) <span class="html-italic">B. indicus</span> cattle infested with <span class="html-italic">R. appendiculatus</span>. (<b>B</b>) crossbred cattle infested with <span class="html-italic">R. appendiculatus</span>. (<b>C</b>) crossbred cattle infested with <span class="html-italic">R. decoloratus</span>. (<b>D</b>) values (average + SD) of the parameters of the tick developmental stages used in the analysis (in red are shown the parameters with significant negative correlation with anti-SUB antibody titers and the threshold value line for observing significant differences). The correlation analyses were conducted between the values of the parameters of <span class="html-italic">Rhipicephalus</span> spp. tick life stages used for the calculation of vaccine E that showed significant differences with at least three of the SUB vaccine formulations (<a href="#vaccines-08-00319-t001" class="html-table">Table 1</a>) and the anti-<span class="html-italic">R. appendiculatus</span> SUB antibody titers at day 60 before tick challenge. All animals in both vaccinated and control groups were included in the analysis. Data was analyzed using a Spearman’s Rho correlation analysis (<span class="html-italic">p</span> ≤ 0.05; <span class="html-italic">n</span> = 20, i.e., 4 animals for each of the 5 vaccine formulations including the control).</p>
Full article ">
42 pages, 4917 KiB  
Article
Expression of the Reverse Transcriptase Domain of Telomerase Reverse Transcriptase Induces Lytic Cellular Response in DNA-Immunized Mice and Limits Tumorigenic and Metastatic Potential of Murine Adenocarcinoma 4T1 Cells
by Juris Jansons, Ekaterina Bayurova, Dace Skrastina, Alisa Kurlanda, Ilze Fridrihsone, Dmitry Kostyushev, Anastasia Kostyusheva, Alexander Artyuhov, Erdem Dashinimaev, Darya Avdoshina, Alla Kondrashova, Vladimir Valuev-Elliston, Oleg Latyshev, Olesja Eliseeva, Stefan Petkov, Maxim Abakumov, Laura Hippe, Irina Kholodnyuk, Elizaveta Starodubova, Tatiana Gorodnicheva, Alexander Ivanov, Ilya Gordeychuk and Maria Isaguliantsadd Show full author list remove Hide full author list
Vaccines 2020, 8(2), 318; https://doi.org/10.3390/vaccines8020318 - 18 Jun 2020
Cited by 2 | Viewed by 4796
Abstract
Telomerase reverse transcriptase (TERT) is a classic tumor-associated antigen overexpressed in majority of tumors. Several TERT-based cancer vaccines are currently in clinical trials, but immune correlates of their antitumor activity remain largely unknown. Here, we characterized fine specificity and lytic potential of immune [...] Read more.
Telomerase reverse transcriptase (TERT) is a classic tumor-associated antigen overexpressed in majority of tumors. Several TERT-based cancer vaccines are currently in clinical trials, but immune correlates of their antitumor activity remain largely unknown. Here, we characterized fine specificity and lytic potential of immune response against rat TERT in mice. BALB/c mice were primed with plasmids encoding expression-optimized hemagglutinin-tagged or nontagged TERT or empty vector and boosted with same DNA mixed with plasmid encoding firefly luciferase (Luc DNA). Injections were followed by electroporation. Photon emission from booster sites was assessed by in vivo bioluminescent imaging. Two weeks post boost, mice were sacrificed and assessed for IFN-γ, interleukin-2 (IL-2), and tumor necrosis factor alpha (TNF-α) production by T-cells upon their stimulation with TERT peptides and for anti-TERT antibodies. All TERT DNA-immunized mice developed cellular and antibody response against epitopes at the N-terminus and reverse transcriptase domain (rtTERT) of TERT. Photon emission from mice boosted with TERT/TERT-HA+Luc DNA was 100 times lower than from vector+Luc DNA-boosted controls. Bioluminescence loss correlated with percent of IFN-γ/IL-2/TNF-α producing CD8+ and CD4+ T-cells specific to rtTERT, indicating immune clearance of TERT/Luc-coexpressing cells. We made murine adenocarcinoma 4T1luc2 cells to express rtTERT by lentiviral transduction. Expression of rtTERT significantly reduced the capacity of 4T1luc2 to form tumors and metastasize in mice, while not affecting in vitro growth. Mice which rejected the tumors developed T-cell response against rtTERT and low/no response to the autoepitope of TERT. This advances rtTERT as key component of TERT-based therapeutic vaccines against cancer. Full article
(This article belongs to the Special Issue Cancer Immunotherapy: Advances and Future Prospects)
Show Figures

Figure 1

Figure 1
<p>Domain structure (<b>A</b>), evolutionary tree of rat, murine and human telomerase reverse transcriptase (TERT) proteins (UniProtKB, Q673L6, O70372, and O14746, respectively) (<b>B</b>); and regions of rat TERT containing clusters of T cell epitopes recognized by immune system of mice and humans: aa 351–400 in the TERT oligomerization domain, containing part of the ciliate-specific motif CP (<b>C</b>); aa 520–620 (<b>D</b>); aa 790–870 containing active center of telomerase reverse transcriptase LVVV required for nucleotide incorporation and primer extension (<b>E</b>); aa 891–940 containing motif required for oligomerization and sequence WCGLL responsible for primer grip (<b>F</b>); aa 971–1010 containing part of the C-Terminal Extension domain CTE (<b>G</b>). The domain structure of TERT includes: TEN—telomerase essential N-terminal domain, CTE—C-terminal extension; TRBD—telomerase RNA-binding domain; and RT—reverse transcriptase domain. Domain information is given according to UNIPROT (<a href="http://www.uniprot.org/uniprot/O14746" target="_blank">www.uniprot.org/uniprot/O14746</a>) and review by Rubtsova M.P. et al. [<a href="#B52-vaccines-08-00318" class="html-bibr">52</a>]. The evolutionary history was inferred using the neighbor-joining method [<a href="#B53-vaccines-08-00318" class="html-bibr">53</a>]. The evolutionary distances were computed using the p-distance method [<a href="#B54-vaccines-08-00318" class="html-bibr">54</a>] and were presented in the units reflecting the number of amino acid differences per site. Final dataset had a total of 1109 positions. Evolutionary analyses were conducted in Molecular Evolutionary Genetics Analysis software (MEGA7) [<a href="#B55-vaccines-08-00318" class="html-bibr">55</a>]. To visualize regions of rat TERT containing clusters of T cell epitopes recognized by immune system of mice and humans, epitope-rich fragments of rat TERT were aligned to the respective fragments of human TERT isotype 1 (UniProtKB # O14746.1) and mouse TERT (UniProtKB # O70372.1). Peptides representing known epitopes localized in these regions are abbreviated as “TERT” followed by the position of the first amino acid residue of the peptide according to their enumeration in rat TERT (UniProtKB #Q673L6.1) and reference to respective publications. Peptides TERT1 to TERT9 chosen for the analysis of immune response induced by TERT DNA based on the epitope analysis are outlined in bold letters in the alignment; their sequences within rat TERT (UniProtKB #Q673L6.1) are underlined or given in rectangular.</p>
Full article ">Figure 1 Cont.
<p>Domain structure (<b>A</b>), evolutionary tree of rat, murine and human telomerase reverse transcriptase (TERT) proteins (UniProtKB, Q673L6, O70372, and O14746, respectively) (<b>B</b>); and regions of rat TERT containing clusters of T cell epitopes recognized by immune system of mice and humans: aa 351–400 in the TERT oligomerization domain, containing part of the ciliate-specific motif CP (<b>C</b>); aa 520–620 (<b>D</b>); aa 790–870 containing active center of telomerase reverse transcriptase LVVV required for nucleotide incorporation and primer extension (<b>E</b>); aa 891–940 containing motif required for oligomerization and sequence WCGLL responsible for primer grip (<b>F</b>); aa 971–1010 containing part of the C-Terminal Extension domain CTE (<b>G</b>). The domain structure of TERT includes: TEN—telomerase essential N-terminal domain, CTE—C-terminal extension; TRBD—telomerase RNA-binding domain; and RT—reverse transcriptase domain. Domain information is given according to UNIPROT (<a href="http://www.uniprot.org/uniprot/O14746" target="_blank">www.uniprot.org/uniprot/O14746</a>) and review by Rubtsova M.P. et al. [<a href="#B52-vaccines-08-00318" class="html-bibr">52</a>]. The evolutionary history was inferred using the neighbor-joining method [<a href="#B53-vaccines-08-00318" class="html-bibr">53</a>]. The evolutionary distances were computed using the p-distance method [<a href="#B54-vaccines-08-00318" class="html-bibr">54</a>] and were presented in the units reflecting the number of amino acid differences per site. Final dataset had a total of 1109 positions. Evolutionary analyses were conducted in Molecular Evolutionary Genetics Analysis software (MEGA7) [<a href="#B55-vaccines-08-00318" class="html-bibr">55</a>]. To visualize regions of rat TERT containing clusters of T cell epitopes recognized by immune system of mice and humans, epitope-rich fragments of rat TERT were aligned to the respective fragments of human TERT isotype 1 (UniProtKB # O14746.1) and mouse TERT (UniProtKB # O70372.1). Peptides representing known epitopes localized in these regions are abbreviated as “TERT” followed by the position of the first amino acid residue of the peptide according to their enumeration in rat TERT (UniProtKB #Q673L6.1) and reference to respective publications. Peptides TERT1 to TERT9 chosen for the analysis of immune response induced by TERT DNA based on the epitope analysis are outlined in bold letters in the alignment; their sequences within rat TERT (UniProtKB #Q673L6.1) are underlined or given in rectangular.</p>
Full article ">Figure 2
<p>Immunization of BALB/c mice with TERT DNA, TERT variant with a C-terminal hemagglutinin tag (TERT-HA DNA), and empty vector followed by booster immunization with given plasmids mixed with DNA encoding firefly luciferase (Luc DNA), with follow up of luciferase expression by in vivo imaging. Scheme of the immunization (<b>A</b>); results of in vivo bioluminescence imaging of booster sites at days 1–12 post injection, example of 3 mice—one from TERT, one from TERT-HA, and one from empty vector group (<b>B</b>); dynamics of bioluminescence signal change in TERT, TERT-HA DNA, and empty vector-immunized mice on days 1–12 post booster injection; each line of different colors corresponds to one site of injection (two per mouse) (<b>C</b>); relative average level of bioluminescence signal for each group on days 1 to 12 post booster injection (<b>D</b>). Bioluminescence signal is represented by the total flux from site of immunization, mean ± SD. Analyzed by ordinary two-way ANOVA with Dunnett’s multiple comparison test, ** −<span class="html-italic">p</span> &lt; 0.01; **** −<span class="html-italic">p</span> &lt; 0.0001; ns—not significant.</p>
Full article ">Figure 3
<p>Immune recognition of TERT-derived peptides (<a href="#vaccines-08-00318-t001" class="html-table">Table 1</a>) by CD4+ and CD8+ T cells of mice DNA immunized with TERT or TERT-HA compared to vector-immunized mice analyzed by multiparametric flow cytometry. Percent of CD4+ (<b>A</b>) and CD8+ T cells (<b>B</b>) cells reacting to stimulation with TERT peptides by double cytokine production; percent of CD4+ and CD8+ T cells reacting with triple cytokine production (<b>C</b>); and cytokine production by CD4+ and CD8+ T lymphocytes stimulated with phorbol 12-myristate 13-acetate (PMA) (<b>D</b>). Values represent mean of all mice in each group ± SD. Difference between TERT, TERT-HA DNA-immunized, and control vector-immunized mice was analyzed by Mann–Whitney test. Difference between TERT, TERT-HA DNA-immunized, and control vector: * −<span class="html-italic">p</span> &lt; 0.05; ** −<span class="html-italic">p</span> &lt; 0.01. No difference between TERT and TERT-HA DNA-immunized mice was found, all <span class="html-italic">p</span> &gt; 0.05.</p>
Full article ">Figure 3 Cont.
<p>Immune recognition of TERT-derived peptides (<a href="#vaccines-08-00318-t001" class="html-table">Table 1</a>) by CD4+ and CD8+ T cells of mice DNA immunized with TERT or TERT-HA compared to vector-immunized mice analyzed by multiparametric flow cytometry. Percent of CD4+ (<b>A</b>) and CD8+ T cells (<b>B</b>) cells reacting to stimulation with TERT peptides by double cytokine production; percent of CD4+ and CD8+ T cells reacting with triple cytokine production (<b>C</b>); and cytokine production by CD4+ and CD8+ T lymphocytes stimulated with phorbol 12-myristate 13-acetate (PMA) (<b>D</b>). Values represent mean of all mice in each group ± SD. Difference between TERT, TERT-HA DNA-immunized, and control vector-immunized mice was analyzed by Mann–Whitney test. Difference between TERT, TERT-HA DNA-immunized, and control vector: * −<span class="html-italic">p</span> &lt; 0.05; ** −<span class="html-italic">p</span> &lt; 0.01. No difference between TERT and TERT-HA DNA-immunized mice was found, all <span class="html-italic">p</span> &gt; 0.05.</p>
Full article ">Figure 4
<p>Immune recognition of peptides TERT 1, 6, 7, and 8 (<a href="#vaccines-08-00318-t001" class="html-table">Table 1</a>) (<b>A</b>,<b>B</b>) and mitogen PMA (<b>C</b>,<b>D</b>) by splenocytes of individual TERT DNA, TERT-HA DNA, and vector-immunized mice, represented as a pile-up of the average percent of CD4+ (<b>A</b>,<b>C</b>) and CD8+ T cells (<b>B</b>,<b>D</b>) responding to in vitro antigen stimulation by production of only one, or only two, or only three cytokines (IFN-γ, IL-2, TNF-γ or IFN-γ/IL-2, IFN-γ/TNF-γ or IFN-γ/IL-2/TNF-γ, respectively, i.e., cell populations are nonoverlapping).</p>
Full article ">Figure 4 Cont.
<p>Immune recognition of peptides TERT 1, 6, 7, and 8 (<a href="#vaccines-08-00318-t001" class="html-table">Table 1</a>) (<b>A</b>,<b>B</b>) and mitogen PMA (<b>C</b>,<b>D</b>) by splenocytes of individual TERT DNA, TERT-HA DNA, and vector-immunized mice, represented as a pile-up of the average percent of CD4+ (<b>A</b>,<b>C</b>) and CD8+ T cells (<b>B</b>,<b>D</b>) responding to in vitro antigen stimulation by production of only one, or only two, or only three cytokines (IFN-γ, IL-2, TNF-γ or IFN-γ/IL-2, IFN-γ/TNF-γ or IFN-γ/IL-2/TNF-γ, respectively, i.e., cell populations are nonoverlapping).</p>
Full article ">Figure 5
<p>Recognition of the recombinant rtTERT and TERT-derived peptides by pooled sera of mice DNA-immunized with TERT and TERT-HA as compared to vector-immunized mice. Values represent average end point antibody titers of pooled sera in two independent ELISA runs performed in duplicate, with STDEV. *, significant difference between titers in TERT/TERT-HA DNA-immunized mice and control mice, <span class="html-italic">p</span> &lt; 0.05.</p>
Full article ">Figure 6
<p>Cell cycle distribution for daughter clones of 4T1luc2 expressing <span class="html-italic">rtTERT</span>: G1/G0 phase (<b>A</b>), S phase (<b>B</b>), and G2/M phase (<b>C</b>). Distribution of cells in G1/G0, S, and G2/M areas was assessed using Watson pragmatic algorithm [<a href="#B46-vaccines-08-00318" class="html-bibr">46</a>] in the NovoExpress software. In control groups, peak G1 was determined manually according to the manufacturer’s recommendations and peak G2 was set at ×1.75 of G1 peak. Further analysis was performed automatically with preset G1 and G2 peaks and CVs at all samples. Data were analyzed using two-tailed <span class="html-italic">t</span>-test, * <span class="html-italic">p</span> &lt; 0.05; ** <span class="html-italic">p</span> &lt; 0.01; ns—not significant.</p>
Full article ">Figure 7
<p>Fluorescent microscopy of 4T1luc2 cells (Panel <b>I</b>) and daughter clones expressing rtTERT: 4T1luc2_rtTERT_C6 (<b>II</b>), 4T1luc2_rtTERT_H9 (<b>III</b>), 4T1luc2_rtTERT_F1 (<b>IV</b>), and 4T1luc2_rtTERT_B5 (<b>V</b>). Staining of γ-H2AX foci (Ab 26350, Abcam; red channel); nuclear staining (DAPI, blue channel); TERT (Ab191523, Abcam; green channel); merging of channels (<b>A</b>); corrected total cell fluorescence (CTCF) for anti-γ-H2AX (red signal) and anti-TERT (green signal) relative to that exhibited by 4T1luc2, in percentage (<b>B</b>). For each cell line, at least five microscopic fields were assessed, and the average CTCF generated by specific staining were counted. CTCF was calculated for all cells as described in Materials and Methods. Results were analyzed using Kruskal–Wallis test with Dunn’s multiple comparison test. * <span class="html-italic">p</span> &lt; 0.05; **** <span class="html-italic">p</span> &lt; 0.0001.</p>
Full article ">Figure 8
<p>Generation of tumors by 4T1luc2 clones expressing rtTERT. Tumor growth rate was assessed using total fluorescence signal from the site of injection of 2500 (<b>A</b>), 5000 (<b>B</b>), and 10,000 (<b>C</b>) cells. Tumor volume was evaluated by total fluorescence signal from the site of cell injection by day 16 (<b>D</b>) or by calipering at day 21 (<b>E</b>). Histochemical characterization of the solid tumors formed by the parental 4T1luc2 cells (<b>F</b>) and their derivatives expressing rtTERT 4T1luc2_rtTERT_C6 (<b>G</b>); 4T1luc2_rtTERT_H9 (<b>H</b>) after ectopic implantation into BALB/c mice (H&amp;E staining, magnification 200×). Results of tumor growth (<b>A</b>–<b>C</b>) were analyzed using RM two-way ANOVA with Dunnett’s multiple comparison test. Data on tumor volumes (<b>D</b>,<b>E</b>) were analyzed using Kruskal–Wallis with Dunn’s multiple comparison test. * <span class="html-italic">p</span> &lt; 0.05; ** <span class="html-italic">p</span> &lt; 0.01; *** <span class="html-italic">p</span> &lt; 0.001; **** <span class="html-italic">p</span> &lt; 0.0001; ns—not significant.</p>
Full article ">Figure 8 Cont.
<p>Generation of tumors by 4T1luc2 clones expressing rtTERT. Tumor growth rate was assessed using total fluorescence signal from the site of injection of 2500 (<b>A</b>), 5000 (<b>B</b>), and 10,000 (<b>C</b>) cells. Tumor volume was evaluated by total fluorescence signal from the site of cell injection by day 16 (<b>D</b>) or by calipering at day 21 (<b>E</b>). Histochemical characterization of the solid tumors formed by the parental 4T1luc2 cells (<b>F</b>) and their derivatives expressing rtTERT 4T1luc2_rtTERT_C6 (<b>G</b>); 4T1luc2_rtTERT_H9 (<b>H</b>) after ectopic implantation into BALB/c mice (H&amp;E staining, magnification 200×). Results of tumor growth (<b>A</b>–<b>C</b>) were analyzed using RM two-way ANOVA with Dunnett’s multiple comparison test. Data on tumor volumes (<b>D</b>,<b>E</b>) were analyzed using Kruskal–Wallis with Dunn’s multiple comparison test. * <span class="html-italic">p</span> &lt; 0.05; ** <span class="html-italic">p</span> &lt; 0.01; *** <span class="html-italic">p</span> &lt; 0.001; **** <span class="html-italic">p</span> &lt; 0.0001; ns—not significant.</p>
Full article ">Figure 9
<p>Assessment of the level of infiltration of Luc-expressing tumor cells into the organs of BALB/c mice ectopically implanted with 4T1luc2 and derivative clones 4T1luc2_rtTERT_C6 and 4T1luc2_rtTERT_H9 expressing rat rtTERT. Infiltration of organs by Luc-expressing tumor cells assessed by ex vivo BLI of lungs (<b>A</b>), liver (<b>B</b>), spleen (<b>C</b>), and kidneys (<b>D</b>). Values represent the mean total flux (p/s) ± SD (<span class="html-italic">n</span> = 6). Histochemical characterization of liver metastases formed by the parental 4T1luc2 cells (<b>E</b>) and their derivatives 4T1luc2_rtTERT_C6 (<b>F</b>) and 4T1luc2_rtTERT_H9 (<b>G</b>); H&amp;E staining, magnification 400×. Comparison of the average number of liver metastases (<b>H</b>), each figure (red triangle, blue rectangular and black circle) represents single mouse), average size of liver metastases, in µm<sup>2</sup> (<b>I</b>), each figure (red triangle, blue rectangular and black circle) represents single metastase), and average nn of leukocytes infiltrating the liver (<b>J</b>), each figure (red triangle, blue rectangular and black circle) represents single mouse). Number and size of metastases and number of infiltrating leukocytes were calculated in 15 high power (400×) microscope fields of hematoxylin–eosin-stained slides by computer-assisted morphometry. Data were analyzed by Kruskal–Wallis test followed by Mann–Whitney test. * <span class="html-italic">p</span> &lt; 0.05; ** <span class="html-italic">p</span> &lt; 0.01; *** <span class="html-italic">p</span> &lt; 0.001; ns—not significant.</p>
Full article ">Figure 9 Cont.
<p>Assessment of the level of infiltration of Luc-expressing tumor cells into the organs of BALB/c mice ectopically implanted with 4T1luc2 and derivative clones 4T1luc2_rtTERT_C6 and 4T1luc2_rtTERT_H9 expressing rat rtTERT. Infiltration of organs by Luc-expressing tumor cells assessed by ex vivo BLI of lungs (<b>A</b>), liver (<b>B</b>), spleen (<b>C</b>), and kidneys (<b>D</b>). Values represent the mean total flux (p/s) ± SD (<span class="html-italic">n</span> = 6). Histochemical characterization of liver metastases formed by the parental 4T1luc2 cells (<b>E</b>) and their derivatives 4T1luc2_rtTERT_C6 (<b>F</b>) and 4T1luc2_rtTERT_H9 (<b>G</b>); H&amp;E staining, magnification 400×. Comparison of the average number of liver metastases (<b>H</b>), each figure (red triangle, blue rectangular and black circle) represents single mouse), average size of liver metastases, in µm<sup>2</sup> (<b>I</b>), each figure (red triangle, blue rectangular and black circle) represents single metastase), and average nn of leukocytes infiltrating the liver (<b>J</b>), each figure (red triangle, blue rectangular and black circle) represents single mouse). Number and size of metastases and number of infiltrating leukocytes were calculated in 15 high power (400×) microscope fields of hematoxylin–eosin-stained slides by computer-assisted morphometry. Data were analyzed by Kruskal–Wallis test followed by Mann–Whitney test. * <span class="html-italic">p</span> &lt; 0.05; ** <span class="html-italic">p</span> &lt; 0.01; *** <span class="html-italic">p</span> &lt; 0.001; ns—not significant.</p>
Full article ">Figure 10
<p>Immune recognition of TERT derived peptides by splenocytes of mice implanted with 4T1luc2, 4T1luc2_rtTERT_H9, or 4T1luc2_rtTERT_C6. Immune recognition is represented as percent of CD4+ (<b>A</b>) and CD8+ T cells (<b>B</b>) responding to stimulation with TERT 1, 2, 6, and 8 (<a href="#vaccines-08-00318-t001" class="html-table">Table 1</a>) by production of IFN-γ, IL-2, TNF-α, IFN-γ/IL-2, IFN-γ/TNF-α, and IFN-γ/IL-2/TNF-α registered by multiparametric flow cytometry. Graphs show a pile up of the average percent of cytokine secreting CD4+ and CD8+ T cells of four mice per group, assessed in two independent runs taking two mice from each group.</p>
Full article ">
13 pages, 2847 KiB  
Article
PD-1 Immune Checkpoint Blockade Promotes Therapeutic Cancer Vaccine to Eradicate Lung Cancer
by Pournima Kadam and Sherven Sharma
Vaccines 2020, 8(2), 317; https://doi.org/10.3390/vaccines8020317 - 18 Jun 2020
Cited by 20 | Viewed by 3937
Abstract
(1) Background: Targeting inhibitory immune checkpoint molecules has highlighted the need to find approaches enabling the activation of immune responses against cancer. Therapeutic vaccination, which induces specific immune responses against tumor antigens (Ags), is an attractive option. (2) Methods: Utilizing a K-RasG12Dp53null murine [...] Read more.
(1) Background: Targeting inhibitory immune checkpoint molecules has highlighted the need to find approaches enabling the activation of immune responses against cancer. Therapeutic vaccination, which induces specific immune responses against tumor antigens (Ags), is an attractive option. (2) Methods: Utilizing a K-RasG12Dp53null murine lung cancer model we determined tumor burden, tumor-infiltrating T cell (TIL) cytolysis, immunohistochemistry, flow cytometry, and CD4 and CD8 depletion to evaluate the efficacy of PD-1 blockade combined with CCL21-DC tumor lysate vaccine. (3) Results: Anti-PD-1 plus CCL21-DC tumor lysate vaccine administered to mice bearing established tumors (150 mm3) increased expression of perforin and granzyme B in the tumor microenvironment (TME), increased tumor-infiltrating T cell (TIL) activity, and caused 80% tumor eradication. Mice with treatment-induced tumor eradication developed immunological memory, enabling tumor rejection upon challenge and cancer-recurrence-free survival. The depletion of CD4 or CD8 abrogated the antitumor activity of combined therapy. PD-1 blockade or CCL21-DC tumor lysate vaccine monotherapy reduced tumor burden without tumor eradication. (4) Conclusion: Immune checkpoint blockade promotes the activity of the therapeutic cancer vaccine. PD-1 blockade plus CCL21-DC tumor lysate vaccine therapy could benefit lung cancer patients. Full article
(This article belongs to the Special Issue Cancer Vaccine)
Show Figures

Figure 1

Figure 1
<p>K-RasG12Dp53null tumor cells (10<sup>6</sup>) were inoculated in the supra scapular region of 129-E mice. Mice bearing 12-day established tumors were treated with (<b>i</b>) diluent, (<b>ii</b>) anti-PD-1, (<b>iii</b>) CCL21-DC lysate vaccine, (<b>iv</b>) CCL21-DC lysate vaccine plus anti-PD-1, (<b>v</b>) CCL21-DC lysate vaccine plus anti-PD-1 plus anti-CD4, and (<b>vi</b>) CCL21-DC lysate vaccine plus anti-PD-1 plus anti-CD8. In comparison to monotherapy, combined therapy was more effective at inhibiting tumor growth (<b>A</b>). Depletion of CD4 T or CD8 T cells abrogated antitumor activity of combined therapy (<b>A</b>). Combined therapy reduced the weight of tumors in comparison to monotherapy and control (<b>B</b>,<b>C</b>); ** <span class="html-italic">p</span> &lt; 0.01 in comparison to diluent control, * <span class="html-italic">p</span> &lt; 0.05 in comparison to monotherapy. Results are representative of an independent experiment. The experiment was repeated twice (<span class="html-italic">n</span> = 10 mice/group).</p>
Full article ">Figure 2
<p>Tumor-infiltrating T cells (TILs) were incubated with K-RasG12Dp53null tumor cells at ratio of 5:1 overnight followed by addition of almar blue for 4 h. TILs from mice treated with combined therapy were most effective at lysing K-RasG12Dp53null tumor cells; ** <span class="html-italic">p</span> &lt; 0.01 in comparison to diluent control, * <span class="html-italic">p</span> &lt; 0.05 compared to monotherapy. Results are representative of an independent experiment (<b>A</b>). The experiment was repeated twice (<span class="html-italic">n</span> = 4 mice/group). Flow cytometric analyses of single-cell suspensions of the tumor microenvironment (TME) following therapy showed enhancement of CD8 T cells expressing granzyme B (<span class="html-italic">p</span> &lt; 0.05) compared to monotherapy. P98 is dumped cell population, P99 is dead cell population and P100 is CD8 T cell population. Results are representative of an independent experiment. The experiment was repeated twice (<span class="html-italic">n</span> = 4 mice/group) (<b>B</b>).</p>
Full article ">Figure 3
<p>H&amp;E revealed enhanced immune infiltrates and reduced tumor staining following combined therapy. (<b>A</b>) IHC of tumor sections revealed enhanced (i) CD3 T cell staining (brown), (ii) tumor cell apoptosis (brown), (iii) perforin, (iv) and granzyme B staining (brown) following combined therapy. (<b>B</b>) Stained areas of tumors were quantified by microscopy of IHC-stained paraffin-embedded sections. Anti-PD-1 plus CCL21-DC lysate vaccine treatment led to the highest levels of CD3 T cells, perforin, and granzyme B and greatest reduction in tumor burden, as denoted by enhanced caspase-3-stained apoptotic tumor cells compared with diluent control and monotherapy. Bars represent SE; <span class="html-italic">p</span> &lt; 0.01 compared with diluent-treated control; <span class="html-italic">p</span> &lt; 0.05 compared with monotherapy. Results are representative of a single experiment (<span class="html-italic">n</span> = 4 mice/group).</p>
Full article ">Figure 3 Cont.
<p>H&amp;E revealed enhanced immune infiltrates and reduced tumor staining following combined therapy. (<b>A</b>) IHC of tumor sections revealed enhanced (i) CD3 T cell staining (brown), (ii) tumor cell apoptosis (brown), (iii) perforin, (iv) and granzyme B staining (brown) following combined therapy. (<b>B</b>) Stained areas of tumors were quantified by microscopy of IHC-stained paraffin-embedded sections. Anti-PD-1 plus CCL21-DC lysate vaccine treatment led to the highest levels of CD3 T cells, perforin, and granzyme B and greatest reduction in tumor burden, as denoted by enhanced caspase-3-stained apoptotic tumor cells compared with diluent control and monotherapy. Bars represent SE; <span class="html-italic">p</span> &lt; 0.01 compared with diluent-treated control; <span class="html-italic">p</span> &lt; 0.05 compared with monotherapy. Results are representative of a single experiment (<span class="html-italic">n</span> = 4 mice/group).</p>
Full article ">Figure 4
<p>Anti-PD-1 plus CCL21-DC tumor antigen (Ag) vaccine therapy enhances dendritic cell (DC) activity in the TME. CD4 and CD8 T cells were purified from the spleens of mice following vaccination with DC tumor lysate vaccine. DCs from TME of (i) diluent control, (ii) anti-PD-1, (iii) CCL21-DC tumor lysate vaccine, and (iv) anti-PD-1 plus CCL21-DC tumor lysate vaccine were pulsed with MHC Class I K-Ras peptide (LVVVGADGV) or MHC Class II (MTEYKLVVVGADGVG) and co-cultured with splenic CD8 or CD4 T cells of the vaccinated mice at a ratio of 1:5 for 24 h. IFNγ secreted by T cells in the co-culture was determined by IFNγ-specific ELISA. In comparison to diluent control or monotherapy, anti-PD-1 plus CCL21-DC tumor lysate Ag induced the highest DC activity of presenting MHC Class I and MHC Class II K-RasG12D tumor peptides to T cells. Control peptide (FECNTAQAC)-pulsed DCs did not stimulate T cell IFNγ production (data not shown). Bars represent SE; <span class="html-italic">p</span> &lt; 0.01 compared with diluent-treated control, <span class="html-italic">p</span> &lt; 0.05 compared with monotherapy. Results are representative of a single experiment (<span class="html-italic">n</span> = 4 mice/group).</p>
Full article ">Figure 5
<p>(<b>A</b>,<b>B</b>) Tregs and NK cells from CCL21-DC lysate vaccine plus anti-PD-1 did not have a change in activity. Purified Tregs (1:5) from combined therapy did not alter the proliferation of anti-CD3/anti-CD28 (0.2/2 µg/mL) stimulated T cell proliferation. Almar blue (20 µL) was added for 4 h on day 3, and fluorescence was read at excitation/emission (530nm/595nm) in a Wallac Fluorescence reader.</p>
Full article ">
17 pages, 1888 KiB  
Article
Defining Elimination of Genital Warts—A Modified Delphi Study
by Laila Khawar, Dorothy A. Machalek, David G. Regan, Basil Donovan, Skye McGregor and Rebecca J. Guy
Vaccines 2020, 8(2), 316; https://doi.org/10.3390/vaccines8020316 - 18 Jun 2020
Cited by 1 | Viewed by 3993
Abstract
Background: Substantial declines in genital warts (GW) have been observed in countries with quadrivalent HPV vaccination programmes, with Australia showing the highest reductions due to early commencement and high vaccination coverage. There is a real potential to achieve GW elimination; however, no GW [...] Read more.
Background: Substantial declines in genital warts (GW) have been observed in countries with quadrivalent HPV vaccination programmes, with Australia showing the highest reductions due to early commencement and high vaccination coverage. There is a real potential to achieve GW elimination; however, no GW elimination definition exists. Taking Australia as a case study, we aimed to reach expert consensus on a proposed GW elimination definition using a modified Delphi process. Method: We used modelling and epidemiological data to estimate the expected number of new GW cases, from pre-vaccination (baseline) in 2006 to the year 2060 in Australian heterosexuals, men who have sex with men (MSM), and newly arrived international travellers and migrants. We used these data and the literature, to develop a questionnaire containing ten elimination-related items, each with 9-point Likert scales (1—strongly disagree; 9—strongly agree). The survey was completed by 18 experts who participated in a full day face-to-face modified Delphi study, in which individuals and then small groups discussed and scored each item. The process was repeated online for items where consensus (≥70% agreement) was not initially achieved. Median and coefficient of variation (COV) were used to describe the central tendency and variability of responses, respectively. Findings: There was a 95% participation rate in the face-to-face session, and 84% response rate in the final online round. The median item score ranged between 7.0 and 9.0 and the COV was ≤0.30 on all items. Consensus was reached that at ≥80% HPV vaccination coverage, GW will be eliminated as a public health problem in Australia by 2060. During this time period there will be a 95% reduction in population-level incidence compared with baseline, equivalent to <1 GW case per 10,000 population. The reductions will occur most rapidly in Australian heterosexuals, with 73%, 90% and 97% relative reductions by years 2021, 2030 and 2060, respectively. The proportion of new GW cases attributable to importation will increase from 3.6% in 2006 to ~49% in 2060. Interpretation: Our results indicate that the vaccination programme will minimise new GW cases in the Australian population, but importation of cases will continue. This is the first study to define GW elimination at a national level. The framework developed could be used to define GW elimination in other countries, with thresholds particularly valuable for vaccination programme impact evaluation. Funding: LK supported through an Australian Government Research Training Programme Scholarship; unconditional funding from Seqirus to support the Delphi Workshop. Full article
Show Figures

Figure 1

Figure 1
<p>Flowchart of the process for development of consensus.</p>
Full article ">Figure 2
<p>Revised estimates of relative reduction in new cases of genital warts in Australia, in all populations considered, after adjusting for the ongoing transmission due to importation of genital warts, by time period.</p>
Full article ">Figure 3
<p>Revised number and proportion of estimated new genital warts cases in Australia for timepoints 2006, 2021, 2030 and 2060, after adjusting for the ongoing transmission due to importation of genital warts, by population type.</p>
Full article ">
18 pages, 3400 KiB  
Article
ELISA-Based Assay for Studying Major and Minor Group Rhinovirus–Receptor Interactions
by Petra Pazderova, Eva E. Waltl, Verena Niederberger-Leppin, Sabine Flicker, Rudolf Valenta and Katarzyna Niespodziana
Vaccines 2020, 8(2), 315; https://doi.org/10.3390/vaccines8020315 - 18 Jun 2020
Cited by 4 | Viewed by 4041
Abstract
Rhinovirus (RV) infections are a major cause of recurrent common colds and trigger severe exacerbations of chronic respiratory diseases. Major challenges for the development of vaccines for RV include the virus occurring in the form of approximately 160 different serotypes, using different receptors, [...] Read more.
Rhinovirus (RV) infections are a major cause of recurrent common colds and trigger severe exacerbations of chronic respiratory diseases. Major challenges for the development of vaccines for RV include the virus occurring in the form of approximately 160 different serotypes, using different receptors, and the need for preclinical models for the screening of vaccine candidates and antiviral compounds. We report the establishment and characterization of an ELISA-based assay for studying major and minor group RV–receptor interactions. This assay is based on the interaction of purified virus with plate-bound human receptor proteins, intercellular adhesion molecule 1 (ICAM-1), and low density lipoprotein receptor (LDLR). Using RV strain-specific antibodies, we demonstrate the specific binding of a panel of major and minor RV group types including RV-A and RV-B strains to ICAM-1 and LDLR, respectively. We show that the RV–receptor interaction can be blocked with receptor-specific antibodies as well as with soluble receptors and neutralizing RV-specific antibodies. The assay is more sensitive than a cell culture-based virus neutralization test. The ELISA assay will therefore be useful for the preclinical evaluation for preventive and therapeutic strategies targeting the RV–receptor interaction, such as vaccines, antibodies, and anti-viral compounds. Full article
(This article belongs to the Special Issue Development of Cross-Protective Vaccines)
Show Figures

Figure 1

Figure 1
<p>Flow chart summarizing the experimental design and reagents for the ELISA-based virus–receptor interaction assay. (top) The preparation of viral strains and the confirmation of their identity by reverse transcription (RT)-PCR. (bottom) The scheme for the ELISA detection of virus–receptor interactions.</p>
Full article ">Figure 2
<p>Characterization of recombinant human ICAM-1 and LDLR. (<b>a</b>) Coomassie-blue stained SDS-PAGE with recombinant human ICAM-1 (lane 1) and LDLR (lane 2). A molecular-weight marker (kDa) is indicated on the left. (<b>b</b>) Mean residue ellipticities (θ, <span class="html-italic">y</span>-axis) of ICAM-1 (red) and LDLR (blue) recorded at different wavelengths (nm, <span class="html-italic">x</span>-axis) by circular dichroism (CD) spectroscopy. Detection of (<b>c</b>) ICAM-1 or (<b>d</b>) LDLR with serial dilutions of anti-ICAM-1 antibodies (c = 1 µg/mL; left), anti-LDLR antibodies (c = 0.2 µg/mL; right) or bovine serum albumin (BSA)-containing buffer alone (BSA) by ELISA. Shown are means of optical density (O.D.) values corresponding to bound antibodies (y-axes) measured at different time points (x-axes). The variations of individual duplicate results of ELISAs were less than 5%. The antibody titration in (<b>c</b>) and (<b>d</b>) was done once.</p>
Full article ">Figure 3
<p>Binding of major group and minor group RVs to ICAM-1and LDLR. Shown are O.D. values (y-axes) corresponding to receptor (ICAM-1 or LDLR)-bound (<b>a</b>) major or (<b>b</b>) minor group RVs (x-axes) as determined by ELISA. Tested major group RV-A or RV-B species (<b>a</b>) and minor group RV-A species (<b>b</b>) are indicated on the x-axes. The analyses were performed with virus (50 µg/mL RV) and, for control purposes, without virus (−RV), without virus and detection antibodies (−RV, −anti-RV) or with HSA- instead of receptor-coated plates (HSA coated). The results are means of duplicate determinations with a variation of less than 5%. RV–receptor binding experiments were repeated two times.</p>
Full article ">Figure 4
<p>Inhibition of RV89 and RV14 binding to plate-bound receptors by receptor-specific antibodies. Binding of RV89 (upper part) (<b>a</b>) and RV14 (lower part) (<b>b</b>) to plate-bound ICAM-1 (left panels) or plate-bound LDLR (right panels) is reported as mean O.D. values (y-axes) in the presence (+) or absence (−) of virus, anti-ICAM-1 antibodies, non-specific antibodies, anti-RV detection antibodies, and secondary detection antibodies (anti-GP) (below x-axes). The percentage inhibitions of RV89 binding and RV14 binding obtained with anti-ICAM-1 antibodies versus non-specific antibodies are indicated in red. The results are means of duplicate determinations with a variation of less than 10%. Inhibition experiments were repeated three times.</p>
Full article ">Figure 5
<p>Inhibition of RV89 infection by anti-ICAM-1 antibodies determined by cell culture-based virus inhibition assay. (<b>a</b>) Crystal violet-stained viable cells incubated only with anti-ICAM-1 or non-specific antibodies (top), different dilutions of antibodies (1:100–1:100,000); anti-ICAM-1 and non-specific antibodies separated by red vertical line) in the presence of virus (100 TCID<sub>50</sub>), 1:100 diluted antibodies without virus, cell incubated only with virus (100 TCID<sub>50</sub>), or only with medium (bottom). (<b>b</b>) Mean O.D. values corresponding to viable cells in triplicate wells ±SDs (<span class="html-italic">y</span>-axis) of the above experiment (<span class="html-italic">x</span>-axis: conditions applied). Neutralization tests were repeated two times.</p>
Full article ">Figure 6
<p>Inhibition of major group RV89 and minor group RV2 binding to plate-bound receptors by receptor-specific antibodies. Binding of RV89 (upper part) (<b>a</b>) and RV2 (lower part) (<b>b</b>) to plate-bound ICAM-1 (left panels) or plate-bound LDLR (right panels) reported as mean O.D. values (y-axes) in the presence (+) or absence (−) of virus, commercial anti-ICAM-1 antibodies, commercial anti-LDLR antibodies, anti-RV detection antibodies, and secondary detection antibodies (anti-GP) (see below x-axes). The percentage inhibitions of RV89 binding and RV2 binding obtained with commercial anti-receptor antibodies compared to without anti-receptor antibodies are indicated in red. The results are means of duplicate determinations with a variation of less than 10%. Inhibition experiments were performed once.</p>
Full article ">Figure 7
<p>Auto-inhibition of the binding of major group RV89 and minor group RV2 to their receptors. Binding of RV89 to ICAM-1 (<b>left</b>) and of RV2 to LDLR (<b>right</b>) without (first column) or with (second column) pre-incubation with the receptor plus controls in which virus and receptor (third column) or virus, receptor and detection antibodies (fourth column) were omitted, reported as mean optical density (i.e., O.D.) values (y-axes). The percentage inhibitions of RV89 and RV2 binding produced by pre-incubation with receptors are indicated in red. The results are means of duplicate determinations with a variation of less than 10%. Inhibition experiments with soluble receptors were performed two times.</p>
Full article ">Figure 8
<p>Inhibition of RV89 binding to ICAM-1 by antibodies specific for each of the four viral capsid proteins (VP). Binding of RV89 to ICAM-1 after pre-incubation of virus with antibodies against VP1, VP2, VP3, and VP4 compared to pre-incubation with buffer containing BSA only reported as O.D. (y-axes). The inhibitions of RV89 binding by anti-VP1 and anti-VP2 antibodies are indicated by red arrows. Omission of RV89 served as a negative control. The results are means of duplicate determinations with a variation of less than 10%. Inhibition experiments were performed three times.</p>
Full article ">
14 pages, 2348 KiB  
Article
Search of Potential Vaccine Candidates against Trueperella pyogenes Infections through Proteomic and Bioinformatic Analysis
by Ángela Galán-Relaño, Lidia Gómez-Gascón, Antonio Rodríguez-Franco, Inmaculada Luque, Belén Huerta, Carmen Tarradas and Manuel J. Rodríguez-Ortega
Vaccines 2020, 8(2), 314; https://doi.org/10.3390/vaccines8020314 - 17 Jun 2020
Cited by 7 | Viewed by 2766
Abstract
Trueperella pyogenes is an opportunistic pathogen, responsible for important infections in pigs and significant economic losses in swine production. To date, there are no available commercial vaccines to control diseases caused by this bacterium. In this work, we performed a comparative proteomic analysis [...] Read more.
Trueperella pyogenes is an opportunistic pathogen, responsible for important infections in pigs and significant economic losses in swine production. To date, there are no available commercial vaccines to control diseases caused by this bacterium. In this work, we performed a comparative proteomic analysis of 15 T. pyogenes clinical isolates, by “shaving” live cells, followed by LC-MS/MS, aiming at the identification of the whole set of surface proteins (i.e., the “pan-surfome”) as a source of antigens to be tested in further studies as putative vaccine candidates, or used in diagnostic tools. A total of 140 surface proteins were detected, comprising 25 cell wall proteins, 10 secreted proteins, 23 lipoproteins and 82 membrane proteins. After describing the “pan-surfome”, the identified proteins were ranked in three different groups based on the following criteria: to be (i) surface-exposed, (ii) highly conserved and (iii) widely distributed among different isolates. Two cell wall proteins, three lipoproteins, four secreted and seven membrane proteins were identified in more than 70% of the studied strains, were highly expressed and highly conserved. These proteins are potential candidates, alone or in combination, to obtain effective vaccines against T. pyogenes or to be used in the diagnosis of this pathogen. Full article
Show Figures

Figure 1

Figure 1
<p>Hierarchically-clustered heatmaps of z-scored surface protein abundances in the 15 <span class="html-italic">Trueperella pyogenes</span> clinical isolates. Proteins are clustered in columns in each heatmap, and isolates in rows. The numbers after the dashes in clinical isolates represent each of the three biological replicates. (<b>a</b>) Lipoproteins; (<b>b</b>) cell wall proteins; (<b>c</b>) membrane proteins; (<b>d</b>) secreted proteins.</p>
Full article ">Figure 2
<p>Topological representation of the identified membrane proteins in the “pan-surfome” analysis of the 15 <span class="html-italic">T. pyogenes</span> isolates. The TOPO2 Transmembrane Protein Display was used to perform the representation and the TMHMM algorithm to predict transmembrane domains (TMD). (<b>a</b>) Membrane proteins identified in more than 70% of the analysed strains. (<b>b</b>) Membrane proteins which were present in 50–70% of strains. (<b>c</b>) Membrane proteins identified in 30–50% of strains. In red are shown the peptides experimentally identified by LC-MS/MS.</p>
Full article ">
24 pages, 696 KiB  
Review
Innate Immune Response against Hepatitis C Virus: Targets for Vaccine Adjuvants
by Daniel Sepulveda-Crespo, Salvador Resino and Isidoro Martinez
Vaccines 2020, 8(2), 313; https://doi.org/10.3390/vaccines8020313 - 17 Jun 2020
Cited by 15 | Viewed by 4128
Abstract
Despite successful treatments, hepatitis C virus (HCV) infections continue to be a significant world health problem. High treatment costs, the high number of undiagnosed individuals, and the difficulty to access to treatment, particularly in marginalized susceptible populations, make it improbable to achieve the [...] Read more.
Despite successful treatments, hepatitis C virus (HCV) infections continue to be a significant world health problem. High treatment costs, the high number of undiagnosed individuals, and the difficulty to access to treatment, particularly in marginalized susceptible populations, make it improbable to achieve the global control of the virus in the absence of an effective preventive vaccine. Current vaccine development is mostly focused on weakly immunogenic subunits, such as surface glycoproteins or non-structural proteins, in the case of HCV. Adjuvants are critical components of vaccine formulations that increase immunogenic performance. As we learn more information about how adjuvants work, it is becoming clear that proper stimulation of innate immunity is crucial to achieving a successful immunization. Several hepatic cell types participate in the early innate immune response and the subsequent inflammation and activation of the adaptive response, principally hepatocytes, and antigen-presenting cells (Kupffer cells, and dendritic cells). Innate pattern recognition receptors on these cells, mainly toll-like receptors, are targets for new promising adjuvants. Moreover, complex adjuvants that stimulate different components of the innate immunity are showing encouraging results and are being incorporated in current vaccines. Recent studies on HCV-vaccine adjuvants have shown that the induction of a strong T- and B-cell immune response might be enhanced by choosing the right adjuvant. Full article
(This article belongs to the Special Issue Research on Innate Immunity and Inflammation)
Show Figures

Figure 1

Figure 1
<p>Schematic representation of the different pattern recognition receptors (PRRs) and their natural ligands. Transcription factors that are activated by the PRRs are also represented.</p>
Full article ">
16 pages, 447 KiB  
Review
The African Swine Fever Virus (ASFV) Topoisomerase II as a Target for Viral Prevention and Control
by João Coelho and Alexandre Leitão
Vaccines 2020, 8(2), 312; https://doi.org/10.3390/vaccines8020312 - 17 Jun 2020
Cited by 15 | Viewed by 4678
Abstract
African swine fever (ASF) is, once more, spreading throughout the world. After its recent reintroduction in Georgia, it quickly reached many neighboring countries in Eastern Europe. It was also detected in Asia, infecting China, the world’s biggest pig producer, and spreading to many [...] Read more.
African swine fever (ASF) is, once more, spreading throughout the world. After its recent reintroduction in Georgia, it quickly reached many neighboring countries in Eastern Europe. It was also detected in Asia, infecting China, the world’s biggest pig producer, and spreading to many of the surrounding countries. Without any vaccine or effective treatment currently available, new strategies for the control of the disease are mandatory. Its etiological agent, the African swine fever virus (ASFV), has been shown to code for a type II DNA topoisomerase. These are enzymes capable of modulating the topology of DNA molecules, known to be essential in unicellular and multicellular organisms, and constitute targets in antibacterial and anti-cancer treatments. In this review, we summarize most of what is known about this viral enzyme, pP1192R, and discuss about its possible role(s) during infection. Given the essential role of type II topoisomerases in cells, the data so far suggest that pP1192R is likely to be equally essential for the virus and thus a promising target for the elaboration of a replication-defective virus, which could provide the basis for an effective vaccine. Furthermore, the use of inhibitors could be considered to control the spread of the infection during outbreaks and therefore limit the spreading of the disease. Full article
(This article belongs to the Special Issue African Swine Fever Virus Prevention and Control)
Show Figures

Figure 1

Figure 1
<p>Maximum likelihood phylogenetic tree constructed from a multiple amino acid sequence alignment of pP1192R from 43 different African swine fever virus (ASFV) isolates. Amino acid sequences were obtained from ASFVdb [<a href="#B95-vaccines-08-00312" class="html-bibr">95</a>]. Alignments were performed manually. ProtTest 3.0 [<a href="#B96-vaccines-08-00312" class="html-bibr">96</a>] was used to select the best model for the phylogenetic tree construction, and the maximum likelihood tree was constructed using PhyML 3.0 [<a href="#B97-vaccines-08-00312" class="html-bibr">97</a>] with 1000 bootstraps, using model JTT+G+F, with a value of gamma of 0.395, as indicated by ProtTest. The tree was edited using the program MEGA X [<a href="#B98-vaccines-08-00312" class="html-bibr">98</a>]. Bootstrap values are indicated in red. The number of different amino acids in comparison with the sequence of pP1192R from isolate Portugal_L60_1960, considered for this purpose as a reference, is indicated in blue.</p>
Full article ">
26 pages, 5576 KiB  
Article
Innate Lymphocyte Th1 and Th17 Responses in Elderly Hospitalised Patients with Infection and Sepsis
by John Davis Coakley, Eamon P. Breen, Ana Moreno-Olivera, Alhanouf I. Al-Harbi, Ashanty M. Melo, Brian O’Connell, Ross McManus, Derek G. Doherty and Thomas Ryan
Vaccines 2020, 8(2), 311; https://doi.org/10.3390/vaccines8020311 - 17 Jun 2020
Cited by 7 | Viewed by 3697
Abstract
Background: the role of innate immunity in human sepsis must be fully clarified to identify potential avenues for novel immune adjuvant sepsis therapies. Methods: A prospective observational study was performed including patients with sepsis (septic group), infection without sepsis (infection group), and healthy [...] Read more.
Background: the role of innate immunity in human sepsis must be fully clarified to identify potential avenues for novel immune adjuvant sepsis therapies. Methods: A prospective observational study was performed including patients with sepsis (septic group), infection without sepsis (infection group), and healthy controls (control group) in the setting of acute medical wards and intensive care units in a 1000-bed university hospital. A total of 42 patients with sepsis, 30 patients with infection, and 30 healthy controls were studied. The differentiation states of circulating mucosal associated invariant T (MAIT) cells and Natural Killer T (NKT) cells were characterised as naive (CD45RA+, CD197+), central memory (CD45RA, CD197+), effector memory (CD45RA, CD197), or terminally differentiated (CD45RA+, CD197). The differentiation states of circulating gamma-delta T lymphocytes were characterised as naive (CD45RA+, CD27+), central memory (CD45RA, CD27+), effector memory (CD45RA, CD27), or terminally differentiated (CD45RA+, CD27). The expression of IL-12 and IL-23 receptors, the transcription factors T-Bet and RORγt, and interferon-γ and IL-17a were analysed. Results: MAIT cell counts were lower in the septic group (p = 0.002) and the infection group (p < 0.001) than in the control group. The MAIT cell T-Bet expression in the infection group was greater than in the septic group (p = 0.012). The MAIT RORγt expression in the septic group was lower than in the control group (p = 0.003). The NK cell counts differed in the three groups (p < 0.001), with lower Natural Killer (NK) cell counts in the septic group (p < 0.001) and in the infection group (p = 0.001) than in the control group. The NK cell counts increased in the septic group in the 3 weeks following the onset of sepsis (p = 0.028). In lymphocyte stimulation experiments, fewer NK cells expressed T-Bet in the septic group than in the infection group (p = 0.002), and fewer NK cells expressed IFN-γ in the septic group than in the control group (p = 0.002). The NKT cell counts were lower in the septic group than both the control group (p = 0.05) and the infection group (p = 0.04). Fewer NKT cells expressed T-Bet in the septic group than in the infection group (p = 0.004). Fewer NKT cells expressed RORγt in the septic group than in the control group (p = 0.003). Fewer NKT cells expressed IFN-γ in the septic group than in both the control group (p = 0.002) and the infection group (p = 0.036). Conclusion: The clinical presentation of infection and or sepsis in patients is linked with a mosaic of changes in the innate lymphocyte Th1 and Th17 phenotypes. The manipulation of the innate lymphocyte phenotype offers a potential avenue for immune modulation in patients with sepsis. Full article
(This article belongs to the Special Issue Research on Innate Immunity and Inflammation)
Show Figures

Figure 1

Figure 1
<p>Flow cytometry analysis. Lymphocyte gating on PBMCs (<b>A</b>), with exclusion of dead cells (<b>B</b>) and exclusion of doublets (<b>C</b>). Gating on CD3<sup>+</sup> cells (<b>D</b>) to show MAIT cells (<b>E</b>). MAIT cells were gated on showing interferon-γ (IFNγ) expression in unstimulated (<b>F</b>) and stimulated (<b>G</b>) cells. Stimulation was performed with phorbol myristate acetate and ionomycin (PMA/I). DCS is Dead Cell Stain.</p>
Full article ">Figure 2
<p>MAIT cells phenotypes. (<b>A</b>) Flow cytometry plot showing MAIT cell population (CD3<sup>+</sup>CD161<sup>+</sup>Vα7.2<sup>+</sup>) on gated CD3<sup>+</sup> lymphocytes. (<b>B</b>) Frequency of MAIT cells as a percentage of T cells (CD3<sup>+</sup> lymphocytes). (<b>C</b>) Frequency of MAIT CD8<sup>+</sup> cells as a % of MAIT cells. (<b>D</b>) Total MAIT cell count in circulating blood. (<b>E</b>) Total MAIT cell count over time in the septic group. (<b>F</b>) Frequencies of naive, central memory, effector memory, and terminally differentiated (N, CM, EM, TD, respectively) MAIT cells in circulating blood. Control group (<span class="html-italic">n</span> = 20), infection group (<span class="html-italic">n</span> = 19), and septic group (<span class="html-italic">n</span> = 32). Graphs are plotted with bars representing the median. <sup>#</sup> = <span class="html-italic">p</span> &lt; 0.05; * = <span class="html-italic">p</span> ≤ 0.01; ** = <span class="html-italic">p</span> ≤ 0.001.</p>
Full article ">Figure 3
<p>MAIT cell expression of IL-12Rβ2 and IL-23R. (<b>A</b>,<b>B</b>) Percentage of MAIT cells in circulating blood expressing IL-12 receptor (IL-12Rβ2) and IL-23 receptor (IL-23R). (<b>C</b>) MAIT cell count in circulating blood expressing IL-12Rβ2 and IL-23R. (<b>D</b>) MAIT cell count expressing IL-23R over time. (<b>E</b>) Flow cytometry plot on gated MAIT cells showing IL-12Rβ2. (<b>F</b>) Flow cytometry plot on gated MAIT cells showing IL-23 receptor. Control group (<span class="html-italic">n</span> = 20), infection group (<span class="html-italic">n</span> = 19), and septic group (<span class="html-italic">n</span> = 32). Graphs are plotted with bars representing the median. * = <span class="html-italic">p</span> ≤ 0.01.</p>
Full article ">Figure 4
<p>Frequency of RORγt, T-Bet, IL17A, and IFNγ expression in MAIT cells. (<b>A</b>) MAIT cell expression of T-Bet when stimulated with the medium alone or PMA/I. (<b>B</b>) MAIT cell expression of RORγt when stimulated with the medium alone or PMA/I. (<b>C</b>) Expression of transcription factor T-Bet in unstimulated naive, central memory, effector memory, and terminally differentiated (N, CM, EM, TD, respectively) MAIT cells. (<b>D</b>) Transcription factor RORγt expression in PMA/I-stimulated N, CM, EM, and TD MAIT cells. (<b>E</b>) MAIT cell expression of IL-17a and IFN-γ when stimulated with PMA/I. Control group (<span class="html-italic">n</span> = 10), infection group (<span class="html-italic">n</span> = 10), and septic group (<span class="html-italic">n</span> = 10). Graphs are plotted with bars representing the median. <sup>#</sup> = <span class="html-italic">p</span> &lt; 0.05; * = <span class="html-italic">p</span> ≤ 0.01.</p>
Full article ">Figure 5
<p>CD3<sup>+</sup>CD161<sup>+</sup> lymphocytes. (<b>A</b>) Frequency of CD3<sup>+</sup>CD161<sup>+</sup> cells as a percentage of lymphocytes. (<b>B</b>) Differentiation status of CD3<sup>+</sup>CD161<sup>+</sup> lymphocytes in the circulating blood. Naive, central memory, effector memory, and terminally differentiated (N, CM, EM, TD, respectively) differentiation states shown. (<b>C</b>) Total number of CD3<sup>+</sup>CD161<sup>+</sup> lymphocytes and the number of CD3<sup>+</sup>CD161<sup>+</sup> lymphocytes in their differentiated states in patients with sepsis over time. (<b>E</b>) Frequency of lymphocytes that are CD3<sup>+</sup>CD161<sup>+</sup> in patients who survived compare to those that died. Control group (<span class="html-italic">n</span> = 20), infection group (<span class="html-italic">n</span> = 19), and septic group (<span class="html-italic">n</span> = 32). (<b>D</b>) RORγt and T-Bet expression in unstimulated CD161<sup>+</sup> T cells and cytokines IL17A and IFN-γ in stimulated CD161<sup>+</sup> T cells with phorbol myristate acetate and ionomycin. Control group (<span class="html-italic">n</span> = 10), infection group (<span class="html-italic">n</span> = 10), and septic group (<span class="html-italic">n</span> = 10). (<b>F</b>) Flow cytometry plot of gated lymphocytes showing CD3<sup>+</sup>CD161<sup>+</sup> cells. (<b>A</b>,<b>B</b>,<b>D</b>,<b>E</b>) Graphs are plotted with bars representing the median. (<b>C</b>) Data represented as mean with standard deviation. <sup>#</sup> = <span class="html-italic">p</span> &lt; 0.05; * = <span class="html-italic">p</span> ≤ 0.01; ** = <span class="html-italic">p</span> ≤ 0.001.</p>
Full article ">Figure 6
<p>Natural Killer (NK) cells. (<b>A</b>) Flow cytometry plot on gated lymphocytes showing NK cells (CD3<sup>−</sup>CD56<sup>+</sup>) and NKT Cells (CD3<sup>+</sup>CD56<sup>+</sup>). (<b>B</b>) NK cells as a percentage of lymphocytes. (<b>C</b>) NK cell count in the three patient groups on admission. (<b>D</b>) Frequency of NK cells as a percentage of lymphocytes in septic patients over time. (<b>E</b>) NK cell count in septic patients over time. Control group (<span class="html-italic">n</span> = 20), infection group (<span class="html-italic">n</span> = 19), and septic group (<span class="html-italic">n</span> = 32). Graphs are plotted with bars representing the median. <sup>#</sup> <span class="html-italic">p</span> &lt; 0.05; * <span class="html-italic">p</span> ≤ 0.01; ** <span class="html-italic">p</span> ≤ 0.001.</p>
Full article ">Figure 7
<p>NK cell phenotype and stimulation. (<b>A</b>) Frequency of NK cells expressing IL-12 receptor (IL-12Rβ2) and IL-23 receptor (IL-23R). (<b>B</b>) Absolute numbers of NK cells expressing IL-12Rβ2 and IL-23R. (<b>A</b>,<b>B</b>) Control group (<span class="html-italic">n</span> = 20), infection group (<span class="html-italic">n</span> = 19), and septic group (<span class="html-italic">n</span> = 32). (<b>C</b>) Frequency of NK cells expressing the transcription factors RORγt and T-Bet when stimulated with phorbol myristate acetate and ionomycin (PMA/I). (<b>D</b>) Frequency of NK cells expressing cytokines IL17A and IFN-γ when stimulated with PMA/I. C-D, control group (<span class="html-italic">n</span> = 10), infection group (<span class="html-italic">n</span> = 10), and septic group (<span class="html-italic">n</span> = 10). (<b>E</b>) Flow cytometry plot on gated NK cells showing T-Bet expression. All the graphs are plotted with bars representing the median. <sup>#</sup> = <span class="html-italic">p</span> &lt; 0.05; * = <span class="html-italic">p</span> ≤ 0.01.</p>
Full article ">Figure 8
<p>NKT cell phenotype. (<b>A</b>) Frequencies of Natural Killer T (NKT) cells as a percentage of lymphocytes. (<b>B</b>) Absolute numbers of NKT cells in the three patient groups. (<b>C</b>) Total number of NKT cells in septic patients over time. (<b>D</b>) Frequency of NKT cells that express the IL-12 receptor (IL-12Rβ2) and IL-23 receptor (IL-23R). (<b>E</b>) Differentiation status of NKT cells in circulating blood. Naive, central memory, effector memory, and terminally differentiated (N, CM, EM, TD, respectively) differentiation states shown. (<b>F</b>) NKT cell count by differentiation status. Control group (<span class="html-italic">n</span> = 20), infection group (<span class="html-italic">n</span> = 19), and septic group (<span class="html-italic">n</span> = 32). Graphs are plotted with bars representing the median. <sup>#</sup> = <span class="html-italic">p</span> &lt; 0.05; * = <span class="html-italic">p</span> ≤ 0.01; ** = <span class="html-italic">p</span> ≤ 0.001.</p>
Full article ">Figure 9
<p>NKT cell stimulation. (<b>A</b>) Frequencies of unstimulated Natural Killer T (NKT) cells and stimulated NKT cells with phorbol myristate acetate and ionomycin (PMA/I) expressing T-Bet. (<b>B</b>) Frequency of unstimulated NKT cells and stimulated NKT cells with PMA/I expressing RORγt. (<b>C</b>) Frequency of unstimulated NKT cells and stimulated NKT cells with PMA/I expressing IFN-γ. (<b>D</b>) Frequency of unstimulated NKT cells and stimulated NKT cells with PMA/I expressing IL17A. (<b>E</b>) Flow cytometry plot on gated NKT Cells expressing RORγt. Control group (<span class="html-italic">n</span> = 10), infection group (<span class="html-italic">n</span> = 10), and septic group (<span class="html-italic">n</span> = 10). Graphs are plotted with bars representing the median. <sup>#</sup> = <span class="html-italic">p</span> &lt; 0.05; * = <span class="html-italic">p</span> ≤ 0.01.</p>
Full article ">Figure 10
<p>Vδ1 cell phenotype. (<b>A</b>), Flow cytometry plot on gated T Cells showing Vδ1 and Vδ2 cells. (<b>B</b>) Frequency of Vδ1 T cells expressing IL-12 receptor (IL-12Rβ2) and IL-23 receptor (IL-23R). (<b>C</b>) Frequency of T cells that express Vδ1 TCRs. (<b>D</b>) Vδ1 T cell count in the three patient groups. (<b>E</b>) Differentiation status of Vδ1 T cells. Naive, central memory, effector memory, and terminally differentiated (N, CM, EM, TD, respectively) differentiation states shown. (<b>F</b>) Differentiation status of Vδ1 T cells expressed as the total cell count. Control group (<span class="html-italic">n</span> = 20), infection group (<span class="html-italic">n</span> = 19), and septic group (<span class="html-italic">n</span> = 32). Graphs are plotted with bars representing the median. <sup>#</sup> = <span class="html-italic">p</span> &lt; 0.05; * = <span class="html-italic">p</span> ≤ 0.01; ** = <span class="html-italic">p</span> ≤ 0.001.</p>
Full article ">Figure 11
<p>Vδ1 cell stimulation. (<b>A</b>) Frequency of unstimulated and stimulated Vδ1 cells expressing RORγt. (<b>B</b>) Frequency of unstimulated and stimulated Vδ1 cells expressing T-Bet. (<b>C</b>) Frequency of unstimulated and stimulated Vδ1 cells expressing IFN-γ. All were stimulated with phorbol myristate acetate and ionomycin (PMA/I). Control group (<span class="html-italic">n</span> = 10), infection group (<span class="html-italic">n</span> = 10), and septic group (<span class="html-italic">n</span> = 10). Graphs are plotted with bars representing the median. <sup>#</sup> = <span class="html-italic">p</span> &lt; 0.05.</p>
Full article ">Figure 12
<p>Vδ2 cell phenotype. (<b>A</b>) Frequency of T lymphocytes that are Vδ2 Cells. (<b>B</b>) Vδ2 T cell count in the three patient groups. (<b>C</b>) Differentiation status of Vδ2 T cells. Naive, central memory, effector memory, and terminally differentiated (N, CM, EM, TD, respectively) differentiation states shown. (<b>D</b>) Differentiation status of Vδ2 T cells expressed as the total cell count. (<b>E</b>) Flow cytometry plot on gated Vδ2 T cells showing differentiation status. Control group (<span class="html-italic">n</span> = 20), infection group (<span class="html-italic">n</span> = 19), and septic group (<span class="html-italic">n</span> = 32). Graphs are plotted with bars representing the median. <sup>#</sup> = <span class="html-italic">p</span> &lt; 0.05; * = <span class="html-italic">p</span> ≤ 0.01; ** = <span class="html-italic">p</span> ≤ 0.001.</p>
Full article ">Figure 13
<p>Vδ2 cell stimulation. (<b>A</b>) Frequency of unstimulated and stimulated Vδ2 T cells expressing T-Bet. (<b>B</b>) Frequency of unstimulated and stimulated Vδ2 T cells expressing RORγt. (<b>C</b>) Frequency of unstimulated and stimulated Vδ2 T cells expressing interferon gamma (IFN-γ). Stimulated with phorbol myristate acetate and ionomycin (PMA/I). Control group (<span class="html-italic">n</span> = 10), infection group (<span class="html-italic">n</span> = 10), and septic group (<span class="html-italic">n</span> = 10). Graphs are plotted with bars representing the median. <sup>#</sup> = <span class="html-italic">p</span> &lt; 0.05.</p>
Full article ">
Previous Issue
Next Issue
Back to TopTop