[go: up one dir, main page]

Next Issue
Volume 12, January
Previous Issue
Volume 11, November


Antioxidants, Volume 11, Issue 12 (December 2022) – 196 articles

Cover Story (view full-size image): 
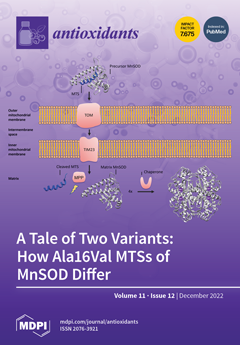
Manganese superoxide dismutase (MnSOD) controls oxidative stress in mitochondria by scavenging reactive oxygen species (ROS). A single nucleotide polymorphism (SNP) on its gene has been linked to various types of cancer and autoimmune diseases. This study determines the effect of the SNP on the secondary structure of the mitochondrial targeting sequence (MTS) of the MnSOD protein using molecular dynamics simulations in the CHARMM36m force field. Our findings show that the alanine variant of the MTS maintains an α-helical structure that is favorable for protein transport into mitochondria, whereas the valine variant's α-helix breaks down. These results suggest that the alanine MTS may be the more active variant of MnSOD, though further experiments are needed to confirm this. View this paper
  • Issues are regarded as officially published after their release is announced to the table of contents alert mailing list.
  • You may sign up for e-mail alerts to receive table of contents of newly released issues.
  • PDF is the official format for papers published in both, html and pdf forms. To view the papers in pdf format, click on the "PDF Full-text" link, and use the free Adobe Reader to open them.
Order results
Result details
Section
Select all
Export citation of selected articles as:
17 pages, 896 KiB  
Review
The Importance of SGLT-2 Inhibitors as Both the Prevention and the Treatment of Diabetic Cardiomyopathy
by Klaudia Kowalska, Piotr Wilczopolski, Dominika Buławska, Ewelina Młynarska, Jacek Rysz and Beata Franczyk
Antioxidants 2022, 11(12), 2500; https://doi.org/10.3390/antiox11122500 - 19 Dec 2022
Cited by 5 | Viewed by 3333
Abstract
According to the 2021 report of the International Diabetes Federation (IDF), there have been approximately 573 million cases of type 2 diabetes mellitus (T2DM) among adults, which sets the disease as a major concern in healthcare worldwide. The development of T2DM is strongly [...] Read more.
According to the 2021 report of the International Diabetes Federation (IDF), there have been approximately 573 million cases of type 2 diabetes mellitus (T2DM) among adults, which sets the disease as a major concern in healthcare worldwide. The development of T2DM is strongly promoted by unhealthy lifestyle factors associated with urbanization and western civilization. The disease is associated with a broad list of systemic complications that can result in premature death, disability and significantly reduced quality of life. The most dramatic in their consequences are cardiovascular complications of T2DM. Our work focuses on one such complication that is specific for diabetes, named diabetic cardiomyopathy (DC). In this condition cardiac dysfunction occurs despite the absence of underlying hypertension, coronary artery disease and valvular disease, which suggest a leading role for metabolic disturbances as a cause. We aimed to establish the role of relatively new hypoglycaemic drugs that have taken the medical world by storm with their broad pleiotropic effects—SGLT-2 inhibitors—in the prevention and treatment of DC at any stage. Full article
(This article belongs to the Special Issue Oxidative Stress in Metabolic Cardiomyopathy)
Show Figures

Figure 1

Figure 1
<p>The pathophysiology of DC.</p>
Full article ">Figure 2
<p>Mechanism of cardioprotection displayed by SGLT-2is.</p>
Full article ">
20 pages, 3759 KiB  
Article
The Synthetic Flavonoid Hidrosmin Improves Endothelial Dysfunction and Atherosclerotic Lesions in Diabetic Mice
by Luna Jiménez-Castilla, Lucas Opazo-Ríos, Gema Marin-Royo, Macarena Orejudo, Raquel Rodrigues-Diez, Constanza Ballesteros-Martínez, Manuel Soto-Catalán, Teresa Caro-Ordieres, Inés Artaiz, Tatiana Suarez-Cortés, Arturo Zazpe, Gonzalo Hernández, Marcelino Cortés, José Tuñón, Ana M. Briones, Jesús Egido and Carmen Gómez-Guerrero
Antioxidants 2022, 11(12), 2499; https://doi.org/10.3390/antiox11122499 - 19 Dec 2022
Cited by 2 | Viewed by 2690
Abstract
In diabetes, chronic hyperglycemia, dyslipidemia, inflammation and oxidative stress contribute to the progression of macro/microvascular complications. Recently, benefits of the use of flavonoids in these conditions have been established. This study investigates, in two different mouse models of diabetes, the vasculoprotective effects of [...] Read more.
In diabetes, chronic hyperglycemia, dyslipidemia, inflammation and oxidative stress contribute to the progression of macro/microvascular complications. Recently, benefits of the use of flavonoids in these conditions have been established. This study investigates, in two different mouse models of diabetes, the vasculoprotective effects of the synthetic flavonoid hidrosmin on endothelial dysfunction and atherogenesis. In a type 2 diabetes model of leptin-receptor-deficient (db/db) mice, orally administered hidrosmin (600 mg/kg/day) for 16 weeks markedly improved vascular function in aorta and mesenteric arteries without affecting vascular structural properties, as assessed by wire and pressure myography. In streptozotocin-induced type 1 diabetic apolipoprotein E-deficient mice, hidrosmin treatment for 7 weeks reduced atherosclerotic plaque size and lipid content; increased markers of plaque stability; and decreased markers of inflammation, senescence and oxidative stress in aorta. Hidrosmin showed cardiovascular safety, as neither functional nor structural abnormalities were noted in diabetic hearts. Ex vivo, hidrosmin induced vascular relaxation that was blocked by nitric oxide synthase (NOS) inhibition. In vitro, hidrosmin stimulated endothelial NOS activity and NO production and downregulated hyperglycemia-induced inflammatory and oxidant genes in vascular smooth muscle cells. Our results highlight hidrosmin as a potential add-on therapy in the treatment of macrovascular complications of diabetes. Full article
(This article belongs to the Special Issue Flavonoids and Chronic Diseases)
Show Figures

Figure 1

Figure 1
<p>Effect of hidrosmin treatment in vascular function of aorta and mesenteric arteries from db/db mouse model. Maximum responses to high K<sup>+</sup> concentration in aorta (<b>a</b>) and mesenteric resistance arteries (MRAs) (<b>b</b>) from non-diabetic (db/m), untreated diabetic (db/db) and hidrosmin-treated diabetic (db/db + H) mice. Graphs represent individual data and the mean ± SEM of each group (db/m, <span class="html-italic">n</span> = 7; db/db, <span class="html-italic">n</span> = 8–9; db/db + H, <span class="html-italic">n</span> = 7) * <span class="html-italic">p</span> &lt; 0.05 vs. db/m by Kruskal–Wallis, followed by Dunn’s post-test. (<b>c</b>–<b>h</b>) Concentration–response curves to phenylephrine (Phe), acetylcholine (Ach) and diethylamine NONOate (DEA-NO) of aortas (<b>c</b>,<b>e</b>,<b>g</b>) and mesenteric arteries (<b>d</b>,<b>f</b>,<b>h</b>). Graphs represent the mean ± SEM of the indicated number of animals per group. * <span class="html-italic">p</span> &lt; 0.05 vs. db/m and # <span class="html-italic">p</span> &lt; 0.05 vs. db/db by two-way ANOVA followed by Bonferroni’s post-test.</p>
Full article ">Figure 1 Cont.
<p>Effect of hidrosmin treatment in vascular function of aorta and mesenteric arteries from db/db mouse model. Maximum responses to high K<sup>+</sup> concentration in aorta (<b>a</b>) and mesenteric resistance arteries (MRAs) (<b>b</b>) from non-diabetic (db/m), untreated diabetic (db/db) and hidrosmin-treated diabetic (db/db + H) mice. Graphs represent individual data and the mean ± SEM of each group (db/m, <span class="html-italic">n</span> = 7; db/db, <span class="html-italic">n</span> = 8–9; db/db + H, <span class="html-italic">n</span> = 7) * <span class="html-italic">p</span> &lt; 0.05 vs. db/m by Kruskal–Wallis, followed by Dunn’s post-test. (<b>c</b>–<b>h</b>) Concentration–response curves to phenylephrine (Phe), acetylcholine (Ach) and diethylamine NONOate (DEA-NO) of aortas (<b>c</b>,<b>e</b>,<b>g</b>) and mesenteric arteries (<b>d</b>,<b>f</b>,<b>h</b>). Graphs represent the mean ± SEM of the indicated number of animals per group. * <span class="html-italic">p</span> &lt; 0.05 vs. db/m and # <span class="html-italic">p</span> &lt; 0.05 vs. db/db by two-way ANOVA followed by Bonferroni’s post-test.</p>
Full article ">Figure 2
<p>Effects of hidrosmin in vascular function of C57BL6 mouse aorta. (<b>a</b>) Concentration–response curves to hidrosmin in the absence (control) and presence of L-NAME. (<b>b</b>) Concentration–response curves to phenylephrine (Phe) in the absence (control) and presence of hidrosmin. Graphs represent the mean ± SEM of 4–5 independent experiments. * <span class="html-italic">p</span> &lt; 0.05 vs. control by two-way ANOVA, followed by Bonferroni’s post-test.</p>
Full article ">Figure 3
<p>Effect of hidrosmin treatment on structural properties of mesenteric arteries from db/db mouse model. Aorta (<b>a</b>) and mesenteric resistance arteries (<b>b</b>–<b>f</b>) structural parameters in non-diabetic mice (db/m, <span class="html-italic">n</span> = 8–6), untreated diabetic mice (db/db, <span class="html-italic">n</span> = 10) and hidrosmin-treated diabetic mice (db/db + H, <span class="html-italic">n</span> = 8–9). Graphs represent individual values (<b>a</b>) and mean ± SEM of each group (<b>a</b>–<b>f</b>). * <span class="html-italic">p</span> &lt; 0.05 vs. db/m by Kruskal–Wallis, followed by Dunn’s post-test (<b>a</b>) or two-way ANOVA, followed by Bonferroni’s post-test (<b>b</b>–<b>f</b>). Abbreviation: CSA, cross-sectional area.</p>
Full article ">Figure 4
<p>Hidrosmin treatment reduces atherosclerosis development in diabetic ApoE KO mice. Representative images of ORO/hematoxylin staining (<b>a</b>), Sirius red collagen staining (<b>b</b>) and VSMC immunodetection ((<b>c</b>); red, α-SMA; blue, DAPI nuclear staining) in aortic root sections of diabetic mice untreated (D) and treated with hidrosmin (D + H). Magnification ×100 (<b>a</b>) and ×200 (<b>b</b>,<b>c</b>). (<b>d</b>) Quantification of the extent of atherosclerotic lesions within the aorta. (<b>e</b>) Average of individual maximal lesion size in each group. (<b>f</b>) Assessment of collagen-to-lipid ratio. (<b>g</b>) Quantification of VSMC content in lesions. (<b>h</b>) Classification of mouse atherosclerotic plaques according to the Stary method (grades G1 to G4). Graphs represent individual values and mean ± SEM of each group (D, <span class="html-italic">n</span> = 7; D + H, <span class="html-italic">n</span> = 11). * <span class="html-italic">p</span> &lt; 0.05 vs. D group by Mann–Whitney U test.</p>
Full article ">Figure 5
<p>Attenuated inflammation, senescence and oxidative stress in aortic lesions of hidrosmin-treated mice. Representative images (magnification ×200) for CD68+ macrophages (<b>a</b>) and CD3+ T cells immunostaining (<b>b</b>) in aortic lesions from diabetic ApoE KO mice (untreated, D; hidrosmin treatment, D + H) and quantification (<b>c</b>). (<b>d</b>) Representative images (magnification ×200) of TERT immunostaining and quantification (<b>e</b>). (<b>f</b>) Real-time PCR analysis of inflammatory (<span class="html-italic">Ccl2</span>, <span class="html-italic">Ccl5</span>, <span class="html-italic">Il-1β</span> and <span class="html-italic">Tnfα</span>) and senescence (<span class="html-italic">Tert</span> and <span class="html-italic">p16</span>) genes in mouse aorta. Values normalized to 18S rRNA are expressed as arbitrary units (a.u.). (<b>g</b>) Representative images (magnification ×200) of 8OHdG immunoperoxidase in mouse aorta and quantification of positive staining (<b>h</b>). (<b>i</b>) Quantification of 8OHdG levels in serum samples by ELISA method. (<b>j</b>) Gene expression analysis of pro-oxidant (<span class="html-italic">Nox1</span> and <span class="html-italic">Nox4</span>) and antioxidant (<span class="html-italic">Sod1</span> and Catalase, <span class="html-italic">Cat</span>) genes in mouse aorta. Values normalized to 18S rRNA are expressed as arbitrary units (a.u.). Graphs represent individual values and mean ± SEM of each group (D, <span class="html-italic">n</span> = 6–7; D + H, <span class="html-italic">n</span> = 8–11). * <span class="html-italic">p</span> &lt; 0.05, ** <span class="html-italic">p</span> &lt; 0.01 and *** <span class="html-italic">p</span> &lt; 0.001 vs. D group by Mann–Whitney U test.</p>
Full article ">Figure 5 Cont.
<p>Attenuated inflammation, senescence and oxidative stress in aortic lesions of hidrosmin-treated mice. Representative images (magnification ×200) for CD68+ macrophages (<b>a</b>) and CD3+ T cells immunostaining (<b>b</b>) in aortic lesions from diabetic ApoE KO mice (untreated, D; hidrosmin treatment, D + H) and quantification (<b>c</b>). (<b>d</b>) Representative images (magnification ×200) of TERT immunostaining and quantification (<b>e</b>). (<b>f</b>) Real-time PCR analysis of inflammatory (<span class="html-italic">Ccl2</span>, <span class="html-italic">Ccl5</span>, <span class="html-italic">Il-1β</span> and <span class="html-italic">Tnfα</span>) and senescence (<span class="html-italic">Tert</span> and <span class="html-italic">p16</span>) genes in mouse aorta. Values normalized to 18S rRNA are expressed as arbitrary units (a.u.). (<b>g</b>) Representative images (magnification ×200) of 8OHdG immunoperoxidase in mouse aorta and quantification of positive staining (<b>h</b>). (<b>i</b>) Quantification of 8OHdG levels in serum samples by ELISA method. (<b>j</b>) Gene expression analysis of pro-oxidant (<span class="html-italic">Nox1</span> and <span class="html-italic">Nox4</span>) and antioxidant (<span class="html-italic">Sod1</span> and Catalase, <span class="html-italic">Cat</span>) genes in mouse aorta. Values normalized to 18S rRNA are expressed as arbitrary units (a.u.). Graphs represent individual values and mean ± SEM of each group (D, <span class="html-italic">n</span> = 6–7; D + H, <span class="html-italic">n</span> = 8–11). * <span class="html-italic">p</span> &lt; 0.05, ** <span class="html-italic">p</span> &lt; 0.01 and *** <span class="html-italic">p</span> &lt; 0.001 vs. D group by Mann–Whitney U test.</p>
Full article ">Figure 6
<p>In vitro effects of hidrosmin. Real-time PCR analysis of inflammatory (<b>a</b>) and redox balance (<b>b</b>) genes in VSMC cultured under basal and high-glucose (HG) conditions without/with different concentrations of hidrosmin. Values normalized to 18S rRNA (<span class="html-italic">n</span> = 3 independent experiments performed in duplicate) are expressed as arbitrary units (a.u.). (<b>c</b>) Time course of hidrosmin-induced eNOS phosphorylation in HMEC-1 cells. Representative immunoblots of p-eNOS (S1177) and total eNOS (<span class="html-italic">n</span> = 4 experiments) and summary of normalized quantifications expressed as fold increases over basal are shown. (<b>d</b>) Time- and dose-response curves of hidrosmin-induced NO production in HMEC-1 cells. NO (nitrite + nitrate) levels in cell supernatants were normalized to protein content (<span class="html-italic">n</span> = 4–6 experiments). Graphs represent individual values and mean ± SEM. # <span class="html-italic">p</span> &lt; 0.05, ## <span class="html-italic">p</span> &lt; 0.01 and ### <span class="html-italic">p</span> &lt; 0.001 vs. basal; * <span class="html-italic">p</span> &lt; 0.05, ** <span class="html-italic">p</span> &lt; 0.01 and *** <span class="html-italic">p</span> &lt; 0.001 vs. HG.</p>
Full article ">Figure 7
<p>Schematic and representative views in echocardiographic assessment. (<b>A</b>) After depilation of the thoracic area, anesthetic induction with isoflurane is performed for echocardiographic evaluation. The mouse is kept in the supine position. The legs are clamped to the heating platform while the operator positions and directs the probe for the LV short-axis view. The red arrow shows the long axis of the transducer, as well as the location of the orientation notch on all transducers to guide the operator. (<b>B</b>) The use of M-mode allows assessment of systolic LV function by obtaining thicknesses of the interventricular septum, LV posterior wall and LV internal dimensions in both diastole and systole. (<b>C</b>) Representative image of sequences (at least 3 s per animal) obtained in non-diabetic (db/m), untreated diabetic (db/db) and hidrosmin-treated (db/db + Hidrosmin) mice. Abbreviations: IVS, interventricular septum; LVID, LV internal dimension; PW, LV posterior wall. All thicknesses in diastole (d) and systole (s).</p>
Full article ">
17 pages, 1579 KiB  
Article
Utilizing Proteomic Approach to Analyze Potential Antioxidant Proteins in Plant against Irradiation
by Ming-Hui Yang, Yi-Shan Lu, Tzu-Chuan Ho, Daniel Hueng-Yuan Shen, Ying-Fong Huang, Kuo-Pin Chuang, Cheng-Hui Yuan and Yu-Chang Tyan
Antioxidants 2022, 11(12), 2498; https://doi.org/10.3390/antiox11122498 - 19 Dec 2022
Cited by 2 | Viewed by 1577
Abstract
Gamma-ray irradiation is an effective and clean method of sterilization by inactivating microorganisms. It can also be applied to induce anti-oxidants for future application. In this study, the mung bean (Vigna radiata) was exposed to gamma-ray irradiation under the dose of [...] Read more.
Gamma-ray irradiation is an effective and clean method of sterilization by inactivating microorganisms. It can also be applied to induce anti-oxidants for future application. In this study, the mung bean (Vigna radiata) was exposed to gamma-ray irradiation under the dose of 0, 5 or 10 kGy. With increasing irradiation doses, the concentrations of malondiadehyde decreased while the levels of total flavonoids and DPPH (1,1-diphenyl-2-picrylhydrazyl) radical scavenging activity increased. It has been shown that consuming flavonoids can provide protective effects. In addition, proteomic analysis identified several proteins having anti-oxidant activities in the 5 kGy irradiated group. These proteins are Apocytochrome f, Systemin receptor SR 160, DELLA protein DWARF8, DEAD-box ATP-dependent RNA helicase 9, ζ-carotene desaturase (ZDS), and Floral homeotic protein AGAMOUS. Our findings indicate that plants contain a variety of phytochemicals and antioxidant proteins which may effectively prevent oxidative stress caused by irradiated peroxidation. Full article
(This article belongs to the Special Issue Antioxidants in Food and Cosmetics)
Show Figures

Figure 1

Figure 1
<p>The phenotypic appearance of non-irradiated (0 kGy) and irradiated (5–10 kGy) mung beans. Seeds grown for four days without irradiation (<b>A</b>), with 5 kGy irradiation (<b>B</b>), or with 10 kGy irradiation (<b>C</b>) are shown in groups. For comparison, one seed from each condition is shown in parallel (<b>D</b>).</p>
Full article ">Figure 2
<p>The changes in plant height under various doses of gamma-ray irradiation (mean ± standard deviation, N = 20/group).</p>
Full article ">Figure 3
<p>The quantities of MDA, an index for oxidation stress after various gamma-ray irradiation doses of mung beans. MDA content of non-irradiated (0 kGy) and irradiated (5 or 10 kGy) mung beans. (mean ± standard deviation, * <span class="html-italic">p</span> &lt; 0.001; N = 20/group).</p>
Full article ">Figure 4
<p>The measurements of total flavonoids of non-irradiated (0 kGy) and irradiated (5 or 10 kGy) mung beans. (mean ± standard deviation, * <span class="html-italic">p</span> &lt; 0.001; N = 20/group).</p>
Full article ">Figure 5
<p>DPPH radical scavenging activities of non-irradiated (0 kGy) and irradiated (5 or 10 kGy) mung beans. (mean ± standard deviation, * <span class="html-italic">p</span> &lt; 0.001; N = 20/group).</p>
Full article ">Figure 6
<p>The effect of gamma-ray irradiation on the biological system of plant. Radiation can cause direct and indirect effects to DNA and proteins. For indirect effects, ROS are generated leading to increased oxidative stress and free radicals. In response to these radiation effects, flavonoid and anti-oxidative stress proteins are induced via this proposed mechanism.</p>
Full article ">
18 pages, 1762 KiB  
Article
Effects of Phenolic-Rich Pinus densiflora Extract on Learning, Memory, and Hippocampal Long-Term Potentiation in Scopolamine-Induced Amnesic Rats
by Kwan Joong Kim, Eun-Sang Hwang, Min-Jeong Kim, Chan-Su Rha, Myoung Chong Song, Sungho Maeng, Ji-Ho Park and Dae-Ok Kim
Antioxidants 2022, 11(12), 2497; https://doi.org/10.3390/antiox11122497 - 19 Dec 2022
Cited by 9 | Viewed by 2271
Abstract
Alzheimer’s disease is the most common type of dementia with cognitive impairment. Various plant-derived phenolics are known to alleviate cognitive impairment in Alzheimer’s disease by radical scavenging and strengthening synaptic plasticity activities. Here, we examined the cognition-improving effect of Pinus densiflora Sieb. et [...] Read more.
Alzheimer’s disease is the most common type of dementia with cognitive impairment. Various plant-derived phenolics are known to alleviate cognitive impairment in Alzheimer’s disease by radical scavenging and strengthening synaptic plasticity activities. Here, we examined the cognition-improving effect of Pinus densiflora Sieb. et Zucc. bark extract (PBE). We identified and quantified phenolics in the PBE using a UHPLC-Orbitrap mass spectrometer. To evaluate the cognition-enhancing effects of PBE, scopolamine-induced amnesic Sprague-Dawley (SD) rats (5 weeks old) and ion channel antagonist-induced organotypic hippocampal slices of SD rats (7 days old) were used. Twenty-three phenolics were tentatively identified in PBE, 10 of which were quantified. Oral administration of PBE to the scopolamine-induced SD rats improved cognitive impairment in behavioral tests. PBE-fed SD rats showed significantly improved antioxidant indices (superoxide dismutase and catalase activities, and malondialdehyde content) and reduced acetylcholinesterase activity in hippocampal lysate compared with the scopolamine group. PBE increased the long-term potentiation (LTP) induction and rescued LTP from blockades by the muscarinic cholinergic receptor antagonist (scopolamine) and N-methyl-D-aspartate channel antagonist (2-amino-5-phosphonovaleric acid) in the organotypic hippocampal slices. These results suggest that polyphenol-rich PBE is applicable as a cognition-improving agent due to its antioxidant properties and enhancement of LTP induction. Full article
Show Figures

Graphical abstract

Graphical abstract
Full article ">Figure 1
<p>Experimental design in this study. (<b>A</b>) Phenolic analysis using UHPLC-DAD/Orbitrap MS/MS analysis, (<b>B</b>) Animal behavioral study in Sprague-Dawley (SD) rat and (<b>C</b>) measurement of long-term potentiation in hippocampal tissue of young SD rat. aCSF, artificial cerebrospinal fluid; CNQX, 6-cyano-7-nitroquinoxaline-2,3-dione; DAD, diode array detector; DL-AP5, DL-2-amino-5-phosphonopentanoic acid; MS, mass spectrometer; PBE, <span class="html-italic">Pinus densiflora</span> Sieb. et Zucc. bark extract; SCOP, Scopolamine; UV, ultraviolet.</p>
Full article ">Figure 2
<p>Effects of PBE on the animal behavior tests. SCOP (1 mg/kg/day body weight (BW); <span class="html-italic">i.p.</span>) was administered to SD rats 30 min before the tests (n = 8). PBE (15 and 30 mg/kg BW/day; <span class="html-italic">p.o.</span>) was administered to the PBE groups 60 min before the tests. (<b>A</b>) Alternation behavior and (<b>B</b>) total number of arm entries using the Y-maze test, (<b>C</b>) step-through latency time of acquisition trial and retention test in the passive avoidance test, and (<b>D</b>) latency time to platform in training days and (<b>E</b>) target zone navigation of acquisition trial using the Morris water maze test. Tukey’s honestly significant difference test: ** <span class="html-italic">p</span> &lt; 0.01, *** <span class="html-italic">p</span> &lt; 0.001 vs. control and <sup>#</sup> <span class="html-italic">p</span> &lt; 0.05, <sup>##</sup> <span class="html-italic">p</span> &lt; 0.01, <sup>###</sup> <span class="html-italic">p</span> &lt; 0.001 vs. SCOP.</p>
Full article ">Figure 3
<p>Effects of PBE on (<b>A</b>) superoxide dismutase (SOD) activity, (<b>B</b>) catalase activity, (<b>C</b>) malondialdehyde (MDA) content, and (<b>D</b>) acetylcholinesterase (AChE) activity in hippocampus lysate of SD rats (n = 8) after the behavioral tests. Tukey’s honestly significant difference test: *** <span class="html-italic">p</span> &lt; 0.001 vs. control and <sup>#</sup> <span class="html-italic">p</span> &lt; 0.05, <sup>##</sup> <span class="html-italic">p</span> &lt; 0.01, <sup>###</sup> <span class="html-italic">p</span> &lt; 0.001 vs. SCOP.</p>
Full article ">Figure 4
<p>Effects of PBE, SCOP, DL-AP5, and CNQX on long-term potentiation (LTP) in organotypic hippocampal tissue from 7-day-old male SD rats (n = 6). (<b>A</b>) Time course of LTP from all recordings in control and PBE (25, 50, and 100 mg/L) groups, (<b>C</b>) time course of LTP in control, SCOP (300 μM), and SCOP with 50 mg/L of PBE, (<b>E</b>) time course of LTP in the control, DL-AP5 (50 μM) and DL-AP5 with PBE50, and (<b>G</b>) time course of LTP in the control, CNQX (10 μM) and CNQX with PBE50. (<b>B</b>,<b>D</b>,<b>F</b>,<b>H</b>) Average LTP amplitude measured at 30–40 min after high-frequency stimuli (HFS). fEPSP, field excitatory postsynaptic potential. Tukey’s honestly significant difference test: *** <span class="html-italic">p</span> &lt; 0.001 vs. control and <sup>##</sup> <span class="html-italic">p</span> &lt; 0.01 vs. SCOP.</p>
Full article ">
12 pages, 5492 KiB  
Article
Stevia and Stevioside Attenuate Liver Steatosis through PPARα-Mediated Lipophagy in db/db Mice Hepatocytes
by Miey Park, Anshul Sharma, Hana Baek, Jin-Young Han, Junho Yu and Hae-Jeung Lee
Antioxidants 2022, 11(12), 2496; https://doi.org/10.3390/antiox11122496 - 19 Dec 2022
Cited by 7 | Viewed by 2914
Abstract
Lipophagy, a type of autophagy that breaks down lipid droplets, is essential in the regulation of intracellular lipid accumulation and intracellular free fatty acid levels in numerous organisms and metabolic conditions. We investigated the effects of Stevia rebaudiana Bertoni (S), a low-calorie sweetener, [...] Read more.
Lipophagy, a type of autophagy that breaks down lipid droplets, is essential in the regulation of intracellular lipid accumulation and intracellular free fatty acid levels in numerous organisms and metabolic conditions. We investigated the effects of Stevia rebaudiana Bertoni (S), a low-calorie sweetener, and stevioside (SS) on hepatic steatosis and autophagy in hepatocytes, as well as in db/db mice. S and SS reduced the body and liver weight and levels of serum triglyceride, total cholesterol, and hepatic lipogenic proteins. In addition, S and SS increased the levels of fatty acid oxidase, peroxisome proliferator-activated receptor alpha (PPARα), and microtubule-associated protein light chain 3 B but decreased that of sequestosome 1 (p62) in the liver of db/db mice. Additionally, Beclin 1, lysosomal associated membrane protein 1, and phosphorylated adenosine monophosphate-activated protein kinase protein expression was augmented following S and SS treatment of db/db mice. Furthermore, the knockdown of PPARα blocked lipophagy in response to SS treatment in HepG2 cells. These outcomes indicate that PPARα-dependent lipophagy is involved in hepatic steatosis in the db/db mouse model and that SS, a PPARα agonist, represents a new therapeutic option for managing associated diseases. Full article
(This article belongs to the Special Issue Regulation of Autophagy under Stress)
Show Figures

Graphical abstract

Graphical abstract
Full article ">Figure 1
<p>Stevia and stevioside attenuate lipid accumulation in <span class="html-italic">db/db</span> mice. Mice were orally administered saline (N+ and NC), saline with 200 mg/kg/day metformin (PC), saline with 200 or 500 mg/kg/day stevia (S200 and S500), and saline with 40 mM/kg/day stevioside (SS) for 3 weeks. (<b>a</b>) Body weight. (<b>b</b>) Liver weight. (<b>c</b>) Serum triglyceride (TG). (<b>d</b>) Serum total cholesterol (TC). (<b>e</b>) Image of liver tissues. All data are presented as the mean ± standard error (SE), <span class="html-italic">n</span> = 6 and represent results from three independent experiments. Scale bar, 100 μm. * <span class="html-italic">p</span> &lt; 0.05, ** <span class="html-italic">p</span> &lt; 0.01, *** <span class="html-italic">p</span> &lt; 0.001, and **** <span class="html-italic">p</span> &lt; 0.0001.</p>
Full article ">Figure 2
<p>Stevia and stevioside attenuate adipogenic-related genes and proteins in <span class="html-italic">db/db</span> mice. Mice were orally administered saline (N+ and NC), saline with 200 mg/kg/day metformin (PC), saline with 200 or 500 mg/kg/day stevia (S200 and S500), and saline with 40 mM/kg/day stevioside (SS) for 3 weeks. (<b>a</b>,<b>e</b>) Peroxisome proliferator-activated receptor gamma (PPARγ). (<b>b</b>,<b>f</b>) Sterol regulatory element-binding transcription factor-1c (SREBP-1c). (<b>c</b>,<b>g</b>) CCAAT/enhancer binding protein alpha (C/EBPα). (<b>d</b>,<b>h</b>) Fatty acid synthase (FAS). All data are presented as the mean ± SE, <span class="html-italic">n</span> = 6 and represent results from three independent experiments. * <span class="html-italic">p</span> &lt; 0.05, ** <span class="html-italic">p</span> &lt; 0.01, *** <span class="html-italic">p</span> &lt; 0.001, and **** <span class="html-italic">p</span> &lt; 0.0001.</p>
Full article ">Figure 2 Cont.
<p>Stevia and stevioside attenuate adipogenic-related genes and proteins in <span class="html-italic">db/db</span> mice. Mice were orally administered saline (N+ and NC), saline with 200 mg/kg/day metformin (PC), saline with 200 or 500 mg/kg/day stevia (S200 and S500), and saline with 40 mM/kg/day stevioside (SS) for 3 weeks. (<b>a</b>,<b>e</b>) Peroxisome proliferator-activated receptor gamma (PPARγ). (<b>b</b>,<b>f</b>) Sterol regulatory element-binding transcription factor-1c (SREBP-1c). (<b>c</b>,<b>g</b>) CCAAT/enhancer binding protein alpha (C/EBPα). (<b>d</b>,<b>h</b>) Fatty acid synthase (FAS). All data are presented as the mean ± SE, <span class="html-italic">n</span> = 6 and represent results from three independent experiments. * <span class="html-italic">p</span> &lt; 0.05, ** <span class="html-italic">p</span> &lt; 0.01, *** <span class="html-italic">p</span> &lt; 0.001, and **** <span class="html-italic">p</span> &lt; 0.0001.</p>
Full article ">Figure 3
<p>Stevia and stevioside activate fatty acid oxidation-related proteins in <span class="html-italic">db/db</span> mice. Mice were orally administered saline (N+ and NC), saline with 200 mg/kg/day metformin (PC), saline with 200 or 500 mg/kg/day stevia (S200 and S500), and saline with 40 mM/kg/day stevioside (SS) for 3 weeks. (<b>a</b>) Carnitine palmitoyl transferase-1 (CPT-1). (<b>b</b>) Peroxisome proliferator-activated receptor alpha (PPARα). (<b>c</b>) Adenosine monophosphate-activated protein kinase (AMPK). All data are presented as the mean ± SE, <span class="html-italic">n</span> = 3 and represent results from three independent experiments. * <span class="html-italic">p</span> &lt; 0.05, ** <span class="html-italic">p</span> &lt; 0.01, *** <span class="html-italic">p</span> &lt; 0.001, and **** <span class="html-italic">p</span> &lt; 0.0001.</p>
Full article ">Figure 4
<p>Stevia and stevioside induce autophagy in hepatocytes of <span class="html-italic">db/db</span> mice. Mice were orally administered saline (N+ and NC), saline with 200 mg/kg/day metformin (PC), saline with 200 or 500 mg/kg/day stevia (S200 and S500), and saline with 40 mM/kg/day stevioside (SS) for 3 weeks. (<b>a</b>) Microtubule-associated protein light chain 3B (LC3B)-II/LC3B-I. (<b>b</b>) Sequestosome1 (SQSTM1). (<b>c</b>) Transcription factor EB (TFEB). (<b>d</b>) Lysosomal associated membrane protein 1 (LAMP-1). (<b>e</b>) Beclin 1 (BECN1). (<b>f</b>) Bax/Bcl-2. All data are presented as the mean ± SE, <span class="html-italic">n</span> = 3 and represent results from three independent experiments. * <span class="html-italic">p</span> &lt; 0.05, ** <span class="html-italic">p</span> &lt; 0.01, *** <span class="html-italic">p</span> &lt; 0.001, and **** <span class="html-italic">p</span> &lt; 0.0001.</p>
Full article ">Figure 5
<p>Stevioside induces autophagy in steatosis-induced hepatocytes. HepG2 cells were treated with 1 mM FFA and different concentrations of stevioside (SS; 0, 12.5, 25, 50, or 100 μM) in the presence or absence of 10 μM chloroquine (CQ) for 24 h. (<b>a</b>) Microtubule-associated protein light chain 3B (LC3B)-II/LC3B-I. (<b>b</b>) Sequestosome1 (SQSTM1). (<b>c</b>) HepG2 cells were stained with Oil Red O. Scale bar, 100 μm. (<b>d</b>) Intracellular lipid accumulation (the absorbance of lipids was measured at 500 nm). (<b>e</b>) Immunoblot analysis. (<b>f</b>) Cells were observed by fluorescence microscopy. Scale bar, 10 μm. All data are presented as the mean ± SE and represent results from three independent experiments. * <span class="html-italic">p</span> &lt; 0.05, ** <span class="html-italic">p</span> &lt; 0.01, *** <span class="html-italic">p</span> &lt; 0.001, and **** <span class="html-italic">p</span> &lt; 0.0001.</p>
Full article ">Figure 6
<p>Stevioside-induced autophagy is dependent on PPARα in hepatocytes. HepG2 cells were transfected with the nonspecific (NS) siRNA or peroxisome proliferator-activated receptor α (PPARα) siRNA. After 24 h, the cells were treated with different concentration of stevioside (SS; 0, 12.5, and 25 μM) for another 24 h. (<b>a</b>) Immunoblot analysis of PPARα, microtubule-associated protein light chain 3B (LC3B)-II/LC3B-I, sequestosome1 (SQSTM1), and β-actin. (<b>b</b>) Relative expression of LC3B-II/LC3B-I. (<b>c</b>) Relative expression of SQSTM1(p62)/β-actin. All data are presented as the mean ± SE and represent results from three independent experiments. * <span class="html-italic">p</span> &lt; 0.05, *** <span class="html-italic">p</span> &lt; 0.001, and **** <span class="html-italic">p</span> &lt; 0.0001.</p>
Full article ">
21 pages, 1602 KiB  
Article
Assessment of Gnaphalium viscosum (Kunth) Valorization Prospects: Sustainable Recovery of Antioxidants by Different Techniques
by Stanislava Boyadzhieva, Jose A. P. Coelho, Massimiliano Errico, H. Elizabeth Reynel-Avilla, Dragomir S. Yankov, Adrian Bonilla-Petriciolet and Roumiana P. Stateva
Antioxidants 2022, 11(12), 2495; https://doi.org/10.3390/antiox11122495 - 19 Dec 2022
Cited by 7 | Viewed by 1879
Abstract
This work investigates the prospects for exploitation of Gnaphalium viscosum (Kunth) abundant but with limited applications till present biomass. The feasibility of traditional techniques (two-phase solvent, and the benchmark Soxhlet extraction) and supercritical extraction without/with a cosolvent at T = 40–60 °C and [...] Read more.
This work investigates the prospects for exploitation of Gnaphalium viscosum (Kunth) abundant but with limited applications till present biomass. The feasibility of traditional techniques (two-phase solvent, and the benchmark Soxhlet extraction) and supercritical extraction without/with a cosolvent at T = 40–60 °C and p = 30–50 MPa was examined to explore the possibility of recovering phytochemicals from G. viscosum leaves, flowers and stems. The efficiency of the techniques was assessed and compared based on yield, influence of solvents used, total phenolic content and antioxidant activity of the extracts. Phenolics of different complexities were identified and quantified by applying LC (LC–MS/MS, and LC–HRAM), while the fatty acid profile was determined by GC–FID. The results of this extensive study demonstrated the huge valorization potential and prospects of G. viscosum, since highly potent antioxidants such as kaempferol, kaempferol-3-O-β-d-glucoside (astragalin), and chlorogenic acid were ascertained in considerable amounts. Furthermore, for the first time, the presence of leontopodic acid, a greatly substituted derivative of glucaric acid, was detected in the species. Full article
Show Figures

Figure 1

Figure 1
<p>Cumulative experimental kinetic extraction curves plotted vs. the extraction time, at a scCO<sub>2</sub> flow rate of 1.9 × 10<sup>−3</sup> kg/min. Influence of temperature at a constant pressure of 30 MPa (<b>a</b>) and pressure at a constant temperature of 333 K (<b>b</b>) on the yield for <span class="html-italic">G. viscosum</span> flowers.</p>
Full article ">Figure 2
<p>Cumulative experimental kinetic extraction curves plotted vs. the extraction time, at a scCO<sub>2</sub> flow rate of 1.9 × 10<sup>−3</sup> kg/min. Influence of temperature at a constant pressure of 30 MPa (<b>a</b>) and pressure at a constant temperature of 333 K (<b>b</b>) on the yield for <span class="html-italic">G. viscosum</span> leaves.</p>
Full article ">Figure 3
<p>Cumulative experimental kinetic extraction curves plotted vs. the extraction time, at a scCO<sub>2</sub> flow rate of 1.9 × 10<sup>−3</sup> kg/min, <span class="html-italic">T</span> = 333 K, <span class="html-italic">p</span> = 50 MPa. Influence of the co-solvent ethanol on the extraction process.</p>
Full article ">Figure 4
<p>Mass chromatogram of compounds containing MS/MS fragment ion [M − H]− = 209.023 specific to substances comprising caffeoyl-D-glucaric acids.</p>
Full article ">
24 pages, 749 KiB  
Review
Antioxidant Activity of Urtica dioica: An Important Property Contributing to Multiple Biological Activities
by Varun Jaiswal and Hae-Jeung Lee
Antioxidants 2022, 11(12), 2494; https://doi.org/10.3390/antiox11122494 - 19 Dec 2022
Cited by 16 | Viewed by 4225
Abstract
Urtica dioica (UD) is a multi-functional plant known to be used as both food and medicine from ancient times. The plant has the potential to be used as a fertilizer and for biological pest control. It is also used in textile and related [...] Read more.
Urtica dioica (UD) is a multi-functional plant known to be used as both food and medicine from ancient times. The plant has the potential to be used as a fertilizer and for biological pest control. It is also used in textile and related industries for its quality fibers. In the recent past, the plant has received great attention for its numerous important biological activities and food applications. The antioxidant activity of UD is the crucial factor supporting its important biological activities, such as anticancer, antidiabetic and anti-inflammatory properties. The antioxidant activity of UD is also found to be protective in different organs, including the brain, liver, lungs, kidney, ovary, and uterus, and may also be protective against diseases associated with these organs. Few clinical studies have endorsed the antioxidant potential of UD in patients. The current work is an attempt to comprehensively compile and discuss the antioxidant activity of UD from in vitro, in vivo and human studies. The insights of the current study would be helpful in getting a panoramic view of the antioxidant potential of UD, and provide direction for optimizing and developing it for therapeutic applications against important diseases and conditions in the near future. Full article
Show Figures

Figure 1

Figure 1
<p>Antioxidant activity of UD observed in different organs.</p>
Full article ">
19 pages, 2400 KiB  
Article
Green Extraction of Polyphenols from Waste Bentonite to Produce Functional Antioxidant Excipients for Cosmetic and Pharmaceutical Purposes: A Waste-to-Market Approach
by Giulia Di Prima, Elena Belfiore, Martina Migliore, Amalia Giulia Scarpaci, Giuseppe Angellotti, Ignazio Restivo, Mario Allegra, Vincenzo Arizza and Viviana De Caro
Antioxidants 2022, 11(12), 2493; https://doi.org/10.3390/antiox11122493 - 19 Dec 2022
Cited by 6 | Viewed by 2208
Abstract
In an ever-growing perspective of circular economy, the development of conscious, sustainable and environmental-friendly strategies to recycle the waste products is the key point. The scope of this work was to validate the waste bentonite from the grape processing industries as a precious [...] Read more.
In an ever-growing perspective of circular economy, the development of conscious, sustainable and environmental-friendly strategies to recycle the waste products is the key point. The scope of this work was to validate the waste bentonite from the grape processing industries as a precious matrix to extract polyphenols by applying a waste-to-market approach aimed at producing novel functional excipients. The waste bentonite was recovered after the fining process and opportunely pre-treated. Subsequently, both the freeze dried and the so-called “wet” bentonites were subjected to maceration. PEG200 and Propylene Glycol were selected as solvents due to their ability to dissolve polyphenols and their wide use in the cosmetic/pharmaceutical field. The extracts were evaluated in terms of yield, density, pH after water-dilution, total phenolic (Folin–Ciocalteu) and protein (Bradford) contents, antioxidant power (DPPH), amount of some representative polyphenols (HPLC-DAD), cytocompatibility and stability. Both solvents validated the bentonite as a valuable source of polyphenols and led to colored fluids characterized by an acidic pH after water-dilution. The best extract was obtained from the wet bentonite with PEG200 and highlighted the highest phenolic content and consequently the strongest antioxidant activity. Additionally, it displayed proliferative properties and resulted almost stable over time. Hence, it might be directly used as polyphenols-enriched functional novel raw material for cosmetic and pharmaceutics purposes. Full article
Show Figures

Graphical abstract

Graphical abstract
Full article ">Figure 1
<p>(<b>A</b>) Residual DPPH (%) as a function of incubation time when evaluating the GW (black—solid symbol), GD (black—open symbol), PW (red—solid symbol) and PD (red—open symbol) extracts. (<b>B</b>) Data in the semi-logarithmic scale and linear curve fitting (linearity range: 20–60 min) (<span class="html-italic">n</span> = 9).</p>
Full article ">Figure 2
<p>Concentration (μg mL<sup>−1</sup>) ± SE of: Resveratrol (RSV—black), Gallic Acid (GA—red) and Quercetin (QRC—blue) detected in each extract by HPLC-DAD analyses (<span class="html-italic">n</span> = 9).</p>
Full article ">Figure 3
<p>Chromatograms at (<b>A</b>) 271 nm; (<b>B</b>) 305 nm and (<b>C</b>) 370 nm of the PW extract (as a representative sample) employed to evaluate the amount of gallic acid, resveratrol and quercetin respectively. The recorded UV-Vis spectra of the quantified polyphenols are also reported.</p>
Full article ">Figure 4
<p>Folin–Ciocalteu data (blue) and Bradford assay results (orange) for all the extracts reported in terms of equivalent mg ± SE of gallic acid and bovine serum albumin used respectively as standard molecules per 1 g of extract (<span class="html-italic">n</span> = 9).</p>
Full article ">Figure 5
<p>Cell viability assay on BALB/3-T3 cells. Cells were treated for 24 h in the absence (control) or the presence of (<b>A</b>) PEG200 and PEG-based extracts, (<b>B</b>) Propylene Glycol and Glycol-based extracts at different concentrations (2.5–20 µL/mL). Values are means ±SD of three separate experiments conducted in triplicate. With respect to control, * <span class="html-italic">p</span> &lt; 0.05; ** <span class="html-italic">p</span> &lt; 0.01; *** <span class="html-italic">p</span> &lt; 0.001 (ANOVA associated with Tukey’s test).</p>
Full article ">Figure 6
<p>Stability evaluation by comparation of the quantitative analyses conducted on the freshly prepared extract and 6-months-old extracts: (<b>A</b>) HPLC-DAD data reported as concentration (μg mL<sup>−1</sup>) ± SE of RSV, QRC and GA; (<b>B</b>) Folin–Ciocalteu data reported as equivalent mg ± SE of gallic acid per 1 g of extract; (<b>C</b>) Bradford assay results reported as equivalent mg ± SE of BSA per 1 g of extract (<span class="html-italic">n</span> = 6).</p>
Full article ">
31 pages, 3281 KiB  
Review
Antioxidant Activities of Natural Polysaccharides and Their Derivatives for Biomedical and Medicinal Applications
by Lu Bai, Dong Xu, Yan-Ming Zhou, Yong-Bo Zhang, Han Zhang, Yi-Bing Chen and Yuan-Lu Cui
Antioxidants 2022, 11(12), 2491; https://doi.org/10.3390/antiox11122491 - 19 Dec 2022
Cited by 47 | Viewed by 5342
Abstract
Many chronic diseases such as Alzheimer’s disease, diabetes, and cardiovascular diseases are closely related to in vivo oxidative stress caused by excessive reactive oxygen species (ROS). Natural polysaccharides, as a kind of biomacromolecule with good biocompatibility, have been widely used in biomedical and [...] Read more.
Many chronic diseases such as Alzheimer’s disease, diabetes, and cardiovascular diseases are closely related to in vivo oxidative stress caused by excessive reactive oxygen species (ROS). Natural polysaccharides, as a kind of biomacromolecule with good biocompatibility, have been widely used in biomedical and medicinal applications due to their superior antioxidant properties. In this review, scientometric analysis of the highly cited papers in the Web of Science (WOS) database finds that antioxidant activity is the most widely studied and popular among pharmacological effects of natural polysaccharides. The antioxidant mechanisms of natural polysaccharides mainly contain the regulation of signal transduction pathways, the activation of enzymes, and the scavenging of free radicals. We continuously discuss the antioxidant activities of natural polysaccharides and their derivatives. At the same time, we summarize their applications in the field of pharmaceutics/drug delivery, tissue engineering, and antimicrobial food additives/packaging materials. Overall, this review provides up-to-date information for the further development and application of natural polysaccharides with antioxidant activities. Full article
(This article belongs to the Collection Advances in Antioxidant Ingredients from Natural Products)
Show Figures

Figure 1

Figure 1
<p>Scientometric analysis of polysaccharides. (<b>A</b>) Search results with polysaccharides as the topic word; (<b>B</b>) Search results with polysaccharides and antioxidant. (<b>C</b>) Frequency of keywords. (<b>D</b>) Keywords co-occurrence network. Node size and color represent the number of keywords and clusters. Lines of different colors represent different clusters.</p>
Full article ">Figure 2
<p>An overview of natural antioxidant polysaccharides. (<b>A</b>) The four types of polysaccharide sources; (<b>B</b>) the antioxidant mechanism of polysaccharides and their derivatives; (<b>C</b>) the therapeutic effects of natural polysaccharides on ROS-induced diseases.</p>
Full article ">Figure 3
<p>Sources and main monosaccharides of representative natural polysaccharides.</p>
Full article ">Figure 4
<p>Several common modification methods and schematic diagrams of natural polysaccharides. (<b>A</b>) Sulfation modification with CSA; (<b>B</b>) Phosphorylation modification with phosphoric acid; (<b>C</b>) Carboxymethylation modification with monochloroacetic acid.</p>
Full article ">Figure 5
<p>The application of natural polysaccharides in pharmaceutics or drug delivery.</p>
Full article ">
17 pages, 2294 KiB  
Review
Applications of Antioxidants in Dental Procedures
by Fan Qi, Haofei Huang, Ming Wang, Weifeng Rong and Jing Wang
Antioxidants 2022, 11(12), 2492; https://doi.org/10.3390/antiox11122492 - 18 Dec 2022
Cited by 14 | Viewed by 3765
Abstract
As people are paying more and more attention to dental health, various dental treatment procedures have emerged, such as tooth bleaching, dental implants, and dental restorations. However, a large number of free radicals are typically produced during the dental procedures. When the imbalance [...] Read more.
As people are paying more and more attention to dental health, various dental treatment procedures have emerged, such as tooth bleaching, dental implants, and dental restorations. However, a large number of free radicals are typically produced during the dental procedures. When the imbalance in distribution of reactive oxygen species (ROS) is induced, oxidative stress coupled with oxidative damage occurs. Oral inflammations such as those in periodontitis and pulpitis are also unavoidable. Therefore, the applications of exogenous antioxidants in oral environment have been proposed. In this article, the origin of ROS during dental procedures, the types of antioxidants, and their working mechanisms are reviewed. Additionally, antioxidants delivery in the complicated dental procedures and their feasibility for clinical applications are also covered. Finally, the importance of safety assessment of these materials and future work to take the challenge in antioxidants development are proposed for perspective. Full article
(This article belongs to the Special Issue Applications of Antioxidant Nanoparticles)
Show Figures

Graphical abstract

Graphical abstract
Full article ">Figure 1
<p>Sources of ROS production in dental procedures.</p>
Full article ">Figure 2
<p>Schematic diagram of ROS production and clearance during dental procedures.</p>
Full article ">Figure 3
<p>Antioxidants for the treatment of periodontitis during dental implants.</p>
Full article ">Figure 4
<p>Antioxidative mechanism of vitamin C.</p>
Full article ">Figure 5
<p>Damage to cell function by monomer HEMA released by resin restorations.</p>
Full article ">
16 pages, 2407 KiB  
Article
Catechin Bioavailability Following Consumption of a Green Tea Extract Confection Is Reduced in Obese Persons without Affecting Gut Microbial-Derived Valerolactones
by Geoffrey Y. Sasaki, Yael Vodovotz, Zhongtang Yu and Richard S. Bruno
Antioxidants 2022, 11(12), 2490; https://doi.org/10.3390/antiox11122490 - 18 Dec 2022
Cited by 5 | Viewed by 3533
Abstract
Obesity-related cardiometabolic disorders are driven by inflammation, oxidative stress, and gut dysbiosis. Green tea catechins protect against cardiometabolic disorders by anti-inflammatory, antioxidant, and prebiotic activities. However, whether obesity alters catechin bioavailability remains unknown. We hypothesized that obesity would decrease catechin bioavailability due to [...] Read more.
Obesity-related cardiometabolic disorders are driven by inflammation, oxidative stress, and gut dysbiosis. Green tea catechins protect against cardiometabolic disorders by anti-inflammatory, antioxidant, and prebiotic activities. However, whether obesity alters catechin bioavailability remains unknown. We hypothesized that obesity would decrease catechin bioavailability due to altered gut microbiota composition. Obese and healthy persons completed a pharmacokinetics trial in which a confection formulated with green tea extract (GTE; 58% epigallocatechin gallate, 17% epigallocatechin, 8% epicatechin, 6% epicatechin gallate) was ingested before collecting plasma and urine at timed intervals for up to 24 h. Stool samples were collected prior to confection ingestion. Catechins and γ-valerolactones were assessed by LC-MS. Obesity reduced plasma area under the curve (AUC0-12h) by 24–27% and maximum plasma concentrations by 18–36% for all catechins. Plasma AUC0-12h for 5′-(3′,4′-dihydroxyphenyl)-γ-valerolactone and 5′-(3′,4′,5′-trihydroxyphenyl)-γ-valerolactone, as well as total urinary elimination of all catechins and valerolactones, were unaffected. ⍺-Diversity in obese persons was lower, while Slackia was the only catechin-metabolizing bacteria that was altered by obesity. Ascorbic acid and diversity metrics were correlated with catechin/valerolactone bioavailability. These findings indicate that obesity reduces catechin bioavailability without affecting valerolactone generation, urinary catechin elimination, or substantially altered gut microbiota populations, suggesting a gut-level mechanism that limits catechin absorption. Full article
(This article belongs to the Special Issue Oxidative Stress in Obesity-II)
Show Figures

Figure 1

Figure 1
<p>Plasma concentrations (means ± SEM) of (<b>A</b>) EGCG, (<b>B</b>) EGC, (<b>C</b>) EC, and (<b>D</b>) ECG in lean and obese persons (<span class="html-italic">n</span> = 17–19 per group) after oral ingestion of a GTE-rich confection containing 290 mg EGCG, 87 mg EGC, 39 mg EC, and 28 mg ECG. Abbreviations: EC, epicatechin; ECG, epicatechin gallate; EGC, epigallocatechin; EGCG, epigallocatechin gallate.</p>
Full article ">Figure 2
<p>Plasma concentrations (means ± SEM <span class="html-italic">n</span> = 17–19 per group) of (<b>A</b>) 3,4-VL and (<b>B</b>) 3,4,5-VL in lean and obese persons after oral ingestion of a GTE-rich confection containing 290 mg EGCG, 87 mg EGC, 39 mg EC, and 28 mg ECG. Abbreviations: 3,4-VL, 5′-(3′,4′-dihydroxyphenyl)-γ-valerolactone; 3,4,5-VL, 5′-(3′,4′,5′-trihydroxyphenyl)-γ-valerolactone; EC, epicatechin; ECG, epicatechin gallate; EGC, epigallocatechin; EGCG, epigallocatechin gallate.</p>
Full article ">Figure 3
<p>α- and β-Diversity measures of gut microbiota in obese and lean persons. (<b>A</b>) Principal coordinate analysis of Bray–Curtis dissimilarity of gut microbiota, (<b>B</b>) Chao1 richness estimate, and (<b>C</b>) Shannon index of obese (<span class="html-italic">n</span> = 13) and lean (<span class="html-italic">n</span> = 16) persons prior to the pharmacokinetics trial. Data were analyzed using QIIME2 (version 2019.10 obtained from <a href="http://qiime.org" target="_blank">http://qiime.org</a> accessed 30 September 2022).</p>
Full article ">Figure 4
<p>Phyla-level abundances of gut microbiota in obese and lean individuals. (<b>A</b>) Firmicutes, (<b>B</b>) Bacteroidetes, (<b>C</b>) Firmicutes:Bacteroidetes ratio, (<b>D</b>) Actinobacteria, and (<b>E</b>) Proteobacteria between obese and lean individuals. Data (means ± SEM, <span class="html-italic">n</span> = 13 to 16 per group) were analyzed using QIIME2 (version 2019.10).</p>
Full article ">Figure 5
<p>Relative abundances of family- and genus-level taxa between obese and lean individuals. Relative abundances (means ± SEM, <span class="html-italic">n</span> = 13 to 16 per group) of (<b>A</b>) <span class="html-italic">Akkermansia</span>, <span class="html-italic">Lactobacillus</span>, <span class="html-italic">Bifidobacterium</span>, and <span class="html-italic">Roseburia</span>, (<b>B</b>) <span class="html-italic">Coriobacteriaceae</span>, <span class="html-italic">Lachnospiraceae</span>, <span class="html-italic">Ruminococcaceae</span>, <span class="html-italic">Eggerthella</span>, and <span class="html-italic">Slackia</span>, and (<b>C</b>) <span class="html-italic">Bacteroides</span>, <span class="html-italic">Faecalibacterium</span>, and <span class="html-italic">Ruminococcus</span> between obese and lean individuals. <span class="html-italic">Slackia</span> was detected in too few of the participants (<span class="html-italic">n</span> ≤ 6 per group) to reliably conduct statistical analysis. Data were analyzed using QIIME2 (version 2019.10 obtained from <a href="http://qiime.org" target="_blank">http://qiime.org</a> accessed 30 September 2022).</p>
Full article ">Figure 6
<p>Correlations between (<b>A</b>) EGCG bioavailability and ascorbic acid, (<b>B</b>) 3,4-VL bioavailability and Chao1 richness, and (<b>C</b>–<b>F</b>) EGCG or 3,4-VL pharmacokinetic parameters with relative abundances of select taxa in lean and obese persons who completed a pharmacokinetic trial examining green tea catechin bioavailability. Pearson correlation coefficients were calculated by linear regression. Abbreviations: 3,4-VL, 5′-(3′,4′-dihydroxyphenyl)-γ-valerolactone; AUC0-12h, 12 h area under the concentration curve; C<sub>max</sub>, plasma maximum concentration.; EGCG, epigallocatechin gallate.</p>
Full article ">
15 pages, 1206 KiB  
Article
Does the Type Matter? Verification of Different Tea Types’ Potential in the Synthesis of SeNPs
by Aleksandra Sentkowska and Krystyna Pyrzynska
Antioxidants 2022, 11(12), 2489; https://doi.org/10.3390/antiox11122489 - 18 Dec 2022
Cited by 7 | Viewed by 1898
Abstract
Selenium nanoparticles (SeNPs) are gaining popularity due to their potential biomedical applications. This work describes their green synthesis using various types of tea. Black, green, red and white tea infusions were tested for the content of polyphenolic compounds and antioxidant properties and then [...] Read more.
Selenium nanoparticles (SeNPs) are gaining popularity due to their potential biomedical applications. This work describes their green synthesis using various types of tea. Black, green, red and white tea infusions were tested for the content of polyphenolic compounds and antioxidant properties and then used in the synthesis of SeNPs. In each of the syntheses, nanoparticles with dimensions ranging from 3.9 to 12.5 nm, differing in shape and properties, were obtained. All of them were characterized by a very high ability to neutralize hydroxyl radicals, which was about three-times higher than for the tea infusions from which they were obtained. The main inconvenience in obtaining SeNPs was the difficulties with their purification, which should be a further stage in the described research. Full article
Show Figures

Graphical abstract

Graphical abstract
Full article ">Figure 1
<p>The UV-Vis spectra of examined teas: black, green, red and white.</p>
Full article ">Figure 2
<p>The UV-Vis spectra of selenium particles as a function of synthesis time. The box on each graph is an approximation of the 300–500 nm region.</p>
Full article ">Figure 3
<p>SEM, TEM and TEM (HAADF STEM) of obtained selenium nanoparticles. Abbreviations: BSeNPs—nanoparticles synthesized using black tea infusions, GSeNPs—green tea, RSeNPs—red tea and WSeNPs—white tea infusion.</p>
Full article ">
16 pages, 749 KiB  
Review
Polyamine Oxidase-Generated Reactive Oxygen Species in Plant Development and Adaptation: The Polyamine Oxidase—NADPH Oxidase Nexus
by Péter Benkő, Katalin Gémes and Attila Fehér
Antioxidants 2022, 11(12), 2488; https://doi.org/10.3390/antiox11122488 - 17 Dec 2022
Cited by 22 | Viewed by 2817
Abstract
Metabolism and regulation of cellular polyamine levels are crucial for living cells to maintain their homeostasis and function. Polyamine oxidases (PAOs) terminally catabolize polyamines or catalyse the back-conversion reactions when spermine is converted to spermidine and Spd to putrescine. Hydrogen peroxide (H2 [...] Read more.
Metabolism and regulation of cellular polyamine levels are crucial for living cells to maintain their homeostasis and function. Polyamine oxidases (PAOs) terminally catabolize polyamines or catalyse the back-conversion reactions when spermine is converted to spermidine and Spd to putrescine. Hydrogen peroxide (H2O2) is a by-product of both the catabolic and back-conversion processes. Pharmacological and genetic approaches have started to uncover the roles of PAO-generated H2O2 in various plant developmental and adaptation processes such as cell differentiation, senescence, programmed cell death, and abiotic and biotic stress responses. Many of these studies have revealed that the superoxide-generating Respiratory Burst Oxidase Homolog (RBOH) NADPH oxidases control the same processes either upstream or downstream of PAO action. Therefore, it is reasonable to suppose that the two enzymes co-ordinately control the cellular homeostasis of reactive oxygen species. The intricate relationship between PAOs and RBOHs is also discussed, posing the hypothesis that these enzymes indirectly control each other’s abundance/function via H2O2. Full article
Show Figures

Figure 1

Figure 1
<p>An outline of the pathways of how polyamine oxidase (PAO) and NADPH oxidase (RBOH) enzymes may influence each other’s activity. Both enzymes contribute to H<sub>2</sub>O<sub>2</sub> generation. H<sub>2</sub>O<sub>2</sub> may activate MAPK signalling, thereby leading to altered expression of the genes for any or both enzymes. The changes in gene expressions can either be positive or negative, depending on the context (see the text for examples). H<sub>2</sub>O<sub>2</sub> can also activate genes involved in polyamine biosynthesis, and polyamines can serve as PAO substrates generating H<sub>2</sub>O<sub>2</sub> or as H<sub>2</sub>O<sub>2</sub> scavengers. H<sub>2</sub>O<sub>2</sub> can also open Ca<sup>2+</sup> channels, and the increased intracellular Ca<sup>2+</sup> level augments the activity of the RBOH. Note that the various interactions are context-dependent, and several other ways of more indirect interactions may exist between the enzymes (e.g., via the activation of ROS-detoxifying mechanisms). PAO—polyamine oxidase; PAs—polyamines; MAPK—mitogen-activated protein kinase; RBOH—respiratory burst oxidase homolog (NADPH oxidase). The pointed arrows indicate the activation the round-pointed ones the inactivation.</p>
Full article ">
26 pages, 3515 KiB  
Review
Generation and Physiology of Hydrogen Sulfide and Reactive Sulfur Species in Bacteria
by Sirui Han, Yingxi Li and Haichun Gao
Antioxidants 2022, 11(12), 2487; https://doi.org/10.3390/antiox11122487 - 17 Dec 2022
Cited by 11 | Viewed by 4601
Abstract
Sulfur is not only one of the most abundant elements on the Earth, but it is also essential to all living organisms. As life likely began and evolved in a hydrogen sulfide (H2S)-rich environment, sulfur metabolism represents an early form of [...] Read more.
Sulfur is not only one of the most abundant elements on the Earth, but it is also essential to all living organisms. As life likely began and evolved in a hydrogen sulfide (H2S)-rich environment, sulfur metabolism represents an early form of energy generation via various reactions in prokaryotes and has driven the sulfur biogeochemical cycle since. It has long been known that H2S is toxic to cells at high concentrations, but now this gaseous molecule, at the physiological level, is recognized as a signaling molecule and a regulator of critical biological processes. Recently, many metabolites of H2S, collectively called reactive sulfur species (RSS), have been gradually appreciated as having similar or divergent regulatory roles compared with H2S in living organisms, especially mammals. In prokaryotes, even in bacteria, investigations into generation and physiology of RSS remain preliminary and an understanding of the relevant biological processes is still in its infancy. Despite this, recent and exciting advances in the fields are many. Here, we discuss abiotic and biotic generation of H2S/RSS, sulfur-transforming enzymes and their functioning mechanisms, and their physiological roles as well as the sensing and regulation of H2S/RSS. Full article
(This article belongs to the Special Issue Reactive Sulfur Species in Microorganisms)
Show Figures

Figure 1

Figure 1
<p>Structures of some RSS chemotypes in different views. The red (−2), yellow (−1), gray (0), purple (+1), green (+4), light blue (+5) and dark blue (+6) rectangles are used to designate the valence states of sulfur, as specified.</p>
Full article ">Figure 2
<p>Pathways for bacterial sulfur metabolism in the cytoplasm. H<sub>2</sub>S biogenesis through amino acid metabolism: generation of H<sub>2</sub>S from homocys can be catalyzed by cystathionine β-synthase (CBS) and cystathionine γ-lyase (CSE). Cys aminotransferase (CAT) catalyzes the formation of 3-mercaptopyruvate (3-MP) from cys, and then, mercaptopyruvate sulfurtransferase (MST) converts 3-MP to H<sub>2</sub>S. H<sub>2</sub>S biogenesis occurs through assimilatory sulfate reduction (ASR) and dissimilatory sulfate reduction (DSR) of inorganic sulfur species; the latter only occurs in sulfate-reducing bacteria (SRB), catalyzing SO<sub>3</sub><sup>2−</sup> to HS<sup>−</sup> through dissimilatory sulfite reductase (Dsr). For ASR pathway, SO<sub>4</sub><sup>2−</sup>, which imported from ATP-dependent transporter CysUWA, is catalyzed and converted to HS<sup>−</sup> by a series of enzymes, including Sat, CysC, CysH, and CysIJ. S<sub>2</sub>O<sub>3</sub><sup>2−</sup> can also be reduced and used to synthesize cys by CysM and NrdH/Grx1. H<sub>2</sub>S catabolism: H<sub>2</sub>S binds to sulfur quinone oxidoreductase (SQR), and goes through a series of sequential reactions, including oxidation of sulfide to polysulfide by membrane-bound SQR, formation of GSSH from reaction involving with rhodanese (Rhd), oxidation of the sulfane sulfur in GSSH to SO<sub>3</sub><sup>2−</sup> catalyzed by persulfide dioxygenase (PDO), formation of S<sub>2</sub>O<sub>3</sub><sup>2−</sup> from spontaneous reaction between polysulfide and SO<sub>3</sub><sup>2−</sup>, and formation of SO<sub>4</sub><sup>2−</sup> either spontaneously or catalyzed by various enzymes, transferring two electrons via quinone into the electron transport chain.</p>
Full article ">Figure 3
<p>Structure of representative enzymes involved in transformation of sulfur compounds in bacteria. (<b>A</b>) Overall structure of the Dsr A2B2 heterotetramer of <span class="html-italic">Desulfovibrio vulgaris</span> (PDB ID: 2V4J), green; <span class="html-italic">Archaeoglobus fulgidus</span> (PDB ID: 3MM5), yellow; <span class="html-italic">Desulfovibrio gigas</span> (PDB ID: 3OR1), pink; and <span class="html-italic">Desulfoicrobrium norvegicum</span> (PDB ID: 2XSJ), blue. Heme ligands are shown in ball-stick model. (<b>B</b>) Structure of TsdA of <span class="html-italic">Marichromatium purpuratum</span> (PDB ID: 5LO9; violet) and of <span class="html-italic">Allochromatium vinosum</span> (PDB ID: 4WQ7; orange). Heme ligands are shown in ball-stick model. Expanded regions show the ligands to hemes in active centers. (<b>C</b>) TsdA of <span class="html-italic">Campylobacter jejuni</span> (orange, prepared from AlaphaFold database [<a href="#B90-antioxidants-11-02487" class="html-bibr">90</a>,<a href="#B91-antioxidants-11-02487" class="html-bibr">91</a>]) is aligned and superimposed onto TsdAB of <span class="html-italic">M. purpuratum</span> (PDB ID: 5LO9), which are in violet and yellow, respectively. Heme ligands are shown in ball-stick model. Expanded region shows the ligands to heme 2. (<b>D</b>) Structure of the SoxXA (PDB ID: 2C1D) (left) and SoxYZ-B (PDB ID: 4UWQ) (right) complexes. Heme ligands are shown in ball-stick model. Expanded region shows the active site positioning at the substrate channel of SoxB.</p>
Full article ">Figure 4
<p>Pathways for bacterial sulfur transformation in the periplasm. Oxidation of S<sup>2−</sup> and S<sup>0</sup>: Flavocyt <span class="html-italic">c</span> sulfide dehydrogenases (FCSDs) can oxidize H<sub>2</sub>S to the final product polysulfide. In dissimilatory sulfur-oxidizing bacteria, Rhds and PDOs are located in the periplasm, and the oxidation of H<sub>2</sub>S is catalyzed by SQRs, which consistently expose the reaction to the periplasm space. Oxidation of S<sup>0</sup> and S<sup>2+</sup>: Unconjugated SoxYZ is catalyzed by SoxAX with S<sub>2</sub>O<sub>3</sub><sup>2−</sup>, generating SoxYZ-S-S-SO<sub>3</sub><sup>−</sup>, which is subsequently converted to SoxYZ-S-S<sup>−</sup>, releasing one molecular of SO<sub>4</sub><sup>2−</sup> under the catalysis of SoxB. Reduction of S<sup>2+</sup>: TtrABC and TsdAB are responsible for interconversion of S<sub>4</sub>O<sub>6</sub><sup>2−</sup> and S<sub>2</sub>O<sub>3</sub><sup>2−</sup>. Reduction of S<sup>0</sup>: PhsABC and PsrABC are supposed to participate in the reduction of S<sup>0</sup> (S<sub>n</sub><sup>2−</sup>) and S<sup>0</sup> (S<sub>2</sub>O<sub>3</sub><sup>2−</sup>) to HS<sup>−</sup>.</p>
Full article ">Figure 5
<p>Physiological impacts of hydrogen sulfide. (<b>A</b>) H<sub>2</sub>S in oxidative stress. Upon oxidative stress, macromolecules such as DNA and proteins are damaged primarily by <sup>•</sup>OH, which is generated from the interaction of Fe<sup>2+</sup> and H<sub>2</sub>O<sub>2</sub>. H<sub>2</sub>S is a strong inhibitor of hemoproteins, catalase (CAT) in particular. With CAT inhibited, cells are unable to promptly decompose H<sub>2</sub>O<sub>2</sub>, leading to increased sensitivity to H<sub>2</sub>O<sub>2</sub> killing. However, the prolonged presence of H<sub>2</sub>O<sub>2</sub> activates OxyR, the master regulator in response to oxidative stress, which in turn induces expression of genes under its control, including CAT. As a result, cells gain an increased resistance against H<sub>2</sub>O<sub>2</sub>. In addition, it has been suggested that H<sub>2</sub>S from endogenous and exogenous sources may offer protection against oxidative stress by sequestering free Fe<sup>2+</sup> intracellularly. (<b>B</b>) H<sub>2</sub>S in metal reduction. Microbial reduction of SO<sub>4</sub><sup>2−</sup> and elemental S<sup>0</sup> to S<sup>2−</sup>, which catalyzes abiotic reduction of Fe<sup>3+</sup> of Fe(III)oxide and forms FeS with the resulting Fe<sup>2+</sup>.</p>
Full article ">Figure 6
<p>Structures and responding mechanism of CstR to RSS. Left, CstR (PDB ID: 7MQ2), which exists as homotetramer. Right, SqrR (PDB: 6O8N), which exists as homodimer. Expanded regions show the mechanism of activation. Both regulators use multiple cys thiols for sensing RSS by forming di-, tri-, and tetra-sulfide bonds.</p>
Full article ">
8 pages, 1504 KiB  
Article
Hyperoxidized Peroxiredoxin 2 Is a Possible Biomarker for the Diagnosis of Obstructive Sleep Apnea
by Shin Koike, Haruka Sudo, Satori Turudome, Masako Ueyama, Yoshiaki Tanaka, Hiroshi Kimura, Yo-Ichi Ishida and Yuki Ogasawara
Antioxidants 2022, 11(12), 2486; https://doi.org/10.3390/antiox11122486 - 17 Dec 2022
Cited by 5 | Viewed by 1847
Abstract
Peroxiredoxin (Prx) 2 in red blood cells (RBCs) reacts with various reactive oxygen species and changes to hyperoxidized Prx2 (Prx2-SO2/3). Therefore, Prx2 may serve as an indicator of oxidative stress in vivo. This study aimed to analyze Prx2-SO2/3 levels in [...] Read more.
Peroxiredoxin (Prx) 2 in red blood cells (RBCs) reacts with various reactive oxygen species and changes to hyperoxidized Prx2 (Prx2-SO2/3). Therefore, Prx2 may serve as an indicator of oxidative stress in vivo. This study aimed to analyze Prx2-SO2/3 levels in clinical samples to examine whether the oxidation state of Prx2 in human RBCs reflects the pathological condition of oxidative stress diseases. We first focused on obstructive sleep apnea (OSA), a hypoxic stress-induced disease of the respiratory system, and investigated the levels of Prx2-SO2/3 accumulated in the RBCs of OSA patients. In measurements on a small number of OSA patients and healthy subjects, levels of Prx2-SO2/3 accumulation in patients with OSA were clearly increased compared to those in healthy subjects. Hence, we proceeded to validate these findings with more samples collected from patients with OSA. The results revealed significantly higher levels of erythrocytic Prx2-SO2/3 in patients with OSA than in healthy subjects, as well as a positive correlation between the severity of OSA and Prx2-SO2/3 levels in the RBCs. Moreover, we performed a chromatographic study to show the structural changes of Prx2 due to hyperoxidation. Our findings demonstrated that the Prx2-SO2/3 molecules in RBCs from patients with OSA were considerably more hydrophilic than the reduced form of Prx2. These results implicate Prx2-SO2/3 as a promising candidate biomarker for OSA. Full article
Show Figures

Figure 1

Figure 1
<p>Hyperoxidation of Prx2 in RBC from OSA patients. (<b>A</b>): Samples were prepared as described in the Materials and Methods section. Each hemolysate from six patients with OSA (right side; lanes 1, 2: mild; lanes 3, 4: moderate; lanes 5, 6: severe) or six healthy subjects (left side; lanes 1–6) were analyzed by Western blotting with anti-Prx-SO<sub>2/3</sub> antibody (upper image) or anti-Prx2 antibody (lower image) followed with 12.5% SDS-PAGE. (<b>B</b>): The density of the Prx2-SO<sub>2/3</sub> bands was measured and normalized to the density of Prx2. The band intensity of the patient group (<span class="html-italic">n</span> = 6) was expressed as a fold-change relative to the control group (<span class="html-italic">n</span> = 6). *** <span class="html-italic">p</span> &lt; 0.001 versus control group.</p>
Full article ">Figure 2
<p>Beeswarm plots for band intensities (Prx2-SO<sub>2/3</sub>/Prx2) of healthy subjects and OSA patients. The densities of Prx2-SO<sub>2/3</sub> bands were measured and normalized to that of Prx2. The band intensity of patients with OSA (<span class="html-italic">n</span> = 32) and healthy control subjects (<span class="html-italic">n</span> = 32) was expressed as the normalized ratio of density (Prx2-SO<sub>2/3</sub>/Prx2). *** <span class="html-italic">p</span> &lt; 0.001 versus control group.</p>
Full article ">Figure 3
<p>Correlation between the band intensities of Prx2-SO<sub>2/3</sub> and AHI, age, and BMI corresponding to each patient with OSA. The band intensity of patients with OSA (<span class="html-italic">n</span> = 32) was expressed as the normalized ratio of density (Prx2-SO<sub>2/3</sub>/Prx2). AHI was measured using a polysomnography test. BMI was calculated using a person’s height and weight (kg/m<sup>2</sup>). (<b>A</b>): correlation between band intensity and AHI; (<b>B</b>): correlation between band intensity and age; (<b>C</b>): correlation between band intensity and BMI.</p>
Full article ">Figure 4
<p>Chromatographic analysis of Prx2 oxidation in RBC lysates from a healthy subject and a patient with OSA. The samples were prepared as described in the Materials and Methods section. Each representative result from the OSA patient group (<span class="html-italic">n</span> = 3) and control group (<span class="html-italic">n</span> = 3), respectively, was shown. Chromatograms of RBC lysates from a healthy control (<b>A</b>) and a patient with OSA (<b>B</b>). Proteins in the 16 fractions (29–45 min) were collected and concentrated. Each dried sample was resolved in SDS buffer and subjected to 5–20% SDS-PAGE, followed by Western blotting with anti-Prx2 antibody (upper image). The same PVDF membranes were stripped and re-probed with anti-Prx2-SO<sub>2/3</sub> antibody (lower image).</p>
Full article ">
26 pages, 2172 KiB  
Article
Ellagic Acid Triggers the Necrosis of Differentiated Human Enterocytes Exposed to 3-Nitro-Tyrosine: An MS-Based Proteomic Study
by Silvia Díaz-Velasco, Josué Delgado, Fernando J. Peña and Mario Estévez
Antioxidants 2022, 11(12), 2485; https://doi.org/10.3390/antiox11122485 - 17 Dec 2022
Cited by 1 | Viewed by 1728
Abstract
To study the molecular basis of the toxicological effect of a dietary nitrosated amino acid, namely, 3-nitrotyrosine (3-NT), differentiated human enterocytes were exposed to dietary concentrations of this species (200 μM) and analyzed for flow cytometry, protein oxidation markers and MS-based proteomics. The [...] Read more.
To study the molecular basis of the toxicological effect of a dietary nitrosated amino acid, namely, 3-nitrotyrosine (3-NT), differentiated human enterocytes were exposed to dietary concentrations of this species (200 μM) and analyzed for flow cytometry, protein oxidation markers and MS-based proteomics. The possible protective role of a dietary phytochemical, ellagic acid (EA) (200 μM), was also tested. The results revealed that cell viability was significantly affected by exposure to 3-NT, with a concomitant significant increase in necrosis (p < 0.05). 3-NT affected several biological processes, such as histocompatibility complex class II (MHC class II), and pathways related to type 3 metabotropic glutamate receptors binding. Addition of EA to 3-NT-treated cells stimulated the toxicological effects of the latter by reducing the abundance of proteins involved in mitochondrial conformation. These results emphasize the impact of dietary nitrosated amino acids in intestinal cell physiology and warn about the potential negative effects of ellagic acid when combined with noxious metabolites. Full article
Show Figures

Graphical abstract

Graphical abstract
Full article ">Figure 1
<p>Percentages of live cells (Hoechst +), apoptotic cells (Caspase 3+) and necrotic cells (Ethidium homodimer +) on human enterocytes as affected by exposure to 200 μM 3-NT for 72 h compared to control counterparts (<b>A</b>). Relative fluorescence units (r.f.u.) of ROS occurrence (Cell Rox +) on human enterocytes as affected by exposure to 200 μM 3-NT for 72 h compared to control counterparts (<b>B</b>). Percentages of live cells (Hoechst +), apoptotic cells (Caspase 3+) and necrotic cells (Ethidium homodimer +) on differentiated human enterocytes as affected by exposure to 200 μM 3-NT+ 200 μM EA for 72 h compared to 200 μM 3-NT treated cells (<b>C</b>). Relative fluorescence units (r.f.u.) of ROS occurrence (Cell Rox +) on human enterocytes as affected by exposure to 200 μM 3-NT+ 200 μM EA for 72 h compared to control counterparts (<b>D</b>). Percentages of live cells (Hoechst +) (<b>E</b>), relative fluorescence units (r.f.u.) of ROS occurrence (Cell Rox +) (F) and relative fluorescence units (r.f.u.) of apoptotic events (Caspase 3+) (<b>G</b>) on human enterocytes as affected by exposure to 200 μM EA for 72 h compared to control counterparts. Results are expressed as means ± standard deviations. Asterisk on top of bars denote significant differences (* <span class="html-italic">p</span> &lt; 0.05; ** <span class="html-italic">p</span> &lt; 0.01) between paired group of samples (control vs. 3-NT; 3-NT vs. 3-NT). Ns: no significant differences.</p>
Full article ">Figure 2
<p>Protein carbonyls (nmol/mg protein of α-AS and γ-GS) (black bars) and advanced oxidation protein products (Pentosidine; fluorescence intensity) (grey bars) on differentiated human enterocytes upon exposure to 200 μM 3-NT and 200 μM 3-NT+200 μM EA for 72 h. Asterisks on top of bars denote significant differences between group of samples in ANOVA (*** <span class="html-italic">p</span> &lt; 0.001). (a–c) Different letters on top of bars denote significant differences between means in post-hoc Tukey tests (<span class="html-italic">p</span> &lt; 0.05).</p>
Full article ">Figure 3
<p>Antioxidant activity of catalase (black bars) and superoxide dismutase (grey bars) on differentiated human enterocytes upon exposure to 200 μM 3-NT and 200 μM 3-NT+200 μM EA for 72 h. Asterisks on top of bars denote significant differences between group of samples in ANOVA (* <span class="html-italic">p</span>&lt;0.05; *** <span class="html-italic">p</span> &lt; 0.001).(a–b) Different letters on top of bars denote significant differences between means in post-hoc Tukey tests (<span class="html-italic">p</span> &lt; 0.05).</p>
Full article ">Figure 4
<p>Proposal of underlying molecular mechanisms of the toxicological effects of 200 μM 3-NT and 200 μM 3-NT+200 μM EA for 72 h on differentiated human enterocytes. Upstream head blue arrows indicate higher concentration of proteins/upregulated biological processes in treated enterocytes. Downstream head red arrows indicate lower concentration of proteins/downregulated biological processes in treated enterocytes. Blunt head connectors indicate an inhibited biological process or metabolic pathway. Effect of EA is specifically denoted by green arrows. (For interpretation of the references to colour in this figure legend, the reader is referred to the web version of this article). The mechanisms and routes depicted in this Figure are proposed based on the interpretation of the data from cytometry, proteomics and accretion of protein oxidation (oxidative stress). Confirmation of the impairment of all these downstream paths and interconnections of complex cellular mechanisms requires further specific studies.</p>
Full article ">
17 pages, 3896 KiB  
Article
Complex Interplay between Autophagy and Oxidative Stress in the Development of Endometriosis
by Ramona D’Amico, Daniela Impellizzeri, Marika Cordaro, Rosalba Siracusa, Livia Interdonato, Ylenia Marino, Rosalia Crupi, Enrico Gugliandolo, Francesco Macrì, Davide Di Paola, Alessio Filippo Peritore, Roberta Fusco, Salvatore Cuzzocrea and Rosanna Di Paola
Antioxidants 2022, 11(12), 2484; https://doi.org/10.3390/antiox11122484 - 17 Dec 2022
Cited by 13 | Viewed by 2463
Abstract
Endometriosis (Endo) is a chronic gynecological disease. This paper aimed to evaluate the modulation of autophagy, oxidative stress and apoptosis with Açai Berries in a rat model of endometriosis. Endometriosis was induced with an intraperitoneal injection of minced uterus tissue from a donor [...] Read more.
Endometriosis (Endo) is a chronic gynecological disease. This paper aimed to evaluate the modulation of autophagy, oxidative stress and apoptosis with Açai Berries in a rat model of endometriosis. Endometriosis was induced with an intraperitoneal injection of minced uterus tissue from a donor rat into a recipient one. The abdominal high-frequency ultrasound (hfUS) analysis was performed at 7 and 14 days from the endometriosis induction to evaluate the growth of the lesion during the experiment. Seven days from the induction, once the lesions were implanted, an Açai Berry was administered daily by gavage for the next seven days. At the end of the experiment, the hfUS analysis showed a reduced lesion diameter in animals given the Açai Berry. A macroscopical and histological analysis confirmed this result. From the molecular point of view, Western blot analyses were conducted to evaluate the autophagy induction. Samples collected from the Endo group showed impaired autophagy, while the Açai Berry administration inhibited PI3K and AKT and ERK1/2 phosphorylation and promoted autophagy by inactivating mTOR. Additionally, Açai Berry administration dephosphorylated ATG1, promoting the activity of the ATG1/ULK1 complex that recruited Ambra1/Beclin1 and Atg9 to promote autophagosome nucleation and LC3II expression. Açai Berry administration also restored mitophagy, which increased Parkin cytosolic expression. The Açai Berry increased the expression of NRF2 in the nucleus and the expression of its downstream antioxidant proteins as NQO-1 and HO-1, thereby restoring the oxidative imbalance. It also restored the impaired apoptotic pathway by reducing BCL-2 and increasing BAX expression. This result was also confirmed by the TUNEL assay. Overall, our results displayed that Açai Berry administration was able to modulate autophagy, oxidative stress and apoptosis during endometriosis. Full article
Show Figures

Figure 1

Figure 1
<p>Analysis of endometriotic-like lesions development: High-frequency ultrasound analysis (hfUS) at 7 days from the endometriosis induction: Endo (<b>A</b>), Endo + Açai Berry (<b>B</b>), lesion diameter (<b>C</b>) and lesion number (<b>D</b>). hfUS analysis at 14 days from the endometriosis induction: Endo (<b>E</b>), Endo + Açai Berry (<b>F</b>), lesion diameter (<b>G</b>) and lesion number (<b>H</b>). A <span class="html-italic">p</span>-value of less than 0.05 was considered significant. *** <span class="html-italic">p</span> &lt; 0.001 vs. Endo.</p>
Full article ">Figure 1 Cont.
<p>Analysis of endometriotic-like lesions development: High-frequency ultrasound analysis (hfUS) at 7 days from the endometriosis induction: Endo (<b>A</b>), Endo + Açai Berry (<b>B</b>), lesion diameter (<b>C</b>) and lesion number (<b>D</b>). hfUS analysis at 14 days from the endometriosis induction: Endo (<b>E</b>), Endo + Açai Berry (<b>F</b>), lesion diameter (<b>G</b>) and lesion number (<b>H</b>). A <span class="html-italic">p</span>-value of less than 0.05 was considered significant. *** <span class="html-italic">p</span> &lt; 0.001 vs. Endo.</p>
Full article ">Figure 2
<p>Analysis of Açai Berry administration on macroscopical and histological analysis: Macroscopic analysis: Endo (<b>A</b>), Endo + Açai Berry (<b>B</b>), lesion area (<b>C</b>) and lesion volume (<b>D</b>). Histological analysis: Endo (<b>E</b>), Endo + Açai Berry (<b>F</b>) and histopathologic score (<b>G</b>). A <span class="html-italic">p</span>-value of less than 0.05 was considered significant. ** <span class="html-italic">p</span> &lt; 0.01 vs. Endo, *** <span class="html-italic">p</span> &lt; 0.001 vs. Endo.</p>
Full article ">Figure 2 Cont.
<p>Analysis of Açai Berry administration on macroscopical and histological analysis: Macroscopic analysis: Endo (<b>A</b>), Endo + Açai Berry (<b>B</b>), lesion area (<b>C</b>) and lesion volume (<b>D</b>). Histological analysis: Endo (<b>E</b>), Endo + Açai Berry (<b>F</b>) and histopathologic score (<b>G</b>). A <span class="html-italic">p</span>-value of less than 0.05 was considered significant. ** <span class="html-italic">p</span> &lt; 0.01 vs. Endo, *** <span class="html-italic">p</span> &lt; 0.001 vs. Endo.</p>
Full article ">Figure 3
<p>Analysis of Açai Berry administration on PI3K/AKT/ERK1/2 pathways. Western blot analysis of PI3K (<b>A</b>), pAKT (<b>B</b>), p-ERK1/2 (<b>C</b>) and p-mTOR (<b>D</b>) expression. A <span class="html-italic">p</span>-value of less than 0.05 was considered significant. ** <span class="html-italic">p</span> &lt; 0.01 vs. Endo, *** <span class="html-italic">p</span> &lt; 0.001 vs. Endo.</p>
Full article ">Figure 4
<p>Analysis of Açai Berry administration on the autophagosome formation. Western blot analysis of pATG1 (<b>A</b>), AMBRA1 (<b>B</b>), BECLIN (<b>C</b>), ATG9 (<b>D</b>) and LC3II (<b>E</b>) expression. A <span class="html-italic">p</span>-value of less than 0.05 was considered significant. *** <span class="html-italic">p</span> &lt; 0.001 vs. Endo.</p>
Full article ">Figure 5
<p>Analysis of Açai Berry administration on the Pink1 and Parkin expression. Western blot analysis of PINK1 (<b>A</b>) and PARKIN (<b>B</b>) mitochondrial expression and PARKIN (<b>C</b>) cytoplasmic expression. A <span class="html-italic">p</span>-value of less than 0.05 was considered significant. ** <span class="html-italic">p</span> &lt; 0.01 vs. Endo, *** <span class="html-italic">p</span> &lt; 0.001 vs. Endo.</p>
Full article ">Figure 6
<p>Analysis of Açai Berry administration on prooxidative alterations. Western blot analysis of NRF2 (<b>A</b>) nuclear expression, HO-1 (<b>B</b>) and NQO-1 (<b>C</b>) cytosolic expression, GSH levels (<b>D</b>), SOD activity (<b>E</b>) and MDA (<b>F</b>) levels. A <span class="html-italic">p</span>-value of less than 0.05 was considered significant. ** <span class="html-italic">p</span> &lt; 0.01 vs. Endo, *** <span class="html-italic">p</span> &lt; 0.001 vs. Endo.</p>
Full article ">Figure 7
<p>Analysis of Açai Berry administration on apoptosis impairment: Western blot analysis of BCL-2 (<b>A</b>) and BAX (<b>B</b>) expression. TUNEL assay: Endo (<b>C</b>), Endo + Açai Berry (<b>D</b>) and TUNEL-positive cells (<b>E</b>). A <span class="html-italic">p</span>-value of less than 0.05 was considered significant. ** <span class="html-italic">p</span> &lt; 0.01 vs. Endo, *** <span class="html-italic">p</span> &lt; 0.001 vs. Endo.</p>
Full article ">
10 pages, 1810 KiB  
Article
Antioxidant and Anti-Inflammatory Activities of Sargassum macrocarpum Extracts
by Hoon Kim, Hyun Young Shin, Eun-Jin Jeong, Hak-Dong Lee, Ki Cheol Hwang, Kwang-Won Yu, Sullim Lee and Sanghyun Lee
Antioxidants 2022, 11(12), 2483; https://doi.org/10.3390/antiox11122483 - 16 Dec 2022
Cited by 2 | Viewed by 2696
Abstract
Oxidative stress and the inflammatory response are known to be the most important pathological factors for aging skin cells. Therefore, substances that protect skin cells from oxidative stress and inflammatory reactions of the skin have potential as functional ingredients for skin care. In [...] Read more.
Oxidative stress and the inflammatory response are known to be the most important pathological factors for aging skin cells. Therefore, substances that protect skin cells from oxidative stress and inflammatory reactions of the skin have potential as functional ingredients for skin care. In the present study, we investigated the potential of Sargassum macrocarpum as an anti-inflammatory candidate for inflammatory skin disease. Antioxidant and anti-inflammatory activities are desirable properties in such functional materials. The total polyphenol content as well as antioxidant and anti-inflammatory activities were evaluated in hot-water (HES) and ethanol (EES) extracts of S. macrocarpum. The polyphenol content was higher in the HES (HES: 115.9 ± 15.3 mg GA/g, EES: 3.9 ± 0.5 mg GA/g), and the HES also had ABTS (HES: IC50 1.0 ± 0.0 mg/mL, EES: IC50 16.09 ± 0.7 mg/mL) and DPPH (HES: IC50 6.50 ± 0.3 mg/mL, EES: IC50 35.3 ± 3.1 mg/mL) radical scavenging capacities as well as FRAP activity (HES: IC50 18.8 ± 0.4 mg/mL, EES: IC50 n.d.). Compared with the EES at the equivalent concentration range (1.25–20 μg/mL), the HES exerted a more potent inhibitory activity on LPS-stimulated nitric oxide (10.3–43.1%), IL-6 (15.7–45.0%), and TNF-α (14.1–20.8%) in RAW 264.7 macrophage cells in addition to TNF-α and IFN-γ-facilitated IL-6 (10.9–84.1%) and IL-8 (7.7–73.2%) in HaCaT keratinocytes. These results suggested that water-soluble materials might be deeply involved in the antioxidant and anti-inflammatory activity in S. macrocarpum. General composition analysis indicated that the HES contains more carbohydrates and polyphenols than the EES, and the monosaccharide composition analysis suggested that fucose-containing sulfated polysaccharide and β-glucan might be potent anti-inflammatory candidates in the HES. The present study presents important preliminary results and a valuable strategy for developing novel anti-skin dermatitis candidates using a hot-water extract of S. macrocarpum. Full article
(This article belongs to the Special Issue Antioxidant and Anti-inflammatory Compounds from Natural Products)
Show Figures

Figure 1

Figure 1
<p>Representative image of wild (<bold>left</bold>) and dried (<bold>right</bold>) <italic>S. macrocarpum</italic>.</p>
Full article ">Figure 2
<p>Effects of HES and EES on cell viability. (<bold>A</bold>) Lipopolysaccharide-induced RAW 264.7 cells and (<bold>B</bold>) T + I-induced HaCaT cells incubated with 2.5–20 μg/mL of EES or HES for 24 h. Cytotoxic effects were determined as cell viability using MTT assays. * <italic>p</italic> &lt; 0.05; *** <italic>p</italic> &lt; 0.001 vs. LPS or T + I (inflammation-induced) controls; Student’s <italic>t</italic>-test). EES, ethanol extract of <italic>S. macrocarpum</italic>; HES, hot-water extract of <italic>S. macrocarpum</italic>; PC, positive control (dexamethasone); T + I, tumor necrosis factor alpha + interferon-gamma.</p>
Full article ">Figure 3
<p>The ability of HES and EES to inhibit NO, IL-6, and TNF-α in LPS-induced RAW 264.7 cells. RAW 264.7 cells were incubated with 2.5–20 μg/mL of EES or HES for 24 h, then levels of (<bold>A</bold>) NO (<bold>B</bold>) IL-6, and (<bold>C</bold>) TNF-α were determined using Griess assays and ELISAs, respectively. * <italic>p</italic> &lt; 0.05; ** <italic>p</italic> &lt; 0.01; *** <italic>p</italic> &lt; 0.001 vs. LPS (inflammation-induced) control (Student’s <italic>t</italic>-test). EES, ethanol extract of <italic>S. macrocarpum</italic>; HES, hot-water extract of <italic>S. macrocarpum</italic>; IL-6, interleukin-6; LPS, lipopolysaccharide; NC, negative control (without LPS stimulation); NO, nitric oxide; PC, positive control (dexamethasone 50 μg/mL and LPS stimulation); T + I, tumor necrosis factor alpha + interferon-gamma; TNF-α, tumor necrosis factor-alpha.</p>
Full article ">Figure 4
<p>Effects of HES and EES on inhibition of inflammatory cytokines in HaCaT cells induced with T + I. HaCaT cells were incubated with 2.5–10 μg/mL of EES or HES for 24 h, then levels of (<bold>A</bold>) IL-6 and (<bold>B</bold>) IL-8 were determined using ELISAs. * <italic>p</italic> &lt; 0.05; ** <italic>p</italic> &lt; 0.01; *** <italic>p</italic> &lt; 0.001 vs. LPS control (inflammation-induced (Student’s <italic>t</italic>-test). EES, ethanol extract of <italic>S. macrocarpum</italic>; HES, hot-water extract of <italic>S. macrocarpum</italic>; IL-6, interleukin-6; IL-8, interleukin-8; NC, negative control (without T + I stimulation); PC, positive control (dexamethasone 20 μg/mL and T + I stimulation).</p>
Full article ">Figure 5
<p>HPLC-UVD chromatogram of monosaccharide composition analysis of HES.</p>
Full article ">
25 pages, 3882 KiB  
Article
In Vitro Antidiabetic, Antioxidant, and Prebiotic Activities of the Chemical Compounds Isolated from Guizotia abyssinica
by Ahmed Elbermawi, Mohamed Samir Darwish, Ahmed A. Zaki, Noha A. Abou-Zeid, Mohamed A. Taher, Ebtihal Khojah, Somaiah A. Bokhari and Amal F. Soliman
Antioxidants 2022, 11(12), 2482; https://doi.org/10.3390/antiox11122482 - 16 Dec 2022
Cited by 4 | Viewed by 2542
Abstract
India and Ethiopia employ Guizotia abyssinica (niger plant) as a source of edible vegetable oil. Previous studies have documented the niger plant’s antioxidant properties and dietary benefits. Here, G. abyssinica extract was obtained and ten known bioactive components (110) [...] Read more.
India and Ethiopia employ Guizotia abyssinica (niger plant) as a source of edible vegetable oil. Previous studies have documented the niger plant’s antioxidant properties and dietary benefits. Here, G. abyssinica extract was obtained and ten known bioactive components (110) were isolated. The antioxidant, antidiabetic, and prebiotic properties of whole extract and isolated components of niger and the plant’s ability to cooperate symbiotically with probiotic strains were examined. Compound 10, myricetin-3-O-L-rhamnoside, had the highest antioxidant capacity measured in the 2,2-diphenylpicrylhydrazyl (DPPH, 4629.76 ± 6.02 µmol Trolox equivalent/g compound) and ferric-reducing antioxidant power (FRAP, 2667.62 ± 7.5 mol Trolox equivalent/g compound) assays. The lowest α-amylase and glycogen phosphorylase activities and glucose diffusion were obtained with whole G. abyssinica extracts, whereas compounds 810 had moderate inhibitory effects. G. abyssinica extract also induced the highest glucose absorption by yeast cells in the presence of 5 mM of glucose. Moreover, Lactobacillus plantarum and L. rhamnosus incubated with β-sitosterol 3-O-D-glucoside (compound 7) showed the highest prebiotic activity score. The levels of L-(+)-lactic acid isomer in the probiotic strains were the highest in presence of the whole extract and decreased progressively in the presence of flavonoid glycosides (compounds 810) and β-sitosterol 3-O-D-glucoside. The enzymatic profile of the probiotic strains was unaffected by the niger extract and compounds 710. The findings revealed that the biological activities of G. abyssinica extract are mediated by the compounds 110, and it may be considered as a promising plant for the treatment of diabetes mellitus. Full article
(This article belongs to the Special Issue Antioxidant Potential of Extracts from Foods and Plants)
Show Figures

Graphical abstract

Graphical abstract
Full article ">Figure 1
<p>Structures of isolated compounds.</p>
Full article ">Figure 2
<p>Activity scores (A<sub>pre<span class="html-italic">b</span></sub>) of <span class="html-italic">Lactobacillus</span> spp. strains paired with different isolated compounds (<b>1</b>–<b>10</b>) and methanol extract. Lowercase letters show a significant impact on the prebiotic activity index (<span class="html-italic">p</span> ˂ 0.05). The standard deviations of the means of the treatments are shown by vertical bars.</p>
Full article ">Figure 3
<p>Effect of <span class="html-italic">G. abyssinica</span> extract and isolated bioactive compounds on probiotic bacteria’s ability to produce the optically active forms of lactic acid L (+) (<b>A</b>) and D (+) (<b>B</b>). Lowercase letters show a significant impact on the prebiotic activity index (<span class="html-italic">p</span> ˂ 0.05). The standard deviation between the means of the treatments is shown by vertical bars.</p>
Full article ">Figure 4
<p>Heat map presenting the enzymatic profiles of the selected probiotic strains in relation to isolated phenolic compounds (<b>1</b>–<b>10</b>) or methanol extract. Glu and inu indicate glucose (positive control) and inulin (prebiotic standard), respectively. Rh, Pa, and Pl indicate <span class="html-italic">Lb. rhamnosus</span>, <span class="html-italic">Lb. paracasei</span>, and <span class="html-italic">Lb. plantarum</span>. Red and blue, respectively, indicate a lack of enzyme activity or a positive reaction of the enzymatic profile.</p>
Full article ">Figure 5
<p>Effect of <span class="html-italic">G</span>. <span class="html-italic">abyssinica</span> extract (ext) and isolated bioactive compounds on <span class="html-italic">α</span>-amylase activity. Lower-case letters show a significant impact (<span class="html-italic">p</span> ˂ 0.05). Acarbose was used as a positive control (PC).</p>
Full article ">Figure 6
<p>Effect of <span class="html-italic">G</span>. <span class="html-italic">abyssinica</span> extract (Ext) and isolated bioactive compounds on the glycogen phosphorylase activity. The activity of phosphorylated glycogen phosphorylase from rabbit muscle (mGPa) was measured, and CP-91149 was used as a positive control (PC). Lowercase letters indicate significant differences in mGPa activity among treatment conditions (<span class="html-italic">p &lt;</span> 0.05). Upper-case letters indicate significant differences in mGPa activity among glucose concentrations (<span class="html-italic">p &lt;</span> 0.05). Data are presented as the means ± standard deviations.</p>
Full article ">Figure 7
<p>Effect of <span class="html-italic">G. abyssinica</span> extract and isolated bioactive compounds on the rate of glucose diffusion. Lower-case letters indicate significant differences (<span class="html-italic">p &lt;</span> 0.05) between treatment conditions and upper-case letters indicate significant differences (<span class="html-italic">p &lt;</span> 0.05) between time conditions. Data are presented as the means ± standard deviations.</p>
Full article ">Figure 8
<p>Glucose uptake by yeast cells exposed to different concentrations of glucose (5, 10, and 25 mM) in the presence of <span class="html-italic">G. abyssinica</span> extract or compounds 1–10. Lower-case letters indicate significant differences (<span class="html-italic">p &lt;</span> 0.05) between treatment conditions and upper-case letters indicate significant differences (<span class="html-italic">p &lt;</span> 0.05) between glucose concentrations.</p>
Full article ">Figure 9
<p>(<b>A</b>) Biplot of the principal component analysis (PCA) of the impact of the <span class="html-italic">G. abyssinica</span> extract and isolated bioactive compounds on the prebiotic activity score (A<sub>preb</sub>), D-(−)-lactic acid and L-(+)-lactic acid levels, antioxidant activity (DPPH and FRAP assays), glucose uptake by yeast cells (Gu), inhibition of <span class="html-italic">α</span>-amylase (Amy) and glycogen phosphorylase (Gpa) activities, and glucose diffusion (Gd). (<b>B</b>) Analysis of the correlations among variables.</p>
Full article ">
13 pages, 582 KiB  
Article
Effect of Debittering with Different Solvents and Ultrasound on Carotenoids, Tocopherols, and Phenolics of Lupinus albus Seeds
by Lorenzo Estivi, Davide Fusi, Andrea Brandolini and Alyssa Hidalgo
Antioxidants 2022, 11(12), 2481; https://doi.org/10.3390/antiox11122481 - 16 Dec 2022
Cited by 4 | Viewed by 1792
Abstract
Lupin seeds represent a rich nutritional source of bioactive compounds, including antioxidant molecules such as carotenoids, tocopherols, and phenolics. However, before consumption, the lupin seeds must be debittered in order to remove their bitter and toxic alkaloids. This study analyzed the impact on [...] Read more.
Lupin seeds represent a rich nutritional source of bioactive compounds, including antioxidant molecules such as carotenoids, tocopherols, and phenolics. However, before consumption, the lupin seeds must be debittered in order to remove their bitter and toxic alkaloids. This study analyzed the impact on the bioactive compounds of Lupinus albus seeds of a recent time- and water-saving debittering method, which employs alternative washing solutions (0.5% or 1% of either NaCl or citric acid), with or without the assistance of ultrasound. The results were compared with those of two control methods using water or a NaCl solution. The sonication, when it was significant, led to a large loss of bioactive compounds, which was most likely due to its extraction capability. The seeds that were debittered without ultrasound presented high concentrations of tocopherols (172.8–241.3 mg/kg DM), carotenoids (10.9–25.1 mg/kg DM), and soluble-free (106.9–361.1 mg/kg DM), soluble-conjugated (93.9–118.9 mg/kg DM), and insoluble-bound (59.2–156.7 mg/kg DM) phenolics. The soluble-free fraction showed the greatest loss after a prolonged treatment. Overall, debittering with citric acid or NaCl preserved the highest concentration of antioxidant compounds by shortening the treatment time, thus preventing extensive leaching. Full article
(This article belongs to the Special Issue Advances in Natural Antioxidants for Food Improvement Volume 2)
Show Figures

Graphical abstract

Graphical abstract
Full article ">Figure 1
<p>Total carotenoids, tocopherols, free phenolics, conjugated phenolics, bound phenolics, and overall phenolics of <span class="html-italic">Lupinus albus</span> seeds (Lot 2) debittered by the control methods with water (H<sub>2</sub>OCT; Erbaş [<a href="#B28-antioxidants-11-02481" class="html-bibr">28</a>]; Córdova-Ramos et al. [<a href="#B27-antioxidants-11-02481" class="html-bibr">27</a>]) or with NaCl solution (NaClCT; Villacrés et al. [<a href="#B31-antioxidants-11-02481" class="html-bibr">31</a>]), and by the debittering method proposed by Estivi et al. [<a href="#B25-antioxidants-11-02481" class="html-bibr">25</a>] using 1% NaCl solution (NaCl 45 and 57 h) or 1% citric acid solution (CA 45 and 57 h). The bars show the standard deviation, while the different letters indicate significant differences between samples according to the LSD test (<span class="html-italic">p</span> ≤ 0.05).</p>
Full article ">
19 pages, 12489 KiB  
Article
Transcriptome and Metabolome Analysis of a Late-Senescent Vegetable Soybean during Seed Development Provides New Insights into Degradation of Chlorophyll
by Jian Wang, Guang Chen, Xuetong Li, Xujun Fu, Sujuan Li, Xiaoyuan Tao, Zhong-Hua Chen and Shengchun Xu
Antioxidants 2022, 11(12), 2480; https://doi.org/10.3390/antiox11122480 - 16 Dec 2022
Cited by 2 | Viewed by 2437
Abstract
(1) Background: Senescence represents the final stage of plant growth and development, which transfers nutrients to growing seeds and directly affects the yield and quality of crops. However, little is known about chlorophyll degradation in developing and maturing seeds, in contrast to leaf [...] Read more.
(1) Background: Senescence represents the final stage of plant growth and development, which transfers nutrients to growing seeds and directly affects the yield and quality of crops. However, little is known about chlorophyll degradation in developing and maturing seeds, in contrast to leaf senescence; (2) Methods: RNA-Seq was used to analyze the differentially expressed genes of different late-senescent germplasms. A widely untargeted metabolic analysis was used to analyze differential metabolites. In addition, qRT-PCR was conducted to detect gene expression levels; (3) Results: Transcriptome analysis revealed that ZX12 seeds have a higher expression level of the chlorophyll synthesis genes in the early stage of maturity, compared with ZX4, and have a lower expression level of chlorophyll degradation genes in the late stage of maturity. Flavonoids were the primary differential metabolites, and ZX12 contains the unique and highest expression of three types of metabolites, including farrerol-7-O-glucoside, cyanidin-3-o-(6′-o-feruloyl) glucoside, and kaempferide-3-o-(6′-malonyl) glucoside. Among them, farrerol-7-O-glucoside and cyanidin-3-o-(6′-o-feruloyl) glucoside are flavonoid derivatives containing mono and dihydroxy-B-ring chemical structures, respectively; and (4) Conclusions: It is speculated that the two metabolites can slow down the degradation process of chlorophyll by scavenging oxygen-free radicals in the chloroplast. Full article
Show Figures

Graphical abstract

Graphical abstract
Full article ">Figure 1
<p>Chl content of soybean varieties ZX4 and ZX12. (<b>A</b>) Photographs of the phenotype of pods and seeds at different days (20 d, 25 d, 30 d, 35 d, 40 d, 45 d, and 50 d) after flowering. (<b>B</b>) Chl content (Chl a, Chl b, total Chl, and Rate of Chl degradation) of ZX4 and ZX12 seeds at different DAF. (<b>C</b>) Photographs of Chl autofluorescence intensity of ZX4 and ZX12 seeds at different DAF. (<b>D</b>) Chl fluorescence intensity of ZX4 and ZX12 seeds.</p>
Full article ">Figure 2
<p>SOD, POD, and T-AOC activities of ZX4 and ZX12 seeds at different maturity stages. (<b>A</b>) SOD activities of ZX4 and ZX12 seeds at different maturity stages. (<b>B</b>) POD activities of ZX4 and ZX12 seeds at different maturity stages. (<b>C</b>) T-AOC activities of ZX4 and ZX12 seeds at different maturity stages.</p>
Full article ">Figure 3
<p>Transcriptome analysis of ZX12 and ZX4 seeds at different maturity stages. (<b>A</b>) Number of DEGs in ZX12 and ZX4 seeds at different maturity stages. (<b>B</b>) Venn diagram of DEGs between ZX12 and ZX4 seeds at different maturity stages. (<b>C</b>) KEGG analysis on the differentially expressed genes at 20, 30, and 40 DAF.</p>
Full article ">Figure 4
<p>Chl metabolism and photosynthesis pathway-related genes are differentially expressed in ZX12/ZX4 at 20, 30 and 40 DAF time. (<b>A</b>) Heat map of Chl metabolism gene expression. (<b>B</b>) Heat map of key gene expression in photosynthesis pathway. The value of the heat map is the log<sub>2</sub> (ZX12/ZX4) value of the ratio of the expression in RNA-seq.</p>
Full article ">Figure 5
<p>Metabolome analysis of differential metabolic profile between ZX4 and ZX12 seeds at different maturity stages. (<b>A</b>) Classification of differential metabolites. (<b>B</b>) The combination of the top 10 upregulating and downregulating metabolites in three periods. (<b>C</b>) Cluster analysis of expression patterns of differential metabolites. (<b>D</b>) Group metabolite expression heat map.</p>
Full article ">Figure 6
<p>Correlation analysis between differential metabolites and differentially expressed genes of flavonoids and anthocyanins. Black color represents undetected metabolites; Purple represents detected metabolites; and the red asterisk represents a positive correlation and green represents a negative correlation.</p>
Full article ">Figure 7
<p>The proposed model affecting the difference of stay-green ability between ZX12 and ZX4 seeds at mature stages. The font in red indicates that they are positively regulated in ZX12; red boxes represent up-regulation; green boxes represent down-regulation; and the arrow represents promotion, and the T represents inhibition.</p>
Full article ">
20 pages, 1289 KiB  
Article
Effect of Gastrointestinal Digestion on the Bioaccessibility of Phenolic Compounds and Antioxidant Activity of Fermented Aloe vera Juices
by Ruth B. Cuvas-Limon, Pedro Ferreira-Santos, Mario Cruz, José A. Teixeira, Ruth Belmares and Clarisse Nobre
Antioxidants 2022, 11(12), 2479; https://doi.org/10.3390/antiox11122479 - 16 Dec 2022
Cited by 13 | Viewed by 3671
Abstract
Plant-based beverages are enriched by the fermentation process. However, their biocompounds are transformed during gastrointestinal digestion, improving their bioaccessibility, which is of primary importance when considering the associated health benefits. This study aimed to evaluate the effect of in vitro gastrointestinal digestion on [...] Read more.
Plant-based beverages are enriched by the fermentation process. However, their biocompounds are transformed during gastrointestinal digestion, improving their bioaccessibility, which is of primary importance when considering the associated health benefits. This study aimed to evaluate the effect of in vitro gastrointestinal digestion on phenolic compound bioaccessibility and antioxidant activity of novel Aloe vera juices fermented by probiotic Enterococcus faecium and Lactococcus lactis. Aloe vera juices were digested using the standardized static INFOGEST protocol. During digestion, phenolic compounds and antioxidant activity (DPPH, ABTS, and FRAP) were accessed. The digestion process was seen to significantly increase the total phenolic content of the fermented Aloe vera juices. The fermentation of Aloe vera increased the bioaccessibility of juice biocompounds, particularly for kaempferol, ellagic acid, resveratrol, hesperidin, ferulic acid, and aloin. The phenolics released during digestion were able to reduce the oxidative radicals assessed by ABTS and FRAP tests, increasing the antioxidant action in the intestine, where they are absorbed. The fermentation of Aloe vera by probiotics is an excellent process to increase the bioavailability of beverages, resulting in natural added-value functional products. Full article
Show Figures

Figure 1

Figure 1
<p>Juice preparation procedure and in vitro gastrointestinal digestion (static model) of non-fermented <span class="html-italic">Aloe vera</span> and <span class="html-italic">Aloe vera</span> fermented either with <span class="html-italic">Enterococcus faecium</span> or with <span class="html-italic">Lactococcus lactis</span>.</p>
Full article ">Figure 2
<p>Total phenolic content of non-fermented and fermented <span class="html-italic">Aloe vera</span> juice at the digestion stages. <span class="html-italic">Av</span>: Digestion of non-fermented <span class="html-italic">Aloe vera</span> extract; <span class="html-italic">AvF</span>: Digestion of <span class="html-italic">Aloe vera</span> extract fermented with <span class="html-italic">E. faecium</span>; <span class="html-italic">AvL</span>: Digestion of <span class="html-italic">Aloe vera</span> extract fermented with <span class="html-italic">L. lactis</span>. Data bearing different lowercase letters (a, b) in the same digestion phase are significantly different (<span class="html-italic">p</span> &lt; 0.05). Data bearing different capital letters (A, B) in the same sample groups are significantly different (<span class="html-italic">p</span> &lt; 0.05).</p>
Full article ">Figure 3
<p>Bioactive compounds identified in <span class="html-italic">Aloe vera</span> juice.</p>
Full article ">Figure 4
<p>Antioxidant activity of non-digested and digested <span class="html-italic">Aloe vera</span> juices by (<b>A</b>) FRAP assay, (<b>B</b>) ABTS assay, and (<b>C</b>) DPPH assay. <span class="html-italic">Av</span>: Digestion of non-fermented <span class="html-italic">Aloe vera</span> extract; <span class="html-italic">AvF</span>: Digestion of <span class="html-italic">Aloe vera</span> extract fermented with <span class="html-italic">Enterococcus faecium</span>; <span class="html-italic">AvL</span>: Digestion of <span class="html-italic">Aloe vera</span> extract fermented with <span class="html-italic">Lactococcus lactis</span>. Data bearing different lowercase letters (a–c) in the same digestion phase are significantly different (<span class="html-italic">p</span> &lt; 0.05). Data bearing different capital letters (A–D) in the same sample groups are significantly different (<span class="html-italic">p</span> &lt; 0.05).</p>
Full article ">
19 pages, 3645 KiB  
Review
Role of FOXO3a Transcription Factor in the Regulation of Liver Oxidative Injury
by Hong Jin, Li Zhang, Jun He, Min Wu, Li Jia and Jiabin Guo
Antioxidants 2022, 11(12), 2478; https://doi.org/10.3390/antiox11122478 - 16 Dec 2022
Cited by 7 | Viewed by 3444
Abstract
Oxidative stress has been identified as a key mechanism in liver damage caused by various chemicals. The transcription factor FOXO3a has emerged as a critical regulator of redox imbalance. Multiple post-translational changes and epigenetic processes closely regulate the activity of FOXO3a, resulting in [...] Read more.
Oxidative stress has been identified as a key mechanism in liver damage caused by various chemicals. The transcription factor FOXO3a has emerged as a critical regulator of redox imbalance. Multiple post-translational changes and epigenetic processes closely regulate the activity of FOXO3a, resulting in synergistic or competing impacts on its subcellular localization, stability, protein–protein interactions, DNA binding affinity, and transcriptional programs. Depending on the chemical nature and subcellular context, the oxidative-stress-mediated activation of FOXO3a can induce multiple transcriptional programs that play crucial roles in oxidative injury to the liver by chemicals. Here, we mainly review the role of FOXO3a in coordinating programs of genes that are essential for cellular homeostasis, with an emphasis on exploring the regulatory mechanisms and potential application of FOXO3a as a therapeutic target to prevent and treat liver oxidative injury. Full article
Show Figures

Graphical abstract

Graphical abstract
Full article ">Figure 1
<p>Reactive intermediate species metabolism induces oxidative stress in the liver. Liver oxidative injury is initiated by free radicals produced by metabolic conversion of chemicals into reactive intermediate species (red color), such as electrophilic compounds and ROS. Superoxide (O<sub>2</sub><sup>•−</sup>) is generated as a by-product during oxidative phosphorylation within mitochondria. Superoxide can be converted to H<sub>2</sub>O<sub>2</sub> by SOD enzymes. H<sub>2</sub>O<sub>2</sub> is then scavenged by antioxidant enzymes such as GPx and catalase. ETC, electron-transport chain complexes; GPx, glutathione peroxidase; NQO1, NAD(P)H quinone oxidoreductase 1; SOD, superoxide dismutase.</p>
Full article ">Figure 2
<p>FOXO3a structure and its post-translational modifications to regulate liver oxidative injury. (<b>A</b>) Human FOXO3a domains. CR1–CR3, conserved regions 1–3; DBD: DNA-binding domain; NLS: nuclear localization signal domain; NES: nuclear export sequence; TAD, transactivation domain. (<b>B</b>) Major PTMs residues of FOXO3a regulated by various xenobiotics. In response to oxidative stress, FOXO3a undergoes PTMs in the NLS and NES domains, which affects its subcellular localization, stability, protein–protein interactions, and the transcriptional activity and specificity.</p>
Full article ">Figure 3
<p>Epigenetic regulation of FOXO3a via microRNAs and histone modifications. (<b>A</b>). Diverse miRNAs are identified which regulate FOXO3a directly or indirectly upon oxidative stress. (<b>B</b>). Involvement of histone modifications in the control of FOXO3a transactivation in response to environmental factors. FOXO3a is responsible for autophagy gene expression by influencing chromatin structure through decrease in SKP2 to up-regulate CARM1, the CARM1–Pontin–FOXO3a signaling axis works for enhancer activation to establish target gene regulation by increasing H4 acetylation. Additionally, modification of histone H1 through PARylation by stimulation of PARP1 dissociates histone H1 from DNA, exposing the autophagy gene promoter regions and enhancing FOXO3a binding to the target gene promoters through epigenetic reprogramming of FOXO3a transactivation. CARM1: coactivator-associated arginine methyltransferase 1.</p>
Full article ">Figure 3 Cont.
<p>Epigenetic regulation of FOXO3a via microRNAs and histone modifications. (<b>A</b>). Diverse miRNAs are identified which regulate FOXO3a directly or indirectly upon oxidative stress. (<b>B</b>). Involvement of histone modifications in the control of FOXO3a transactivation in response to environmental factors. FOXO3a is responsible for autophagy gene expression by influencing chromatin structure through decrease in SKP2 to up-regulate CARM1, the CARM1–Pontin–FOXO3a signaling axis works for enhancer activation to establish target gene regulation by increasing H4 acetylation. Additionally, modification of histone H1 through PARylation by stimulation of PARP1 dissociates histone H1 from DNA, exposing the autophagy gene promoter regions and enhancing FOXO3a binding to the target gene promoters through epigenetic reprogramming of FOXO3a transactivation. CARM1: coactivator-associated arginine methyltransferase 1.</p>
Full article ">Figure 4
<p>Proposed schematic representation of FOXO3a-mediated stress response in the liver. FOXO3a orchestrates multiple transcriptional programs to regulate apoptosis, ROS detoxification, and autophagy (arrows indicate active functions, and bar-headed lines represent inhibitory effects).</p>
Full article ">
20 pages, 4289 KiB  
Article
Distributions of α- and δ-TOCopherol in Intact Olive and Soybean Oil-in-Water Emulsions at Various Acidities: A Test of the Sensitivity of the Pseudophase Kinetic Model
by Lucía Fernández-Ventoso, Artai Toba-Pérez, Sonia Losada-Barreiro, Fátima Paiva-Martins and Carlos Bravo-Díaz
Antioxidants 2022, 11(12), 2477; https://doi.org/10.3390/antiox11122477 - 16 Dec 2022
Cited by 2 | Viewed by 1550
Abstract
During the last years, the formalism of the pseudophase kinetic model (PKM) has been successfully applied to determine the distributions of antioxidants and their effective interfacial concentrations, and to assess the relative importance of emulsion and antioxidant properties (oil and surfactant nature, temperature, [...] Read more.
During the last years, the formalism of the pseudophase kinetic model (PKM) has been successfully applied to determine the distributions of antioxidants and their effective interfacial concentrations, and to assess the relative importance of emulsion and antioxidant properties (oil and surfactant nature, temperature, acidity, chemical structure, hydrophilic-liphophilic balance (HLB), etc.) on their efficiency in intact lipid-based emulsions. The PKM permits separating the contributions of the medium and of the concentration to the overall rate of the reaction. In this paper, we report the results of a specifically designed experiment to further test the suitability of the PKM to evaluate the distributions of antioxidants among the various regions of intact lipid-based emulsions and provide insights into their chemical reactivity in multiphasic systems. For this purpose, we employed the antioxidants α- and δ-TOCopherol (α- and δ-TOC, respectively) and determined, at different acidities well below their pKa, the interfacial rate constants kI for the reaction between 16-ArN2+ and α- and δ-TOC, and the antioxidant distributions in intact emulsions prepared with olive and soybean oils. Results show that the effective interfacial concentration of δ-TOC is higher than that of α-TOC in 1:9 (v/v) soybean and 1:9 olive oil emulsions. The effective interfacial concentrations of tocopherols are much higher (15-96-fold) than the stoichiometric concentrations, as the effective interfacial concentrations of both δ-TOC and α-TOC in soybean oil emulsions are higher (2-fold) than those in olive oil emulsions. Overall, the results demonstrate that the PKM grants an effective separation of the medium and concentration effects, demonstrating that the PKM constitutes a powerful non-destructive tool to determine antioxidant concentrations in intact emulsions and to assess the effects of various factors affecting them. Full article
Show Figures

Figure 1

Figure 1
<p>Photographs of the reaction mixtures obtained in olive oil emulsions after reacting 16-ArN<sub>2</sub><sup>+</sup> with α-TOC (<b>left</b>) and δ-TOC (<b>right</b>). The yellowish color is a consequence of the formation of an azo dye between 16-ArN<sub>2</sub><sup>+</sup> and δ-TOC.</p>
Full article ">Figure 2
<p>Typical plot showing the changes in absorbance (λ = 572 nm) with time (<span style="color:red">●</span>) and ln[A<sub>t</sub> − A<sub>inf</sub>] plot (<span style="color:#2F5496">■</span>). Reaction was carried out in intact 1:9 (<span class="html-italic">v</span>:<span class="html-italic">v</span>, <span class="html-italic">o</span>/<span class="html-italic">w</span>) emulsions prepared by employing stripped olive oil, a buffered (pH = 5, citric acid/citrate (0.04 M)) aqueous solution, and Tween 20 (surfactant volume fraction Φ<sub>I</sub> = V<sub>surf</sub>/V<sub>total</sub> = 0.04). Experimental conditions: [16-ArN<sub>2</sub><sup>+</sup>] = 2.90 × 10<sup>−4</sup> M, [α-TOC] = 4.2 × 10<sup>−3</sup> M, T = 25 °C.</p>
Full article ">Figure 3
<p>Variations in <span class="html-italic">k<sub>obs</sub></span> with Φ<sub>I</sub> for the reaction between 16-ArN<sub>2</sub><sup>+</sup> and the antioxidants α- (<b>A</b>,<b>C</b>) and δ-TOC (<b>B</b>,<b>D</b>) in 1:9 olive (<b>A</b>,<b>B</b>) and soybean (<b>C</b>,<b>D</b>) o/w emulsions prepared with buffered aqueous solutions of different acidity. Experimental conditions δ-TOC ([δ-TOC<sub>T</sub>] = 4.0 × 10<sup>−3</sup> M) y (B) α-TOC ([α-TOC<sub>T</sub>] = 4.0 × 10<sup>−3</sup> M), T = 25 °C.</p>
Full article ">Figure 4
<p>Linear variations of logarithm of the interfacial rate constant <span class="html-italic">k</span><sub>I</sub> with pH for the reaction between 16−ArN<sub>2</sub><sup>+</sup> and α-TOC (<b>A</b>) and δ-TOC (<b>B</b>) in 1:9 (<span class="html-italic">o</span>:<span class="html-italic">w</span>) emulsions prepared with olive (●) and soybean (▲) oils.</p>
Full article ">Figure 5
<p>Variation of the percentages of α-TOC (<b>A</b>,<b>C</b>) and δ-TOC (<b>B</b>,<b>D</b>) with the surfactant volume fraction Φ<sub>I</sub> in the oil (■) and interfacial (●) regions of 1:9 olive (<b>A</b>,<b>B</b>) and soybean (<b>C</b>,<b>D</b>) oil emulsions at different acidities.</p>
Full article ">Figure 6
<p>Variations of effective concentrations of α-TOC (<b>A</b>–<b>C</b>) and δ-TOC (<b>B</b>,<b>D</b>) with the surfactant volume fraction in the oil (O) and interfacial (I) regions of 1:9 (<span class="html-italic">v</span>:<span class="html-italic">v</span>) olive (<b>A</b>,<b>B</b>) and soybean (<b>C</b>,<b>D</b>) o/w emulsions. [TOC<sub>T</sub>] = 4 × 10<sup>−3</sup> M.</p>
Full article ">Figure 6 Cont.
<p>Variations of effective concentrations of α-TOC (<b>A</b>–<b>C</b>) and δ-TOC (<b>B</b>,<b>D</b>) with the surfactant volume fraction in the oil (O) and interfacial (I) regions of 1:9 (<span class="html-italic">v</span>:<span class="html-italic">v</span>) olive (<b>A</b>,<b>B</b>) and soybean (<b>C</b>,<b>D</b>) o/w emulsions. [TOC<sub>T</sub>] = 4 × 10<sup>−3</sup> M.</p>
Full article ">Scheme 1
<p>Illustrative representation of an emulsion droplet (<b>left</b>) and the conceptual division in the oil, interfacial, and aqueous regions (<b>right</b>), showing the distribution of an antioxidant AO between the oil (O), interfacial (I), and aqueous (W) regions, characterized by the partition constants between the oil-interfacial, <span class="html-italic">P</span><sub>O</sub><sup>I</sup>, regions and those between the aqueous-interfacial, <span class="html-italic">P</span><sub>w</sub><sup>I</sup>, regions.</p>
Full article ">Scheme 2
<p>Chemical structures of two of the four major forms of vitamin E (α-, β-, γ-, and δ-TOCopherols). In α-TOCopherol (the most biologically active form), the chromanol ring is fully methylated, whereas δ-TOCopherol is only methylated in position 8. Both tocopherols have a saturated phytyl side chain attached at C2 and have three chiral centers.</p>
Full article ">Scheme 3
<p>Nucleophilic addition mechanism forming Ar-N=N-Nu adducts in the (<span class="html-italic">Z</span>)- and (<span class="html-italic">E</span>)-configurations. The competitive spontaneous decomposition of ArN<sub>2</sub><sup>+</sup> is also included. Adapted from ref. [<a href="#B54-antioxidants-11-02477" class="html-bibr">54</a>] with permission, Copyright J. Wiley &amp; Sons.</p>
Full article ">Scheme 4
<p>Representative coupling reaction leading to the formation of azo dyes between ArN<sub>2</sub><sup>+</sup> and (<b>A</b>) the Na salt of 2-naphthol-6-sulfonic acid (nucleophilic partner), (<b>B</b>) the coupling agent N-(1-Naphthyl)ethylenediamine (NED). The latter reaction is exploited to monitor the reaction between the chemical probe 16-ArN<sub>2</sub><sup>+</sup> and the antioxidants in intact emulsions (see <a href="#sec3dot3-antioxidants-11-02477" class="html-sec">Section 3.3</a> below).</p>
Full article ">Scheme 5
<p>Proposed mechanisms for the reaction between ArN<sub>2</sub><sup>+</sup> and methyl gallate. Similar mechanisms have been proposed for reactions of ArN<sub>2</sub><sup>+</sup> with antioxidants bearing catechol moieties [<a href="#B63-antioxidants-11-02477" class="html-bibr">63</a>,<a href="#B64-antioxidants-11-02477" class="html-bibr">64</a>]. Adapted from ref. [<a href="#B54-antioxidants-11-02477" class="html-bibr">54</a>] with permission, Copyright J. Wiley &amp; Sons.</p>
Full article ">Scheme 6
<p>Pictorial representation of the distribution of a water-insoluble antioxidant (e.g., tocopherols) and the location of the chemical probe 16-ArN<sub>2</sub><sup>+</sup>. <span class="html-italic">P</span><sub>O</sub><sup>I</sup> is the partition constant of the antioxidant, <span class="html-italic">k</span><sub>I</sub> the rate constant between the antioxidant and 16-ArN<sub>2</sub><sup>+</sup>, and Φ<sub>O</sub>, Φ<sub>I</sub>, Φ<sub>W</sub> are the volume fractions of the oil (O), interfacial (I), and aqueous (W) regions.</p>
Full article ">
15 pages, 3290 KiB  
Article
Differences in Oxidative Stress Markers and Antioxidant Enzyme Activities in Black Bean Aphid Morphs (Aphis fabae Scop.) Fed on the Primary Host Viburnum opulus L.
by Iwona Łukasik, Sylwia Goławska and Hubert Sytykiewicz
Antioxidants 2022, 11(12), 2476; https://doi.org/10.3390/antiox11122476 - 16 Dec 2022
Cited by 2 | Viewed by 1827
Abstract
Changes in the level of oxidative stress markers—superoxide anion radical (O2), hydrogen peroxide (H2O2) and malondialdehyde (MDA) and the activity of antioxidant enzymes—superoxide dismutase (SOD), catalase (CAT) and ascorbate peroxidase (APX) in the black bean [...] Read more.
Changes in the level of oxidative stress markers—superoxide anion radical (O2), hydrogen peroxide (H2O2) and malondialdehyde (MDA) and the activity of antioxidant enzymes—superoxide dismutase (SOD), catalase (CAT) and ascorbate peroxidase (APX) in the black bean aphid occurring on the primary host (viburnum plants) were studied. Among the aphid morphs, the lowest contents of O2, H2O2 and MDA were noted for winged adults (alatae), which were also characterized by the highest activity of antioxidant enzymes. These metabolic features indicate the adaptation of winged morphs to the colonization of new host plants. During spring migration, an increase in the content of oxidative stress markers and antioxidant enzyme activities in wingless females (fundatrigeniae) was observed. The significance of the biochemical adaptation of the black bean aphid to its winter host is discussed. Full article
Show Figures

Graphical abstract

Graphical abstract
Full article ">Figure 1
<p>The dynamics of three morphs of the <span class="html-italic">A. fabae</span> population on its primary host in the spring periods of 2019 (<b>A</b>) and 2020 (<b>B</b>).</p>
Full article ">Figure 2
<p>Superoxide anion (<math display="inline"><semantics> <mrow> <msub> <mi mathvariant="normal">O</mi> <msup> <mn>2</mn> <mo>−</mo> </msup> </msub> </mrow> </semantics></math>) (ΔA<sub>490</sub>/min/mg protein) (<b>A</b>), hydrogen peroxide (H<sub>2</sub>O<sub>2</sub>) (nmol/mg protein) (<b>B</b>) and malondialdehyde (MDA) content (nmol/mg protein) (<b>C</b>) in various morphs of <span class="html-italic">A. fabae</span> on <span class="html-italic">V. opulus</span> (means ± SD; <span class="html-italic">n</span> = 4). Different letters denote significant differences (one–way ANOVA; Tukey’s test; <span class="html-italic">p</span> &lt; 0.05).</p>
Full article ">Figure 2 Cont.
<p>Superoxide anion (<math display="inline"><semantics> <mrow> <msub> <mi mathvariant="normal">O</mi> <msup> <mn>2</mn> <mo>−</mo> </msup> </msub> </mrow> </semantics></math>) (ΔA<sub>490</sub>/min/mg protein) (<b>A</b>), hydrogen peroxide (H<sub>2</sub>O<sub>2</sub>) (nmol/mg protein) (<b>B</b>) and malondialdehyde (MDA) content (nmol/mg protein) (<b>C</b>) in various morphs of <span class="html-italic">A. fabae</span> on <span class="html-italic">V. opulus</span> (means ± SD; <span class="html-italic">n</span> = 4). Different letters denote significant differences (one–way ANOVA; Tukey’s test; <span class="html-italic">p</span> &lt; 0.05).</p>
Full article ">Figure 3
<p>Superoxide dismutase (SOD) (U/mg protein) (<b>A</b>), catalase (CAT) (µmol H<sub>2</sub>O<sub>2</sub>/mg protein) (<b>B</b>) and ascorbate peroxidase (APX) activity (µmol ASA oxidized/min/mg protein) (<b>C</b>) in various morphs of <span class="html-italic">A. fabae</span> on <span class="html-italic">V. opulus</span> (means ± SD; <span class="html-italic">n</span> = 4). Different letters denote significant differences (one–way ANOVA; Tukey’s test; <span class="html-italic">p</span> &lt; 0.05).</p>
Full article ">Figure 3 Cont.
<p>Superoxide dismutase (SOD) (U/mg protein) (<b>A</b>), catalase (CAT) (µmol H<sub>2</sub>O<sub>2</sub>/mg protein) (<b>B</b>) and ascorbate peroxidase (APX) activity (µmol ASA oxidized/min/mg protein) (<b>C</b>) in various morphs of <span class="html-italic">A. fabae</span> on <span class="html-italic">V. opulus</span> (means ± SD; <span class="html-italic">n</span> = 4). Different letters denote significant differences (one–way ANOVA; Tukey’s test; <span class="html-italic">p</span> &lt; 0.05).</p>
Full article ">Figure 4
<p>Changes in the superoxide anion radical (<math display="inline"><semantics> <mrow> <msub> <mi mathvariant="normal">O</mi> <msup> <mn>2</mn> <mo>−</mo> </msup> </msub> </mrow> </semantics></math>) content (ΔA<sub>490</sub>/min/mg protein) in <span class="html-italic">A. fabae fundatrigeniae</span> during feeding on <span class="html-italic">V. opulus</span> (means ± SD; <span class="html-italic">n</span> = 4). Different letters denote significant differences (one–way ANOVA; Tukey’s test; <span class="html-italic">p</span> &lt; 0.05).</p>
Full article ">Figure 5
<p>Changes in the hydrogen peroxide (H<sub>2</sub>O<sub>2</sub>) content (nmol/mg protein) in <span class="html-italic">A. fabae fundatrigeniae</span> during feeding on <span class="html-italic">V. opulus</span> (means ± SD; <span class="html-italic">n</span> = 4). Different letters denote significant differences (one–way ANOVA; Tukey’s test; <span class="html-italic">p</span> &lt; 0.05).</p>
Full article ">Figure 6
<p>Changes in the malondialdehyde (MDA) content (nmol/mg protein) in <span class="html-italic">A. fabae fundatrigeniae</span> during feeding on <span class="html-italic">V. opulus</span> (means ± SD; <span class="html-italic">n</span> = 4). Different letters denote significant differences (one–way ANOVA; Tukey’s test; <span class="html-italic">p</span> &lt; 0.05).</p>
Full article ">Figure 7
<p>Changes in the SOD activity (U/mg protein) in <span class="html-italic">A. fabae fundatrigeniae</span> during feeding on <span class="html-italic">V. opulus</span> (means ± SD; <span class="html-italic">n</span> = 4). Different letters denote significant differences (one–way ANOVA; Tukey’s test; <span class="html-italic">p</span> &lt; 0.05).</p>
Full article ">Figure 8
<p>Changes in the CAT activity (µmol H<sub>2</sub>O<sub>2</sub>/mg protein) in <span class="html-italic">A. fabae fundatrigeniae</span> during feeding on <span class="html-italic">V. opulus</span> (means ± SD; <span class="html-italic">n</span> = 4). Different letters denote significant differences (one–way ANOVA; Tukey’s test; <span class="html-italic">p</span> &lt; 0.05).</p>
Full article ">Figure 9
<p>Changes in the APX activity (µmol ASA oxidized/min/mg protein) in <span class="html-italic">A. fabae fundatrigeniae</span> during feeding on <span class="html-italic">V. opulus</span> (means ± SD; <span class="html-italic">n</span> = 4). Different letters denote significant differences (one–way ANOVA; Tukey’s test; <span class="html-italic">p</span> &lt; 0.05).</p>
Full article ">
14 pages, 5181 KiB  
Article
New Insights into the Cellular Toxicity of Carbon Quantum Dots to Escherichia coli
by Shirong Qiang, Li Zhang, Zhengbin Li, Jianjun Liang, Ping Li, Jiayu Song, Kunling Guo, Zihuan Wang and Qiaohui Fan
Antioxidants 2022, 11(12), 2475; https://doi.org/10.3390/antiox11122475 - 16 Dec 2022
Cited by 11 | Viewed by 2347
Abstract
In this study, the cytotoxicity and toxic mechanism of carbon quantum dots (CQDs) to E. coli were evaluated in vitro. The synthetic CQDs were extremely small in size (~2.08 nm) and displayed strong fluorescence. The results demonstrated that CQDs showed good biocompatibility with [...] Read more.
In this study, the cytotoxicity and toxic mechanism of carbon quantum dots (CQDs) to E. coli were evaluated in vitro. The synthetic CQDs were extremely small in size (~2.08 nm) and displayed strong fluorescence. The results demonstrated that CQDs showed good biocompatibility with E. coli within a short culture time. However, when the exposure time exceeded 24 h, the toxicity of CQDs became apparent, and the contents of reactive oxygen species, lactate dehydrogenase, and the crystal violet absorption rate increased significantly. To further explore the cytotoxic mechanism, approaches including confocal laser scanning microscopy, scanning electron microscopy, and biological transmission electron microscopy combined with zeta potential tests, osmotic pressure measurement, and comet assays were performed. On the one hand, the CQDs altered the surface charges of cells and induced lipid peroxidation by adhesion on the surface of E. coli, leading to an increase in the permeability of the cell wall. On the other hand, when the concentration of CQDs reached 200 µg/mL, the osmotic pressure of the extracellular environment was significantly reduced. These are the main factors that lead to cell edema and death. Finally, the comet assays confirmed that CQDs could induce DNA damage, which could inhibit the proliferation of E. coli. Full article
Show Figures

Figure 1

Figure 1
<p>Characterizations of carbon quantum dots. (<b>a</b>) TEM, (<b>b</b>) fluorescence of CQDs under ultraviolet irradiation, and (<b>c</b>) fluorescence response of CQDs under different excitation wavelengths.</p>
Full article ">Figure 2
<p>(<b>a</b>) Growth curve of <span class="html-italic">E. coli</span> in different concentrations of CQDs; (<b>b</b>,<b>c</b>) bacteriostatic test results and CFU count of exposure to different concentrations of CQDs (n.s. <span class="html-italic">p</span> &gt; 0.05).</p>
Full article ">Figure 3
<p>Survival rate of <span class="html-italic">E. coli</span> exposed to different concentrations of CQDs measured by MTT method. (<b>a</b>) 24 h, (<b>b</b>) 48 h, and (<b>c</b>) 72 h (n.s. <span class="html-italic">p</span> &gt; 0.05, * <span class="html-italic">p</span> &lt; 0.05, ** <span class="html-italic">p</span> &lt; 0.01, *** <span class="html-italic">p</span> &lt; 0.001, and **** <span class="html-italic">p</span> &lt; 0.0001).</p>
Full article ">Figure 4
<p>Concentrations of MDA and H<sub>2</sub>O<sub>2</sub> produced by <span class="html-italic">E. coli</span> exposed to different concentrations of CQDs. (<b>a</b>) MDA24 h, (<b>b</b>) MDA48 h, and (<b>c</b>) MDA72 h, (<b>d</b>) HRP test (n.s. <span class="html-italic">p</span> &gt; 0.05, ** <span class="html-italic">p</span> &lt; 0.01, *** <span class="html-italic">p</span> &lt; 0.001, and **** <span class="html-italic">p</span> &lt; 0.0001).</p>
Full article ">Figure 5
<p>Effect of CQDs on the <span class="html-italic">E. coli</span> membrane. (<b>a</b>) The amount of LDH released by <span class="html-italic">E. coli</span> at different CQDs concentrations; (<b>b</b>) the uptake rate of crystal violet (n.s. <span class="html-italic">p</span> &gt; 0.05, *** <span class="html-italic">p</span> &lt; 0.001 and **** <span class="html-italic">p</span> &lt; 0.0001).</p>
Full article ">Figure 6
<p>CLSM image of <span class="html-italic">E. coli</span>. (<b>a</b>) Green fluorescence from CQDs, (<b>b</b>) the fluorescence of Dil dye, (<b>c</b>) composite image of (<b>a</b>,<b>b</b>) [CQDs] = 500 μg/mL.</p>
Full article ">Figure 7
<p>SEM image of <span class="html-italic">E. coli</span>. (<b>a</b>) and (<b>b</b>) Control group, (<b>c</b>) and (<b>d</b>) 100 μg/mL, (<b>e</b>) and (<b>f</b>) 500 μg/mL.</p>
Full article ">Figure 8
<p>Ultrathin images of <span class="html-italic">E. coli</span> using a biological transmission electron microscope. (<b>a</b>,<b>b</b>) Blank group, (<b>c</b>,<b>d</b>) 50 μg/mL, (<b>e</b>,<b>f</b>) 100 μg/mL, (<b>g</b>,<b>h</b>) 200 μg/mL, (<b>i</b>,<b>j</b>) 300 μg/mL, and (<b>k</b>,<b>l</b>) 500 μg/mL.</p>
Full article ">Figure 9
<p>Comet experiment results. (<b>a</b>,<b>b</b>) Control group, (<b>c</b>,<b>d</b>) 500 μg/mL.</p>
Full article ">Figure 10
<p>Zeta potential and osmotic pressure of CQD at different concentrations. (<b>a</b>) Zeta potential and (<b>b</b>) osmotic pressure (n.s. <span class="html-italic">p</span> &gt; 0.05, * <span class="html-italic">p</span> &lt; 0.05, ** <span class="html-italic">p</span> &lt; 0.01, *** <span class="html-italic">p</span> &lt; 0.001, and **** <span class="html-italic">p</span> &lt; 0.0001).</p>
Full article ">
23 pages, 2395 KiB  
Article
Sidestream Smoke Extracts from Harm-Reduction and Conventional Camel Cigarettes Inhibit Osteogenic Differentiation via Oxidative Stress and Differential Activation of intrinsic Apoptotic Pathways
by Nicole R. L. Sparks, Lauren M. Walker, Steven R. Sera, Joseph V. Madrid, Michael Hanna, Edward C. Dominguez and Nicole I. zur Nieden
Antioxidants 2022, 11(12), 2474; https://doi.org/10.3390/antiox11122474 - 15 Dec 2022
Cited by 4 | Viewed by 2266
Abstract
Epidemiological studies suggest cigarette smoking as a probable environmental factor for a variety of congenital anomalies, including low bone mass, increased fracture risk and poor skeletal health. Human and animal in vitro models have confirmed hypomineralization of differentiating cell lines with sidestream smoke [...] Read more.
Epidemiological studies suggest cigarette smoking as a probable environmental factor for a variety of congenital anomalies, including low bone mass, increased fracture risk and poor skeletal health. Human and animal in vitro models have confirmed hypomineralization of differentiating cell lines with sidestream smoke being more harmful to developing cells than mainstream smoke. Furthermore, first reports are emerging to suggest a differential impact of conventional versus harm-reduction tobacco products on bone tissue as it develops in the embryo or in vitro. To gather first insight into the molecular mechanism of such differences, we assessed the effect of sidestream smoke solutions from Camel (conventional) and Camel Blue (harm-reduction) cigarettes using a human embryonic stem cell osteogenic differentiation model. Sidestream smoke from the conventional Camel cigarettes concentration-dependently inhibited in vitro calcification triggered by high levels of mitochondrially generated oxidative stress, loss of mitochondrial membrane potential, and reduced ATP production. Camel sidestream smoke also induced DNA damage and caspase 9-dependent apoptosis. Camel Blue-exposed cells, in contrast, invoked only intermediate levels of reactive oxygen species insufficient to activate caspase 3/7. Despite the absence of apoptotic gene activation, damage to the mitochondrial phenotype was still noted concomitant with activation of an anti-inflammatory gene signature and inhibited mineralization. Collectively, the presented findings in differentiating pluripotent stem cells imply that embryos may exhibit low bone mineral density if exposed to environmental smoke during development. Full article
(This article belongs to the Special Issue Oxidative Stress in Human Toxicology)
Show Figures

Graphical abstract

Graphical abstract
Full article ">Figure 1
<p>Differentiation inhibition caused by harm-reduction tobacco exposure occurred through intermediate levels of reactive oxygen species. (<b>A</b>) Schematic of experimental design and exposure scheme. Created with BioRender.com. (<b>B</b>) Mineralization assay using Arsenazo III to determine osteogenic differentiation efficiency after exposure to previously identified effective doses of Camel cigarette smoke extracts [<a href="#B9-antioxidants-11-02474" class="html-bibr">9</a>] within different time windows. (<b>C</b>) <span class="html-italic">RUNX2</span> mRNA expression measured with qRT-PCR, normalized to <span class="html-italic">GAPDH</span> and compared to the untreated control, set at 1; <span class="html-italic">n</span> = 3 ± SD. (<b>D</b>) Superoxide anion content measured upon reaction of the cells with luminol and charted as percent of the untreated cultures; d7, <span class="html-italic">n</span> = 3 ± SD. (<b>E</b>) Cells were exposed for seven days, incubated with MitoSOX, photographed and positive cells counted. Only Camel exposure elicited a significant increase specifically in mitochondrial oxidative stress. (<b>F</b>) Calcium deposit was quantified from cultures exposed for 20 days with and without concomitant addition of antioxidants. Effective doses of tobacco smoke solutions and extracts reduced calcification, which was rescued with antioxidant treatment; <span class="html-italic">n</span> = 3 ± SD. * <span class="html-italic">p</span> &lt; 0.05, One-Way ANOVA versus untreated cultures. AA, ascorbic acid; ED, effective dose; GSHOEt, glutathione reduced ethyl ester; MS, mainstream; NED, non-effective dose; RLU, relative light unit; SS, sidestream; UT, untreated solvent control; VitE, Vitamin E.</p>
Full article ">Figure 2
<p>Medium throughput transcript analysis reveals common and differentially expressed apoptosis-related mRNAs in hESCs exposed to conventional and harm-reduction Camel smoke extracts. (<b>A</b>,<b>B</b>) Heat maps of apoptotic mRNAs de-regulated in tobacco exposed hESCs as measured with the RT<sup>2</sup> qPCR array for apoptosis. * <span class="html-italic">p</span> &lt; 0.05 vs UT. (<b>C</b>) VENN diagrams showing relations between differentially expressed transcripts in dependence of cigarette smoke extract type (log<sub>2</sub>FC &gt; 1; Adj. <span class="html-italic">p</span>-value &lt; 0.05). Venn diagrams were generated with Venny 2.0 [<a href="#B28-antioxidants-11-02474" class="html-bibr">28</a>]. (<b>D</b>) Table identifying the transcripts uniquely regulated by the two cigarette smoke extracts. (<b>E</b>) Volcano Plot for Camel SS ED and Camel Blue SS ED exposed cells. ED, effective dose; FC, fold change; NED, non-effective dose; SS, sidestream; UT, untreated solvent control.</p>
Full article ">Figure 3
<p>Camel Blue SS elicits a weaker apoptosis response than Camel SS. (<b>A</b>) RT<sup>2</sup> qPCR array for apoptosis identified distinct expression patterns of various caspase isoforms between Camel and Camel Blue SS smoke exposed cells. <span class="html-italic">n</span> = 3 ± SD. * <span class="html-italic">p</span> &lt; 0.05, two-tailed <span class="html-italic">t</span>-test. <sup>Δ</sup> <span class="html-italic">p</span> &lt; 0.05, two-tailed <span class="html-italic">t</span>-test between Camel SS ED and Camel Blue SS ED. (<b>B</b>) Western blots revealed the differential activation of caspases associated with extrinsic and intrinsic apoptotic pathways. (<b>C</b>) Accordingly, the executioner caspases 3/7 were highly activated in cells exposed to Camel, but only mildly when exposed to Camel Blue. Antioxidant treatment inhibited this activation. Insets show brightfield images of the same field of view. Bar = 100 µM. (<b>C’</b>) The ratio of <span class="html-italic">BCL2</span> to <span class="html-italic">BAX</span> mRNA expression suggested an anti-apoptotic response in Camel Blue SS cultures. (<b>D</b>) Inhibition of these caspases rescued calcification in cells treated with effective doses of tobacco products; <span class="html-italic">n</span> = 5 ± SD. * <span class="html-italic">p</span> &lt; 0.05, One-Way ANOVA versus untreated cultures. <sup>Δ</sup> <span class="html-italic">p</span> &lt; 0.05, One-Way ANOVA versus ED. (<b>E</b>) Some proapoptotic genes were found upregulated in both Camel and Camel Blue SS cultures. <span class="html-italic">n</span> = 5 ± SD. * <span class="html-italic">p</span> &lt; 0.05, two-tailed <span class="html-italic">t</span>-test. <sup>Δ</sup> <span class="html-italic">p</span> &lt; 0.05, two-tailed <span class="html-italic">t</span>-test between Camel SS ED and Camel Blue SS ED. (<b>F</b>) LIVE/DEAD assay revealed cell death in cells exposed to conventional smoke extracts only. 4i, caspase 4 inhibitor; 8i, caspase 8 inhibitor; 9i, caspase 9 inhibitor; AA, ascorbic acid; ED, effective dose; NED, non-effective dose; SS, sidestream; UT, untreated solvent control.</p>
Full article ">Figure 4
<p>Reduced viability in hESCs exposed to conventional Camel extract is due to DNA damage. (<b>A</b>) RT<sup>2</sup> qPCR array for apoptosis found upregulation of genes associated with DNA damage response in Camel SS smoke exposed cells. <span class="html-italic">n</span> = 3 ± SD. * <span class="html-italic">p</span> &lt; 0.05, two-tailed <span class="html-italic">t</span>-test versus UT, <sup>Δ</sup> <span class="html-italic">p</span> &lt; 0.05, two-tailed <span class="html-italic">t</span>-test between Camel SS ED and Camel Blue SS ED. (<b>B</b>) Western blots confirmed ABL1 activation in Camel SS effective doses at the protein level. (<b>C</b>,<b>D</b>) Comet assays confirm DNA damage in response to Camel exposure, which was absent in Camel Blue exposed cells and cells treated with antioxidant. <span class="html-italic">n</span> = 3 ± SD. * <span class="html-italic">p</span> &lt; 0.05, One-Way ANOVA versus untreated cultures. Scale bar = 63×. 9i, caspase 9 inhibitor; AA, ascorbic acid; ED, effective dose; NED, non-effective dose; SS, sidestream; UT, untreated solvent control.</p>
Full article ">Figure 5
<p>Deterioration of mitochondrial health in exposed hESCs. (<b>A</b>) Mitochondrial membrane potential measurements revealed a reduced membrane potential in Camel exposed cells as a sign for execution of the intrinsic apoptotic pathway. * <span class="html-italic">p</span> &lt; 0.05, One-Way ANOVA versus untreated or NED cultures (<b>B</b>) AMP-to-ATP ratio was increased in Camel SS ED, suggesting mitochondrial dysfunction. * <span class="html-italic">p</span> &lt; 0.05, One-Way ANOVA versus untreated cultures. (<b>C</b>) qPCR array analysis revealed upregulation of mRNAs associated with integral mitochondrial apoptosis in both Camel SS and Camel Blue SS ED. * <span class="html-italic">p</span> &lt; 0.05, two-tailed <span class="html-italic">t</span>-test versus untreated control, <sup>Δ</sup> <span class="html-italic">p</span> &lt; 0.05, two-tailed <span class="html-italic">t</span>-test between Camel SS ED and Camel Blue SS ED. ED, effective dose; NED, non-effective dose; SS, sidestream; UT, untreated solvent control.</p>
Full article ">Figure 6
<p>Tobacco smoke exposure elicits changes in mitochondrial networks. (<b>A</b>) MitoTracker and MiNA visualization of mitochondrial networks, magnification 63×. (<b>A’</b>) MitoTracker dye analysis revealed increased mitochondrial signal in the Camel Blue SS effective dose. * <span class="html-italic">p</span> &lt; 0.05, One-Way ANOVA versus untreated cultures. (<b>B</b>) Changes to mitochondrial networks were assessed via mean branch length, mitochondrial footprint, and branches per network. * <span class="html-italic">p</span> &lt; 0.05, One-Way ANOVA versus untreated cultures, <sup>Δ</sup> <span class="html-italic">p</span> &lt; 0.05, One-Way ANOVA versus ED, x denotes max or min outliers. 4i, caspase 4 inhibitor; 9i, caspase 9 inhibitor; C, Camel; CB, Camel Blue; ED, effective dose; NED, non-effective dose; SS, sidestream; UT, untreated solvent control.</p>
Full article ">
18 pages, 4774 KiB  
Article
Comparison of the Retention Rates of Synthetic and Natural Astaxanthin in Feeds and Their Effects on Pigmentation, Growth, and Health in Rainbow Trout (Oncorhynchus mykiss)
by Wei Zhao, Yu-Cai Guo, Ming-Yan Huai, Lily Li, Chi Man, Wolf Pelletier, Han-Lin Wei, Rong Yao and Jin Niu
Antioxidants 2022, 11(12), 2473; https://doi.org/10.3390/antiox11122473 - 15 Dec 2022
Cited by 16 | Viewed by 3256
Abstract
The coloring efficiency and physiological function of astaxanthin in fish vary with its regions. The aim of this study was to compare the retention rates of dietary astaxanthin from different sources and its effects on growth, pigmentation, and physiological function in Oncorhynchus mykiss [...] Read more.
The coloring efficiency and physiological function of astaxanthin in fish vary with its regions. The aim of this study was to compare the retention rates of dietary astaxanthin from different sources and its effects on growth, pigmentation, and physiological function in Oncorhynchus mykiss. Fish were fed astaxanthin-supplemented diets (LP: 0.1% Lucantin® Pink CWD; CP: 0.1% Carophyll® Pink; EP: 0.1% Essention® Pink; PR: 1% Phaffia rhodozyma; HP: 1% Haematococcus pluvialis), or a diet without astaxanthin supplementation, for 56 days. Dietary astaxanthin enhanced pigmentation as well as the growth of the fish. The intestinal morphology of fish was improved, and the crude protein content of dorsal muscle significantly increased in fish fed with astaxanthin. Moreover, astaxanthin led to a decrease in total cholesterol levels and alanine aminotransferase and aspartate aminotransferase activity in plasma. Fish fed on the CP diet also produced the highest level of umami amino acids (aspartic acid and glutamic acid). Regarding antioxidant capacity, astaxanthin increased Nrf2/HO-1 signaling and antioxidant enzyme activity. Innate immune responses, including lysozyme and complement systems, were also stimulated by astaxanthin. Lucantin® Pink CWD had the highest stability in feed and achieved the best pigmentation, Essention® Pink performed best in growth promotion and Carophyll® Pink resulted in the best flesh quality. H. pluvialis was the astaxanthin source for achieving the best antioxidant properties and immunity of O. mykiss. Full article
Show Figures

Graphical abstract

Graphical abstract
Full article ">Figure 1
<p>Comparison of pigmentation in the dorsal muscle of <span class="html-italic">Oncorhynchus mykiss</span> fed on an experimental diet for 56 days ((<b>A</b>) Visual color inspection; (<b>B</b>) Salmon color fan value). The color value of fresh fillet in <span class="html-italic">Oncorhynchus mykiss</span> fed on experimental diets. Values are presented as mean ± SE, n = 12. Different letters represent statistical differences (<span class="html-italic">p</span> &lt; 0.05).</p>
Full article ">Figure 2
<p>Long-chain fatty acid levels in the abdominal muscle of <span class="html-italic">Oncorhynchus mykiss</span> fed with the experimental diets for 56 days. Values are presented as mean ± SE, n = 4. The superscript letters indicate a significant difference at <span class="html-italic">p</span> &lt; 0.05.</p>
Full article ">Figure 3
<p>The intestinal histology of <span class="html-italic">Oncorhynchus mykiss</span> was fed with experimental diets for 56 days. Magnification 200×.</p>
Full article ">Figure 4
<p>Effects of different diet treatments on the intestinal morphometry of <span class="html-italic">Oncorhynchus mykiss</span>. Values are presented as mean ± SE, n = 12. The superscript letters indicated significant differences at <span class="html-italic">p</span> &lt; 0.05.</p>
Full article ">Figure 5
<p>Effects of different diet treatments on the plasma parameters of <span class="html-italic">Oncorhynchus mykiss</span>. Values are presented as mean ± SE, n = 12. The superscript letters indicated significant differences at <span class="html-italic">p</span> &lt; 0.05.</p>
Full article ">Figure 6
<p>Effects of different diet treatments on antioxidant parameters in <span class="html-italic">Oncorhynchus mykiss</span>. Values are presented as mean ± SE, n = 12. The superscript letters indicate significant differences at <span class="html-italic">p</span> &lt; 0.05.</p>
Full article ">Figure 7
<p>Effects of different diet treatments on the expression of antioxidant-related genes in the liver of <span class="html-italic">Oncorhynchus mykiss</span>. Values are presented as mean ± SE, n = 12. The superscript letters indicated significant differences at <span class="html-italic">p</span> &lt; 0.05.</p>
Full article ">Figure 8
<p>Effects of different diet treatments on the expression of immune-related genes in the liver of <span class="html-italic">Oncorhynchus mykiss</span>. Values are presented as mean ± SE, n = 12. The superscript letters indicated significant differences at <span class="html-italic">p</span> &lt; 0.05.</p>
Full article ">
21 pages, 2677 KiB  
Article
In Vitro and In Silico Evaluation of the Antimicrobial and Antioxidant Potential of Thymus pulegioides Essential Oil
by Călin Jianu, Laura-Cristina Rusu, Iulia Muntean, Ileana Cocan, Alexandra Teodora Lukinich-Gruia, Ionuț Goleț, Delia Horhat, Marius Mioc, Alexandra Mioc, Codruța Șoica, Gabriel Bujancă, Adrian Cosmin Ilie and Delia Muntean
Antioxidants 2022, 11(12), 2472; https://doi.org/10.3390/antiox11122472 - 15 Dec 2022
Cited by 8 | Viewed by 2313
Abstract
The study was designed to analyze and evaluate the antioxidant and antibacterial properties of the essential oils of Thymus pulegioides L. grown in Western Romania. Thymus pulegioides L. essential oil (TPEO) was extracted by steam distillation (0.71% v/w) using a Craveiro-type apparatus. [...] Read more.
The study was designed to analyze and evaluate the antioxidant and antibacterial properties of the essential oils of Thymus pulegioides L. grown in Western Romania. Thymus pulegioides L. essential oil (TPEO) was extracted by steam distillation (0.71% v/w) using a Craveiro-type apparatus. GC-MS investigation of the TPEO identified 39 different compounds, representing 98.46% of total oil. Findings revealed that thymol (22.89%) is the main compound of TPEO, followed by para-cymene (14.57%), thymol methyl ether (11.19%), isothymol methyl ether (10.45%), and beta-bisabolene (9.53%). The oil exhibits good antibacterial effects; C. parapsilosis, C. albicans, S. pyogenes, and S. aureus were the most sensitive strains. The antioxidant activity of TPEO was evaluated by peroxide and thiobarbituric acid value, 1,1-diphenyl-2-picrylhydrazyl radical (DPPH), [2,2′-azinobis(3-ethylbenzothiazoline-6-sulfonic acid) diammonium] (ABTS) radical scavenging assay, and beta-carotene/linoleic acid bleaching testing. The antioxidative data recorded reveal, for the first time, that TPEO inhibits primary and secondary oxidation products, in some particular conditions, better than butylated hydroxyanisole (BHA) with significant statistical difference (p < 0.05). Moreover, TPEO antioxidant capabilities in DPPH and ABTS assays outperformed alpha-tocopherol (p < 0.001) and delta-tocopherol (p < 0.001). Molecular docking analysis revealed that one potential target correlated with the TPEO antimicrobial activity was d-alanine-d-alanine ligase (DDl). The best scoring ligand, linalyl anthranilate, shared highly similar binding patterns with the DDl native inhibitor. Furthermore, molecular docking analysis also showed that the main constituents of TPEO are good candidates for xanthine oxidase and lipoxygenase inhibition, making the essential oil a valuable source for protein-targeted antioxidant compounds. Consequently, TPEO may represent a new potential source of antioxidant and antibacterial agents with applicability in the food and pharmaceutic industries. Full article
Show Figures

Figure 1

Figure 1
<p>The influence of BHT, BHA, and TPEO on PVs (<b>A</b>) and TBA values (<b>B</b>) of sunflower oil samples during 24 days of storage. Values are expressed as means ± SD (n = 9).</p>
Full article ">Figure 2
<p>Graphical representation of the docking scores related to antimicrobial protein targets, corresponding to 39 TPEO components (<b>A</b>) and 7 major TPEO constituents (<b>B</b>) (representing over 75% of the oil); docking scores calculated as a percentage of the native ligand’s score of each target protein; the results are plotted in the form of a radar chart where docking scores (recalculated as a percentage of the native ligand’s docking score) of each compound, represent a series and the target proteins are in the corner of the graph.</p>
Full article ">Figure 3
<p>The structure of DDl (2I80) in complex with docked compound 24 (linalyl anthranilate) interacting with highlighted amino acids (cyan) Val19, Glu16, Pro311 and Thr23; HB interactions are depicted as green dotted lines and hydrophobic interactions as purple dotted lines.</p>
Full article ">Figure 4
<p>Graphical representation of the docking scores related to antioxidant protein targets, corresponding to 39 TPEO components (<b>A</b>) and 7 major TPEO constituents (<b>B</b>) (representing over 75% of the essential oil); docking scores calculated as a percentage of the native ligand’s score of each target protein; the results are plotted in the form of a radar chart where docking scores (recalculated as a percentage of the native ligand’s docking score) of each compound, represent a series and the target proteins are in the corner of the graph.</p>
Full article ">Figure 5
<p>Structure of lipoxygenase (1N8Q) in complex with docked compound 26 (carvacrol) interacting with highlighted amino acids (cyan) Gln514, His518, and Trp519 through HB; hydrophobic interactions are omitted for better picture quality.</p>
Full article ">Figure 6
<p>Structure of xanthine oxidase (3NRZ) in complex with docked compound 26 (carvacrol) interacting with highlighted amino acids (cyan) Glu802, Phe914, Phe1009, Ala1078 and Ala1079; HB interactions are depicted as green dotted lines and hydrophobic interactions as purple dotted lines.</p>
Full article ">
20 pages, 6432 KiB  
Article
Preparation of an Antioxidant Assembly Based on a Copolymacrolactone Structure and Erythritol following an Eco-Friendly Strategy
by Aurica P. Chiriac, Alina Ghilan, Alexandru-Mihail Serban, Ana-Maria Macsim, Alexandra Bargan, Florica Doroftei, Vlad Mihai Chiriac, Loredana Elena Nita, Alina Gabriela Rusu and Andreea-Isabela Sandu
Antioxidants 2022, 11(12), 2471; https://doi.org/10.3390/antiox11122471 - 15 Dec 2022
Cited by 3 | Viewed by 1493
Abstract
The study presents the achievement of a new assembly with antioxidant behaviour based on a copolymacrolactone structure that encapsulates erythritol (Eryt). Poly(ethylene brassylate-co-squaric acid) (PEBSA) was synthesised in environmentally friendly conditions, respectively, through a process in suspension in water by opening the cycle [...] Read more.
The study presents the achievement of a new assembly with antioxidant behaviour based on a copolymacrolactone structure that encapsulates erythritol (Eryt). Poly(ethylene brassylate-co-squaric acid) (PEBSA) was synthesised in environmentally friendly conditions, respectively, through a process in suspension in water by opening the cycle of ethylene brassylate macrolactone, followed by condensation with squaric acid. The compound synthesised in suspension was characterised by comparison with the polymer obtained by polymerisation in solution. The investigations revealed that, with the exception of the molecular masses, the compounds generated by the two synthetic procedures present similar properties, including good thermal stability, with a Tpeak of 456 °C, and the capacity for network formation. In addition, the investigation by dynamic light scattering techniques evidenced a mean diameter for PEBSA particles of around 596 nm and a zeta potential of −25 mV, which attests to their stability. The bio-based copolymacrolactone was used as a matrix for erythritol encapsulation. The new PEBSA–Eryt compound presented an increased sorption/desorption process, compared with the PEBSA matrix, and a crystalline morphology confirmed by X-ray diffraction analysis. The bioactive compound was also characterised in terms of its biocompatibility and antioxidant behaviour. Full article
(This article belongs to the Section Natural and Synthetic Antioxidants)
Show Figures

Figure 1

Figure 1
<p>FTIR spectra of PEBSA_suspension and PEBSA_solution (<b>a</b>) and comparative PEBSA_Eryt samples (<b>b</b>).</p>
Full article ">Figure 2
<p>Chemical structure of monomers, copolymacrolactone, and notation of protons.</p>
Full article ">Figure 3
<p><sup>1</sup>H-NMR spectra of PEBSA_solution, PEBSA_suspension, and PEBSA_Eryt samples.</p>
Full article ">Figure 4
<p>(<b>a</b>) DTG curve and (<b>b</b>) TG and DTA curve.</p>
Full article ">Figure 5
<p>Schematised illustration of the synthesis of PEBSA and PEBSA_Eryt bioactive structure.</p>
Full article ">Figure 6
<p>Size distribution of PEBSA_suspension, Eryt, and PEBSA_Eryt bioactive compound.</p>
Full article ">Figure 7
<p>Sorption/desorption isotherms for the studied samples.</p>
Full article ">Figure 8
<p>XRD diffractograms of PEBSA_Eryt, Eryt, and PEBSA_suspension.</p>
Full article ">Figure 9
<p>SEM images of the synthesised copolymers: (<b>a</b>) PEBSA_solution and (<b>b</b>) PEBSA_suspension at different amplifications (5 μm and 2 μm).</p>
Full article ">Figure 10
<p>TEM micrographs of PEBSA–Eryt compound.</p>
Full article ">Figure 11
<p>The scavenging activity percentage of Eryt and PEBSA_Eryt samples.</p>
Full article ">Figure 12
<p>Cytotoxicity of HGF cells that were under treatment for 24 h with the tested compounds. The results are presented as a mean value ± the standard error of the mean (S.E.M.), <span class="html-italic">n</span> = 5; the differences were not statistically significant.</p>
Full article ">
Previous Issue
Next Issue
Back to TopTop