


Google Earth Engine and Machine Learning for Flash Flood Exposure Mapping—Case Study: Tetouan, Morocco
<p>Study area: (<b>1</b>) North Africa, Morocco; (<b>2</b>) Tanger<tt>–</tt>Tetouan<tt>–</tt>Al Hoceima region; (<b>3</b>) Tetouan Province; (<b>4</b>) Tetouan city.</p> "> Figure 2
<p>The database used: (<b>A</b>) an overview of the study area’s satellite imagery, (<b>B</b>) the elevation distribution based on the digital elevation model (DEM) of the study area, (<b>C</b>) the population density repartition in the study area, (<b>D</b>) the flooded (red points) and non-flooded (green points) locations in the study area.</p> "> Figure 3
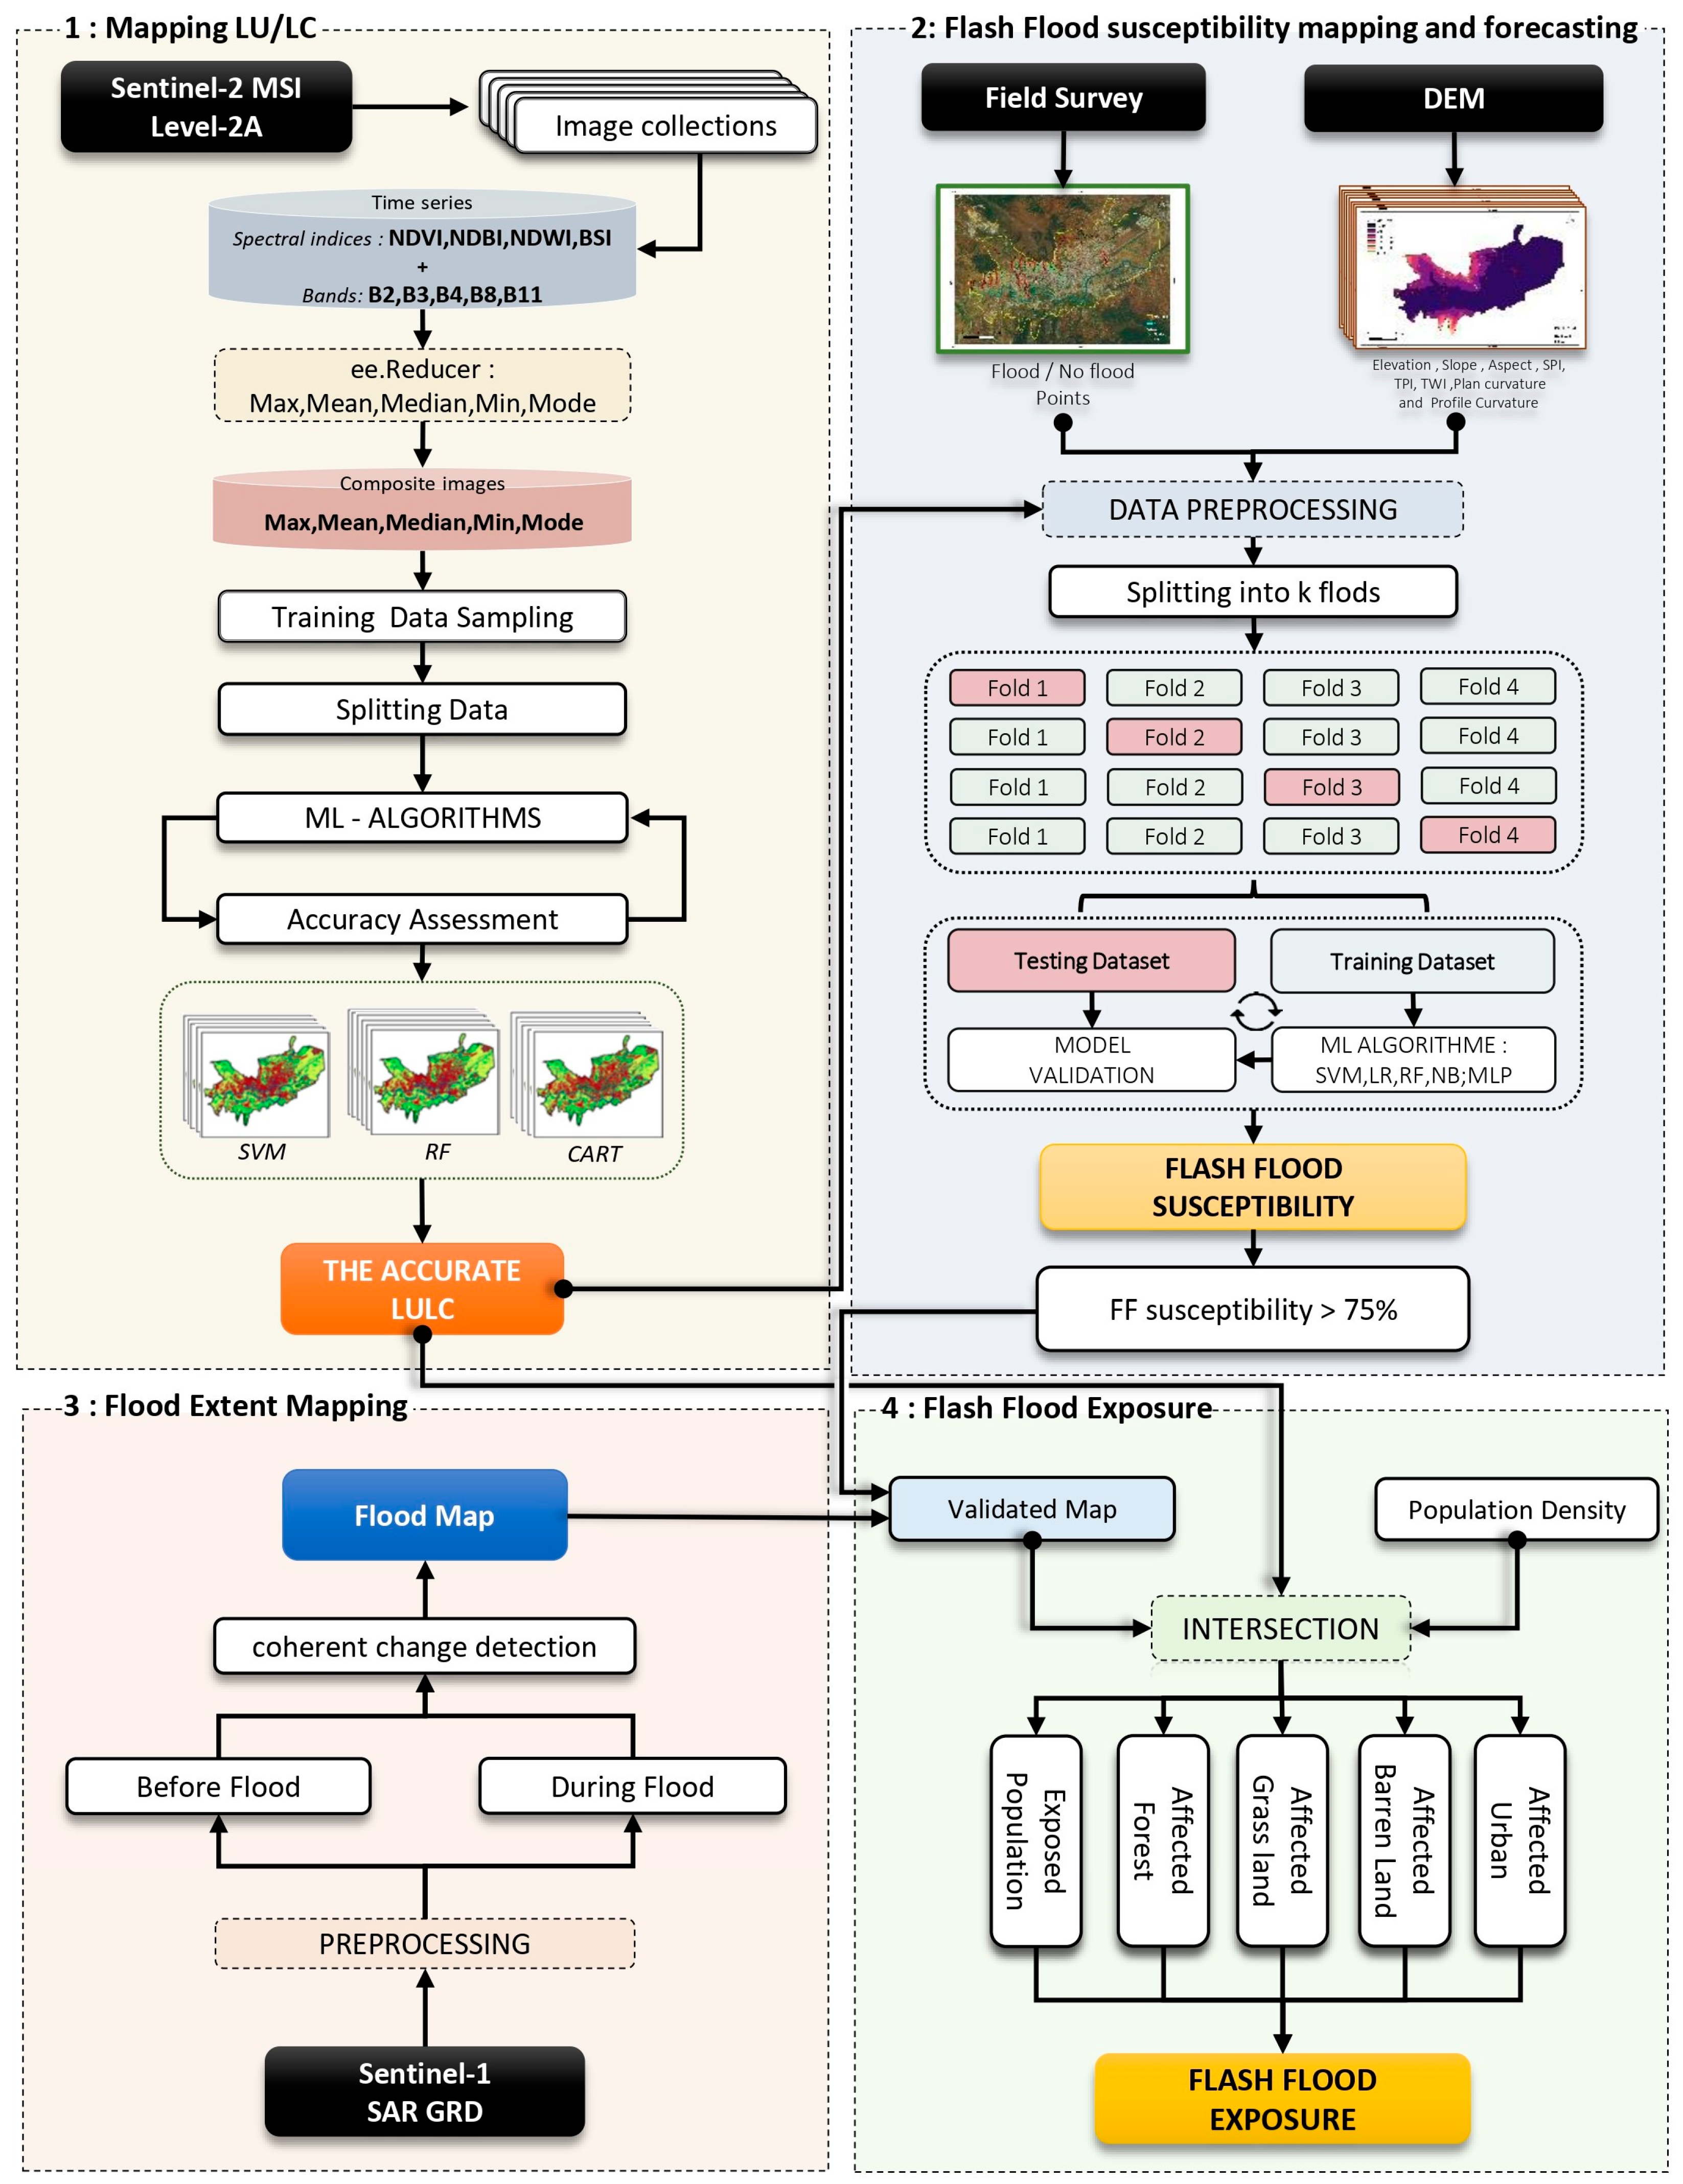
<p>The proposed methodology flowchart: (<b>1</b>) Mapping LULC; (<b>2</b>) FF susceptibility mapping and forecasting; (<b>3</b>) FF extent mapping; (<b>4</b>) FF exposure.</p> "> Figure 4
<p>Flash flood conditioning factors in the study area: (<b>A</b>) Geographical distribution of flooded and non-flooded locations from the field survey, (<b>B</b>) LU/LC, (<b>C</b>) SPI, (<b>D</b>) Plan curvature.</p> "> Figure 5
<p>Flash flood conditioning factors in the study area: (<b>A</b>) Profile curvature, (<b>B</b>) TPI, (<b>C</b>) TWI, (<b>D</b>) Elevation, (<b>E</b>) Slope, and (<b>F</b>) Aspect.</p> "> Figure 6
<p>Synthetic Aperture Radar (SAR) images showing the study area before (<b>left</b>) and during (<b>right</b>) the flash flood.</p> "> Figure 7
<p>Land use and land cover classification of the study area (<b>1</b>–<b>15</b>) for each composite image ((<b>A</b>) Max; (<b>B</b>) Mean; (<b>C</b>) Median; (<b>D</b>) Min; (<b>E</b>) Mode), generated using machine learning algorithms ((<b>I</b>) SVM, (<b>II</b>) RF, (<b>III</b>) CART).</p> "> Figure 8
<p>The influence of the choice of dataset on classification performance: Evaluation of the impact of different datasets (max, mean, median, min, and mode) on LU/LC classification performance using overall accuracy and the Kappa index for each machine learning algorithm used (SVM, RF, and CART).</p> "> Figure 9
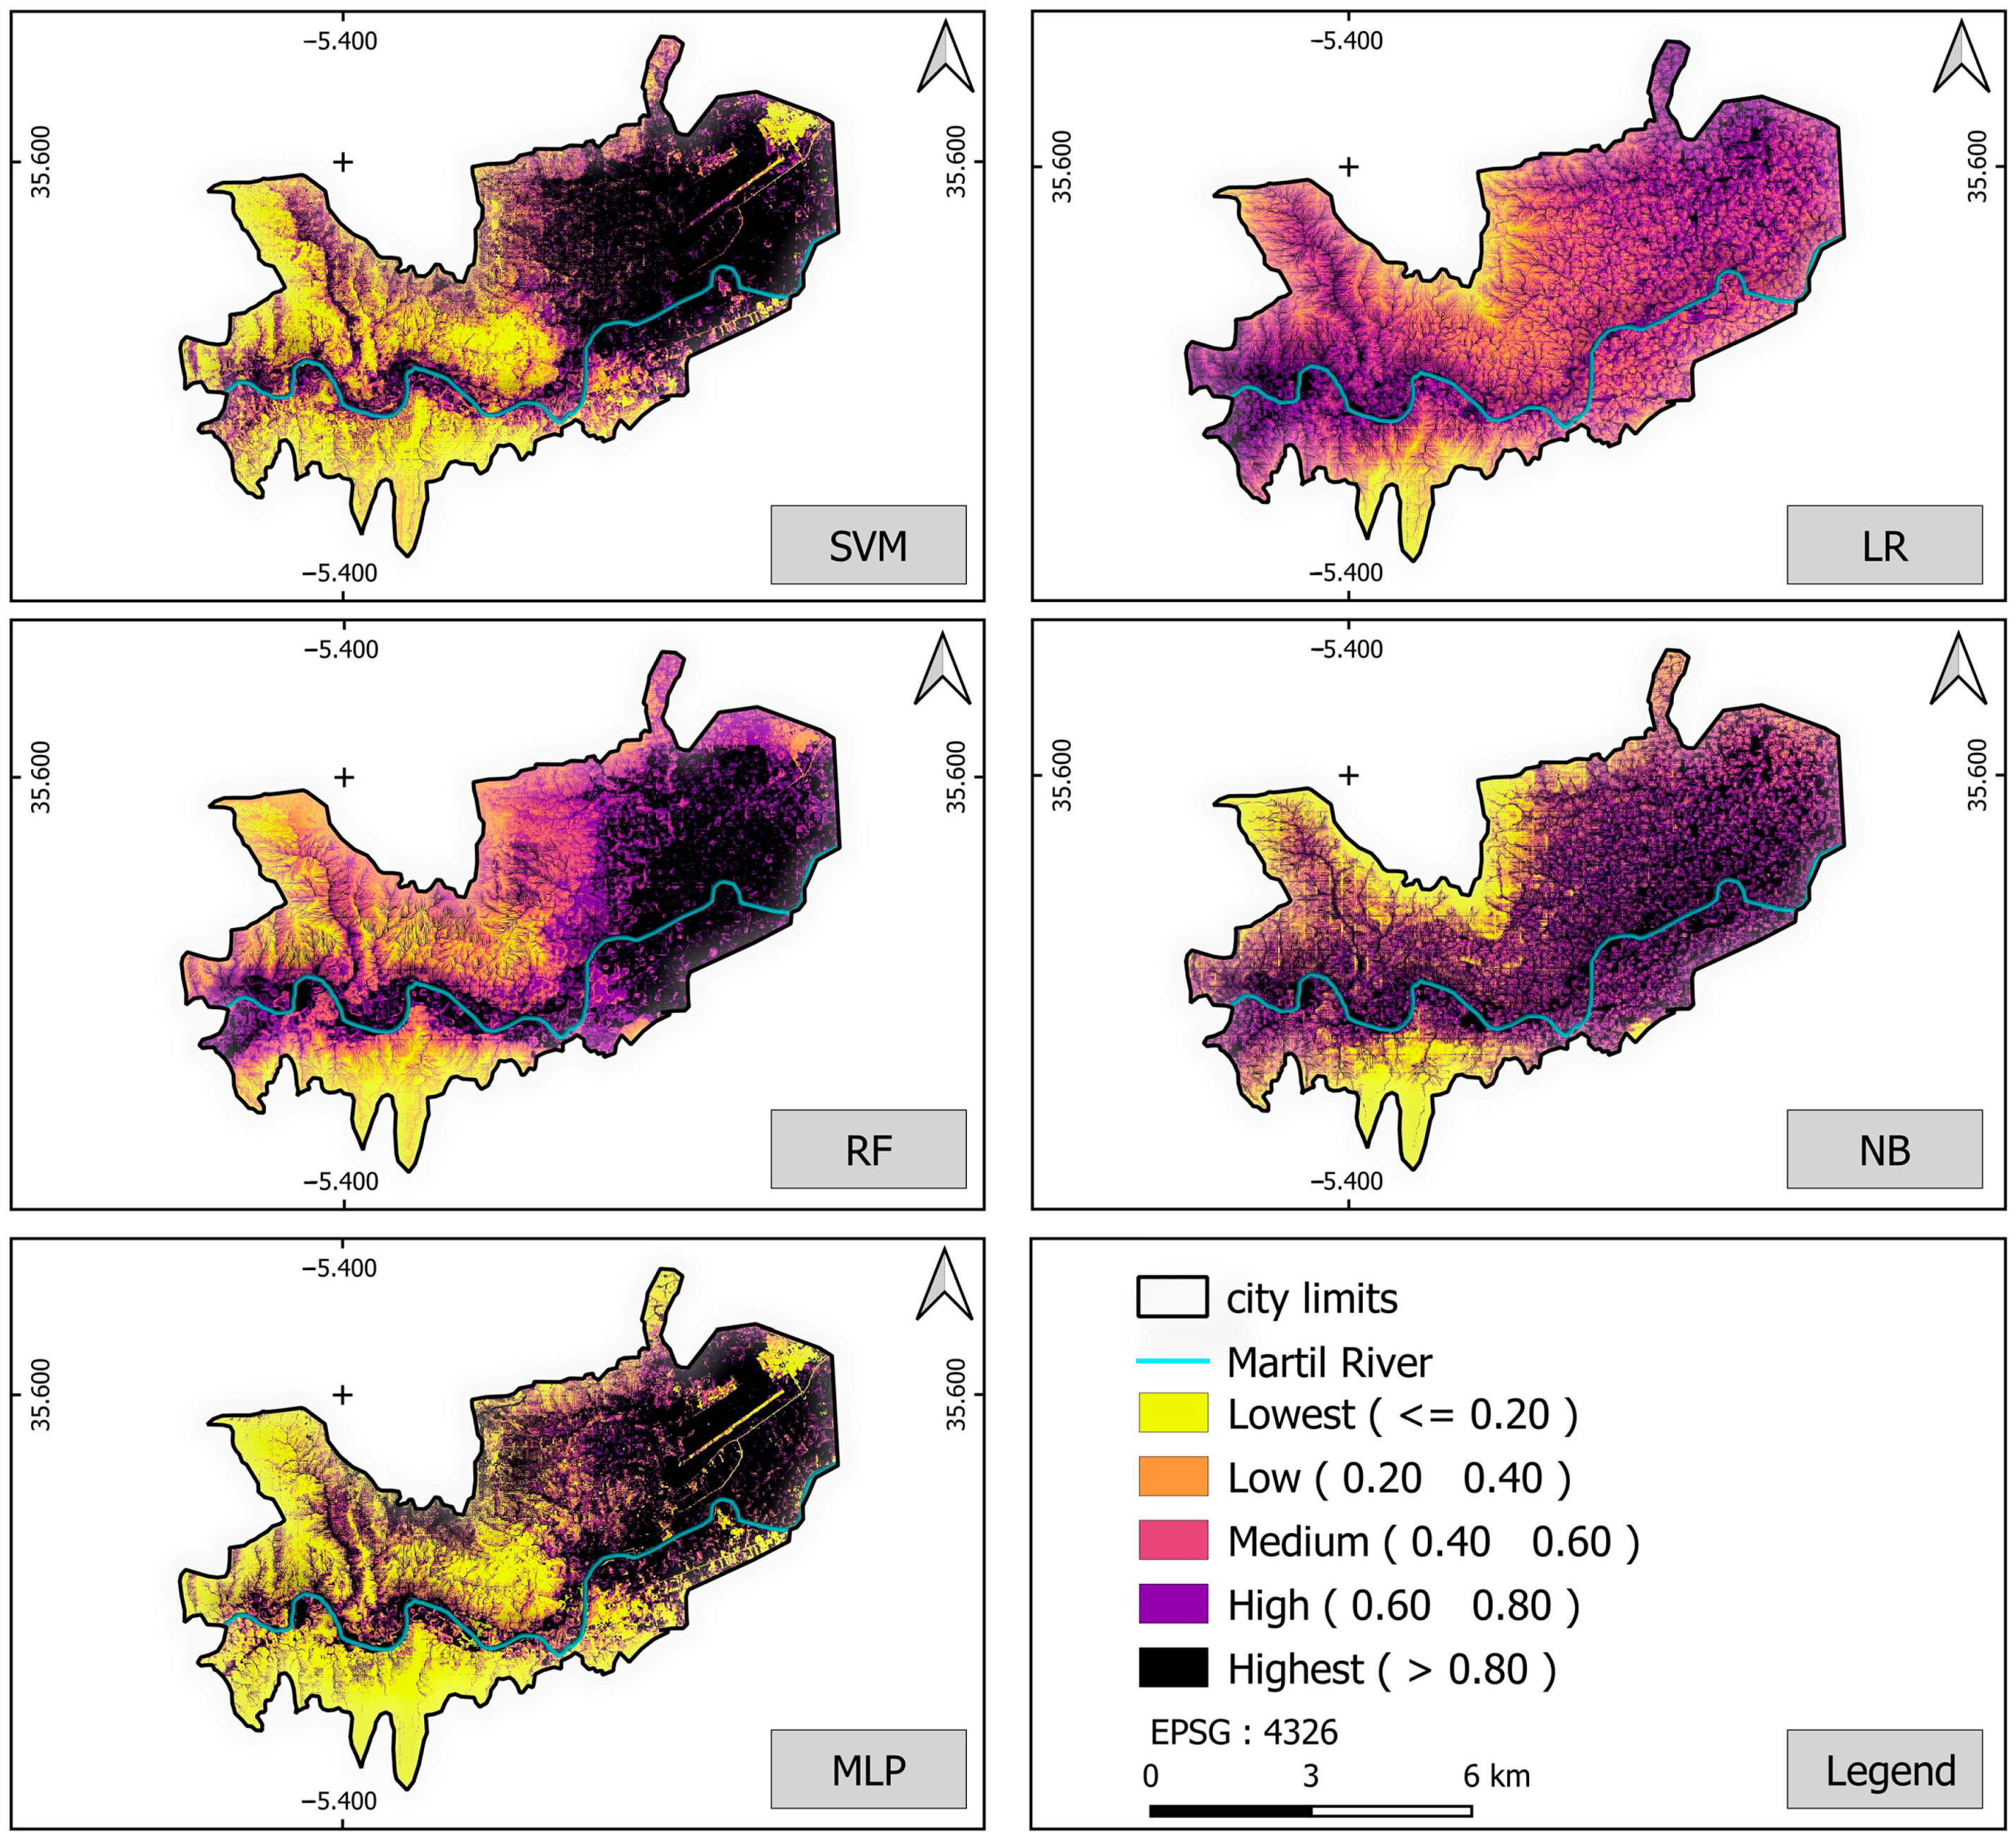
<p>Flash Flood susceptibility maps generated using machine learning algorithms: Support Vector Machine (SVM), Logistic Regression (LR), Random Forest (RF), Naive Bayes (NB), and Multilayer Perceptron (MLP). Each map categorizes the study area into five levels of flood susceptibility: highest, high, moderate, low, and lowest.</p> "> Figure 10
<p>Comparison of the performance of the machine learning algorithms used (SVM, LR, RF, NB, and MLP) for flash flood susceptibility using precision, recall, F1 score, and Kappa.</p> "> Figure 11
<p>Performance comparison of the machine learning algorithms used (SVM, LR, RF, NB, and MLP) using Receiver operating characteristic (ROC) curves.</p> "> Figure 12
<p>Pairwise correlation matrix of variables used in the study: LU/LC, aspect, TWI, TPI, slope, profile curvature, plan curvature, X, Y, SPI, flood, and non-flood.</p> "> Figure 13
<p>Comparison of the relative importance of the different factors used for flash food susceptibility mapping, as identified by Random Forest (RF) (<b>A</b>) and Multilayer Perceptron (MLP) (<b>B</b>).</p> "> Figure 14
<p>Flash flooding extent of the study area using Synthetic Aperture Radar (SAR) data. Flash flood areas are shown in blue.</p> "> Figure 15
<p>Superposition of high flash flood susceptibility and SAR flash flood data. Areas of high flash flood susceptibility are shown in yellow. Areas detected as inundated using Synthetic Aperture Radar (SAR) data are shown in blue.</p> "> Figure 16
<p>Overview of the Google Earth Engine application showing exposure to flash floods in the study area. Affected forest areas are shown in dark green, affected vegetation in light green, affected urban areas in red, and affected barren areas in yellow.</p> "> Figure 17
<p>Distribution of the population potentially exposed to flash flooding in the study area based on the population density.</p> "> Figure 18
<p>Flash flood exposure in the study areas: Colors represent affected areas: dark green (forest), light green (vegetation), red (urban), and yellow (barren land).</p> ">
Abstract
:1. Introduction
2. Materials and Methods
2.1. Study Area
2.2. Data
2.2.1. Satellite Imagery
2.2.2. Digital Elevation Model
2.2.3. Flash Flood and Non-Flash-Flood Areas
2.2.4. Population Density
2.3. Methods
2.3.1. Mapping LULC
2.3.2. Mapping and Forecasting of Flash Flood Susceptibility
Land Use Land Cover (LULC)
Stream Power Index (SPI)
Plan Curvature
Profile Curvature
Topographic Position Index
Topographic Wetness Index
Elevation
Slope
Aspect
2.3.3. Flash Flood Extent Mapping
2.3.4. Damage Assessment—Flash Flood Exposure
2.4. Machine Learning Algorithms
2.4.1. Support Vector Machine (SVM)
2.4.2. Logistic Regression (LR)
2.4.3. Random Forest (RF)
2.4.4. Naïve Bayes (NB)
2.4.5. Multilayer Perceptron (MLP)
2.4.6. Classification and Regression Trees (CART)
2.4.7. Hyperparameters of Machine Learning Models
2.5. Accuracy Assessment
2.5.1. Binary Classification’s Accuracy Assessment
2.5.2. Multiclass Classification’s Accuracy Assessment
3. Results
3.1. Land Use Land Cover (LULC)
3.2. Flash Flood Susceptibility
3.3. Flash-Flooded Areas
3.4. Flash Flood Exposure
4. Discussion
5. Conclusions
Author Contributions
Funding
Data Availability Statement
Conflicts of Interest
References
- Hofmann, J.; Schüttrumpf, H. Risk-Based Early Warning System for Pluvial Flash Floods: Approaches and Foundations. Geosciences 2019, 9, 127. [Google Scholar] [CrossRef]
- Jadouane, A.; Chaouki, A. Simulation of the Flood of El Maleh River by GIS in the City of Mohammedia-Morocco. In Proceedings of the Climate Change and Water Security; Kolathayar, S., Mondal, A., Chian, S.C., Eds.; Springer: Singapore, 2022; pp. 93–104. [Google Scholar]
- Boutoutaou Djamel, Z.H.B.F. Floods and Hydrograms of Floods of Rivers in Arid Zones of the Mediterranean, Case of the Kingdom of Morocco. Int. J. Geosci. 2020, 11, 16. [Google Scholar]
- Echogdali, F.Z.; Kpan, R.B.; Ouchchen, M.; Id-Belqas, M.; Dadi, B.; Ikirri, M.; Abioui, M.; Boutaleb, S. Spatial Prediction of Flood Frequency Analysis in a Semi-Arid Zone: A Case Study from the Seyad Basin (Guelmim Region, Morocco). In Geospatial Technology for Landscape and Environmental Management: Sustainable Assessment and Planning; Rai, P.K., Mishra, V.N., Singh, P., Eds.; Springer Nature: Singapore, 2022; pp. 49–71. ISBN 978-981-16-7373-3. [Google Scholar]
- Theilen-Willige, B.; Charif, A.; El Ouahidi, A.; Chaibi, M.; Ougougdal, M.A.; AitMalek, H. Flash Floods in the Guelmim Area/Southwest Morocco–Use of Remote Sensing and GIS-Tools for the Detection of Flooding-Prone Areas. Geosciences 2015, 5, 203–221. [Google Scholar] [CrossRef]
- Sellami, E.M.; Maanan, M.; Rhinane, H. Performance of Machine Learning Algorithms for Mapping and Forecasting of Flash Flood Susceptibility in Tetouan, Morocco. In International Archives of the Photogrammetry, Remote Sensing and Spatial Information Sciences—ISPRS Archives; International Society for Photogrammetry and Remote Sensing: Bethesda, MD, USA, 2022; Volume 46, pp. 305–313. [Google Scholar] [CrossRef]
- Saber, M.; Abdrabo, K.I.; Habiba, O.M.; Kantosh, S.A.; Sumi, T. Impacts of Triple Factors on Flash Flood Vulnerability in Egypt: Urban Growth, Extreme Climate, and Mismanagement. Geosciences 2020, 10, 24. [Google Scholar] [CrossRef]
- Gudiyangada Nachappa, T.; Tavakkoli Piralilou, S.; Gholamnia, K.; Ghorbanzadeh, O.; Rahmati, O.; Blaschke, T. Flood Susceptibility Mapping with Machine Learning, Multi-Criteria Decision Analysis and Ensemble Using Dempster Shafer Theory. J. Hydrol. 2020, 590, 125275. [Google Scholar] [CrossRef]
- Cao, C.; Xu, P.; Wang, Y.; Chen, J.; Zheng, L.; Niu, C. Flash Flood Hazard Susceptibility Mapping Using Frequency Ratio and Statistical Index Methods in Coalmine Subsidence Areas. Sustainability 2016, 8, 948. [Google Scholar] [CrossRef]
- Rahmati, O.; Pourghasemi, H.R.; Zeinivand, H. Flood Susceptibility Mapping Using Frequency Ratio and Weights-of-Evidence Models in the Golastan Province, Iran. Geocarto Int. 2016, 31, 42–70. [Google Scholar] [CrossRef]
- Wang, Y.; Fang, Z.; Hong, H.; Costache, R.; Tang, X. Flood Susceptibility Mapping by Integrating Frequency Ratio and Index of Entropy with Multilayer Perceptron and Classification and Regression Tree. J. Environ. Manag. 2021, 289, 112449. [Google Scholar] [CrossRef] [PubMed]
- Vojtek, M.; Vojteková, J. Flood Susceptibility Mapping on a National Scale in Slovakia Using the Analytical Hierarchy Process. Water 2019, 11, 364. [Google Scholar] [CrossRef]
- Akay, H. Flood Hazards Susceptibility Mapping Using Statistical, Fuzzy Logic, and MCDM Methods. Soft Comput. 2021, 25, 9325–9346. [Google Scholar] [CrossRef]
- Bui, Q.-T.; Nguyen, Q.-H.; Nguyen, X.L.; Pham, V.D.; Nguyen, H.D.; Pham, V.-M. Verification of Novel Integrations of Swarm Intelligence Algorithms into Deep Learning Neural Network for Flood Susceptibility Mapping. J. Hydrol. 2020, 581, 124379. [Google Scholar] [CrossRef]
- Shreevastav, B.B.; Tiwari, K.R.; Mandal, R.A.; Singh, B. “Flood Risk Modeling in Southern Bagmati Corridor, Nepal” (a Study from Sarlahi and Rautahat, Nepal). Prog. Disaster Sci. 2022, 16, 100260. [Google Scholar] [CrossRef]
- Al-Areeq, A.M.; Abba, S.I.; Yassin, M.A.; Benaafi, M.; Ghaleb, M.; Aljundi, I.H. Computational Machine Learning Approach for Flood Susceptibility Assessment Integrated with Remote Sensing and GIS Techniques from Jeddah, Saudi Arabia. Remote Sens. 2022, 14, 5515. [Google Scholar] [CrossRef]
- Yaseen, A.; Lu, J.; Chen, X. Flood Susceptibility Mapping in an Arid Region of Pakistan through Ensemble Machine Learning Model. Stoch. Environ. Res. Risk Assess. 2022, 36, 3041–3061. [Google Scholar] [CrossRef]
- Shinde, S.; Pande, C.B.; Barai, V.N.; Gorantiwar, S.D.; Atre, A.A. Flood Impact and Damage Assessment Based on the Sentitnel-1 SAR Data Using Google Earth Engine. In Climate Change Impacts on Natural Resources, Ecosystems and Agricultural Systems; Pande, C.B., Moharir, K.N., Singh, S.K., Pham, Q.B., Elbeltagi, A., Eds.; Springer International Publishing: Cham, Switzerland, 2023; pp. 483–502. ISBN 978-3-031-19059-9. [Google Scholar]
- Tripathi, G.; Pandey, A.C.; Parida, B.R.; Kumar, A. Flood Inundation Mapping and Impact Assessment Using Multi-Temporal Optical and SAR Satellite Data: A Case Study of 2017 Flood in Darbhanga District, Bihar, India. Water Resour. Manag. 2020, 34, 1871–1892. [Google Scholar] [CrossRef]
- Pandey, A.C.; Kaushik, K.; Parida, B.R. Google Earth Engine for Large-Scale Flood Mapping Using SAR Data and Impact Assessment on Agriculture and Population of Ganga-Brahmaputra Basin. Sustainability 2022, 14, 4210. [Google Scholar] [CrossRef]
- Liu, C.; Li, W.; Zhu, G.; Zhou, H.; Yan, H.; Xue, P. Land Use/Land Cover Changes and Their Driving Factors in the Northeastern Tibetan Plateau Based on Geographical Detectors and Google Earth Engine: A Case Study in Gannan Prefecture. Remote Sens. 2020, 12, 3139. [Google Scholar] [CrossRef]
- Feizizadeh, B.; Omarzadeh, D.; Kazemi Garajeh, M.; Lakes, T.; Blaschke, T. Machine Learning Data-Driven Approaches for Land Use/Cover Mapping and Trend Analysis Using Google Earth Engine. J. Environ. Plan. Manag. 2023, 66, 665–697. [Google Scholar] [CrossRef]
- Nasiri, V.; Deljouei, A.; Moradi, F.; Sadeghi, S.M.M.; Borz, S.A. Land Use and Land Cover Mapping Using Sentinel-2, Landsat-8 Satellite Images, and Google Earth Engine: A Comparison of Two Composition Methods. Remote Sens. 2022, 14, 1977. [Google Scholar] [CrossRef]
- Kobiyama, M.; Goerl, R.F. Quantitative Method to Distinguish Flood and Flash Flood as Disasters. SUISUI Hydrol. Res. Lett. 2007, 1, 11–14. [Google Scholar] [CrossRef]
- Borga, M.; Stoffel, M.; Marchi, L.; Marra, F.; Jakob, M. Hydrogeomorphic Response to Extreme Rainfall in Headwater Systems: Flash Floods and Debris Flows. J. Hydrol. 2014, 518, 194–205. [Google Scholar] [CrossRef]
- Inman, V.L.; Lyons, M.B. Automated Inundation Mapping over Large Areas Using Landsat Data and Google Earth Engine. Remote Sens. 2020, 12, 1348. [Google Scholar] [CrossRef]
- Pourghasemi, H.R.; Amiri, M.; Edalat, M.; Ahrari, A.H.; Panahi, M.; Sadhasivam, N.; Lee, S. Assessment of Urban Infrastructures Exposed to Flood Using Susceptibility Map and Google Earth Engine. IEEE J. Sel. Top. Appl. Earth Obs. Remote Sens. 2021, 14, 1923–1937. [Google Scholar] [CrossRef]
- Mehmood, H.; Conway, C.; Perera, D. Mapping of Flood Areas Using Landsat with Google Earth Engine Cloud Platform. Atmosphere 2021, 12, 866. [Google Scholar] [CrossRef]
- Fattore, C.; Abate, N.; Faridani, F.; Masini, N.; Lasaponara, R. Google Earth Engine as Multi-Sensor Open-Source Tool for Supporting the Preservation of Archaeological Areas: The Case Study of Flood and Fire Mapping in Metaponto, Italy. Sensors 2021, 21, 1791. [Google Scholar] [CrossRef] [PubMed]
- Liu, C.-C.; Shieh, M.-C.; Ke, M.-S.; Wang, K.-H. Flood Prevention and Emergency Response System Powered by Google Earth Engine. Remote Sens. 2018, 10, 1283. [Google Scholar] [CrossRef]
- Theilen-Willige, B.; Wenzel, H. Remote Sensing and GIS Contribution to a Natural Hazard Database in Western Saudi Arabia. Geosciences 2019, 9, 380. [Google Scholar] [CrossRef]
- Shetty, S.; Prasun, M.; Gupta, K.; Belgiu, M.; Srivastav, S.K. Analysis of Machine Learning Classifiers for LULC Classification on Google Earth Engine; University of Twente: Enschede, The Netherlands, 2019. [Google Scholar]
- Ganjirad, M.; Bagheri, H. Google Earth Engine-Based Mapping of Land Use and Land Cover for Weather Forecast Models Using Landsat 8 Imagery. Ecol. Inform. 2024, 80, 102498. [Google Scholar] [CrossRef]
- Tassi, A.; Vizzari, M. Object-Oriented Lulc Classification in Google Earth Engine Combining Snic, Glcm, and Machine Learning Algorithms. Remote Sens. 2020, 12, 3776. [Google Scholar] [CrossRef]
- Noi Phan, T.; Kuch, V.; Lehnert, L.W. Land Cover Classification Using Google Earth Engine and Random Forest Classifier-the Role of Image Composition. Remote Sens. 2020, 12, 2411. [Google Scholar] [CrossRef]
- Praticò, S.; Solano, F.; Di Fazio, S.; Modica, G. Machine Learning Classification of Mediterranean Forest Habitats in Google Earth Engine Based on Seasonal Sentinel-2 Time-Series and Input Image Composition Optimisation. Remote Sens. 2021, 13, 586. [Google Scholar] [CrossRef]
- Zhang, Z.; Wei, M.; Pu, D.; He, G.; Wang, G.; Long, T. Assessment of Annual Composite Images Obtained by Google Earth Engine for Urban Areas Mapping Using Random Forest. Remote Sens. 2021, 13, 748. [Google Scholar] [CrossRef]
- Shahabi, H.; Shirzadi, A.; Ronoud, S.; Asadi, S.; Pham, B.T.; Mansouripour, F.; Geertsema, M.; Clague, J.J.; Bui, D.T. Flash Flood Susceptibility Mapping Using a Novel Deep Learning Model Based on Deep Belief Network, Back Propagation and Genetic Algorithm. Geosci. Front. 2021, 12, 101100. [Google Scholar] [CrossRef]
- Ghosh, D.; Vogt, A. Outliers: An Evaluation of Methodologies. In Proceedings of the Joint Statistical Meetings, San Diego, CA, USA, 28 July–2 August 2012; Volume 12, pp. 3455–3460. [Google Scholar]
- Hossain, A.K.M.A.; Easson, G. Soil Moisture Estimation in South-Eastern New Mexico Using High Resolution Synthetic Aperture Radar (SAR) Data. Geosciences 2016, 6, 1. [Google Scholar] [CrossRef]
- Gunn, S.R. Support Vector Machines for Classification and Regression. ISIS Tech. Rep. 1998, 14, 5–16. [Google Scholar]
- Peng, C.Y.J.; Lee, K.L.; Ingersoll, G.M. An Introduction to Logistic Regression Analysis and Reporting. J. Educ. Res. 2002, 96, 3–14. [Google Scholar] [CrossRef]
- Fawagreh, K.; Gaber, M.M.; Elyan, E. Random Forests: From Early Developments to Recent Advancements. Syst. Sci. Control Eng. Open Access J. 2014, 2, 602–609. [Google Scholar] [CrossRef]
- Ghahraman, K.; Nagy, B.; Nooshin Nokhandan, F. Flood-Prone Zones of Meandering Rivers: Machine Learning Approach and Considering the Role of Morphology (Kashkan River, Western Iran). Geosciences 2023, 13, 267. [Google Scholar] [CrossRef]
- Rish, I. An Empirical Study of the Naive Bayes Classifier. In Proceedings of the IJCAI 2001 Workshop on Empirical Methods in Artificial Intelligence, Seattle, DC, USA, 4–10 August 2001; Volume 3, pp. 41–46. [Google Scholar]
- Popa, M.C.; Peptenatu, D.; Draghici, C.C.; Diaconu, D.C. Flood Hazard Mapping Using the Flood and Flash-Flood Potential Index in the Buzau River Catchment, Romania. Water 2019, 11, 2116. [Google Scholar] [CrossRef]
- Fawcett, T. An Introduction to ROC Analysis. Pattern Recognit. Lett. 2006, 27, 861–874. [Google Scholar] [CrossRef]
- Hansen, M.C.; Loveland, T.R. A Review of Large Area Monitoring of Land Cover Change Using Landsat Data. Remote Sens. Environ. 2012, 122, 66–74. [Google Scholar] [CrossRef]
- Hemati, M.; Hasanlou, M.; Mahdianpari, M.; Mohammadimanesh, F. A Systematic Review of Landsat Data for Change Detection Applications: 50 Years of Monitoring the Earth. Remote Sens. 2021, 13, 2869. [Google Scholar] [CrossRef]
- Gashaw, T.; Tulu, T.; Argaw, M.; Worqlul, A.W.; Tolessa, T.; Kindu, M. Estimating the Impacts of Land Use/Land Cover Changes on Ecosystem Service Values: The Case of the Andassa Watershed in the Upper Blue Nile Basin of Ethiopia. Ecosyst. Serv. 2018, 31, 219–228. [Google Scholar] [CrossRef]
- Saboori, M.; Homayouni, S.; Shah-Hosseini, R.; Zhang, Y. Optimum Feature and Classifier Selection for Accurate Urban Land Use/Cover Mapping from Very High Resolution Satellite Imagery. Remote Sens. 2022, 14, 2097. [Google Scholar] [CrossRef]
- Burai, P.; Deák, B.; Valkó, O.; Tomor, T. Classification of Herbaceous Vegetation Using Airborne Hyperspectral Imagery. Remote Sens. 2015, 7, 2046–2066. [Google Scholar] [CrossRef]
- Ghayour, L.; Neshat, A.; Paryani, S.; Shahabi, H.; Shirzadi, A.; Chen, W.; Al-Ansari, N.; Geertsema, M.; Amiri, M.P.; Gholamnia, M.; et al. Performance Evaluation of Sentinel-2 and Landsat 8 OLI Data for Land Cover/Use Classification Using a Comparison between Machine Learning Algorithms. Remote Sens. 2021, 13, 1349. [Google Scholar] [CrossRef]
- Kollert, A.; Bremer, M.; Löw, M.; Rutzinger, M. Exploring the Potential of Land Surface Phenology and Seasonal Cloud Free Composites of One Year of Sentinel-2 Imagery for Tree Species Mapping in a Mountainous Region. Int. J. Appl. Earth Obs. Geoinf. 2021, 94, 102208. [Google Scholar] [CrossRef]
- Bey, A.; Jetimane, J.; Lisboa, S.N.; Ribeiro, N.; Sitoe, A.; Meyfroidt, P. Mapping Smallholder and Large-Scale Cropland Dynamics with a Flexible Classification System and Pixel-Based Composites in an Emerging Frontier of Mozambique. Remote Sens. Environ. 2020, 239, 111611. [Google Scholar] [CrossRef]
- Shafizadeh-Moghadam, H.; Khazaei, M.; Alavipanah, S.K.; Weng, Q. Google Earth Engine for Large-Scale Land Use and Land Cover Mapping: An Object-Based Classification Approach Using Spectral, Textural and Topographical Factors. GIsci. Remote Sens. 2021, 58, 914–928. [Google Scholar] [CrossRef]
- Liu, Z.; Yang, J.; Huang, X. Landsat-Derived Impervious Surface Area Expansion in the Arctic from 1985 to 2021. Sci. Total Environ. 2023, 905, 166966. [Google Scholar] [CrossRef]
- Chen, H.; Qiao, Y.; Liu, H. A Random Forest Method for Constructing Long-Term Time Series of Nighttime Light in Central Asia. Remote Sens. Appl. 2022, 25, 100687. [Google Scholar] [CrossRef]
- Fernando, W.A.M.; Senanayake, I.P. Developing a Two-Decadal Time-Record of Rice Field Maps Using Landsat-Derived Multi-Index Image Collections with a Random Forest Classifier: A Google Earth Engine Based Approach. Inf. Process. Agric. 2023, 11, 260–275. [Google Scholar] [CrossRef]
- Tien Bui, D.; Hoang, N.D.; Martínez-Álvarez, F.; Ngo, P.T.T.; Hoa, P.V.; Pham, T.D.; Samui, P.; Costache, R. A Novel Deep Learning Neural Network Approach for Predicting Flash Flood Susceptibility: A Case Study at a High Frequency Tropical Storm Area. Sci. Total Environ. 2020, 701, 134413. [Google Scholar] [CrossRef] [PubMed]
- Towfiqul Islam, A.R.M.; Talukdar, S.; Mahato, S.; Kundu, S.; Eibek, K.U.; Pham, Q.B.; Kuriqi, A.; Linh, N.T.T. Flood Susceptibility Modelling Using Advanced Ensemble Machine Learning Models. Geosci. Front. 2021, 12, 101075. [Google Scholar] [CrossRef]
- Janizadeh, S.; Avand, M.; Jaafari, A.; Van Phong, T.; Bayat, M.; Ahmadisharaf, E.; Prakash, I.; Pham, B.T.; Lee, S. Prediction Success of Machine Learning Methods for Flash Flood Susceptibility Mapping in the Tafresh Watershed, Iran. Sustainability 2019, 11, 5426. [Google Scholar] [CrossRef]
- Elmahdy, S.; Ali, T.; Mohamed, M. Flash Flood Susceptibility Modeling and Magnitude Index Using Machine Learning and Geohydrological Models: A Modified Hybrid Approach. Remote Sens. 2020, 12, 2695. [Google Scholar] [CrossRef]
- Mahmoud, S.H.; Gan, T.Y. Multi-Criteria Approach to Develop Flood Susceptibility Maps in Arid Regions of Middle East. J. Clean. Prod. 2018, 196, 216–229. [Google Scholar] [CrossRef]
- Ureta, J.C.; Zurqani, H.A.; Post, C.J.; Ureta, J.; Motallebi, M. Application of Nonhydraulic Delineation Method of Flood Hazard Areas Using LiDAR-Based Data. Geosciences 2020, 10, 338. [Google Scholar] [CrossRef]


| Name | Pixel Size | Wavelength | |
|---|---|---|---|
| B1: Aerosols | 60 m | S2A: 443.9 nm | (S2B): 442.3 nm |
| B2: Blue | 10 m | S2A: 496.6 nm | (S2B): 492.1 nm |
| B3: Green | 10 m | S2A: 560 nm | (S2B): 559 nm |
| B4: Red | 10 m | S2A: 664.5 nm | (S2B): 665 nm |
| B5: Red Edge 1 | 20 m | S2A: 703.9 nm | (S2B): 703.8 nm |
| B6: Red Edge 2 | 20 m | S2A: 740.2 nm | (S2B): 739.1 nm |
| B7: Red Edge 2 | 20 m | S2A: 782.5 nm | (S2B): 779.7 nm |
| B8: NIR | 10 m | S2A: 835.1 nm | (S2B): 833 nm |
| B8A: Red Edge 3 | 20 m | S2A: 864.8 nm | (S2B): 864 nm |
| B9: Water vapor | 60 m | S2A: 945 nm | (S2B): 943.2 nm |
| B10: Cirrus | 60 m | S2A: 1373.5 nm | (S2B): 1376.9 nm |
| B11: SWIR 1 | 20 m | S2A: 1613.7 nm | (S2B): 1610.4 nm |
| B12: SWIR 2 | 20 m | S2A: 2202.4 nm | (S2B): 2185.7 nm |
| Reducer | Band | Resolution |
|---|---|---|
| ee.Reducer.max() | Blue (B2), Green (B3), Red (B4), NIR (B8) | 10 m |
| ee.Reducer.min() | Blue (B2), Green (B3), Red (B4), NIR (B8) | 10 m |
| ee.Reducer.median() | Blue (B2), Green (B3), Red (B4), NIR (B8) | 10 m |
| ee.Reducer.min() | Blue (B2), Green (B3), Red (B4), NIR (B8) | 10 m |
| ee.Reducer.mode() | Blue (B2), Green (B3), Red (B4), NIR (B8) | 10 m |
| ee.Reducer.max() | NDVI, NDWI, NDBI, BSI | |
| ee.Reducer.min() | ||
| ee.Reducer.median() | 10 m | |
| ee.Reducer.min() | ||
| ee.Reducer.mode() |
| LULC | No. of Polygons | No. of Pixels | Training Pixels | Testing Pixels |
|---|---|---|---|---|
| Water | 108 | 1852 | 1297 | 556 |
| Bare Land | 97 | 641 | 447 | 192 |
| Green land | 114 | 1174 | 822 | 353 |
| Forest | 105 | 1492 | 1045 | 448 |
| Urban | 116 | 988 | 693 | 296 |
| SUM | 540 | 6147 | 4304 | 1845 |
| Phase | Algorithm | Best Parameters |
|---|---|---|
| LULC Mapping | RF | n_estimators = 14 |
| SVM | kernel = “linear”, Cost = 0.1 | |
| CART | maxNodes: (50) | |
| FF Susceptibility | SVM | kernel = “rbf”,C = 20 |
| RF | n_estimators = 200, | |
| LR | The same accuracy for all solvers: ‘newton-cg’, ‘lbfgs’, ‘liblinear’, ‘sag’, ‘saga’ | |
| NB | var_smoothing: 1.000 × 10⁻⁹ | |
| MLP | Hidden_layer_sizes = (15, 15), learning_rate_init = 0.01, mlp.out_activation_ = ‘sigmoid’ |
| Actual | |||
|---|---|---|---|
| Positive | Negative | ||
| Predicted | Positive | True Positive | False Positive |
| Negative | False Negative | True Negative | |
| Actual | |||||||
|---|---|---|---|---|---|---|---|
| A | B | C | D | Sum | UA | ||
| predicted | A | 107 | 2 | 7 | 10 | 126 | 0.8492 |
| B | 1 | 80 | 5 | 3 | 89 | 0.8989 | |
| C | 4 | 11 | 100 | 6 | 121 | 0.8264 | |
| D | 3 | 2 | 7 | 98 | 110 | 0.8909 | |
| Sum | 115 | 95 | 119 | 117 | |||
| PA | 0.9304 | 0.8421 | 0.8403 | 0.8376 | |||
| Water | Barre Land | Greenland | Forest | Urban | ||||||||||||
|---|---|---|---|---|---|---|---|---|---|---|---|---|---|---|---|---|
| SVM | RF | CART | SVM | RF | CART | SVM | RF | CART | SVM | RF | CART | SVM | RF | CART | ||
| Max | UA | 0.97 | 0.99 | 0.96 | 1 | 0.96 | 0.66 | 0.64 | 0.77 | 0.72 | 0.80 | 0.80 | 0.73 | 0.94 | 0.92 | 0.87 |
| PA | 0.91 | 0.94 | 0.89 | 0.89 | 0.8 | 0.75 | 0.66 | 0.84 | 0.66 | 0.94 | 0.74 | 0.74 | 0.98 | 0.92 | 0.81 | |
| Mean | UA | 0.99 | 0.96 | 0.96 | 0.79 | 0.92 | 0.8 | 0.95 | 0.87 | 0.89 | 0.93 | 0.8 | 0.76 | 1 | 0.99 | 0.98 |
| PA | 1 | 0.96 | 0.92 | 1 | 0.91 | 0.91 | 0.87 | 0.86 | 0.82 | 0.9 | 0.83 | 0.87 | 0.98 | 0.95 | 0.95 | |
| Median | UA | 0.95 | 0.98 | 0.96 | 0.97 | 0.87 | 0.75 | 0.89 | 0.76 | 0.9 | 0.69 | 0.81 | 0.79 | 1 | 0.96 | 0.93 |
| PA | 0.96 | 0.93 | 0.9 | 1 | 0.85 | 0.74 | 0.72 | 0.8 | 0.87 | 0.8 | 0.95 | 0.87 | 0.97 | 0.95 | 0.93 | |
| Min | UA | 0.98 | 0.9 | 0.91 | 0.63 | 0.89 | 0.57 | 0.62 | 0.72 | 0.73 | 0.77 | 0.88 | 0.86 | 0.98 | 0.93 | 0.89 |
| PA | 1 | 0.96 | 0.98 | 0.8 | 0.41 | 0.68 | 0.69 | 0.85 | 0.65 | 0.68 | 0.79 | 0.83 | 1 | 0.99 | 0.78 | |
| Mode | UA | 0.99 | 0.94 | 0.96 | 0.27 | 0.52 | 0.28 | 0.49 | 0.72 | 0.63 | 0.89 | 0.77 | 0.68 | 0.93 | 0.82 | 0.83 |
| PA | 0.99 | 0.94 | 0.92 | 0.58 | 0.37 | 0.4 | 0.62 | 0.72 | 0.53 | 0.68 | 0.87 | 0.75 | 0.7 | 0.87 | 0.78 | |
| Avg UA | 0.98 | 0.95 | 0.95 | 0.73 | 0.83 | 0.61 | 0.72 | 0.77 | 0.77 | 0.82 | 0.81 | 0.77 | 0.97 | 0.92 | 0.90 | |
| Avg PA | 0.97 | 0.95 | 0.92 | 0.85 | 0.67 | 0.70 | 0.71 | 0.81 | 0.71 | 0.80 | 0.84 | 0.81 | 0.93 | 0.94 | 0.85 | |
Disclaimer/Publisher’s Note: The statements, opinions and data contained in all publications are solely those of the individual author(s) and contributor(s) and not of MDPI and/or the editor(s). MDPI and/or the editor(s) disclaim responsibility for any injury to people or property resulting from any ideas, methods, instructions or products referred to in the content. |
© 2024 by the authors. Licensee MDPI, Basel, Switzerland. This article is an open access article distributed under the terms and conditions of the Creative Commons Attribution (CC BY) license (https://creativecommons.org/licenses/by/4.0/).
Share and Cite
SELLAMI, E.M.; Rhinane, H. Google Earth Engine and Machine Learning for Flash Flood Exposure Mapping—Case Study: Tetouan, Morocco. Geosciences 2024, 14, 152. https://doi.org/10.3390/geosciences14060152
SELLAMI EM, Rhinane H. Google Earth Engine and Machine Learning for Flash Flood Exposure Mapping—Case Study: Tetouan, Morocco. Geosciences. 2024; 14(6):152. https://doi.org/10.3390/geosciences14060152
Chicago/Turabian StyleSELLAMI, EL Mehdi, and Hassan Rhinane. 2024. "Google Earth Engine and Machine Learning for Flash Flood Exposure Mapping—Case Study: Tetouan, Morocco" Geosciences 14, no. 6: 152. https://doi.org/10.3390/geosciences14060152