[go: up one dir, main page]

Next Issue
Volume 10, May
Previous Issue
Volume 10, March


Animals, Volume 10, Issue 4 (April 2020) – 206 articles

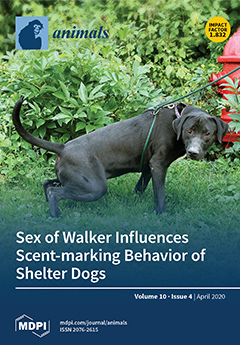
Cover Story (view full-size image): Human presence and handling affect the behavior and physiology of other animals, typically causing fear, increased vigilance, and stress; such effects have been found in diverse settings (e.g., zoos, research laboratories, farms, and in the wild) and can vary with familiarity and sex. Domestic dogs are unusual in that contact with humans often reduces behavioral and physiological correlates of stress. Nevertheless, there is evidence that dogs respond differently to unfamiliar men and women, which could affect the results of behavioral and physiological research with dogs, as well as results of canine behavioral evaluations at animal shelters. In this paper, we show how the sex of an unfamiliar walker influences the scent-marking behavior of shelter dogs. (The cover photograph was taken by Katherine E. Bemis.) View this page
  • Issues are regarded as officially published after their release is announced to the table of contents alert mailing list.
  • You may sign up for e-mail alerts to receive table of contents of newly released issues.
  • PDF is the official format for papers published in both, html and pdf forms. To view the papers in pdf format, click on the "PDF Full-text" link, and use the free Adobe Reader to open them.
Order results
Result details
Section
Select all
Export citation of selected articles as:
16 pages, 1168 KiB  
Review
Natural Preservatives from Plant in Cheese Making
by Mena Ritota and Pamela Manzi
Animals 2020, 10(4), 749; https://doi.org/10.3390/ani10040749 - 24 Apr 2020
Cited by 42 | Viewed by 12653
Abstract
Today, consumers are increasingly demanding safety alternatives concerning the use of synthetic additives in the food industry, as well as healthy food. As a result, a major number of plant-derived preservatives have been tested in the food industry. These natural ingredients have antioxidant [...] Read more.
Today, consumers are increasingly demanding safety alternatives concerning the use of synthetic additives in the food industry, as well as healthy food. As a result, a major number of plant-derived preservatives have been tested in the food industry. These natural ingredients have antioxidant properties and have shown to increase the bioactive molecules levels and the microbiological stability of the food items. The effect of the plant-based preservatives on the sensorial properties of the new products has also to be considered, because natural preservatives could result in sensorial characteristics that may not be accepted by the consumers. Cheese is a dairy product widely appreciated all over the world, but it is also susceptible to contamination by pathogenic and spoilage microorganisms; therefore, the use of preservatives in cheese making represents an important step. This review deals with one of the innovation in the cheese sector, which is the addition of natural preservatives. Several aspects are discussed, such as the effect of natural ingredients on the microbial stability of cheese, and their influence on the chemical, nutritional and sensorial characteristics of the cheeses. Although the promising results, further studies are needed to confirm the use of natural preservatives from plants in cheese making. Full article
(This article belongs to the Special Issue Bovine and Non-bovine Milk Quality)
Show Figures

Graphical abstract

Graphical abstract
Full article ">Figure 1
<p>Major plants and their applications in cheese making.</p>
Full article ">
13 pages, 2136 KiB  
Article
The Prevalence of Endoparasites of Free Ranging Cats (Felis catus) from Urban Habitats in Southern Poland
by Izabela A. Wierzbowska, Sławomir Kornaś, Aleksandra M. Piontek and Kaja Rola
Animals 2020, 10(4), 748; https://doi.org/10.3390/ani10040748 - 24 Apr 2020
Cited by 7 | Viewed by 5622
Abstract
Growing urbanization leads to an increased risk of parasite spread in densely inhabited areas. Free-ranging cats can be locally numerous and come into frequent contact with both wildlife and humans. Cats are thus expected to contribute to parasitic disease transmission. In our study, [...] Read more.
Growing urbanization leads to an increased risk of parasite spread in densely inhabited areas. Free-ranging cats can be locally numerous and come into frequent contact with both wildlife and humans. Cats are thus expected to contribute to parasitic disease transmission. In our study, we investigated the prevalence of endoparasites in free ranging cats in urban areas of Kraków city, based on necropsy of road-killed cats in relation to sex and diet of cat, season and habitat type. We found that 62% of 81 cats were infected with endoparasites with Toxocara cati being the most prevalent. In total, we identified seven parasite species. The number of parasite species was higher in suburban habitats and aside from Eucoleus aerophilus the prevalence of all parasites was higher in cats from suburban areas than in the individuals living in the city urban core. The prey of examined cats included mostly rodents, followed by soricomorphs and birds, which can all serve as paratenic hosts. Based on our results, we suggest that cats in urban areas should be considered as a serious potential zoonotic threat. Implementation of proper veterinary control and wider education on the topic is recommended. Full article
(This article belongs to the Special Issue Anthropogenic Impacts on Urban Mammals)
Show Figures

Figure 1

Figure 1
<p>Whisker plots (mean ± SE) of intensity of infection in the two most common parasites of cats in urban and suburban areas. The results of Mann–Whitney U tests are provided in the inset of the graph.</p>
Full article ">Figure 2
<p>Biplot of the first two axes of the principal component analysis (PCA) of the groups of cats and parasites in relation to (<b>A</b>) cats’ sex and age, (<b>B</b>) cats sex and season, (<b>C</b>) cats sex and habitat and (<b>D</b>) habitat and cats age. The percentage of variance explained by the principal components is provided in parentheses.</p>
Full article ">Figure 2 Cont.
<p>Biplot of the first two axes of the principal component analysis (PCA) of the groups of cats and parasites in relation to (<b>A</b>) cats’ sex and age, (<b>B</b>) cats sex and season, (<b>C</b>) cats sex and habitat and (<b>D</b>) habitat and cats age. The percentage of variance explained by the principal components is provided in parentheses.</p>
Full article ">Figure 3
<p>Results of the Mantel test. The correlation between cats’ diet similarity and parasite similarity. Pearson correlation coefficient as well as regression line with 95% confidence interval are provided.</p>
Full article ">Figure 4
<p>The seriation diagram using a constrained algorithm of parasites (presence/absence values) recorded in cats sorted according to their body mass.</p>
Full article ">
10 pages, 1448 KiB  
Article
A Data-Driven Prediction Method for an Early Warning of Coccidiosis in Intensive Livestock Systems: A Preliminary Study
by Federica Borgonovo, Valentina Ferrante, Guido Grilli, Riccardo Pascuzzo, Simone Vantini and Marcella Guarino
Animals 2020, 10(4), 747; https://doi.org/10.3390/ani10040747 - 24 Apr 2020
Cited by 14 | Viewed by 3649
Abstract
Coccidiosis is still one of the major parasitic infections in poultry. It is caused by protozoa of the genus Eimeria, which cause concrete economic losses due to malabsorption, bad feed conversion rate, reduced weight gain, and increased mortality. The greatest damage is [...] Read more.
Coccidiosis is still one of the major parasitic infections in poultry. It is caused by protozoa of the genus Eimeria, which cause concrete economic losses due to malabsorption, bad feed conversion rate, reduced weight gain, and increased mortality. The greatest damage is registered in commercial poultry farms because birds are reared together in large numbers and high densities. Unfortunately, these enteric pathologies are not preventable, and their diagnosis is only available when the disease is full-blown. For these reasons, the preventive use of anticoccidials—some of these with antimicrobial action—is a common practice in intensive farming, and this type of management leads to the release of drugs in the environment which contributes to the phenomenon of antibiotic resistance. Due to the high relevance of this issue, the early detection of any health problem is of great importance to improve animal welfare in intensive farming. Three prototypes, previously calibrated and adjusted, were developed and tested in three different experimental poultry farms in order to evaluate whether the system was able to identify the coccidia infection in intensive poultry farms early. For this purpose, a data-driven machine learning algorithm was built, and specific critical values of volatile organic compounds (VOCs) were found to be associated with abnormal levels of oocystis count at an early stage of the disease. This result supports the feasibility of building an automatic data-driven machine learning algorithm for an early warning of coccidiosis. Full article
Show Figures

Figure 1

Figure 1
<p>Illustration of the faeces sampling zones (1–5), the position of the device within the shed (<b>a</b>), and the air collection point (<b>b</b>).</p>
Full article ">Figure 2
<p>The number of oocystis interpolated from the oocyst count for each cycle and farm. The horizontal grey line refers to 1000 oocystis level. Farm 1 (<b>a</b>); Farm 2 (<b>b</b>); Farm 3 (<b>c</b>).</p>
Full article ">Figure 3
<p>Barplot of the loadings of the first two principal components for each cycle of the three farms in the training set.</p>
Full article ">Figure 4
<p>Receiver operating characteristic (ROC) curves for the test data of the three farms.</p>
Full article ">
22 pages, 4957 KiB  
Article
Influence of Housing Systems on Physical, Emotional, and Cognitive Functions with Aging in DBA/2CrSlc Mice
by Chikako Shimizu, Yoshihisa Wakita, Youichi Tsuchiya and Toshitaka Nabeshima
Animals 2020, 10(4), 746; https://doi.org/10.3390/ani10040746 - 24 Apr 2020
Cited by 2 | Viewed by 3789
Abstract
Environmental conditions, including enrichment and stress, affect animal behaviors, but limited information is available regarding the differences in animal functions between the chamber (ventilated system) vs. IVC (individually ventilated cages) housing systems. Therefore, the effects of different housing systems were examined on physical, [...] Read more.
Environmental conditions, including enrichment and stress, affect animal behaviors, but limited information is available regarding the differences in animal functions between the chamber (ventilated system) vs. IVC (individually ventilated cages) housing systems. Therefore, the effects of different housing systems were examined on physical, emotional, and cognitive functions and the intestinal flora with aging. DBA/2CrSlc mice were divided into chamber and IVC groups. Differences in the structure of the two cages considered whether the mouse could dangle or not. Physical, emotional, and cognitive functions were examined using the open field, black and white box, object recognition, horizontal bar, wire hanging, balancing, footprint, and locomotor tests. The IVC group demonstrated significantly less food intake, higher body weight (by approximately 5 g), lower rectal core temperature, less muscle and balancing powers with aging, and fewer anxiety-like behaviors than the chamber group. No differences were observed in the cognitive function and intestinal microbiota between the groups. The housing environment affected the rodent basal temperature and body weight as well as the physical and emotional functions. Scientists should be attentive to the type of cages used in the housing system for an experiment, especially when comparing the results with animals reared in different systems. Full article
(This article belongs to the Special Issue Laboratory Animals)
Show Figures

Figure 1

Figure 1
<p>Two different types of housing cages: chamber (right) and IVC (individually ventilated cages) (left) types.</p>
Full article ">Figure 2
<p>Schematic representation of the three phases (Habituation, Training, and Test Phases) for the Object Location Test (OLT) and Object Recognition Test (ORT).</p>
Full article ">Figure 3
<p>Changes in food consumption and body weight with aging in the chamber and IVC groups: (<b>A</b>) food consumption (g/mouse/day), (<b>B</b>) body weight.</p>
Full article ">Figure 4
<p>Changes in rectal core temperature with aging in the chamber and the IVC groups. ** <span class="html-italic">p</span> &lt; 0.01; * <span class="html-italic">p</span> &lt; 0.05 by t-test.</p>
Full article ">Figure 5
<p>Changes in physical performance with aging in the chamber and IVC groups: physical performance in balancing abilities on (<b>A</b>) an acryl rod (Test 1), (<b>B</b>) horizontal bar (Test 2), (<b>C</b>) wire hanging (Test 3). *** <span class="html-italic">p</span> &lt; 0.001 by two-way ANOVA, ††† <span class="html-italic">p</span> &lt; 0.001; †† <span class="html-italic">p</span> &lt; 0.01; † <span class="html-italic">p</span> &lt; 0.05 by Bonferroni’s <span class="html-italic">post-hoc</span> test for multiple comparisons.</p>
Full article ">Figure 6
<p>Changes in footprint with aging in the chamber and IVC groups (Test 4): Forefoot; (<b>A</b>) stride, (<b>B</b>) sway, (<b>C</b>) stance, Hindfoot; (<b>D</b>) stride, (<b>E</b>) sway, (<b>F</b>) stance. ** <span class="html-italic">p</span> &lt; 0.01; * <span class="html-italic">p</span> &lt; 0.05 by two-way ANOVA.</p>
Full article ">Figure 7
<p>Changes in locomotor activities under 25 lux with aging in the chamber and IVC groups (Test 5): (<b>A</b>) locomotor activities; (<b>B</b>) center time. There was no significant difference between both groups using two-way ANOVA.††† <span class="html-italic">p</span> &lt; 0.001 by Bonferroni’s <span class="html-italic">post-hoc</span> test for multiple comparisons.</p>
Full article ">Figure 8
<p>Changes in behaviors with aging in black and white box test in the chamber and IVC groups (Test 6): (<b>A</b>) Time spent in the white area for 900 s; (<b>B</b>) Number of crossings between the white and black areas for 900 s. * <span class="html-italic">p</span> &lt; 0.05 by t-test.</p>
Full article ">Figure 9
<p>Changes in behaviors in open field test under 200 lux with aging in the chamber and IVC groups (Test 7): (<b>A</b>) Locomotor activities; (<b>B</b>) Center time; (<b>C</b>) Number of fecal droppings. Between-group comparison: * <span class="html-italic">p</span> &lt; 0.05 by t-test, Within-group comparison : ††† <span class="html-italic">p</span> &lt; 0.001; †† <span class="html-italic">p</span> &lt; 0.01; † <span class="html-italic">p</span> &lt; 0.05 by one-way ANOVA followed by Tukey’s <span class="html-italic">post hoc</span> test.</p>
Full article ">Figure 10
<p>Changes in cognitive functions with aging in object location test (OLT, Test 8) and object recognition test (ORT; Test 9) in the chamber and IVC groups: ORT: (<b>A</b>) chamber group, (<b>B</b>) IVC group, ORT; (<b>C</b>) chamber group, (<b>D</b>) IVC group. Comparison of recognition index in terms of location of the familiar object (OLT) and the novel object (ORT) during the test phase using the unpaired t-test., *** <span class="html-italic">p</span> &lt; 0.001; ** <span class="html-italic">p</span> &lt; 0.01 by t-test. Between-group comparisons in the training phase, †† <span class="html-italic">p</span> &lt; 0.01; † <span class="html-italic">p</span> &lt; 0.05 by t-test.</p>
Full article ">Figure 11
<p>Changes in the intestinal microbiome with aging in the chamber and IVC groups: UniFrac analyses (unweighted); (<b>A</b>) ages; (<b>B</b>) groups.</p>
Full article ">
19 pages, 14916 KiB  
Article
A Detailed Study of Rainbow Trout (Onchorhynchus mykiss) Intestine Revealed That Digestive and Absorptive Functions Are Not Linearly Distributed along Its Length
by Nicole Verdile, Rolando Pasquariello, Marco Scolari, Giulia Scirè, Tiziana A. L. Brevini and Fulvio Gandolfi
Animals 2020, 10(4), 745; https://doi.org/10.3390/ani10040745 - 24 Apr 2020
Cited by 40 | Viewed by 5766
Abstract
To increase the sustainability of trout farming, the industry requires alternatives to fish-based meals that do not compromise animal health and growth performances. To develop new feeds, detailed knowledge of intestinal morphology and physiology is required. We performed histological, histochemical, immunohistochemical and morphometric [...] Read more.
To increase the sustainability of trout farming, the industry requires alternatives to fish-based meals that do not compromise animal health and growth performances. To develop new feeds, detailed knowledge of intestinal morphology and physiology is required. We performed histological, histochemical, immunohistochemical and morphometric analysis at typical time points of in vivo feeding trials (50, 150 and 500 g). Only minor changes occurred during growth whereas differences characterized two compartments, not linearly distributed along the intestine. The first included the pyloric caeca, the basal part of the complex folds and the villi of the distal intestine. This was characterized by a significantly smaller number of goblet cells with smaller mucus vacuoles, higher proliferation and higher apoptotic rate but a smaller extension of fully differentiated epithelial cells and by the presence of numerous pinocytotic vacuolization. The second compartment was formed by the proximal intestine and the apical part of the posterior intestine complex folds. Here we observed more abundant goblet cells with bigger vacuoles, low proliferation rate, few round apoptotic cells, a more extended area of fully differentiated cells and no pinocytotic vacuoles. Our results suggest that rainbow trout intestine is physiologically arranged to mingle digestive and absorptive functions along its length. Full article
(This article belongs to the Special Issue Immunohistochemical and Physiological Research on Farm Animals)
Show Figures

Figure 1

Figure 1
<p>Selected regions of the samples collection.</p>
Full article ">Figure 2
<p>Hematoxylin/eosin (HE) stained section, showing the presence of enterocytes supranuclear vacuolization (SNV) and goblet cells (GC) in the pyloric caeca of 500 gr rainbow trout.</p>
Full article ">Figure 3
<p>Branching of intestinal villi in the anterior intestine of rainbow trout during growth ((<b>A</b>) 50 g; (<b>B</b>) 150 g; (<b>C</b>) 500 g).</p>
Full article ">Figure 4
<p>HE stained section of a complex fold in the distal intestine: parietal villi (<b>A</b>), as well as villi emerging from the basal part of the fold (<b>B</b>,<b>C</b>), were both covered by pinocytotic vacuoles (PV). At one point, the epithelium morphology along the fold, drastically changed: pinocytotic vacuoles tended to disappear (<b>D</b>). The apex of the fold presented goblet cells (GC) and non-vacuolated enterocytes (<b>E</b>).</p>
Full article ">Figure 5
<p>Volume density (Vv) estimation of rainbow trout’s intestinal layers in the proximal and distal intestine during growth. Data are expressed as a percentage of the whole intestinal wall. <sup>a–c</sup> Different superscripts in the same layer indicate significant differences (<span class="html-italic">p</span> &lt; 0.05) determined by two-way ANOVA (animal weight and intestinal tract: independent variables).</p>
Full article ">Figure 6
<p>Goblet cells number (<b>A</b>) and volume (<b>B</b>) within five regions of the intestinal tract: proximal intestine (PI), pyloric caeca (PC), distal intestine (DI), basal (BP-DI) and apical part (AP-DI) of the complex folds of the distal intestine. Values are measured at three different stages of development (50, 150 and 500 g). <sup>a–c</sup> Different superscripts within the same histogram indicate significant differences (<span class="html-italic">p</span> &lt; 0.05 or <span class="html-italic">p</span> &lt; 0.005) measured by two-way ANOVA (animal weight and intestinal tract: independent variables).</p>
Full article ">Figure 7
<p>Alcian Blue–Periodic acid–Schiff (AB-PAS) stained section showing the presence of numerous PAS-positive pinocytotic vacuoles (arrows) on the villi of the distal intestine (<b>A</b>), as well as, on the basal part of the complex folds (<b>B</b>); whereas, they were completely absent at the fold apex (<b>C</b>).</p>
Full article ">Figure 8
<p>Representative figure of PAS stained section of the anterior intestine of rainbow trout.</p>
Full article ">Figure 9
<p>Representative figure of AB pH 2.5 stained section of the anterior intestine of rainbow trout.</p>
Full article ">Figure 10
<p>AB-PAS stained section showing the presence of a heterogenous populations of goblet cells. Most mucus-secreting cells produced a mixed secretion (PAS-AB positive-dark blue cells), some secreted acid mucins (AB positive-light blue cells), and a smaller amount produced neutral mucus (PAS positive-magenta cells).</p>
Full article ">Figure 11
<p>Estimation of the percentage of goblet cells secreting acid mucins (AB positive), mixed mucins (AB/PAS positive) and neutral mucins (PAS positive) in the proximal intestine of both short (<b>A</b>) and long (<b>B</b>) villi along rainbow trout development. <sup>a–e</sup> Different superscripts within the same histogram indicate significant differences (<span class="html-italic">p</span> &lt; 0.05) measured by one-way ANOVA (animal weight: independent variable).</p>
Full article ">Figure 12
<p>Estimation of the percentage of goblet cells secreting acid mucins (AB positive), mixed mucins (AB/PAS positive) and neutral mucins (PAS positive) in the pyloric caeca along rainbow trout development. In this region, the quality of mucus secretion remained constant along development. The same superscripts <sup>a–c</sup> within the same histogram indicate no significant differences (<span class="html-italic">p</span> &gt; 0.05) measured by one-way ANOVA (animal weight: independent variable).</p>
Full article ">Figure 13
<p>HE (<b>A</b>) and phloxine tartrazine (<b>B</b>) stained sections showing intestinal eosinophilic granule cells within the granulosum layers of submucosa (a—nucleus; b—eosinophilic granular cytoplasm).</p>
Full article ">Figure 14
<p>Proliferating cell nuclear antigen (PCNA) immunolocalization was observed within the intestinal folds at the basis of the villi in both proximal (PI) and distal (DI) intestine in all investigated stages. PCNA<sup>+</sup> cells were also found in correspondence of villi branching points in the proximal intestine. Cell proliferation was more intense and widespread in the distal compared to the proximal intestine in all investigated stages. Fully differentiated enterocytes expressing alkaline phosphatase (AP) activity were observed at the villi apex, but conversely, its expression was stronger and more widespread in the proximal compared to the distal intestine in all ages.</p>
Full article ">Figure 15
<p>Representative figure of PCNA combined AP stained section pf pyloric caeca showing a proliferating pattern similar to that observed in the distal intestine and in the basal part of the complex folds.</p>
Full article ">Figure 16
<p>Representative figure of cells undergoing apoptosis showing only a few round apoptotic cells in the anterior tract (<b>A</b>) and many more apoptotic cells, both round and slender in the pyloric caeca (<b>B</b>) and in the posterior intestine (<b>C</b>).</p>
Full article ">Figure 17
<p>Representative figure of cells undergoing apoptosis showing numerous, both round and slender apoptotic cells in the basal part of the complex folds (<b>A</b>,<b>B</b>) and only a few round apoptotic cells in the apical part of the complex folds (<b>C</b>,<b>D</b>).</p>
Full article ">Figure 18
<p>In situ detection of cells undergoing apoptosis showing three different apoptotic stages: A: early apoptotic stage; B: apoptotic body: C: cells exfoliating into the intestinal lumen.</p>
Full article ">Figure 19
<p>Representative figure of PCNA immunolocalization (red), histochemical detection of differentiated cells (blue) and in situ detection of apoptotic cells (brown). The apical part of the complex folds was characterized by a low PCNA expression, few round apoptotic cells and a strong alkaline phosphatase signal (<b>A</b>,<b>B</b>). In contrast, high proliferation and high apoptotic rate associated with low alkaline phosphatase expression in the basal part of the complex folds were observed (<b>C</b>,<b>D</b>).</p>
Full article ">
12 pages, 254 KiB  
Article
Pathotypes and Antimicrobial Susceptibility of Escherichia Coli Isolated from Wild Boar (Sus scrofa) in Tuscany
by Fabrizio Bertelloni, Giovanni Cilia, Samantha Bogi, Valentina Virginia Ebani, Luca Turini, Roberta Nuvoloni, Domenico Cerri, Filippo Fratini and Barbara Turchi
Animals 2020, 10(4), 744; https://doi.org/10.3390/ani10040744 - 24 Apr 2020
Cited by 22 | Viewed by 3243
Abstract
Wild boar are among the most widespread wild mammals in Europe. Although this species can act as a reservoir for different pathogens, data about its role as a carrier of pathogenic and antimicrobial-resistant Escherichia coli are still scarce. The aim of this study [...] Read more.
Wild boar are among the most widespread wild mammals in Europe. Although this species can act as a reservoir for different pathogens, data about its role as a carrier of pathogenic and antimicrobial-resistant Escherichia coli are still scarce. The aim of this study was to evaluate the occurrence of antimicrobial-resistant and pathogenic Escherichia coli in wild boar in the Tuscany region of Italy. During the hunting season of 2018–2019, E. coli was isolated from 175 of 200 animals and subjected to antimicrobial resistance tests and PCR for detection of resistance and virulence factor genes. The highest resistance rates were against cephalothin (94.3%), amoxicillin–clavulanic acid (87.4%), ampicillin (68.6%), and tetracycline (44.6%). The most detected resistance genes were blaCMY-2 (54.3%), sul1 (38.9%), sul2 (30.9%), and tetG (24.6%). Concerning genes encoding virulence factors, 55 of 175 isolates (31.4%) were negative for all tested genes. The most detected genes were hlyA (47.4%), astA (29.1%), stx2 (24.6%), eaeA (17.1%), and stx1 (11.4%). E. coli was classified as Shiga toxin-producing E. coli (STEC) (21.7%), enterohemorrhagic E. coli (EHEC) (6.3%), enteroaggregative E. coli (EAEC) (5.1%), and atypical enteropathogenic E. coli (aEPEC) (3.4%). Enterotoxigenic E. coli (ETEC), enteroinvasive E. coli (EIEC), and typical enteropathogenic E. coli (tEPEC) were not detected. Our results show that wild boars could carry pathogenic and antimicrobial-resistant E. coli, representing a possible reservoir of domestic animal and human pathogens. Full article
18 pages, 1506 KiB  
Article
The Effect of Behind-The-Scenes Encounters and Interactive Presentations on the Welfare of Captive Servals (Leptailurus serval)
by Lydia K. Acaralp-Rehnberg, Grahame J. Coleman, Michael J. L. Magrath, Vicky Melfi, Kerry V. Fanson and Ian M. Bland
Animals 2020, 10(4), 743; https://doi.org/10.3390/ani10040743 - 24 Apr 2020
Cited by 10 | Viewed by 5500
Abstract
The serval (Leptailurus serval) is a small African felid that is well represented in zoos and often serves as an animal ambassador in encounter programs with zoo visitors. The impact on serval welfare in relation to such programs has not been [...] Read more.
The serval (Leptailurus serval) is a small African felid that is well represented in zoos and often serves as an animal ambassador in encounter programs with zoo visitors. The impact on serval welfare in relation to such programs has not been investigated to date, and the aim of this study was to assess short-term welfare effects of varying levels of visitor interaction in two captive servals. Weekly blocks of four different treatments were imposed three times on each animal over 12 weeks, and the treatments involved (1) Presentations (serval undertaking a routine training session in a designated presentation space, typically attracting high visitor numbers), (2) Behind-the-scenes (BTS, a close encounter allowing a small group of visitors to interact closely with the cat in its enclosure), (3) Presentations and BTS combined, and (4) No visitor interaction. Serval activity budgets as well as behavioural diversity were created from behaviours observed from Close Circuit Television (CCTV) footage during four daily recording sessions per animal over three consecutive days per treatment, using instantaneous scan sampling every 60 s. Individual faecal samples were collected daily to monitor changes in faecal glucocorticoid metabolite (FGM) concentration. Results indicate that the mean number of scans with stereotypic pacing was significantly reduced (p = 0.01) during Treatments 1 and 3, when cats participated in presentations only, or the two activities combined. Conversely, a significant reduction in behavioural diversity (p < 0.001) was observed when cats participated in Treatment 3, i.e., cats expressed fewer behaviours when interaction with visitors was more frequent. FGM concentrations did not vary significantly with treatment (p > 0.05). Given the reduction in stereotypic pacing, these findings suggest that involvement in an encounter program appears to exert an overall positive short-term welfare effect on the individual servals in this study. Although a reduction in behavioural diversity was not considered a negative welfare effect in the short term, potential long-term negative welfare effects resulting from a more frequent encounter program could not be ruled out in the present study. Full article
(This article belongs to the Section Zoo Animals)
Show Figures

Figure 1

Figure 1
<p>(<b>a</b>) Serval pen. The cats could move between the three adjacent pens via hatches that could be closed from the outside by the keeper when necessary. Pens were identical in size and had similar environmental features to the pen shown in the picture. (<b>b</b>) Serval yard with a designated area for behind-the-scenes (BTS) encounters on the right.</p>
Full article ">Figure 2
<p>(<b>a</b>) Mean number of scans where pacing was observed during any given observation session across the four treatments. Error bars show standard error. Asterisks denote significant treatment differences. (<b>b</b>) Mean number of scans where pacing was observed during the two different observation blocks across the four different treatments. Pres–Presentations; BTS–Behind the Scenes Error bars show standard error. Asterisks denote significant treatment/session interactions.</p>
Full article ">Figure 3
<p>(<b>a</b>) Mean behavioural diversity (total number of behaviours expressed) during any given observation session across the four treatments. Error bars show standard error. Asterisks denote significant treatment differences. (<b>b</b>) Mean behavioural diversity during the two different observation blocks across the four treatments. Pres–Presentations; BTS–Behind the Scenes. Error bars show standard error. Asterisks denote significant treatment/session interactions.</p>
Full article ">
15 pages, 940 KiB  
Article
Antimicrobial Resistance and Virulence Properties of Campylobacter Spp. Originating from Domestic Geese in Poland
by Beata Wysok, Joanna Wojtacka, Agnieszka Wiszniewska-Łaszczych and Joanna Szteyn
Animals 2020, 10(4), 742; https://doi.org/10.3390/ani10040742 - 24 Apr 2020
Cited by 16 | Viewed by 2685
Abstract
A total of 240 samples were evaluated for the presence of Campylobacter spp. Campylobacter was found in 83.3% of the cecum contents samples and 52.5% of the neck skin samples from carcasses. The prevailing species was C. jejuni, accounting for 87.7% of [...] Read more.
A total of 240 samples were evaluated for the presence of Campylobacter spp. Campylobacter was found in 83.3% of the cecum contents samples and 52.5% of the neck skin samples from carcasses. The prevailing species was C. jejuni, accounting for 87.7% of all Campylobacter isolates, and the remaining 12.3% of isolates were C. coli. All Campylobacter isolates, independent of the sample origin and species, were positive for 6 out of 15 tested genes (flaA, flhA, cadF, racR, ciaB, and cdtA genes). The prevalence of dnaJ, docA, pldA, cdtB, cdtC, and iam genes was also very common (ranging from 86.5% to 98.8%). The lowest prevalence was noted for virB11 and wlaN genes, both in Campylobacter isolates from cecum (12% and 19%) and carcasses (11.1% and 17.5%). None of the isolates tested, regardless of the sample origin, carried the cgtB gene. The highest resistance rates were observed for quinolones (90.8%) and tetracyclines (79.8%). Simultaneously, only single Campylobacter isolate was resistant to macrolides (0.6%) and none of the isolates showed resistance to aminoglycosides and amphenicols. The common presence of Campylobacter on geese carcasses as well as the detection of multidrug-resistant isolates indicate that consuming goose meat might cause a potential risk, therefore leading to human campylobacteriosis. Full article
(This article belongs to the Special Issue Antimicrobial Resistance in Poultry Production)
Show Figures

Figure 1

Figure 1
<p>Prevalence of virulence markers in <span class="html-italic">Campylobacter</span> isolates originating from geese cecum (<b>a</b>) and carcasses (<b>b</b>).</p>
Full article ">
44 pages, 625 KiB  
Article
Changes in Serum and Salivary Proteins in Canine Mammary Tumors
by Lorena Franco-Martínez, Andrea Gelemanović, Anita Horvatić, María Dolores Contreras-Aguilar, Roman Dąbrowski, Vladimir Mrljak, José Joaquín Cerón, Silvia Martínez-Subiela and Asta Tvarijonaviciute
Animals 2020, 10(4), 741; https://doi.org/10.3390/ani10040741 - 24 Apr 2020
Cited by 16 | Viewed by 3560
Abstract
The aim of this study was to evaluate changes in serum and saliva proteomes in canine mammary tumors (CMT) using a high-throughput quantitative proteomic analysis in order to potentially discover possible biomarkers of this disease. Proteomes of paired serum and saliva samples from [...] Read more.
The aim of this study was to evaluate changes in serum and saliva proteomes in canine mammary tumors (CMT) using a high-throughput quantitative proteomic analysis in order to potentially discover possible biomarkers of this disease. Proteomes of paired serum and saliva samples from healthy controls (HC group, n = 5) and bitches with CMT (CMT group, n = 5) were analysed using a Tandem Mass Tags-based approach. Twenty-five dogs were used to validate serum albumin as a candidate biomarker in an independent sample set. The proteomic analysis quantified 379 and 730 proteins in serum and saliva, respectively. Of those, 35 proteins in serum and 49 in saliva were differentially represented. The verification of albumin in serum was in concordance with the proteomic data, showing lower levels in CMT when compared to the HC group. Some of the modulated proteins found in the present study such as haptoglobin or S100A4 have been related to CMT or human breast cancer previously, while others such as kallikrein-1 and immunoglobulin gamma-heavy chains A and D are described here for the first time. Our results indicate that saliva and serum proteomes can reflect physiopathological changes that occur in CMT in dogs and can be a potential source of biomarkers of the disease. Full article
(This article belongs to the Special Issue Biomarkers in Animal Health and Disease)
Show Figures

Figure A1

Figure A1
<p>Heatmap showing the relative abundance (color) of serum proteins in healthy (HC) dogs and dogs with canine mammary tumors (CMT).</p>
Full article ">Figure A2
<p>Heatmap showing the relative abundance (color) of salivary proteins in healthy (HC) dogs and dogs with canine mammary tumors (CMT).</p>
Full article ">
15 pages, 2925 KiB  
Article
Reproductive Traits of an Invasive Alien Population of Grey Squirrel (Sciurus carolinensis) in Central Italy
by Margherita Maranesi, Antonello Bufalari, Cecilia Dall’Aglio, Daniele Paoloni, Giulia Moretti, Silvia Crotti, Elisabetta Manuali, Marica Stazi, Francesca Bergamasco, Deborah Cruciani, Antonio Di Meo, Cristiano Boiti, Massimo Zerani and Francesca Mercati
Animals 2020, 10(4), 738; https://doi.org/10.3390/ani10040738 - 24 Apr 2020
Cited by 5 | Viewed by 4794
Abstract
The reproductive cycle of an invasive alien Italian grey squirrel population was studied to understand its adaptation and limit its spread, in order to conserve the autochthonous red squirrel. Female and male genital traits were evaluated throughout the reproductive cycle, including the ovary, [...] Read more.
The reproductive cycle of an invasive alien Italian grey squirrel population was studied to understand its adaptation and limit its spread, in order to conserve the autochthonous red squirrel. Female and male genital traits were evaluated throughout the reproductive cycle, including the ovary, uterus, testicle, epididymis, seminiferous tubule morphometry, and germinative epithelium histology. Moreover, individual female fecundity was determined by counting uterine scars. Ovary width and uterus weight, length, and width reached their highest values in the luteal and pregnancy phases. On conducting a histological evaluation of the testicular germinal epithelium, four morphotypes related to the different reproductive phases of the male squirrels were identified: immature, pubertal, spermatogenesis, and regressive. Testicle and epididymis weights and seminiferous tubule diameters reached their largest values during spermatogenesis. Uterine scar analysis showed that 69% of the females had given birth to one or two litters, while 31% had no uterine scars. Litters were larger in the first breeding period than in the second; annual fecundity was 4.52 ± 1.88 uterine scars/female. Umbrian grey squirrels have adapted to their non-native range, showing two annual mating periods at times similar to those in their native range, and high reproductive success. Full article
(This article belongs to the Special Issue Squirrel Behavior, Welfare and Habitat)
Show Figures

Figure 1

Figure 1
<p>(<b>a</b>) An ovary with a corpus luteum (arrow) on the surface. (<b>b</b>) A reproductive apparatus, after cutting the broad ligament and stretching, composed of the ovaries and fallopian tubes (arrows), uterine horns (arrowhead), and vulva (v); two uterine horns placed side by side in their distal end (bold arrow). The broad ligament infiltrated by adipose bodies (*) can be observed. The dashed line indicates that the length of the uterus was measured between the two proximal ends. (<b>c</b>) A white, small, ribbon-like and quite relaxed uterus belonging to an immature squirrel. (<b>d</b>) Two embryonic vesicles (arrows) are contained within a uterus strongly folded back on itself and forming spiral loops. Bladder (*) and vulva (v) are shown. (<b>e</b>) Dorsal surface with a transverse groove (arrow) defining the border between the cervix and the vagina. The bladder (*) can be observed below the vagina. (<b>f</b>) Distal and medial portion of the two uterine horns opened to show longitudinal folds of the mucosa. The arrows indicate the two external orifices of the uterus.</p>
Full article ">Figure 2
<p>A uterus after the treatment to evidence uterine scars. The arrows highlight more recent darker scars, while the arrowheads indicate older, lighter-coloured scars.</p>
Full article ">Figure 3
<p>Testicles belonging to squirrels of different ages and breeding status.</p>
Full article ">Figure 4
<p>Images of testicles in different reproductive phases. (<b>a</b>) Immature phase: germinal epithelium where tubules are small and devoid of lumen; the epithelium consists of numerous Sertoli cells located at the base and some spermatogonia with abundant cytoplasm in a more central position. (<b>b</b>) Pubertal phase: some tubules have large lumen and the epithelium consists mainly of basal Sertoli cells and primary spermatocytes in the luminal compartment; round spermatids and a cluster of Leydig cells can also be observed. (<b>c</b>) Spermatogenesis phase: all tubules show a large lumen; epithelium is completely formed and is in active spermatogenesis with elongated spermatids. (<b>d</b>) Regression phase: testicles with degenerated germinal cells occupying the lumen.</p>
Full article ">Figure 5
<p>Images of epididymis in different reproductive phases. (<b>a</b>) Immature phase: the diameter of the epididymis is small and the lumen is empty. (<b>b</b>) Spermatogenesis phase: the diameter of the epididymis is larger and it is full of spermatozoa. (<b>c</b>) Regressive phase: cell debris and squamous cells can be observed in the epididymis lumen.</p>
Full article ">
12 pages, 967 KiB  
Article
Expression of DAZL Gene in Selected Tissues and Association of Its Polymorphisms with Testicular Size in Hu Sheep
by Zehu Yuan, Jing Luo, Li Wang, Fadi Li, Wanhong Li and Xiangpeng Yue
Animals 2020, 10(4), 740; https://doi.org/10.3390/ani10040740 - 23 Apr 2020
Cited by 18 | Viewed by 2708
Abstract
The deleted in azoospermia-like (DAZL) gene encoding an RNA binding protein is pivotal in gametogenesis in lots of species and also acts as a pre-meiosis marker. The current study was conducted to detect expression profiles and single nucleotide polymorphisms (SNPs) of [...] Read more.
The deleted in azoospermia-like (DAZL) gene encoding an RNA binding protein is pivotal in gametogenesis in lots of species and also acts as a pre-meiosis marker. The current study was conducted to detect expression profiles and single nucleotide polymorphisms (SNPs) of DAZL in sheep using qPCR, DNA-pooled sequencing, improved multiplex ligase detection reaction (iMLDR®) and restriction fragment length polymorphism (RFLP) methods. The results confirmed that ovine DAZL showed the highest expression level at six-months of age across five developmental stage. At six-month stage, DAZL expressed primarily in testis across seven tissues analyzed. The abundance of DAZL in the large-testis group is higher than that in the small-testis group although it is not significant. In addition, six SNPs (SNP1-SNP6) were identified in DAZL. Of those, SNP1 (p < 0.05) and SNP6 (p < 0.01) were significantly correlated with the variation coefficient between left and right epididymis weight (VCTW). The current study implies DAZL may play important roles in testicular development and its SNPs are associated with testicular parameters, which supply important indicators for ram selection at early stage. Full article
(This article belongs to the Section Small Ruminants)
Show Figures

Figure 1

Figure 1
<p>The mRNA expression level of <span class="html-italic">deleted in azoospermia-like (DAZL)</span> during testicular development. Different letters above error bars indicate significant differences, <span class="html-italic">p</span> &lt; 0.05. Same as below.</p>
Full article ">Figure 2
<p>The mRNA expression level of <span class="html-italic">deleted in azoospermia-like (DAZL)</span> in different tissue and testes with different size at 6-month old (M6). (<b>a</b>): expression level of <span class="html-italic">DAZL</span> in different tissues at M6; (<b>b</b>): mRNA expression level of <span class="html-italic">DAZL</span> in the testes with different size at M6.</p>
Full article ">Figure 3
<p>Agarose gel electrophoresis of three genotypes in SNP6 locus within <span class="html-italic">deleted in azoospermia-like (DAZL ) gene</span>.</p>
Full article ">Figure 4
<p>Linkage disequilibrium analysis of 6 single nucleotide polymorphisms (SNPs).</p>
Full article ">
12 pages, 1240 KiB  
Article
Association Between BMP2 Functional Polymorphisms and Sheep Tail Type
by Zengkui Lu, Jianbin Liu, Jilong Han and Bohui Yang
Animals 2020, 10(4), 739; https://doi.org/10.3390/ani10040739 - 23 Apr 2020
Cited by 16 | Viewed by 2782
Abstract
Bone morphogenetic protein 2 (BMP2) is strongly selected in both fat-tailed and thin-tailed sheep and may be a candidate gene for sheep tail type selection. However, the mechanism of action of BMP2 in sheep tail fat deposition remains unclear. This study [...] Read more.
Bone morphogenetic protein 2 (BMP2) is strongly selected in both fat-tailed and thin-tailed sheep and may be a candidate gene for sheep tail type selection. However, the mechanism of action of BMP2 in sheep tail fat deposition remains unclear. This study investigated genetic variation and haplotype combinations of the BMP2 gene in sheep with different tail types, aiming to reveal the molecular mechanism of BMP2 in sheep tail fat deposition. We detected a total of three single nucleotide polymorphisms (SNPs) (g.48401619 T > A, g.48401272 C > A, and g.48401136 C > T) among 533 sheep. The alleles and genotype frequencies of these SNPs were in Hardy–Weinberg equilibrium and showed significant correlations with tail length. Linkage disequilibrium existed between the g.48401272 C > A and g.48401136 C > T sites, where CACT was the predominant genotype. At the cellular level, the expression levels of peroxisome proliferator-activated receptor gamma (PPARγ) and lipoprotein lipase (LPL) were upregulated after BMP2 overexpression; there were significantly higher levels of PPARγ than controls at 0 d and 1 d, and of LPL than controls at 1 d and 7 d. These results indicate that the BMP2 gene may participate in sheep tail fat deposition and could be used for molecular-marker-assisted selection of sheep tail type. Full article
(This article belongs to the Section Small Ruminants)
Show Figures

Figure 1

Figure 1
<p><span class="html-italic">BMP2</span> gene pool sequencing and genotyping results. (A) Site of g.48401619 T &gt; A. (B) Site of g.48401272 C &gt; A. (C) Site of g.48401136 C &gt; T. Yellow region, blue region, and green region represent different genotypes. Numbers in brackets indicate number of individuals of the three genotypes. Chromatograms from DNA pool sequencing are shown in the top row, while the mass spectrometry results are presented in the bottom row.</p>
Full article ">Figure 2
<p>Linkage disequilibrium analysis of the <span class="html-italic">BMP2</span> gene.</p>
Full article ">Figure 3
<p>mRNA expression of the <span class="html-italic">PPARγ</span> and <span class="html-italic">LPL</span> genes. (<b>A</b>) mRNA expression of the <span class="html-italic">BMP2</span> gene. (<b>B</b>) mRNA expression of the <span class="html-italic">PPARγ</span> gene. (<b>C</b>) mRNA expression of the <span class="html-italic">LPL</span> gene. * <span class="html-italic">p</span> &lt; 0.05, ** <span class="html-italic">p</span> &lt; 0.01, NS: no significant difference. <span class="html-italic">ACTB</span> was used as a reference gene.</p>
Full article ">Figure 4
<p>Oil Red O staining when overexpressing the <span class="html-italic">BMP2</span> gene in sheep preadipocytes after 7 days of induced differentiation. (A) Control group. (B) <span class="html-italic">BMP2</span> overexpressed group.</p>
Full article ">
23 pages, 330 KiB  
Review
Commonalities in Management and Husbandry Factors Important for Health and Welfare of Captive Elephants in North America and Thailand
by Janine L. Brown, Pakkanut Bansiddhi, Jaruwan Khonmee and Chatchote Thitaram
Animals 2020, 10(4), 737; https://doi.org/10.3390/ani10040737 - 23 Apr 2020
Cited by 16 | Viewed by 5856
Abstract
This review paper is a synthesis of results from multiple studies that we have conducted over the past several years using similar methodologies to identify factors related to welfare of captive populations of elephants in North American zoos and Thailand tourist camps. Using [...] Read more.
This review paper is a synthesis of results from multiple studies that we have conducted over the past several years using similar methodologies to identify factors related to welfare of captive populations of elephants in North American zoos and Thailand tourist camps. Using multiple conservation physiology tools, we found that, despite vastly disparate management systems, there are commonalities in how environmental and husbandry factors affect physical and physiological outcomes. Elephants appear to have better welfare, based on fecal glucocorticoid metabolite (FGM) analyses, when housed under conditions that provide a more enriched, stimulating, and less restrictive environment. We also found it is essential to balance diet and exercise for good body condition and metabolic function. In Thailand, use of tools to control elephants, such as the ankus (i.e., guide, hook) and chains, did not equate to poor welfare per se, nor did riding; however, improper uses were associated with higher wound scores and FGM concentrations. Foot health was good overall in both regions, with cracks being the most common problem, and better foot scores were found in elephants kept on softer substrates. Based on these findings, science-based guidelines are being developed in Thailand, while in North America, changes are being incorporated into elephant standards and husbandry resource guides. Management across venues can be improved by encouraging elephant exploration and exercise, establishing socially compatibility groups, ensuring proper use of tools, and providing balanced diets. We contend there is no “one-size-fits-all” management strategy to guarantee good welfare for elephants, but there are essential needs that must be met regardless of where or how they are managed. Future studies are needed to find ways to better socialize elephants; determine how temperament affects coping styles and resilience; study the importance of good handler-elephant relationships; identify more ways for elephants to engage with the environment; and assess the effect of life history on subsequent physiological and psychological well-being. Full article
(This article belongs to the Special Issue Captive Elephant Welfare and Behaviour)
12 pages, 1957 KiB  
Article
Wolf Media Coverage in the Region of Castilla y León (Spain): Variations over Time and in Two Contrasting Socio-Ecological Settings
by Miguel Delibes-Mateos
Animals 2020, 10(4), 736; https://doi.org/10.3390/ani10040736 - 23 Apr 2020
Cited by 10 | Viewed by 3666
Abstract
People’s attitudes towards large carnivores, and thus public support for their conservation, can be influenced by how these species are framed in the media. Therefore, assessing media coverage of large carnivores is of particular interest for their coexistence with humans. I used content [...] Read more.
People’s attitudes towards large carnivores, and thus public support for their conservation, can be influenced by how these species are framed in the media. Therefore, assessing media coverage of large carnivores is of particular interest for their coexistence with humans. I used content analysis to assess how the grey wolf was portrayed in a newspaper in northern Spain, how wolf media coverage varied over time (2006–2017), and in two different socio-ecological settings. Most documents addressed the conflictive relationship between the wolf and livestock (60%; n = 902). Moreover, coverage of this relationship increased over the study period in the south of the study area, where the wolf is strictly protected, has recolonised new localities, and damage to livestock has increased. Overall, other topics, such as wolf conservation or hunting, appeared much less frequently in the media, but predominated in the north of the study area, where the wolf is more abundant and huntable. Conflictive issues like wolf-livestock interactions are generally attractive for audiences, but drawing attention to this issue may compromise the management of conflicts associated with wolves. Ideally, the media should promote potential wolf conservation values if coexistence between wolves and humans is sought. Full article
(This article belongs to the Section Wildlife)
Show Figures

Figure 1

Figure 1
<p>Location of the Castilla y León region in northern Spain. The River Douro divides the region in two sub-regions with highly contrasting situations in terms of wolf management, policy, and ecology.</p>
Full article ">Figure 2
<p>(<b>A</b>) Proportion of documents published annually that referred to the three categories of areas considered: north of the River Douro, south of the River Douro, and non-assignable (i.e., larger spatial scales or generic documents). (<b>B</b>) Proportion of documents published annually according to whether the wolf was the central theme of the article (primary) or not (secondary). The total number of documents published each year is shown in grey circles above the figure.</p>
Full article ">Figure 3
<p>Number of documents published on the four main topics identified based on the three categories of areas considered: north of the River Douro, south of the River Douro, and non-assignable (i.e., larger spatial scales or generic documents).</p>
Full article ">Figure 4
<p>Proportion of documents published annually about wolf-livestock interactions according to the three categories of areas considered: north of the River Douro, south of the River Douro, and non-assignable (i.e., larger spatial scales or generic documents). The total number of documents published every year on wolf-livestock interactions is shown in grey circles above the figure.</p>
Full article ">
20 pages, 323 KiB  
Article
Quality of Eggs, Concentration of Lysozyme in Albumen, and Fatty Acids in Yolk in Relation to Blue Lupin-Rich Diet and Production Cycle
by Emilia Kowalska, Joanna Kucharska-Gaca, Joanna Kuźniacka, Lidia Lewko, Ewa Gornowicz, Jakub Biesek and Marek Adamski
Animals 2020, 10(4), 735; https://doi.org/10.3390/ani10040735 - 23 Apr 2020
Cited by 8 | Viewed by 2871
Abstract
In recent years, the interest in lupin seeds as a source of protein in poultry nutrition has increased. The aim of this study was to assess the quality of table eggs produced by hens that were fed diets containing pea seeds and various [...] Read more.
In recent years, the interest in lupin seeds as a source of protein in poultry nutrition has increased. The aim of this study was to assess the quality of table eggs produced by hens that were fed diets containing pea seeds and various levels of narrow-leafed lupin as a substitute for soybean meal. The share of lupin seeds in the treatment groups was 10%, 15%, 20% and 25%. Egg morphology, the fatty acid profile in egg yolk and the amount and activity of lysozyme in egg white were analysed. Results show that using 10–20% lupin seeds in feed in the diet of laying hens in intensive farming does not result in a change in weight or egg structure, their physical properties or their morphological composition. Increasing the share of lupin seeds in feed for laying hens increases the saturation of the colour of egg yolks, which is a desirable feature among consumers. The use of lupin seeds in feed for laying hens does not adversely affect the chemical properties of egg proteins, as expressed by the amount and activity of lysozyme. In feed for laying hens, replacing soybean meal with lupin seeds has a positive effect on the fatty acid profile in egg yolk (omega-3 and -6 polyunsaturated acids and hypocholesterolemic acids). Full article
(This article belongs to the Special Issue Green Feeds and Byproducts)
13 pages, 2172 KiB  
Article
Increase in Milk Yield from Cows through Improvement of Forage Production Using the N2-Fixing Legume Leucaena leucocephala in a Silvopastoral System
by Lucero Sarabia-Salgado, Francisco Solorio-Sánchez, Luis Ramírez-Avilés, Bruno José Rodrigues Alves, Juan Ku-Vera, Carlos Aguilar-Pérez, Segundo Urquiaga and Robert Michael Boddey
Animals 2020, 10(4), 734; https://doi.org/10.3390/ani10040734 - 23 Apr 2020
Cited by 13 | Viewed by 3575
Abstract
The objective was to evaluate milk production, N2-fixation and N transfer, forage yield and composition (under two cutting intervals) in a silvopastoral system (SPS) with Leucaena leucocephala-Megathyrsus maximus and M. maximus-monoculture (MMM) with crossbred cows in a completely randomized design. [...] Read more.
The objective was to evaluate milk production, N2-fixation and N transfer, forage yield and composition (under two cutting intervals) in a silvopastoral system (SPS) with Leucaena leucocephala-Megathyrsus maximus and M. maximus-monoculture (MMM) with crossbred cows in a completely randomized design. Forage yield in the SPS was 6490 and 6907 kg DM ha−1 for cutting intervals (CI) of 35 and 50 days. Forage yield for the MMM was 7284 and 10,843 kg DM ha−1, and forage crude protein (CP) was 29.0% and 26.1% for L. leucocephala, harvested at 35 and 50 days, respectively. CP for the associated M. maximus was 9.9% and 7.8% for CI 35 and 50 days, respectively, and for MMM was 7.4% and 8.4%, harvested at 35 and 50 days. Milk production was 4.7 kg cow−1 day−1 for cows grazing MMM and 7.4 kg cow−1 day−1 under SPS. Nitrogen fixation in L. leucocephala (%Ndfa) was estimated to be 89% and 95%, at 35 and 50 days, with an N2 transfer to the associated grass of 34.3% and 52.9%. SPS has the potential to fix and transfer important amounts of N2 to the associated grass, and increase forage CP content and milk production. Full article
(This article belongs to the Section Animal System and Management)
Show Figures

Figure 1

Figure 1
<p>Monthly meteorological data for the experimental period (November 2011 to September 2012).</p>
Full article ">Figure 2
<p>Milk production (kg cow ha<sup>−</sup><sup>1</sup> day<sup>−</sup><sup>1</sup>) in the Silvopastoral System (SPS) and the <span class="html-italic">Megathyrsus maximus</span> in Monoculture (MMM).</p>
Full article ">Figure 3
<p>Total forage yield (kg DM ha<sup>−</sup><sup>1</sup>) in the Silvopastoral System (SPS) and the <span class="html-italic">Megathyrsus maximus</span> in Monoculture (MMM) under two cutting intervals of 35 and 50 days.</p>
Full article ">Figure 4
<p>Biomass species composition (%) from a SPS based on <span class="html-italic">L. leucocephala</span> and <span class="html-italic">M. maximus.</span></p>
Full article ">
8 pages, 1698 KiB  
Article
Changes in Pulse Rate, Respiratory Rate and Rectal Temperature in Working Dogs before and after Three Different Field Trials
by Mirella Lopedote, Simona Valentini, Vincenzo Musella, Jose Manuel Vilar and Giuseppe Spinella
Animals 2020, 10(4), 733; https://doi.org/10.3390/ani10040733 - 23 Apr 2020
Cited by 18 | Viewed by 8529
Abstract
Physiological changes (pulse rate, respiratory rate and rectal temperature) induced by exercise are usually studied as physical fitness indices. The aim of this study was to investigate how these physiological parameters could be modified in a group of trained working dogs during three [...] Read more.
Physiological changes (pulse rate, respiratory rate and rectal temperature) induced by exercise are usually studied as physical fitness indices. The aim of this study was to investigate how these physiological parameters could be modified in a group of trained working dogs during three different field trials (rubble, search on field, obedience), in order to assess which parameter would be more useful to detect the dog response to exercise. Nine dogs were included in this study. The animals were monitored at rest, immediately before and after the working session. Pulse rate values increased significantly in all the phases compared to rest status. Respiratory rate values increased significantly after the competition, while rectal temperature was significantly increased only after search on rubbles and obedience activities. Reference values for specific competitions need to be stablished in order to promptly identify poor performance or exercise intolerance. Full article
Show Figures

Graphical abstract

Graphical abstract
Full article ">Figure 1
<p>Scenario related to the rubble activity; specifically, the part with highly unstable concrete beams that reproduce the “<span class="html-italic">Shanghai game</span>” effect.</p>
Full article ">Figure 2
<p>Pulse rate (PR) data obtained at rest, before (pre) and after (post) the specific activity. * = <span class="html-italic">p</span> &lt; 0.05 between rest and before activity; <sup>#</sup> = <span class="html-italic">p</span> &lt; 0.05 between before and after activity; ° = <span class="html-italic">p</span> &lt; 0.05 between rest and post activity.</p>
Full article ">Figure 3
<p>Respiratory rate (RR) observed at rest, before (pre) and after (post) the specific activity. * = <span class="html-italic">p</span> &lt; 0.05 between rest and before activity (<span class="html-italic">p</span> &lt; 0.05); <sup>#</sup> = <span class="html-italic">p</span> &lt; 0.05 between before and after activity (<span class="html-italic">p</span> &lt; 0.05); ° = <span class="html-italic">p</span> &lt; 0.05 between rest and post activity.</p>
Full article ">Figure 4
<p>Rectal Temperature (RT) observed at rest, before (pre) and after (post) the specific activity. <sup>#</sup> = <span class="html-italic">p</span> &lt; 0.05 before and after activity; ° = <span class="html-italic">p</span> &lt; 0.05 between rest and post activity.</p>
Full article ">
13 pages, 809 KiB  
Article
In Vitro Estimation of the Effect of Grinding on Rumen Fermentation of Fibrous Feeds
by Ignacio Rubén Ortolani, Zahia Amanzougarene and Manuel Fondevila
Animals 2020, 10(4), 732; https://doi.org/10.3390/ani10040732 - 23 Apr 2020
Cited by 3 | Viewed by 2506
Abstract
The fermentation patterns of six fiber sources, soybean hulls (SH), sugarbeet pulp (BP), palm kernel cake (PK), oat hulls (OH), dehydrated alfalfa meal (DA), and barley straw (BS) were evaluated for this study on the effect of their presentation form (non-processed, NP and [...] Read more.
The fermentation patterns of six fiber sources, soybean hulls (SH), sugarbeet pulp (BP), palm kernel cake (PK), oat hulls (OH), dehydrated alfalfa meal (DA), and barley straw (BS) were evaluated for this study on the effect of their presentation form (non-processed, NP and ground, GR). Substrates were tested in a conventional in vitro batch system, using rumen fluid obtained from ewes fed 0.5 alfalfa hay and 0.5 barley straw. All substrates rendered a higher gas production in GR form (p < 0.05) except for BS but ranked similarly irrespective of the presentation form. Among the substrates, when incubated NP, the highest volume of gas was recorded with BP from 8 h onwards (p < 0.05), whereas OH and BS resulted in the lowest gas volume (p < 0.05). During the first half of the incubation period, methane production was higher in GR than NP (p < 0.05). Among substrates, despite NP or GR, methane production with BP was the highest (p < 0.05). Similarly, the presentation form did not qualitatively affect fermentation, as no differences were observed in volatile fatty acids proportions. The effect of particle size of fibrous substrates does not have a major impact on the rate and extent of the rumen microbial fermentation. Full article
Show Figures

Figure 1

Figure 1
<p>Pattern of gas production from the fibrous substrates (SH △, BP▲, PK ■, OH ♦, DA ☐, and BS ●) incubated non-processed (NP). Upper bars show standard error of means (n = 4).</p>
Full article ">Figure 2
<p>Pattern of gas production from the fibrous substrates (SH △, BP▲, PK ■, OH ♦, DA ☐, and BS ●) incubated ground (GR). Upper bars show standard error of means (n = 4).</p>
Full article ">Figure 3
<p>Average pattern of methane production (mmol/g OM) from fibrous substrates (SH △, BP▲, PK ■, OH ♦, DA ☐, and BS ●) incubated non-processed (NP, (<b>a</b>)) or ground (GR, (<b>b</b>)). Upper bars show standard error of means (n = 4)</p>
Full article ">
11 pages, 1286 KiB  
Article
Effect of High-Dose Topical Minoxidil on Erythrocyte Quality in SKH1 Hairless Mice
by Eduardo Naranjo-Vázquez, María Guadalupe Sánchez-Parada, Belinda Claudia Gómez-Meda, Ana Lourdes Zamora-Perez, Martha Patricia Gallegos-Arreola, Ana Elizabeth González-Santiago and Guillermo Moisés Zúñiga-González
Animals 2020, 10(4), 731; https://doi.org/10.3390/ani10040731 - 23 Apr 2020
Cited by 3 | Viewed by 3265
Abstract
SKH1 hairless mice are widely used in carcinogenesis and dermatology research due to their bare skin, as exposure to different agents is facilitated. Minoxidil is a cosmetic drug that is recognized as a mitogenic agent, and mitogens are suggested to have carcinogenic and [...] Read more.
SKH1 hairless mice are widely used in carcinogenesis and dermatology research due to their bare skin, as exposure to different agents is facilitated. Minoxidil is a cosmetic drug that is recognized as a mitogenic agent, and mitogens are suggested to have carcinogenic and mutagenic potential by inducing cell division and increasing the possibility of perpetuating DNA damage. Therefore, we hypothesized that the application of high doses of minoxidil to the skin of hairless mice would increase the number of micronucleated erythrocytes (MNEs) in peripheral blood. The objective of this study was to evaluate the topical administration of high doses of minoxidil on peripheral blood erythrocytes of SKH1 mice by means of micronucleus assay. Minoxidil was administered on the entire body surface of mice every 12 or 24 h. Minoxidil dosing every 24 h increased the number of micronucleated polychromatic erythrocytes (MNPCEs), and dosing every 12 h increased the number of MNEs and MNPCEs, as compared to baseline and the negative control group. No decrease in polychromatic erythrocyte frequencies was observed in the minoxidil groups. Therefore, topical application of high minoxidil doses to mice can produce DNA damage, as observed through an increase in the number of MNEs, without producing cytotoxicity, possibly due to its mitogenic effect. Full article
(This article belongs to the Section Animal Physiology)
Show Figures

Figure 1

Figure 1
<p>Frequency of micronucleated erythrocytes (MNEs) in the study groups at the different sampling times. Frequency values are expressed as the mean ± standard deviation in 1000 cells (‰). h: hours. Intergroup comparisons were made between the study groups: * <span class="html-italic">versus</span> negative control and ** <span class="html-italic">versus</span> vehicle. Intragroup comparisons were made between the * basal value (0 h) and sampling times (144 and 240 h).</p>
Full article ">Figure 2
<p>Frequency of micronucleated polychromatic erythrocytes (MNPCEs) in the study groups at the different sampling times. Frequency values are expressed as the mean ± standard deviation in 1000 cells (‰). PCEs: polychromatic erythrocytes; h: hours. Intergroup comparisons were made between the study groups: * <span class="html-italic">versus</span> negative control and ** <span class="html-italic">versus</span> vehicle. Intragroup comparisons were made between the * basal value (0 h) and sampling times (144 and 240 h).</p>
Full article ">Figure 3
<p>Frequency of polychromatic erythrocytes (PCEs) in the study groups at the different sampling times. Frequency values are expressed as the mean ± standard deviation in 1000 cells (‰). h: hours; NS: not significant. Intergroup comparisons were between the study groups: * <span class="html-italic">versus</span> negative control and ** <span class="html-italic">versus</span> vehicle. Intragroup comparisons were made between the * basal value (0 h) and sampling times (144 and 240 h).</p>
Full article ">
16 pages, 3846 KiB  
Article
An Assay System to Evaluate Riboflavin/UV-A Corneal Phototherapy Efficacy in a Porcine Corneal Organ Culture Model
by Anna Perazzi, Chiara Gomiero, Livio Corain, Ilaria Iacopetti, Enrico Grisan, Marco Lombardo, Giuseppe Lombardo, Gianni Salvalaio, Roberta Contin, Marco Patruno, Tiziana Martinello and Antonella Peruffo
Animals 2020, 10(4), 730; https://doi.org/10.3390/ani10040730 - 23 Apr 2020
Cited by 6 | Viewed by 2378
Abstract
The purpose of this study was to investigate the response of porcine corneal organ cultures to riboflavin/UV-A phototherapy in the injury healing of induced lesions. A porcine corneal organ culture model was established. Corneal alterations in the stroma were evaluated using an assay [...] Read more.
The purpose of this study was to investigate the response of porcine corneal organ cultures to riboflavin/UV-A phototherapy in the injury healing of induced lesions. A porcine corneal organ culture model was established. Corneal alterations in the stroma were evaluated using an assay system, based on an automated image analysis method able to (i) localize the holes and gaps within the stroma and (ii) measure the brightness values in these patches. The analysis has been performed by dividing the corneal section in 24 regions of interest (ROIs) and integrating the data analysis with a “multi-aspect approach.” Three group of corneas were analyzed: healthy, injured, and injured-and-treated. Our study revealed a significant effect of the riboflavin/UV-A phototherapy in the injury healing of porcine corneas after induced lesions. The injured corneas had significant differences of brightness values in comparison to treated (p < 0.00) and healthy (p < 0.001) corneas, whereas the treated and healthy corneas showed no significant difference (p = 0.995). Riboflavin/UV-A phototherapy shows a significant effect in restoring the brightness values of damaged corneas to the values of healthy corneas, suggesting treatment restores the injury healing of corneas after lesions. Our assay system may be compared to clinical diagnostic methods, such as optical coherence tomography (OCT) imaging, for in vivo damaged ocular structure investigations. Full article
(This article belongs to the Section Companion Animals)
Show Figures

Figure 1

Figure 1
<p>(<b>a</b>) healthy enucleated porcine eyes; (<b>b</b>) porcine eyes showing the filter paper placed on the center of the ocular surface; (<b>c</b>) application of isoosmolar 0.1% riboflavin drops into a circular plastic for 30 min; (<b>d</b>) details of the UV-A lamp with an irradiance of 30 mW/cm<sup>2</sup> during riboflavin/UV-A corneal phototherapy.</p>
Full article ">Figure 2
<p>Schematic representation of the cornea, dorsal view; the central area (blue), identifies the area of the induced lesion in the cornea; the red lines represent the points for the collection of the histological slides. Serial cuts have been performed at regular intervals of 1000 μm from each (red lines) to examine each cornea in the totality of its diameter: the protocol provided the elimination of a first portion of the sample considered not significant for the evaluation of the lesion area. From each cornea, transverse sections (slides) of 5 μm thickness were obtained at every cutting point using a Leica RM2035 microtome.</p>
Full article ">Figure 3
<p>Cross-section of hematoxylin-eosin stained porcine cornea. The black lines indicate the regions into which the corneas are subdivided for performing the measurements. The grid outline of the 6 radial frames along the minor axis and the 4 layers along the major axis, thus obtaining 24 ROIs per corneal slides. The entire stromal thickness has been analyzed in each section of the three corneal populations considered. The stroma located at the top of the corneal section represents the anterior part of the cornea; the inferior part represents the inner (posterior) stroma of the cornea.</p>
Full article ">Figure 4
<p>Automatic procedure for the identification of the cornea section boundaries and center-line; (<b>a</b>) section boundaries after thresholding and morphological filtering; (<b>b</b>) initialization of the center line with a polynomial (red); (<b>c</b>) analysis of straight lines (green) normal to the polynomial and update of the center points (red circles); (<b>d</b>) the final estimate of the center line. The stroma located on the right of the corneal section represents the anterior part of the cornea; the stroma located on the left side represents the inner (posterior) stroma.</p>
Full article ">Figure 5
<p>Corneal section images after Hematoxylin &amp; Eosin histological staining; (<b>A</b>) healthy cornea slide, note normal appearance of corneas’ thickness and the stroma show compact collagen lamellae; (<b>B</b>) injured cornea showing the alteration in the structure of the stroma, the lamellas of collagen fibers appeared disorganized with the presence numerous fissures; (<b>C</b>) details of the riboflavin/UV-A corneal phototherapy treated cornea, showing a more compact collagen lamellae respect to injured corneas. The fissures between the lamellae appear reduced. The stroma located on the right of the corneal section represents the anterior part of the cornea; the left part represents the inner (posterior) stroma of the cornea.</p>
Full article ">Figure 6
<p>Boxplot representation of the brightness distribution among the corneal populations; (<b>a</b>) boxplot images comparing brightness by population; (<b>b</b>) by population and depth layer; (<b>c</b>) by population and radial frame; (<b>d</b>) by population and combination of the depth layer and radial frame.</p>
Full article ">Figure 7
<p>Interaction Plot showing the brightness distribution by population and the depth layer separately for the three corneal populations.</p>
Full article ">Figure 8
<p>Main effects plot for brightness graphically representing the estimated fixed effect due to population, radial frame and depth layer.</p>
Full article ">Figure 9
<p>Heat map representing the 24 ROI (4 layers and 6 radial frames) of the cornea and the related <span class="html-italic">p</span>-values for the comparison treated vs. healthy corneas, (either in location and in scatter). The <span class="html-italic">p</span>-values &lt; 5% are marked by a red color (more intense as the <span class="html-italic">p</span>-value gets smaller).</p>
Full article ">
20 pages, 355 KiB  
Review
Synthetic and Crystalline Amino Acids: Alternatives to Soybean Meal in Chicken-Meat Production
by Peter H. Selle, Juliano Cesar de Paula Dorigam, Andreas Lemme, Peter V. Chrystal and Sonia Y. Liu
Animals 2020, 10(4), 729; https://doi.org/10.3390/ani10040729 - 22 Apr 2020
Cited by 60 | Viewed by 7446
Abstract
: This review explores the premise that non-bound (synthetic and crystalline) amino acids are alternatives to soybean meal, the dominant source of protein, in diets for broiler chickens. Non-bound essential and non-essential amino acids can partially replace soybean meal so that requirements are [...] Read more.
: This review explores the premise that non-bound (synthetic and crystalline) amino acids are alternatives to soybean meal, the dominant source of protein, in diets for broiler chickens. Non-bound essential and non-essential amino acids can partially replace soybean meal so that requirements are still met but dietary crude protein levels are reduced. This review considers the production of non-bound amino acids, soybeans, and soybean meal and discusses the concept of reduced-crude protein diets. There is a focus on specific amino acids, including glycine, serine, threonine, and branched-chain amino acids, because they may be pivotal to the successful development of reduced-crude protein diets. Presently, moderate dietary crude protein reductions of approximately 30 g/kg are feasible, but more radical reductions compromise broiler performance. In theory, an ‘ideal’ amino acid profile would prevent this, but this is not necessarily the case in practice. The dependence of the chicken-meat industry on soybean meal will be halved if crude protein reductions in the order of 50 g/kg are attained without compromising the growth performance of broiler chickens. In this event, synthetic and crystalline, or non-bound, amino acids will become viable alternatives to soybean meal in chicken-meat production. Full article
(This article belongs to the Special Issue Alternatives Protein in Animal Nutrition)
24 pages, 6905 KiB  
Article
Is Dietary 2-Oxoglutaric Acid Effective in Accelerating Bone Growth and Development in Experimentally-Induced Intrauterine Growth Retarded Gilts?
by Ewa Tomaszewska, Piotr Dobrowolski, Małgorzata Świątkiewicz, Janine Donaldson, Iwona Puzio and Siemowit Muszyński
Animals 2020, 10(4), 728; https://doi.org/10.3390/ani10040728 - 22 Apr 2020
Cited by 9 | Viewed by 3173
Abstract
In this study, the effect of long-term 2-oxoglutaric acid (2-Ox) supplementation to experimentally-induced intrauterine growth retarded gilts was examined. Sows were treated with synthetic glucocorticoid (dexamethasone) every second day, during the last 45 days of pregnancy, at a dose of 0.03 mg/kg b.w. [...] Read more.
In this study, the effect of long-term 2-oxoglutaric acid (2-Ox) supplementation to experimentally-induced intrauterine growth retarded gilts was examined. Sows were treated with synthetic glucocorticoid (dexamethasone) every second day, during the last 45 days of pregnancy, at a dose of 0.03 mg/kg b.w. At birth, the gilts were randomly divided into two groups: unsupplemented and supplemented with 2-Ox for nine months (0.4 g/kg body weight/day). Oral supplementation of 2-Ox to experimentally-induced intrauterine growth retarded gilts increased body weight at weaning as well as final body weight at the age of nine months, and showed a regenerative effect on bone mineralization and morphology of trabeculae and articular cartilage. The positive effects on bone structure were attributed to the 2-Ox-induced alterations in bone metabolism, as evidenced by the changes in the expression of proteins involved in bone formation and remodeling: osteocalcin (OC), osteoprotegerin (OPG), receptor activator of nuclear factor kappa-Β ligand (RANKL), tissue inhibitor of metalloproteinases 2 (TIMP-2), bone morphogenetic protein 2 (BMP-2), cartilage oligomeric matrix protein (COMP), and vascular endothelial growth factor (VEGF). Full article
Show Figures

Figure 1

Figure 1
<p>Scheme showing the experimental design. From the 70th day of gestation to parturition, dexamethasone (DEX) was administered to each sow at the dose of 0.03 mg/kg body weight (b.w.) every second day. After delivery, all newborn gilts were randomly assigned to one of the two experimental groups: the control group (not administered with <b>2-oxoglutaric acid</b> (2-Ox)) or the group supplemented with 2-Ox with the dose 0.4 g/kg b.w. daily for nine months (2-Ox group). After weaning, the gilts were kept in group pens, with each litter in a separate pen. After final weighing at the age of nine months, one gilt from each litter/pen with a body weight closest to the average body weight of the experimental group was selected and euthanized.</p>
Full article ">Figure 2
<p>The effect of dietary supplementation of 2-Ox on body weight in glucocorticoid (GC)-induced retarded mature gilts. Control—the control group included retarded gilts not supplemented with 2-Ox; 2-Ox—the 2-Ox group included retarded gilts supplemented with 2-Ox. Data are mean values ± SD. Statistical significance: * <span class="html-italic">p</span> &lt; 0.05; ** <span class="html-italic">p</span> &lt; 0.01 (two-tailed Student’s <span class="html-italic">t</span>-test).</p>
Full article ">Figure 3
<p>The effect of dietary supplementation with 2-Ox on the geometric and mechanical parameters of femora from glucocorticoid-induced, growth-retarded, mature gilts: (<b>A</b>) bone length; (<b>B</b>) bone weight; (<b>C</b>) relative bone weight; (<b>D</b>) bone mineral content (BMC); (<b>E</b>) bone mineral density (BMD); (<b>F</b>) bone diaphysis cross-sectional moment of inertia (CSMI); (<b>G</b>) bone diaphysis cross-sectional area; (<b>H</b>) bone diaphysis mean relative wall thickness (MRWT); (<b>I</b>) bone diaphysis cortical index; (<b>J</b>) ultimate force; and (<b>K</b>) ultimate stress. Control—the control group included growth-retarded gilts not supplemented with 2-Ox; 2-Ox—the 2-Ox group included growth-retarded gilts supplemented with 2-Ox at a dose of 0.4 g/kg b.w./day. Data are mean values ± SD (whiskers) from <span class="html-italic">n</span> = 6 gilts. Statistical significance: * <span class="html-italic">p</span> &lt; 0.05; ** <span class="html-italic">p</span> &lt; 0.01 (two-tailed Student’s <span class="html-italic">t</span>-test or Mann–Whitney <span class="html-italic">U</span> test).</p>
Full article ">Figure 4
<p>The effect of dietary supplementation with 2-Ox on the thickness of zones in femoral articular cartilage and growth plate cartilage in glucocorticoid-induced, growth-retarded, mature gilts. Articular cartilage: (<b>A</b>) total cartilage thickness; (<b>B</b>) superficial zone; (<b>C</b>) transitional zone; (<b>D</b>) radial zone. Growth plate cartilage: (<b>a</b>) total cartilage thickness; (<b>b</b>) reserve zone; (<b>c</b>) proliferation zone; (<b>d</b>) hypertrophy zone; (<b>e</b>) ossification zone. Control—the control group included growth-retarded gilts not supplemented with 2-Ox; 2-Ox—the 2-Ox group included growth-retarded gilts supplemented with 2-Ox at a dose of 0.4 g/kg b.w./day. Data are mean values ± SD (whiskers) from <span class="html-italic">n</span> = 6 gilts. Statistical significance: * <span class="html-italic">p</span> &lt; 0.05; ** <span class="html-italic">p</span> &lt; 0.01; *** <span class="html-italic">p</span> &lt; 0.001 (two-tailed Student’s <span class="html-italic">t</span>-test or Mann–Whitney <span class="html-italic">U</span> test).</p>
Full article ">Figure 5
<p>The effect of dietary supplementation with 2-Ox on the histomorphometry of femoral trabeculae in bone epiphysis (<b>A</b>–<b>F</b>) and metaphysis (<b>a</b>–<b>f</b>) in glucocorticoid-induced, growth-retarded, mature gilts. BV/TV—relative bone volume; Tb.N—trabecular number; Tb.Th—trabecular thickness; Tb.Sp—trabecular separation. Control—the control group included growth-retarded gilts not supplemented with 2-Ox; 2-Ox—the 2-Ox group included growth-retarded gilts supplemented with 2-Ox at a dose of 0.4 g/kg b.w./day. Data are mean values ± SD (whiskers) from <span class="html-italic">n</span> = 6 gilts. Statistical significance: * <span class="html-italic">p</span> &lt; 0.05; ** <span class="html-italic">p</span> &lt; 0.01 (two-tailed Student’s <span class="html-italic">t</span>-test or Mann–Whitney <span class="html-italic">U</span> test).</p>
Full article ">Figure 6
<p>The effect of dietary supplementation with 2-Ox on the femoral articular cartilage structure in glucocorticoid-induced, growth-retarded, mature gilts (Safranine O staining). (<b>A</b>) The articular cartilage of the control group (growth-retarded gilts not supplemented with 2-Ox). (<b>a</b>) The articular cartilage of the 2-Ox group (growth-retarded gilts supplemented with 2-Ox at a dose of 0.4 g/kg b.w./day). Differences were observed in the distribution and staining intensity of proteoglycans in the femoral articular cartilage (darker Safranine O staining is associated with a higher proteoglycan content). The zones of the articular cartilage: superficial zone (SZ), transitional zone (TZ), and radial zone (RZ). Each scale bar shows 50 µm.</p>
Full article ">Figure 7
<p>Representative pictures of the immunohistochemical analysis of bone morphogenetic protein 2, BMP-2 (<b>A</b>,<b>a</b>); glucocorticoid receptors, GRs (<b>B</b>,<b>b</b>); osteoprotegerin, OPG (<b>C</b>,<b>c</b>); receptor activator of nuclear factor kappa-Β ligand, RANKL (<b>D</b>,<b>d</b>); tissue inhibitor of metalloproteinases 2, TIMP-2 (<b>E</b>,<b>e</b>); osteocalcin, OC (<b>F</b>,<b>f</b>); and vascular endothelial growth factor, VEGF (<b>G</b>,<b>g</b>), carried out on formaldehyde-fixed sections from the femoral trabeculae of gilts from the control group (growth-retarded gilts not supplemented with 2-Ox (<b>A</b>–<b>G</b>)) and the 2-Ox group (growth-retarded gilts supplemented with 2-Ox at a dose of 0.4 g/kg b.w./day (<b>a</b>–<b>g</b>)). Negative protein expression is represented by blue staining of the cytoplasm in the chondrocytes, while positive protein expression is represented by brown staining in the cells. Additionally, proteins (BMP-2, OC, RANKL, VEGF) secreted and released into the matrix are also stained in a brown color. (*)—anti-body control reaction. Each scale bar shows 50 µm.</p>
Full article ">Figure 8
<p>Representative pictures of the immunohistochemical analysis of bone morphogenetic protein 2, BMP-2 (<b>A</b>,<b>a</b>); glucocorticoid receptors, GRs (<b>B</b>,<b>b</b>); receptor activator of nuclear factor kappa-Β ligand, RANKL (<b>C</b>,<b>c</b>); tissue inhibitor of metalloproteinases 2, TIMP-2 (<b>D</b>,<b>d</b>); osteoprotegerin, OPG (<b>E</b>,<b>e</b>); and vascular endothelial growth factor, VEGF (<b>F</b>,<b>f</b>,<b>G</b>,<b>g</b>), carried out on formaldehyde-fixed sections from the femoral growth plate cartilage in the control group (growth-retarded gilts not supplemented with 2-Ox (<b>A</b>–<b>G</b>)) and the 2-Ox group (growth-retarded gilts supplemented with 2-Ox at a dose of 0.4 g/kg b.w./day (<b>a</b>–<b>g</b>)). Negative protein expression is represented by blue staining of the cytoplasm in the chondrocytes, while positive protein expression is represented by brown staining in the cells. Additionally, proteins (BMP-2, OC, RANKL, VEGF) secreted and released into the matrix are also stained in a brown color. (*,#)—anti-body control reaction. In (<b>e</b>), the zones of the articular cartilage are labeled as follows: reserve zone (<b>RZ</b>), proliferation zone (<b>PZ</b>), hypertrophy zone (<b>HZ</b>), and ossification zone (<b>OE</b>), as well as trabecular bone (<b>TB</b>). Each scale bar shows 50 µm.</p>
Full article ">
22 pages, 386 KiB  
Article
Evaluation of Heavy Metal Content in Feed, Litter, Meat, Meat Products, Liver, and Table Eggs of Chickens
by Mohamed A. Korish and Youssef A. Attia
Animals 2020, 10(4), 727; https://doi.org/10.3390/ani10040727 - 22 Apr 2020
Cited by 71 | Viewed by 9161
Abstract
We assessed the concentrations of Fe, Cu, Zn, Mn, Se, Co, Cr, Pb, Cd, and Ni in chicken meat and meat products, feed, and litter, as well as laying hens’ eggs, feed and litter to monitor the quality of products on the market [...] Read more.
We assessed the concentrations of Fe, Cu, Zn, Mn, Se, Co, Cr, Pb, Cd, and Ni in chicken meat and meat products, feed, and litter, as well as laying hens’ eggs, feed and litter to monitor the quality of products on the market and their safety for human consumption as judged by recommended daily allowance (RDA) and tolerable upper levels. Samples were chosen as the most popular poultry products in Saudi Arabia. A total of 45 broiler samples of frozen or fresh meat, liver, burger, or frankfurter were chosen from the same brand. Additionally, 60 table eggs from four commercial brands were collected, and the edible parts of these were used to determine levels of minerals and toxic elements. Furthermore, 30 feed and litter samples were collected from the starter, grower, and layer diets of broilers and laying hens. The results indicated that there were significant levels of most of the trace elements and heavy metals in the different meat sources. Furthermore, the liver contained the highest levels of elements, except for Cr, Co, and Ni. The highest Cr level was detected in the fresh meat, followed by frozen meat. Trace elements (Mn and Co) and heavy metals (Ni and Pb) were not detected in either the frozen or the fresh meat. The chicken burger and the frankfurter exhibited similar trace-element and heavy-metal contents, except for Zn and Mn, as the frankfurter showed higher concentrations than the burger. Differences in most of the trace and toxic elements among the different sources of eggs were not found to be significant, except for Zn. Differences between the broiler meat and table eggs were only substantial for Fe and Zn. Fe was significantly higher in meat than in eggs, and the opposite trend was found for Zn. The liver contained higher heavy metals than the eggs, except for Cr. In addition, the burger had higher concentrations of essential (Cu and Co) and heavy metals (Pb and Ni) than the eggs but had lower levels of Zn and Cr. The frankfurter exhibited significantly higher levels of Fe, Cu, Mn, Co, Pb, and Ni than the eggs but lower levels of Zn and Cr. To summarize, Cd, Pb, As, and Se were not detected in the broiler meat or eggs, indicating no risks from these toxic elements. Conversely, the liver exhibited the highest content of heavy metals, except for Cr, indicating that the intake of Pb and Cd was above the recommended daily allowance (RDA) for adults. The meat products exhibited higher Pb, Cd, and Ni levels than the broiler meat and the table eggs, suggesting that they posed a health threat to humans, and the intake of Pb in the meat products was higher than the RDA. Thus, chicken meat and table eggs, which are primary protein sources, are safe sources of human nutrition, while liver and meat products may present potential health hazards through the food chain. Full article
16 pages, 2254 KiB  
Article
Effects of Tributyrin Supplementation on Growth Performance, Insulin, Blood Metabolites and Gut Microbiota in Weaned Piglets
by Stefania Sotira, Matteo Dell’Anno, Valentina Caprarulo, Monika Hejna, Federica Pirrone, Maria Luisa Callegari, Telma Vieira Tucci and Luciana Rossi
Animals 2020, 10(4), 726; https://doi.org/10.3390/ani10040726 - 22 Apr 2020
Cited by 36 | Viewed by 7361
Abstract
The aim of this study was to investigate the effects of tributyrin supplementation on the production traits, the main metabolic parameters and gut microbiota in weaned piglets. One hundred and twenty crossbred piglets (Large White × Landrace) were randomly divided into two experimental [...] Read more.
The aim of this study was to investigate the effects of tributyrin supplementation on the production traits, the main metabolic parameters and gut microbiota in weaned piglets. One hundred and twenty crossbred piglets (Large White × Landrace) were randomly divided into two experimental groups (six pens each; 10 piglets per pen): the control group (CTRL), that received a basal diet, and the tributyrin group (TRIB) that received the basal diet supplemented with 0.2% tributyrin. The experimental period lasted 40 days. Production traits were measured at days 14, 28 and 40. A subset composed of 48 animals (n = 4 for each pen; n = 24 per group) was considered for the evaluation of serum metabolic parameters and hair cortisol by enzyme-linked immunosorbent assay (ELISA), and faecal microbiota by real-time polymerase chain reaction (PCR). Our results showed that the treatment significantly increased body weight (BW) at day 28 and day 40 (p = 0.0279 and p = 0.0006, respectively) and average daily gain (ADG) from day 28 to day 40 (p = 0.046). Gain to feed ratio (G:F) was significantly higher throughout the experimental period (p = 0.049). Even if the serum parameters were in the physiological range, albumin, albumin/globulin (A/G) ratio, glucose and high-density lipoproteins (HDL) fraction were significantly higher in the TRIB group. On the contrary, tributyrin significantly decreased the urea blood concentration (p = 0.0026), which was correlated with lean gain and feed efficiency. Moreover, serum insulin concentration, which has a regulatory effect on protein and lipid metabolism, was significantly higher in the TRIB group (p = 0.0187). In conclusion, this study demonstrated that tributyrin can be considered as a valid feed additive for weaned piglets. Full article
(This article belongs to the Special Issue Effects of Dietary Supplements on Livestock and Poultry Products)
Show Figures

Graphical abstract

Graphical abstract
Full article ">Figure 1
<p>Serum insulin concentrations (pg/mL) in the control group (CTRL) and in the group of piglets fed a diet supplemented with 0.2% tributyrin (TRIB). Data are presented as the mean ± SE. a,b: significant differences between groups (<span class="html-italic">p</span> = 0.0187).</p>
Full article ">Figure 2
<p>Hair cortisol concentrations (pg/mg) in the control group (CTRL) and in the group of piglets fed a diet supplemented with 0.2% tributyrin (TRIB). Data are presented as the mean ± SE. a,b: significant differences between groups (<span class="html-italic">p</span> = 0.018).</p>
Full article ">Figure 3
<p>(<b>a</b>) <span class="html-italic">Enterobacteriaceae</span> abundance expressed as log ng of target/ng of total bacterial DNA in the faecal samples of the control group and in the group of piglets fed a diet supplemented with 0.2% tributyrin. (<b>b</b>) <span class="html-italic">E. coli</span> abundance expressed as log ng of target/ng of total bacterial DNA in the faecal samples of the control group and in the group of piglets fed a diet supplemented with 0.2% tributyrin.</p>
Full article ">Figure 4
<p>(<b>a</b>) <span class="html-italic">Lactobacillus</span> spp. abundance expressed as log ng of target/ng of total bacterial DNA in the faecal samples of the control group and in the group of piglets fed a diet supplemented with 0.2% tributyrin. (<b>b</b>) <span class="html-italic">Bifidobacterium</span> spp. abundance expressed as log ng of target/ng of total bacterial DNA in the faecal samples of the control group and in the group of piglets fed a diet supplemented with 0.2% tributyrin.</p>
Full article ">
17 pages, 1229 KiB  
Article
Milk Composition of Asian Elephants (Elephas maximus) in a Natural Environment in Myanmar during Late Lactation
by Ellen S. Dierenfeld, Yadana A. M. Han, Khyne U. Mar, Aung Aung, Aung Thura Soe, Virpi Lummaa and Mirkka Lahdenperä
Animals 2020, 10(4), 725; https://doi.org/10.3390/ani10040725 - 22 Apr 2020
Cited by 7 | Viewed by 3583
Abstract
The nutritional content of milk from free-living Asian elephants has not previously been reported, despite being vital for better management of captive populations. This study analyzed both milk composition and consumed plant species of Asian elephants managed in their natural environment in Myanmar. [...] Read more.
The nutritional content of milk from free-living Asian elephants has not previously been reported, despite being vital for better management of captive populations. This study analyzed both milk composition and consumed plant species of Asian elephants managed in their natural environment in Myanmar. Longitudinal samples (n = 36) were obtained during both the wet and the dry season from six mature females in mid to late lactation in 2016 and 2017. Milk composition averaged 82.44% water, with 17.56% total solids containing 5.23% protein, 15.10% fat, 0.87% ash, and 0.18 µg/mL vitamin E. Solids and protein increased with lactation month. Total protein in milk was higher during the wet vs. the dry season. Observed factors linked with maternal (age, parity, size and origin) and calf traits (sex) had significant associations with milk nutrient levels. Primary forages consumed contained moderate protein and fiber. Higher dietary protein during the wet season (11–25%) compared to the dry season (6–19%) may be linked with increased milk protein observed. Our results call for further field studies of milk and diet composition, over entire seasons/lactation periods, and across maternal and calf traits, to improve feeding management, with an overall goal of maximized health and survival. Full article
(This article belongs to the Section Animal Nutrition)
Show Figures

Figure 1

Figure 1
<p>Variation in milk components with lactation month (calf age). Solids (<b>a</b>) and protein components (<b>b</b>) increased in later lactation months during late lactation in females’ milk. Points represent raw data for different mothers and solid lines show predicted values from the model with CLs (dashed lines). Predicted values drawn from the model according to reference categories and captive-born mothers. SZ, TAM, WMT, HTK, TBM, SHO: Elephant names coded as initials of house names.</p>
Full article ">Figure 2
<p>Sex and seasonal differences in protein composition of elephant milk. Protein composition was higher in milk of mothers with female calves compared to male calves (<b>a</b>) and protein content in milk was higher during the wet season compared to the cold, dry season in Myanmar (<b>b</b>). Figures show standard errors (error bars) and predicted means (bars).</p>
Full article ">Figure 3
<p>Variation in milk components with maternal age at calf birth. Solids components (<b>a</b>) increased with greater maternal age whereas (<b>b</b>) ash components in late lactation milk. Points represent raw data for different mothers and solid lines show predicted values from the model with CLs (dashed lines). Predicted values drawn from the model according to reference categories and captive-born mothers.</p>
Full article ">Figure 4
<p>Seasonal changes in milk protein vs. forage protein by three plant groups. Milk and forage protein values were higher during wet season compared to dry season values (<span class="html-italic">n</span> = 36 milk protein values from six mothers, mothers identified by different symbols; <span class="html-italic">n</span> = 6 mean forage protein values (green symbols) of three different plant groups (trees, grasses, shrubs, according to <a href="#animals-10-00725-t004" class="html-table">Table 4</a>).</p>
Full article ">
21 pages, 4000 KiB  
Article
Dynamics of Different Buffer Systems in Slurries Based on Time and Temperature of Storage and Their Visualization by a New Mathematical Tool
by Veronika Overmeyer, Felix Holtkamp, Joachim Clemens, Wolfgang Büscher and Manfred Trimborn
Animals 2020, 10(4), 724; https://doi.org/10.3390/ani10040724 - 21 Apr 2020
Cited by 10 | Viewed by 4295
Abstract
Slurry treatments such as acidification and alkalization have proven to be promising solutions to reduce gaseous emission produced by farm animals. The optimization of these technologies requires detailed knowledge of how and to what extent the buffer capacities in slurries will change during [...] Read more.
Slurry treatments such as acidification and alkalization have proven to be promising solutions to reduce gaseous emission produced by farm animals. The optimization of these technologies requires detailed knowledge of how and to what extent the buffer capacities in slurries will change during storage under the influence of different temperatures, as this may save resources needed to adjust a targeted pH value. Fresh slurries from dairy cows, fattening pigs and sows were collected and stored for 12 weeks under either cold (4.7 ± 1.1 °C) or warm (23.6 ± 2.1 °C) conditions to perform titrations in acidic and alkaline milieu at regular intervals. Based on these results, we successfully verified a new mathematical tool that we have developed to be able to calculate and visualize the most important buffer systems found in the analyzed slurries. Our experimental results showed a strong correlation between the degradation of the volatile fatty acid (VFA) buffer and the emergence of the carbonate buffers, i.e., the HCO3 and the CO32− buffer. Furthermore, a drop in the pH value caused by enhanced microbial production of VFAs can be mitigated by the presence of the NH3 buffer. In conclusion, we demonstrated that the buffers cannot be considered individually but must be interpreted as a complex and interacting system. Full article
(This article belongs to the Special Issue Animal Waste and Wastewater Management)
Show Figures

Graphical abstract

Graphical abstract
Full article ">Figure 1
<p>Dynamics in buffering intensity with pH for different buffers commonly found in anaerobic digesters; vertical bars indicate the boundaries between the buffer areas (modified according to [<a href="#B22-animals-10-00724" class="html-bibr">22</a>]).</p>
Full article ">Figure 2
<p>Procedure of the determination model for buffer capacity; (<b>a</b>) pH value in dependency of the amount of titrant and polynomial regression line; (<b>b</b>) polynomial regression line and derived titration curve which stands for the slope of titration curve; (<b>c</b>) reciprocal derived titration curve in dependency of amount of titrant; (<b>d</b>) current buffer capacity in dependency of pH value.</p>
Full article ">Figure 3
<p>(<b>a</b>) Temperature of dairy cow slurry depending on the pH value for maximum CBC in HCO<sub>3</sub><sup>−</sup> buffer during acidification; (<b>b</b>) Temperature of sow slurry depending on the pH value for maximum CBC in NH<sub>3</sub> buffer during alkalization from pH 2.5 to 12.0.</p>
Full article ">Figure 4
<p>(<b>a</b>) Maximum CBC during acidification in HCO<sub>3</sub><sup>−</sup> buffer depending on the TIC content of the different slurries (sow slurry in red dots) in week 0 and 8 (n = 26); (<b>b</b>) Maximum CBC during titration from pH value 2.5 to 11.5 in the NH<sub>3</sub> buffer depending on the TAN content of the different slurries in week 0 and 8, sow slurry of week 0 (red dots) was excluded from the calculation of the regression line here (n = 23).</p>
Full article ">Figure 5
<p>Maximum CBC during acidification in the HCO<sub>3</sub><sup>−</sup> buffer depending on the amount of acid from pH value 7.0 to 5.5 of the fattening pig, dairy cows and sow slurry (n = 115).</p>
Full article ">Figure 6
<p>Visualization of CBC depending on pH value in fattening pig slurry stored under warm conditions (23.6 ± 2.1 °C) from week 0 to 12.</p>
Full article ">Figure 7
<p>Initial pH value of fattening pig, dairy cow and sow slurry as well as the amount of acid under cold (4.7 ± 1.1 °C) and warm (23.6 ± 2.1 °C) storage conditions in the pH range initial to 7.0, 7.0 to 5.5 and 5.5 to 3.0 over a storage period of 12 weeks; for better visualization, the amount of acid in the pH range initial to 7.0 is shown below the black line.</p>
Full article ">Figure 8
<p>Evolution of the acid/base amount for (<b>a</b>) coldly stored (4.7 ± 1.1 °C) and (<b>b</b>) warmly stored (23.6 ± 2.1 °C) fattening pig slurry shown over 12 weeks to visualize the dynamics of the VFA (pH range 5.5 to 3.0), HCO<sub>3</sub><sup>−</sup> (pH range 7.0 to 5.5) and CO<sub>3</sub><sup>2−</sup> (pH range 9.5 to 11.5) buffer systems, vertical bars represent standard errors (n = 3).</p>
Full article ">Figure A1
<p>Maximum CBC during acidification in the VFA buffer depending on the amount of acid from pH value 5.5 to 3.0 of the dairy cow slurry (n = 36).</p>
Full article ">Figure A2
<p>Amount of acid in pH range 5.5 to 3.0 (VFA buffer) (<b>a</b>) and in pH range 7.0 to 5.5 (HCO<sub>3</sub><sup>−</sup> buffer) (<b>b</b>) in dependency of initial pH value (n = 105).</p>
Full article ">
14 pages, 1523 KiB  
Article
Effects of a Trans-Galactooligosaccharide on Biochemical Blood Parameters and Intestine Morphometric Parameters of Common Carp (Cyprinus carpio L.)
by Ewa Ziółkowska, Joanna Bogucka, Agata Dankowiakowska, Mateusz Rawski, Jan Mazurkiewicz and Magdalena Stanek
Animals 2020, 10(4), 723; https://doi.org/10.3390/ani10040723 - 21 Apr 2020
Cited by 13 | Viewed by 2801
Abstract
The aim of the study was to evaluate the effects of a trans-galactooligosaccharide prebiotic (GOS) on the growth performance, biochemical blood parameters, and intestine morphometric parameters of common carp. The 60-day-long experiment was performed on one-year-old fish with a mean body weight of [...] Read more.
The aim of the study was to evaluate the effects of a trans-galactooligosaccharide prebiotic (GOS) on the growth performance, biochemical blood parameters, and intestine morphometric parameters of common carp. The 60-day-long experiment was performed on one-year-old fish with a mean body weight of 180 g (±5 g). Three diets were used: control diet 1 (C) with no microbiota affecting feed additives, diet 2 (B1) with 1% of prebiotic, and diet 3 (B2) with 2% of prebiotic, in four replications (tanks) per treatment and 25 fish per tank. At the end of the trial, 16 individuals from each group were used for analyses. The study showed that GOS supplementation did not affect growth performance. In turn, the prebiotic had a positive effect on the development of the intestine, and increased the height, width, and surface of the villi in B1 and B2 groups. The content of phosphorus (P) was significantly higher in B1 group compared with B2 group, which indicated that 1% addition of prebiotic causes better absorption of P from the intestine. The other biochemical indicators—namely lipid, protein and hepatic parameters, insulin, and Ca—were not affected by GOS treatment, which may indicate similar metabolic balance of fish in each experimental group. Serum triiodothyronine (TT3) and glucose (stress markers) concentrations were not significantly different among treatments groups. GOS may be recommended as a feed additive for common carp due to its positive effects on fish physiology and development of the gastrointestinal tract. However, our results suggest that 1% diet supplementation causes satisfactory reactions for the abovementioned aspects in comparison to control or 2% supplementation. Full article
(This article belongs to the Special Issue Healthy and High-Quality Fish Farming)
Show Figures

Figure 1

Figure 1
<p>Changes in temperature (°C) and dissolved oxygen (mgO<sub>2</sub>/L) during trial.</p>
Full article ">Figure 2
<p>Light microscopy of the anterior portion of the intestine of common carp fed different prebiotic concentrations in the diet: (<b>A</b>) control group, (<b>B</b>) 1% Bi<sup>2</sup>tos<sup>®</sup>, (<b>C</b>) 2% Bi<sup>2</sup>tos<sup>®</sup>; a = villi height; b = villi width; c = crypt depth; d = tunica muscular thickness.</p>
Full article ">
14 pages, 2355 KiB  
Article
Chlamydia psittaci Triggers the Invasion of H9N2 Avian Influenza Virus by Impairing the Functions of Chicken Macrophages
by Jun Chu, Yongxia Guo, Guanlong Xu, Qiang Zhang, Zonghui Zuo, Qiang Li, Yihui Wang and Cheng He
Animals 2020, 10(4), 722; https://doi.org/10.3390/ani10040722 - 21 Apr 2020
Cited by 6 | Viewed by 3016
Abstract
In a pilot study, simultaneous infection with Chlamydia psittaci (C. psittaci) and H9N2 virus induced 20% mortality and severe avian airsacculitis, shedding light on animal models of poultry respiratory diseases. However, the pathogenesis is still unclear. In the current study, we [...] Read more.
In a pilot study, simultaneous infection with Chlamydia psittaci (C. psittaci) and H9N2 virus induced 20% mortality and severe avian airsacculitis, shedding light on animal models of poultry respiratory diseases. However, the pathogenesis is still unclear. In the current study, we hypothesized that C. psittaci infection execrates macrophage function and facilitates H9N2 infection. To explore the potential mechanism, we studied the effect of C. psittaci and H9N2 on the functions of HD11 cells in vitro by simultaneous infection of C. psittaci and H9N2. At the same time, we used infection with C. psittaci or H9N2 alone as the control groups. The results showed that coinfection with C. psittaci and H9N2 could significantly aggravate the mortality of HD11 cells compared to C. psittaci or H9N2 infection alone. In addition, coinfection with C. psittaci and H9N2 did not induce high C. psittaci loads compared to C. psittaci infection alone at 12- and 24-hours post-inoculation (hpi), but coinfection with C. psittaci and H9N2 could increase the loads of H9N2 compared to H9N2 alone in HD11 cells at 12 hpi. More importantly, inducible nitric oxide synthase (iNOS) expression levels, enzyme activity, nitric oxide (NO) production, and phagocytosis were reduced significantly in the group with C. psittaci and H9N2 coinfection compared to those of H9N2 or C. psittaci alone at 24 hpi. Finally, C. psittaci infection induced robust expressions of type Th2 cytokines interleukin (IL)-4 and IL-10, while interferon gamma (IFN-γ) and tumor necrosis factor-α (TNF-α) displayed a significant decrease compared to H9N2 infection alone at 24 hpi. All the above data indicate that C. psittaci infection can facilitate H9N2 invasion and to aggravate severe avian airsacculitis by impairing macrophage functions. Full article
(This article belongs to the Section Poultry)
Show Figures

Figure 1

Figure 1
<p>The cell mortality of HD11 cells was tested post-infection with <span class="html-italic">C. psittaci</span> or H9N2 alone, or via coinfection. The cell mortality of HD11 cells was tested at 12 hours post-inoculation (hpi) (<b>a</b>), or at 24 hpi (<b>b</b>). Data shown represent the mean ± standard deviation (SD), and the error bars represent the standard deviations from four independent experiments. One-way ANOVA with the Least-Significant Difference (LSD) post-hoc test was used for statistical analysis of the two different groups. Bars with the same lower-case letters in two different columns show no significant difference (<span class="html-italic">p</span> &gt; 0.05), and bars with different lower-case letters in two different columns show a significant difference (<span class="html-italic">p</span> &lt; 0.05 or <span class="html-italic">p</span> &lt; 0.01). A significant increase in the mortality of HD11 cells was detected in the <span class="html-italic">C. psittaci</span> + H9N2 group, as compared to H9N2 or <span class="html-italic">C. psittaci</span> alone group at 12 and 24 hpi (<span class="html-italic">p</span> &lt; 0.05).</p>
Full article ">Figure 2
<p>The effect of coinfection on pathogen loads. The pathogen loads of HD11 cells were tested at 12 and 24 hpi with <span class="html-italic">C. psittaci</span> or H9N2 alone, or via coinfection. The <span class="html-italic">C. psittaci</span> loads of HD11 cells were tested at 12 (<b>a</b>) and 24 (<b>b</b>) hpi, and the H9N2 loads of HD11 cells were tested at 12 (<b>c</b>) and 24 (<b>d</b>) hpi. A significant reduction of <span class="html-italic">C. psittaci</span> loads was found in the <span class="html-italic">C. psittaci</span> + H9N2 group, as compared to that of the <span class="html-italic">C. psittaci</span> group at 24 hpi (<span class="html-italic">p</span> &lt; 0.01). Moreover, lower H9N2 loads were found in the <span class="html-italic">C. psittaci</span> + H9N2 group compared to those of the H9N2 group at 24 hpi (<span class="html-italic">p</span> &lt; 0.01).</p>
Full article ">Figure 3
<p>The effect of coinfection on inducible nitric oxide synthase (iNOS) expression and activity. The iNOS expression and activity of HD11 cells were tested post-infection with <span class="html-italic">C. psittaci</span> or H9N2 alone, or via coinfection. The iNOS expression of HD11 cells was tested at 12 (<b>a</b>) and 24 (<b>b</b>) hpi, and the iNOS activity of HD11 cells was tested at 12 (<b>c</b>) and 24 (<b>d</b>) hpi. Lower iNOS expressions were induced in the <span class="html-italic">C. psittaci</span> + H9N2 group, as compared to those of <span class="html-italic">C. psittaci</span> alone (<span class="html-italic">p</span> &lt; 0.05) or H9N2 alone (<span class="html-italic">p</span> &lt; 0.01) at 24 hpi. As for iNOS activity, a significant reduction was observed in the <span class="html-italic">C. psittaci</span> + H9N2 group, as compared to the <span class="html-italic">C. psittaci</span> group (<span class="html-italic">p</span> &lt; 0.05) or the H9N2 group (<span class="html-italic">p</span> &lt; 0.01) at 24 hpi.</p>
Full article ">Figure 4
<p>The effect of coinfection on nitric oxide (NO) synthesis. The NO synthesis of HD11 cells was tested post-infection with <span class="html-italic">C. psittaci</span> or H9N2 alone, or via coinfection. The NO synthesis of HD11 cells was tested at 12 hpi (<b>a</b>) and 24 hpi (<b>b</b>) after <span class="html-italic">C. psittaci</span> or H9N2 infection. A significant reduction of NO production was detected in the <span class="html-italic">C. psittaci</span> + H9N2 group, as compared to that of the H9N2 group at 24 hpi (<span class="html-italic">p</span> &lt; 0.05). No significant difference was found between the <span class="html-italic">C. psittaci</span> + H9N2 group and the <span class="html-italic">C. psittaci</span> group at 24 hpi (<span class="html-italic">p</span> &gt; 0.05).</p>
Full article ">Figure 5
<p>The effect of coinfection on cell phagocytosis. The cell phagocytosis of HD11 cells was tested post-infection with <span class="html-italic">C. psittaci</span> or H9N2 infection alone, or via coinfection. The cell phagocytosis of HD11 cells was tested at 12 hpi (<b>a</b>) and at 24 hpi (<b>b</b>). The <span class="html-italic">C. psittaci</span> + H9N2 group induced a significant reduction of phagocytosis, as compared to the <span class="html-italic">C. psittaci</span> group (<span class="html-italic">p</span> &lt; 0.05) or the H9N2 group (<span class="html-italic">p</span> &lt; 0.01) at 24 hpi. No significant difference of phagocytic activity was found between the H9N2 group and the control group (<span class="html-italic">p</span> &gt; 0.05).</p>
Full article ">Figure 6
<p>The effect of coinfection on cell cytokines. The levels of pro-/anti-inflammatory cytokines of HD11 cells were tested post-infection with <span class="html-italic">C. psittaci</span> or H9N2 infection alone, or via coinfection. The levels of (<b>a</b>) IL-1β, (<b>b</b>) IL-2, (<b>c</b>) IL-4, (<b>d</b>) IL-6, (<b>e</b>) IL-10, (<b>f</b>) IFN-γ, and (<b>g</b>) TNF-α of HD11 cells were tested after <span class="html-italic">C. psittaci</span> and H9N2 infection. Higher expressions of IL-1β, IL-2, and IL-6 were induced in the <span class="html-italic">C. psittaci</span>+H9N2 group than those of the <span class="html-italic">C. psittaci</span> group or the H9N2 group at 12 hpi (<span class="html-italic">p</span> &lt; 0.05 or <span class="html-italic">p</span> &lt; 0.01). A significant increase in TNF-α secretions was induced in the <span class="html-italic">C. psittaci</span> + H9N2 group and in the H9N2 group compared to that of the <span class="html-italic">C. psittaci</span> group at 24 hpi. Moreover, Th2 cytokine expressions of the IL-4 and IL-10 were increased significantly in the <span class="html-italic">C. psittaci</span> + H9N2 group, as compared to the H9N2 group or the <span class="html-italic">C. psittaci</span> group (<span class="html-italic">p</span> &lt; 0.01 or <span class="html-italic">p</span> &lt; 0.05) at 24 hpi.</p>
Full article ">
21 pages, 2781 KiB  
Article
Individuals with Psychopathic Traits and Poor Attitudes towards Animals Can Recognise Infant Features But Give Them Reduced Attentional Priority
by Grace A. Carroll, Leah R. Cohen, Aideen McParland, Sam Jack and V. Tamara Montrose
Animals 2020, 10(4), 721; https://doi.org/10.3390/ani10040721 - 21 Apr 2020
Cited by 4 | Viewed by 5799
Abstract
Infant features are physical traits that are characteristic of human infants and include facial features such as large and low-lying eyes, and a small nose and mouth. Animals possessing high levels of infant features elicit care-giving responses in humans. Despite this, animal cruelty [...] Read more.
Infant features are physical traits that are characteristic of human infants and include facial features such as large and low-lying eyes, and a small nose and mouth. Animals possessing high levels of infant features elicit care-giving responses in humans. Despite this, animal cruelty is a common occurrence. The aim of this research was to determine whether the ability to recognise and/or attend to infant features is linked to subclinical psychopathic traits and attitudes towards animals. Using a community sample, participants (n = 387) completed a cuteness forced-choice task. Self-reported psychopathy and attitude towards animals were not related to the participants’ ability to detect cues of cuteness in human infants and animals. In a second study, participants (n = 142) were screened for low versus high primary psychopathy and low versus high animal attitude scores. A Psychopathy-Attitude Composite score was created and a subset of participants (n = 50) from the upper and lower quartiles completed a free-viewing eye-tracking task where ‘Cute’, ‘Neutral, ‘Monetary’ and ‘Control’ images were presented in pairs. Higher levels of psychopathic traits and an anti-animal welfare attitude were associated with decreased attention to ‘Cute’ images in terms of decreased dwell time, mean fixation duration and mean fixation count, measures of voluntary attention. There were a number of interactions between Psychopathy-Attitude Composite classification and attention to each image category in terms of dwell time, first fixation duration, mean fixation duration and fixation count. These findings support the theory that individuals with psychopathic traits recognise facial cues of vulnerability but choose to give them reduced attentional priority. This may have implications for animal welfare. Full article
(This article belongs to the Section Human-Animal Interactions, Animal Behaviour and Emotion)
Show Figures

Figure 1

Figure 1
<p>Examples of (<b>a</b>) high infant features (‘cute’); (<b>b</b>) low infant features (‘less cute’) version of the same animal photos: Thinkstock<sup>®</sup>/Getty Images<sup>®</sup> (modified) [<a href="#B2-animals-10-00721" class="html-bibr">2</a>], used in the cuteness forced-choice task.</p>
Full article ">Figure 2
<p>Proportion of initial orientations toward each image type in High Primary Psychopathy–Low Animal Attitude (HP-LAA) and Low Primary Psychopathy–High Animal Attitude (LP-HAA) participants.</p>
Full article ">Figure 3
<p>Mean dwell time on each image type in High Primary Psychopathy–Low Animal Attitude (HP-LAA) and Low Primary Psychopathy–High Animal Attitude (LP-HAA) participants.</p>
Full article ">Figure 4
<p>Mean first fixation duration on each image type in High Primary Psychopathy–Low Animal Attitude (HP-LAA) and Low Primary Psychopathy–High Animal Attitude (LP-HAA) participants.</p>
Full article ">Figure 5
<p>Mean fixation duration on each image type in High Primary Psychopathy–Low Animal Attitude (HP-LAA) and Low Primary Psychopathy–High Animal Attitude (LP-HAA) participants.</p>
Full article ">Figure 6
<p>Mean fixation count on each image type in High Primary Psychopathy–Low Animal Attitude (HP-LAA) and Low Primary Psychopathy–High Animal Attitude (LP-HAA) participants.</p>
Full article ">Figure 7
<p>Estimated marginal means (EMM) for each eye-tracking variable (<b>a</b>–<b>e</b>) as a function of Psychopathy-Attitude Composite classification and image category.</p>
Full article ">Figure 7 Cont.
<p>Estimated marginal means (EMM) for each eye-tracking variable (<b>a</b>–<b>e</b>) as a function of Psychopathy-Attitude Composite classification and image category.</p>
Full article ">
18 pages, 1484 KiB  
Article
Application of Meta-Analysis and Machine Learning Methods to the Prediction of Methane Production from In Vitro Mixed Ruminal Micro-Organism Fermentation
by Jennifer L. Ellis, Héctor Alaiz-Moretón, Alberto Navarro-Villa, Emma J. McGeough, Peter Purcell, Christopher D. Powell, Padraig O’Kiely, James France and Secundino López
Animals 2020, 10(4), 720; https://doi.org/10.3390/ani10040720 - 21 Apr 2020
Cited by 8 | Viewed by 3014
Abstract
In vitro gas production systems are utilized to screen feed ingredients for inclusion in ruminant diets. However, not all in vitro systems are set up to measure methane (CH4) production, nor do all publications report in vitro CH4. Therefore, [...] Read more.
In vitro gas production systems are utilized to screen feed ingredients for inclusion in ruminant diets. However, not all in vitro systems are set up to measure methane (CH4) production, nor do all publications report in vitro CH4. Therefore, the objective of this study was to develop models to predict in vitro CH4 production from total gas and volatile fatty acid (VFA) production data and to identify the major drivers of CH4 production in these systems. Meta-analysis and machine learning (ML) methodologies were applied to a database of 354 data points from 11 studies to predict CH4 production from total gas production, apparent DM digestibility (DMD), final pH, feed type (forage or concentrate), and acetate, propionate, butyrate and valerate production. Model evaluation was performed on an internal dataset of 107 data points. Meta-analysis results indicate that equations containing DMD, total VFA production, propionate, feed type and valerate resulted in best predictability of CH4 on the internal evaluation dataset. The ML models far exceeded the predictability achieved using meta-analysis, but further evaluation on an external database would be required to assess generalization ability on unrelated data. Between the ML methodologies assessed, artificial neural networks and support vector regression resulted in very similar predictability, but differed in fitting, as assessed by behaviour analysis. The models developed can be utilized to estimate CH4 emissions in vitro. Full article
(This article belongs to the Special Issue In Vitro Digestibility in Animal Nutritional Studies)
Show Figures

Figure 1

Figure 1
<p>Predicted vs. observed plots for the top four performing meta-analysis equations M5 (CH<sub>4</sub>d), M6 (CH<sub>4</sub>d), M11 (CH<sub>4</sub>i) and M12 (CH<sub>4</sub>i), as evaluated on the evaluation dataset (<span class="html-italic">n</span> = 107).</p>
Full article ">Figure 2
<p>Predicted vs. observed plots for the machine learning equations SVR_1d (CH<sub>4</sub>d), SVR_1i (CH<sub>4</sub>i), ANN_2d (CH<sub>4</sub>d) and ANN_2i (CH<sub>4</sub>i), as evaluated on the evaluation dataset (<span class="html-italic">n</span> = 107).</p>
Full article ">
Previous Issue
Next Issue
Back to TopTop