[go: up one dir, main page]

Next Issue
Volume 10, March
Previous Issue
Volume 10, January


Animals, Volume 10, Issue 2 (February 2020) – 193 articles

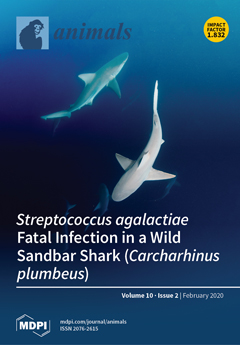
Cover Story (view full-size image): Sandbar sharks (Carcharhinus plumbeus) are found off the coast of Israel. This species is endangered in the Mediterranean Sea, but in the easternmost Levantine Basin, it is observed in large aggregations around marine infrastructures, such as offshore fish farms and coastal power stations. In order to promote their conservation and understand their ecological role as apex predators, it is important to study their sensitivity to potential threats, including pathogens in the marine environment (Morick et al, this issue). Photo credit: Hagai Anativ, Morris Kahn Marine Research Station. View this paper
  • Issues are regarded as officially published after their release is announced to the table of contents alert mailing list.
  • You may sign up for e-mail alerts to receive table of contents of newly released issues.
  • PDF is the official format for papers published in both, html and pdf forms. To view the papers in pdf format, click on the "PDF Full-text" link, and use the free Adobe Reader to open them.
Order results
Result details
Section
Select all
Export citation of selected articles as:
11 pages, 2468 KiB  
Article
Effects of Inhibin A on Apoptosis and Proliferation of Bovine Granulosa Cells
by Huitao Xu, Adnan Khan, Shanjiang Zhao, Huan Wang, Huiying Zou, Yunwei Pang and Huabin Zhu
Animals 2020, 10(2), 367; https://doi.org/10.3390/ani10020367 - 24 Feb 2020
Cited by 12 | Viewed by 5362
Abstract
Inhibin A is well known for its inhibitory properties against follicle-stimulating hormone (FSH), released through a pituitary–gonadal negative feedback loop to regulate follicular development. Ovarian folliculogenesis, hormonal biosynthesis, and gametogenesis are dependent on inhibins, playing vital roles in promoting or inhibiting cell proliferation. [...] Read more.
Inhibin A is well known for its inhibitory properties against follicle-stimulating hormone (FSH), released through a pituitary–gonadal negative feedback loop to regulate follicular development. Ovarian folliculogenesis, hormonal biosynthesis, and gametogenesis are dependent on inhibins, playing vital roles in promoting or inhibiting cell proliferation. The present study explored the physiological and molecular response of bovine granulosa cells (GCs) to different concentrations of inhibin A in vitro. We treated the primary GCs isolated from ovarian follicles (3–6 mm) with different levels of inhibin A (20, 50, and 100 ng/mL) along with the control (0 ng/mL) for 24 h. To evaluate the impact of inhibin A on GCs, several in vitro cellular parameters, including cell apoptosis, viability, cell cycle, and mitochondrial membrane potential (MMP) were detected. Besides, the transcriptional regulation of pro-apoptotic (BAX, Caspase-3) and cell proliferation (PCNA, CyclinB1) genes were also quantified. The results indicated a significant (p < 0.05) increase in the cell viability in a dose-dependent manner of inhibin A. Likewise, MMP was significantly (p < 0.05) enhanced when GCs were treated with high doses (50, 100 ng/mL) of inhibin A. Furthermore, inhibin A dose (100 ng/mL) markedly improved the progression of the G1 phase of the cell cycle and increased the cell number in the S phase, which was supported by the up-regulation of the proliferating cell nuclear antigen PCNA (20, 50, and 100ng/mL) and CyclinB (100 ng/mL) genes. In addition, higher doses of inhibin A (50 and 100 ng/mL) significantly (p < 0.05) decreased the apoptotic rate in GCs, which was manifested by down regulating BAX and Caspase-3 genes. Conclusively, our study presented a worthy strategy for the first time to characterize the cellular adaptation of bovine GCs under different concentrations of inhibin A. Our results conclude that inhibin A is a broad regulatory marker in GCs by regulating apoptosis and cellular progression. Full article
Show Figures

Figure 1

Figure 1
<p>Amplification of six genes by gel electrophoresis. M: DL2000; 1: GAPDH; 2: GAPDH negative control; 3: Caspase-3; 4: Caspase-3 negative control;5: BAX; 6: BAX negative control; 7: PCNA; 8: PCNA negative control; 9: CyclinB1; 10: CyclinB1 negative control; 11: INHβA; 12: INHβA negative control.</p>
Full article ">Figure 2
<p>Granulosa cells (GCs) identification by immunofluorescence. PI-positive stained nuclei (<b>A</b>,<b>D</b>). FSHR-positive stained cells (<b>B</b>). (<b>E</b>) Negative control. (<b>C</b>) Image merging of (<b>A</b>) and (<b>B</b>); (<b>F</b>) Image merging of (<b>D</b>) and (<b>E</b>). A 50X magnification was used.</p>
Full article ">Figure 3
<p>MTT assay of GCs cultured under different doses of inhibin A (20, 50, and 100 µg/mL) and the corresponding control (0 µg/mL). The measured cell counts for percent viability are indicated on the Y axis, and the doses of inhibin A are indicated on the X axis. Values are expressed as mean ± SEM of n = 3. The bars labeled with completely different letters indicate a significant difference, <span class="html-italic">p</span> &lt; 0.05.</p>
Full article ">Figure 4
<p>Flow cytometric analysis of GCs cultured under the treatments of different inhibin A doses (0, 50, and 100 µg/mL) (<b>A</b>–<b>C</b>), respectively. The analyzed cell counts for MMP are indicated on the Y axis and the doses of inhibin A are indicated on the X axis (<b>D</b>). Values are expressed as mean ± SEM of n = 3. The bars labeled with completely different letters indicate a significant difference, <span class="html-italic">p</span> &lt; 0.05.</p>
Full article ">Figure 5
<p>Inhibin A alters the stages of GCs cycle: Flow cytometric analysis of GCs cultured under the treatment of inhibin A (100 ng/mL) and the corresponding control group. The Y axis shows the analyzed cell counts while the X axis indicates the DNA content of cells stained by PI staining (<b>A</b>). mRNA expression of PCNA (<b>B</b>) and CyclineB1 (<b>C</b>) in GCs cultured under different concentrations of inhibin A (20, 50, and 100 ng/mL) and the corresponding control (0 ng/mL). GADPH was used as a reference gene. The results are expressed as the mean ± SEM, n = 3. The bars labeled with completely different letters indicate a significant difference, <span class="html-italic">p</span> &lt; 0.05.</p>
Full article ">Figure 6
<p>Flow cytometric analysis of GCs cultured under the treatments of different inhibin A doses (50 and 100 µg/mL). The Y axis shows the analyzed cell counts for apoptosis while the X axis indicates the doses of inhibin A DNA content of cells stained by PI staining. The analyzed cell counts for apoptosis are indicated on the Y axis, and the doses of inhibin A are indicated on the X axis (<b>A</b>). Data shown as means ± SEM, n = 3, <span class="html-italic">p</span> &lt; 0.05. mRNA expression of INHβA (<b>B</b>) and pro-apoptotic genes BAX (<b>C</b>) and Caspase-3 (D) in GCs cultured at different concentrations of inhibin A (20, 50, and 100 ng/mL) and the corresponding control (0 ng/mL). GADPH was used as a reference gene. The results are expressed as the mean ± SEM, n = 3. The bars labeled with completely different letters indicate a significant difference, <span class="html-italic">p</span> &lt; 0.05.</p>
Full article ">Figure 7
<p>Mechanisms of regulating inhibin A response related to GC function within a bovine ovary. The upregulated genes inhibin A, PCNA, and CyclineB1 were involved in the regulating mechanism of GCs via boosting cell proliferation and mitochondrial membrane potential. Under inhibin A treatment, the downregulated genes BAX and Caspase-3 were involved in inhibiting GC apoptosis, which might enhance the possibility of GCs viability and follicle function.</p>
Full article ">
8 pages, 655 KiB  
Communication
Detection of Pseudorabies Virus in Wild Boar Foetus
by Maria Irene Pacini, Mario Forzan, Giovanni Cilia, Lucrezia Bernardini, Filippo Marzoli, Francesca Pedonese, Patrizia Bandecchi, Filippo Fratini and Maurizio Mazzei
Animals 2020, 10(2), 366; https://doi.org/10.3390/ani10020366 - 24 Feb 2020
Cited by 16 | Viewed by 3633
Abstract
Pseudorabies, or Aujeszky’s disease, is a notifiable worldwide infection of domestic and feral swine that causes economic losses for the swine industry. In domestic pigs, the virus is responsible for nervous and/or respiratory symptoms; in pregnant sows, it is one of the major [...] Read more.
Pseudorabies, or Aujeszky’s disease, is a notifiable worldwide infection of domestic and feral swine that causes economic losses for the swine industry. In domestic pigs, the virus is responsible for nervous and/or respiratory symptoms; in pregnant sows, it is one of the major causes of stillbirth, mummification, embryonic death, and infertility (SMEDI). It is known that PRV infection in wild boar is associated with low pathogenicity and attenuated or absent symptomatology, but limited information is available about the ability of the virus to infect the foetuses of infected wild boar pregnant sows. Due to scarce information about the reproductive consequences, we investigate the possible intrauterine vertical transmission of the virus in wild boar pregnant sow living in a highly infected area. A number of 54 hunted wild boar were sampled during 2018–2019, and blood, genital and nasal swabs, placenta, and fetuses were collected for serological and molecular investigations. A seroprevalence of 74% (40/54) was detected, while 1/24 pregnant sow and 1/24 pooled foetuses tested positive by PCR (gene gB). This is the first evidence of viral detection in foetuses from seropositive pregnant wild boar. This finding suggests the possible pathogenetic role of PRV on pregnancy in wild boar and the existence of an additional transmission route. Full article
Show Figures

Figure 1

Figure 1
<p>Molecular phylogenetic analysis by maximum likelihood method. The evolutionary history was inferred by using the maximum likelihood method based on the Tamura–Nei model. The percentage of replicate trees in which the associated taxa clustered together in the bootstrap test (500 replicates) is shown next to the branches. The analysis involved 10 nucleotide sequences. There was a total of 148 positions in the final dataset. Evolutionary analyses were conducted in MEGA7. (ITA: Italy; GBR: Great Britain; ARG: Argentina; USA: United States of America HUN: Hungary; CHN: China; SW: swine).</p>
Full article ">
15 pages, 1771 KiB  
Article
Answers to the Frequently Asked Questions Regarding Horse Feeding and Management Practices to Reduce the Risk of Atypical Myopathy
by Dominique-Marie Votion, Anne-Christine François, Caroline Kruse, Benoit Renaud, Arnaud Farinelle, Marie-Catherine Bouquieaux, Christel Marcillaud-Pitel and Pascal Gustin
Animals 2020, 10(2), 365; https://doi.org/10.3390/ani10020365 - 24 Feb 2020
Cited by 13 | Viewed by 8041
Abstract
In 2014, atypical myopathy (AM) was linked to Acer pseudoplatanus (sycamore maple) in Europe. The emergence of this seasonal intoxication caused by a native tree has raised many questions. This manuscript aims at answering the five most frequently asked questions (FAQs) regarding (1) [...] Read more.
In 2014, atypical myopathy (AM) was linked to Acer pseudoplatanus (sycamore maple) in Europe. The emergence of this seasonal intoxication caused by a native tree has raised many questions. This manuscript aims at answering the five most frequently asked questions (FAQs) regarding (1) identification of toxic trees; reduction of risk at the level of (2) pastures and (3) equids; (4) the risk associated with pastures with sycamores that have always been used without horses being poisoned and (5) the length of the risk periods. Answers were found in a literature review and data gathered by AM surveillance networks. A guide is offered to differentiate common maple trees (FAQ1). In order to reduce the risk of AM at pasture level: Avoid humid pastures; permanent pasturing; spreading of manure for pasture with sycamores in the vicinity and avoid sycamore maple trees around pasture (FAQ2). To reduce the risk of AM at horse level: Reduce pasturing time according to weather conditions and to less than six hours a day during risk periods for horses on risk pasture; provide supplementary feeds including toxin-free forage; water from the distribution network; vitamins and a salt block (FAQ3). All pastures with a sycamore tree in the vicinity are at risk (FAQ4). Ninety-four percent of cases occur over two 3-month periods, starting in October and in March, for cases resulting from seeds and seedlings ingestion, respectively (FAQ5). Full article
(This article belongs to the Special Issue Horse Feeding and Management)
Show Figures

Figure 1

Figure 1
<p>European distribution of atypical myopathy cases notified to the disease surveillance networks from autumn 2006 to November 2019.</p>
Full article ">Figure 2
<p>Frequency distribution of equids with age categories: &lt;3 years, &gt;3 years and &lt;20 years and &gt;20 years old (n = 1510) over the study period (2006–2019).</p>
Full article ">Figure 3
<p>(<b>a</b>). Spring cases: weekly occurrence of atypical myopathy cases from week 9 (1 March) up to week 20 (31 May) over the study period (2006–2019); (<b>b</b>). Autumnal cases: weekly occurrence of atypical myopathy cases from week 41 (1 October) up to week 52 (31 December) over the study period (2006–2019).</p>
Full article ">Figure 3 Cont.
<p>(<b>a</b>). Spring cases: weekly occurrence of atypical myopathy cases from week 9 (1 March) up to week 20 (31 May) over the study period (2006–2019); (<b>b</b>). Autumnal cases: weekly occurrence of atypical myopathy cases from week 41 (1 October) up to week 52 (31 December) over the study period (2006–2019).</p>
Full article ">
17 pages, 5785 KiB  
Article
Automatic Fish Population Counting by Machine Vision and a Hybrid Deep Neural Network Model
by Song Zhang, Xinting Yang, Yizhong Wang, Zhenxi Zhao, Jintao Liu, Yang Liu, Chuanheng Sun and Chao Zhou
Animals 2020, 10(2), 364; https://doi.org/10.3390/ani10020364 - 24 Feb 2020
Cited by 85 | Viewed by 6935
Abstract
In intensive aquaculture, the number of fish in a shoal can provide valuable input for the development of intelligent production management systems. However, the traditional artificial sampling method is not only time consuming and laborious, but also may put pressure on the fish. [...] Read more.
In intensive aquaculture, the number of fish in a shoal can provide valuable input for the development of intelligent production management systems. However, the traditional artificial sampling method is not only time consuming and laborious, but also may put pressure on the fish. To solve the above problems, this paper proposes an automatic fish counting method based on a hybrid neural network model to realize the real-time, accurate, objective, and lossless counting of fish population in far offshore salmon mariculture. A multi-column convolution neural network (MCNN) is used as the front end to capture the feature information of different receptive fields. Convolution kernels of different sizes are used to adapt to the changes in angle, shape, and size caused by the motion of fish. Simultaneously, a wider and deeper dilated convolution neural network (DCNN) is used as the back end to reduce the loss of spatial structure information during network transmission. Finally, a hybrid neural network model is constructed. The experimental results show that the counting accuracy of the proposed hybrid neural network model is up to 95.06%, and the Pearson correlation coefficient between the estimation and the ground truth is 0.99. Compared with CNN- and MCNN-based methods, the accuracy and other evaluation indices are also improved. Therefore, the proposed method can provide an essential reference for feeding and other breeding operations. Full article
(This article belongs to the Section Human-Animal Interactions, Animal Behaviour and Emotion)
Show Figures

Figure 1

Figure 1
<p>Data acquisition diagram.</p>
Full article ">Figure 2
<p>Image contrast before and after enhancement: (<b>a</b>) original image and (<b>b</b>) enhanced image.</p>
Full article ">Figure 3
<p>Original image and noisy images: (<b>a</b>) original image, (<b>b</b>) salt-and-pepper noise image, and (<b>c</b>) Gaussian noise image.</p>
Full article ">Figure 4
<p>Examples of image annotation. (<b>a</b>) no overlap; (<b>b</b>) two fish overlap into a line; (<b>c</b>) two fish cross like “X”; (<b>d</b>) two fish cross like “V”; (<b>e</b>) three fish cross; (<b>f</b>) about half of the fish body appears; (<b>g</b>) a small part of the fish body appears.</p>
Full article ">Figure 5
<p>Histogram of the number of fish in the shoal of our dataset.</p>
Full article ">Figure 6
<p>Diagram of density map: (<b>a</b>) original image and (<b>b</b>) corresponding density map.</p>
Full article ">Figure 7
<p>3 ×3 convolutional kernels with dilation rates of 1 and 2 [<a href="#B39-animals-10-00364" class="html-bibr">39</a>]: (<b>a</b>) dilated convolution with dilation rate r = 1 and (<b>b</b>) dilated convolution with dilation rate r =2.</p>
Full article ">Figure 8
<p>The structure of the proposed model. The convolutional layer’ parameters are denoted as “(kernel size)-(number of filters)-(dilation rate)”; max-pooling layers are conducted over a 2 × 2 pixel window with stride 2.</p>
Full article ">Figure 9
<p>Mean absolute error (MAE), root mean square error (RMSE) and mean absolute percentage error (MAPE) change during epoch. (<b>a</b>) MAE; (<b>b</b>) RMSE and (<b>c</b>) MAPE.</p>
Full article ">Figure 10
<p>Fish counting results and density maps. (<b>a</b>,<b>d</b>,<b>g</b>,<b>j</b>) are original images; (<b>b</b>,<b>e</b>,<b>h</b>,<b>k</b>) are the ground truth density maps corresponding to (<b>a</b>,<b>d</b>,<b>g</b>,<b>j</b>) respectively; (<b>c</b>,<b>f</b>,<b>i</b>,<b>l</b>) are the estimated density maps corresponding to (<b>a</b>,<b>d</b>,<b>g</b>,<b>j</b>) respectively.</p>
Full article ">Figure 11
<p>(<b>a</b>) Results of model test and (<b>b</b>) histogram of error between ground truth and the estimation.</p>
Full article ">Figure 12
<p>Comparison between dilated convolution and max-pooling, convolution, and upsampling.</p>
Full article ">Figure 13
<p>Test results of different models. (<b>a</b>,<b>f</b>,<b>k</b>) are original images; (<b>b</b>,<b>g</b>,<b>l</b>) are the ground truth density maps corresponding to (<b>a</b>,<b>f</b>,<b>k</b>) respectively; (<b>c</b>,<b>h</b>,<b>m</b>) are the estimated density maps generated by CNN corresponding to (<b>a</b>,<b>f</b>,<b>k</b>) respectively; (<b>d</b>,<b>i</b>,<b>n</b>) are the estimated density maps generated by MCNN corresponding to (<b>a</b>,<b>f</b>,<b>k</b>) respectively; (<b>e</b>,<b>j</b>,<b>o</b>) are estimated density maps generated by the proposed model corresponding to (<b>a</b>,<b>f</b>,<b>k</b>) respectively.</p>
Full article ">Figure 14
<p>Comparison of the different distributions representing similar quantities: (<b>a</b>): 165 and (<b>b</b>): 162.</p>
Full article ">
2 pages, 139 KiB  
Book Review
Review of Stress and Animal Welfare by Donald Broom and Ken G. Johnson
by Temple Grandin
Animals 2020, 10(2), 363; https://doi.org/10.3390/ani10020363 - 24 Feb 2020
Cited by 1 | Viewed by 3517
Abstract
In the first chapter [...] Full article
25 pages, 1062 KiB  
Article
Response to Wolf et al.: Furthering Debate over the Suitability of Trap-Neuter-Return for Stray Cat Management
by Michael C. Calver, Heather M. Crawford and Patricia A. Fleming
Animals 2020, 10(2), 362; https://doi.org/10.3390/ani10020362 - 23 Feb 2020
Cited by 17 | Viewed by 7309
Abstract
To continue dialogue over proposed Australian trials of Trap-Neuter-Return (TNR), we applied a framework requiring identification of areas of agreement, areas of disagreement, and identification of empirical data collection required to resolve disagreements. There is agreement that Australia has a problem with stray [...] Read more.
To continue dialogue over proposed Australian trials of Trap-Neuter-Return (TNR), we applied a framework requiring identification of areas of agreement, areas of disagreement, and identification of empirical data collection required to resolve disagreements. There is agreement that Australia has a problem with stray cats, causing problems of impacts on wildlife, nuisance, disease transmission (including public health issues and exchange of diseases between stray cat and pet cat populations), poor welfare outcomes for stray cats, and an emotional burden on staff euthanising healthy stray cats. There is disagreement on whether (i) current measures are failing, leading to unacceptably high euthanasia levels, (ii) some contributors to the debate misunderstand TNR, (iii) TNR trials will reduce urban cat populations and associated problems, (iv) TNR is an ethical solution to cat overpopulation, and (v) some contributors to the debate promulgated misinformation. Although not everyone agrees that TNR trials should proceed, as a hypothetical exploration, we propose an experimental approach explicitly comparing TNR to alternatives. Trials could only be considered if other detailed and well-funded attempts at stray cat control focusing across an entire Local Government Area (LGA) prove ineffective. Full article
Show Figures

Figure 1

Figure 1
<p>Cats admitted to Australian RSPCA shelters and % of those cats euthanised between 1999/2000 and 2017/2018. Source: RSPCA Australia (2019).</p>
Full article ">Figure 2
<p>Cats admitted to RSPCA shelters in the Australian Capital Territory (ACT) and % of those cats euthanised between 1999/2000 and 2017/2018. Source: RSPCA Australia (2019).</p>
Full article ">
17 pages, 676 KiB  
Review
Domestic Foal Weaning: Need for Re-Thinking Breeding Practices?
by Séverine Henry, Hrefna Sigurjónsdóttir, Aziliz Klapper, Julie Joubert, Gabrielle Montier and Martine Hausberger
Animals 2020, 10(2), 361; https://doi.org/10.3390/ani10020361 - 23 Feb 2020
Cited by 10 | Viewed by 15158
Abstract
Artificial weaning is a standard practice known to be one of the most stressful events in a domestic foal’s life. Research has mainly focused on ways to alleviate weaning stress. However, there is still a need for more detailed research on what should [...] Read more.
Artificial weaning is a standard practice known to be one of the most stressful events in a domestic foal’s life. Research has mainly focused on ways to alleviate weaning stress. However, there is still a need for more detailed research on what should constitute best practices with respect to animal welfare. The aim of this review is to address this issue by examining the natural weaning process. We first provide an overview of the scientific literature on the natural temporal dynamics of the dam-offspring bond in horses: it is to be noted that the natural process of weaning is little documented, individual variations have been poorly investigated and immediate effects of weaning on the mare–foal relationship remain unexplored. To partly address these gaps, we performed a study around the weaning period on 16 mare–foal pairs kept with minimal human interference. Most foals were weaned spontaneously when 9-10 months old, with individual variations mainly due to the conception rate of mares. Natural weaning induced no stress response in either partner and was performed without clear signs of rejection by the dams either just before or after. We lastly open up the discussion on the need for rethinking weaning practices under domestic conditions. Full article
(This article belongs to the Special Issue Horse Welfare)
Show Figures

Figure 1

Figure 1
<p>Change in the of mare–foal distance before and after weaning: (<b>a</b>) in study group 1; (<b>b</b>) in study group 2. Wilcoxon tests: * <span class="html-italic">p</span> &lt; 0.05.</p>
Full article ">Figure 2
<p>Comparison of the time spent by foals near different neighbors (social preferences) before and after weaning: (<b>a</b>) in study group 1; (<b>b</b>) in study group 2. Wilcoxon tests: * <span class="html-italic">p</span> &lt; 0.05.</p>
Full article ">
19 pages, 3168 KiB  
Article
Impaired Mitochondrial Function Results from Oxidative Stress in the Full-Term Placenta of Sows with Excessive Back-Fat
by Liang Tian, Jiahe Huang, Aiyou Wen and Peishi Yan
Animals 2020, 10(2), 360; https://doi.org/10.3390/ani10020360 - 23 Feb 2020
Cited by 9 | Viewed by 3153
Abstract
The aim of this study was to determine the effect of excessive back-fat (BF) of sows on placental oxidative stress, ATP generation, mitochondrial alterations in content and structure, and mitochondrial function in isolated trophoblasts. Placental tissue was collected by vaginal delivery from BFI [...] Read more.
The aim of this study was to determine the effect of excessive back-fat (BF) of sows on placental oxidative stress, ATP generation, mitochondrial alterations in content and structure, and mitochondrial function in isolated trophoblasts. Placental tissue was collected by vaginal delivery from BFI (15–20 mm, n = 10) and BFII (21–27 mm, n = 10) sows formed according to BF at mating. Our results demonstrated that excessive back-fat contributed to augmented oxidative stress in term placenta, as evidenced by excessive production of ROS, elevated protein carbonylation, and reduced SOD, GSH-PX, and CAT activities (p < 0.05). Indicative of mitochondrial dysfunction, reduced mitochondrial respiration in cultured trophoblasts was linked to decreased ATP generation, lower mitochondrial Complex I activity and reduced expression of electron transport chain subunits in placenta of BFII sows (p < 0.05). Meanwhile, we observed negative alterations in mitochondrial biogenesis and structure in the placenta from BFII group (p < 0.05). Finally, our in vitro studies showed lipid-induced ROS production resulted in mitochondrial alterations in trophoblasts, and these effects were blocked by antioxidant treatment. Together, these data reveal that excessive back-fat aggravates mitochondrial injury induced by increased oxidative stress in pig term placenta, which may have detrimental consequences on placental function and therefore impaired fetal growth and development. Full article
(This article belongs to the Special Issue Immunohistochemical and Physiological Research on Farm Animals)
Show Figures

Figure 1

Figure 1
<p>Increased oxidative stress in placentas with increasing back-fat. Representative visualization (<b>a</b>) and quantification (n = 7 in each group) (<b>b</b>) of dichlorofluorescein (DCF) in cryosections of placenta. Scale bar: 50 μm; (<b>c</b>) Total antioxidant capacity (TAC) was measured in term placentas from BFI and BFII sows (n = 10/group). TAC was normalized to total protein level and expressed as nM TAC per mg protein; (<b>d</b>) Representative immunoblots showing total protein carbonylation in placentas of BFI and BFII sows; (<b>e</b>) mRNA levels of oxidant stress-related genes determined by real-time RT-PCR in placentas from BFI and BFII sows (n = 10/group); (<b>f</b>) Placental antioxidant status was estimated by SOD, GSH-PX, and CAT (n = 10/group); (<b>g</b>) Relative content of GSH/GSSG in placentas from BFI and BFII sows (n = 10/group). Results were expressed as fold change versus the BFI sow set to 1 unit. Values are expressed as mean ± SEM. * <span class="html-italic">p</span> &lt; 0.05 compared with the BFI group. DCF: dichlorofluorescein; SOD: superoxide dismutase; GSH-PX: glutathione peroxidase; CAT: catalase; GSH: reduced glutathione; GSSG: oxidative glutathione; BF: back-fat thickness.</p>
Full article ">Figure 2
<p>Impairment of placental mitochondrial oxidative respiration in sow with increased back-fat. (<b>a</b>) Mitochondrial ATP production in placental tissue from BFI and BFII sows. ATP levels were normalized to total protein level of villous tissue extract; (<b>b</b>) Mitochondrial respiratory parameters were measured in cytotrophoblast cultures isolated from placentas of BFI and BFII sows. Before assessment of mitochondrial respiration, cytotrophoblasts were incubated with 400 μM NEFA for 24 h. Oxygen consumption rate (OCR) measurements were normalized to total protein content (pmol O<sub>2</sub>/μg protein); (<b>c</b> and <b>d</b>) Placental mitochondrial complexes I (<b>c</b>) and combined II/III (<b>d</b>) activity in BFI and BFII sows; (<b>e</b>) Representative immunoblot analysis of mitochondrial complexes I (NDUFB8), II (SDHB), III (UQCRC2) and V (ATP5α) in placental mitochondrial fractions from BFI and BFII sows; (<b>f</b>) Densitometric analysis of corresponding proteins in E by normalization to GAPDH as an internal control. Results are expressed as mean ± SEM. * <span class="html-italic">p</span> &lt; 0.05 compared with the BFI group. n = 10 in each group. BF: back-fat thickness; NEFA: non-esterified fatty acid; Basal: basal respiration; ATP: ATP-coupled respiration; Max: maximal respiration; Spare: spare capacity.</p>
Full article ">Figure 3
<p>Decreased mitochondrial density in the placenta of sow with excessive back-fat. Mitochondrial biogenesis was estimated by bothmtDNA copy number (<b>a</b>) and CS activity (<b>b</b>) in the placenta from BFI and BFII sows (n = 10/group); (<b>c</b>) Mitochondrial density assessed by electron microscopy in the placentas of BFI and BFII sows. Original magnification, 25,000×; (<b>d</b>) Quantification of mitochondrial number per image area in whole placental villous tissue from 7-BFI and 7-BFII sows (analysis of 10 random images per placenta). (<b>e</b>–<b>g</b>) The relative mRNA level of various mitochondria-encoded genes (<b>e</b>), nuclear-encoded mitochondrial genes (<b>f</b>), and mitochondrial biogenesis genes (<b>g</b>) was determined by quantitative RT-PCR in placentas from BFI and BFII sows (n = 10/group). Results were normalized by the mean value for the BFI sow set to 1 unit. Values are expressed as mean ± SEM. * <span class="html-italic">p</span> &lt; 0.05 compared with the BFI group. BF: back-fat thickness; mtDNA: mitochondrial DNA; CS: citrate synthase; Red arrow: mitochondria.</p>
Full article ">Figure 3 Cont.
<p>Decreased mitochondrial density in the placenta of sow with excessive back-fat. Mitochondrial biogenesis was estimated by bothmtDNA copy number (<b>a</b>) and CS activity (<b>b</b>) in the placenta from BFI and BFII sows (n = 10/group); (<b>c</b>) Mitochondrial density assessed by electron microscopy in the placentas of BFI and BFII sows. Original magnification, 25,000×; (<b>d</b>) Quantification of mitochondrial number per image area in whole placental villous tissue from 7-BFI and 7-BFII sows (analysis of 10 random images per placenta). (<b>e</b>–<b>g</b>) The relative mRNA level of various mitochondria-encoded genes (<b>e</b>), nuclear-encoded mitochondrial genes (<b>f</b>), and mitochondrial biogenesis genes (<b>g</b>) was determined by quantitative RT-PCR in placentas from BFI and BFII sows (n = 10/group). Results were normalized by the mean value for the BFI sow set to 1 unit. Values are expressed as mean ± SEM. * <span class="html-italic">p</span> &lt; 0.05 compared with the BFI group. BF: back-fat thickness; mtDNA: mitochondrial DNA; CS: citrate synthase; Red arrow: mitochondria.</p>
Full article ">Figure 4
<p>Alterations in the mitochondrial structure of placenta of sow challenged with excessive back-fat. (<b>a</b> and <b>b</b>) Transmission electron microscopy images at original magnifications of 25,000× (<b>a</b>) and 100,000× (<b>b</b>) in placental mitochondria from BFI and BFII sows; (<b>c</b>) Quantification of mitochondria area in the placental villi sections from 7-BFI and 7-BFII sows (analysis of 10 random images per placenta). Results were normalized by the mean value for the BFI sow set to 1 unit; (<b>d</b>) mRNA levels of mitochondrial fission- and fusion-related regulators, determined by quantitative RT-PCR, in placentas from BFI and BFII sows (n = 10/group). Values are expressed as mean ± SEM. * <span class="html-italic">p</span> &lt; 0.05 compared with the BFI group. BF: back-fat thickness; Red arrow: mitochondria.</p>
Full article ">Figure 4 Cont.
<p>Alterations in the mitochondrial structure of placenta of sow challenged with excessive back-fat. (<b>a</b> and <b>b</b>) Transmission electron microscopy images at original magnifications of 25,000× (<b>a</b>) and 100,000× (<b>b</b>) in placental mitochondria from BFI and BFII sows; (<b>c</b>) Quantification of mitochondria area in the placental villi sections from 7-BFI and 7-BFII sows (analysis of 10 random images per placenta). Results were normalized by the mean value for the BFI sow set to 1 unit; (<b>d</b>) mRNA levels of mitochondrial fission- and fusion-related regulators, determined by quantitative RT-PCR, in placentas from BFI and BFII sows (n = 10/group). Values are expressed as mean ± SEM. * <span class="html-italic">p</span> &lt; 0.05 compared with the BFI group. BF: back-fat thickness; Red arrow: mitochondria.</p>
Full article ">Figure 5
<p>ROS-induced mitochondrial alterations in pig primary trophoblast cells challenged with 400 μM NEFA. (<b>a</b>) ROS generation, measured by DCF production using flow cytometry or a spectrophotometer (n = 3), respectively, in cytotrophoblasts isolated from placenta of BFI sows. Before assessment of ROS production, cells were incubated with 400 μM NEFA in the presence or absence of 2 mM VE for 48 h. Value in scale bar depicts the percentage of DCF-positive cells; (<b>b</b>) Mitochondrial ATP production in cytotrophoblasts incubated with 400 μM NEFA in the presence or absence of 2 mM VE for 48 h (n = 3). ATP levels were normalized to total protein level of whole cell lysates extract; (<b>c</b> and <b>d</b>) Mitochondrial biogenesis was assessed by both citrate synthase activity (<b>c</b>) and mtDNA copy number (<b>d</b>) in cytotrophoblasts incubated with 400 μM NEFA in the presence or absence of 2 mM VE for 48 h (n = 3); (<b>e</b>) Relative mRNA expression of genes implicated in mitochondrial biogenesis and mtDNA replication (n = 3). Results were expressed as fold change relative to the values of untreated cells (BSA treatment) set to 1 unit. Values are expressed as mean ± SEM. * <span class="html-italic">p</span> &lt; 0.05; ** <span class="html-italic">p</span> &lt; 0.01 compared with the control group. ROS: reactive oxygen species; DCF: dichlorofluorescein; VE: Vitamin E; mtDNA: mitochondrial DNA; BSA: bovine serum albumin; NEFA: non-esterified fatty acid; Control: BSA group.</p>
Full article ">Figure 6
<p>A schematic diagram depicts a causative role of obesity-induced oxidative stress in mitochondrial injury and placental dysfunction. Excessive back-fat aggravates dyslipidemia (lipotoxicity), which induces oxidative stress and mitochondrial dysfunction in the full-term pig placenta. Increased back-fat promotes mitochondrial oxidative injury by activating Mark4 and NF-κB and reducing AMPK activation. ↑: up-regulation of gene expression. ↓: down-regulation of gene expression. Arrows indicates a positive regulation. Interactions depicted are based on studies performed in various tissues (in some cases placenta) and have been previously published. ROS: reactive oxygen species.</p>
Full article ">
12 pages, 1817 KiB  
Article
Running Head: Heat Affects Cholesterol and Bile Acid Alterations in Cholesterol and Bile Acids Metabolism in Large White Pigs during Short-Term Heat Exposure
by Wei Fang, Xiaobin Wen, Qingshi Meng, Lei Liu, Jingjing Xie, Hongfu Zhang and Nadia Everaert
Animals 2020, 10(2), 359; https://doi.org/10.3390/ani10020359 - 23 Feb 2020
Cited by 14 | Viewed by 3845
Abstract
Heat stress influences lipid metabolism independently of nutrient intake. It is not well understood how cholesterol and bile acid (BA) metabolism are affected by heat stress. To investigate the alterations of cholesterol and bile acids when pigs are exposed to short term heat [...] Read more.
Heat stress influences lipid metabolism independently of nutrient intake. It is not well understood how cholesterol and bile acid (BA) metabolism are affected by heat stress. To investigate the alterations of cholesterol and bile acids when pigs are exposed to short term heat stress, 24 Large White pigs (63.2 ± 9.5 kg body weight, BW) were distributed into one of three environmental treatments: control conditions (CON, 23 °C with ad libitum intake; n = 8), heat stress conditions (HS, 33 °C with ad libitum intake; n = 8), or pair-fed conditions (PF, 23 °C with the same amount to the feed consumed by the HS; n = 8) for three days. Compared with CON pigs, HS pigs reduced the average daily feed intake and average daily gain by 55% and 124%, respectively, and significantly increased rectal temperatures by 0.9 °C and respiration rates more than three-fold. The serum total cholesterol (TC), low-density lipoprotein-cholesterol, and triglycerides (TG) increased (p < 0.05), while hepatic TC, TG, and mRNA of 3-hydroxy-3-methylglutaryl-CoA reductase were reduced on day 3. Furthermore, liver taurine-conjugated BAs (TCBAs), including taurolithocholic acid, taurochenodeoxycholic acid (TCDCA), tauroursodeoxycholic acid, taurohyodeoxycholic acid, and taurocholic acid were elevated in HS pigs compared to CON and PF pigs (p < 0.05), and the level of chenodeoxycholic acid was more significant in the PF group than in the CON and HS groups. The concentration of ursodeoxycholic acid in the serum was higher in HS pigs than CON and PF pigs (p < 0.05), and TCDCA was increased in HS pigs compared with PF pigs (p < 0.05). Altogether, short-term HS reduced hepatic cholesterol levels by decreasing cholesterol synthesis, promoting cholesterol to TCBAs conversion, and cholesterol release to serum in growing pigs. This independently reduced feed intake might serve as a mechanism to protect cells from damage during the early period. Full article
(This article belongs to the Section Pigs)
Show Figures

Figure 1

Figure 1
<p>Effects of optimum condition (CON), short-time heat exposure (HS) and pair-fed group (PF) on (<b>A</b>) average daily gain, (<b>B</b>) average daily feed intake, (<b>C</b>) rectal temperature, and (<b>D</b>) respiration rates. All data are expressed as mean ± SEM and values with the same letter superscripts mean no significant difference (<span class="html-italic">p</span> &gt; 0.05), while with different letter superscripts mean significant difference (<span class="html-italic">p</span> &lt; 0.05). CON, 23 °C with ad libitum intake; HS, 33 °C with ad libitum intake; PF, 23 °C with the same amount to the feed consumed by the HS; ADG, average daily gain; ADFI, average daily feed intake; RT: rectal temperatures; RR: respiration rates; bpm: breaths per minute.</p>
Full article ">Figure 2
<p>Hepatic lipids composition (<b>A</b>) and genes related to cholesterol biosynthesis, uptake and regulation (<b>B</b>) in the liver with short-term heat exposure. Values are expressed as means ± SEM of data from 8 individual tissue samples. Values with the same letter superscripts mean no significant difference (<span class="html-italic">p</span> &gt; 0.05), while with different letter superscripts mean significant difference (<span class="html-italic">p</span> &lt; 0.05). CON, 23 °C with ad libitum intake; HS, 33 °C with ad libitum intake; PF, 23 °C with the same amount to the feed consumed by the HS.</p>
Full article ">Figure 3
<p>Alteration of BAs profiles in the serum after short term heat exposure. Concentrations of total, primary, secondary, glycine-conjugated and taurine-conjugated bile acids in the serum in growing pigs (<b>A</b>); concentrations of individual bile acids in the serum (<b>B</b>). All data are expressed as mean ± SEM. Values with the same letter superscripts mean no significant difference (<span class="html-italic">p</span> &gt; 0.05), while values with different letter superscripts mean significant difference (<span class="html-italic">p</span> &lt; 0.05). CON, 23 °C with ad libitum intake; HS, 33 °C with ad libitum intake; PF, 23 °C with the same amount to the feed consumed by the HS; BAs, bile acids; TBA, total BAs; PBA, primary BAs, SBA; secondary BAs; GCBA, glycine-conjugated BAs; TCBA, taurine-conjugated BAs; CDCA, chenodeoxycholic acid; HCA, hyocholic acid; UDCA, ursodeoxycholic acid; GCDCA, glycochenodeoxycholic acid; GUDCA, glycoursodeoxycholic acid; TLCA, taurolithocholic acid; TCDCA, taurochenodeoxycholic acid; TUDCA, tauroursodeoxycholic acid; THDCA, taurohyodeoxycholic acid; THCA, taurohyocholic acid.</p>
Full article ">Figure 4
<p>Alteration of BAs profiles in the liver after short term heat exposure. Concentrations of total, primary, secondary, glycine-conjugated, and taurine-conjugated bile acids in the liver in growing pigs (<b>A</b>); concentrations of individual bile acids in the serum (<b>B</b>). All data are expressed as mean ± SEM. Values with the same letter superscripts mean no significant difference (<span class="html-italic">p</span> &gt; 0.05), while values with different letter superscripts mean significant difference (<span class="html-italic">p</span> &lt; 0.05). CON, 23 °C with ad libitum intake; HS, 33 °C with ad libitum intake; PF, 23 °C with the same amount to the feed consumed by the HS; BAs, bile acids; TBA, total BAs; PBA, primary BAs, SBA; secondary BAs; GCBA, glycine-conjugated BAs; TCBA, taurine-conjugated BAs; CDCA, chenodeoxycholic acid; HCA, hyocholic acid; UDCA, ursodeoxycholic acid; GCDCA, glycochenodeoxycholic acid; GUDCA, glycoursodeoxycholic acid; TLCA, taurolithocholic acid; TCDCA, taurochenodeoxycholic acid; TUDCA, tauroursodeoxycholic acid; THDCA, taurohyodeoxycholic acid; THCA, taurohyocholic acid.</p>
Full article ">Figure 5
<p>Expression of genes involved in bile acid synthesis, conjugation, transport and regulation in the liver. All data are expressed as mean ± SEM. CON, 23 °C with ad libitum intake; HS, 33 °C with ad libitum intake; PF, 23 °C with the same amount to the feed consumed by the HS; CYP7A1, cholesterol 7α-hydroxylase 1; CYP27A1, sterol 27-hydroxylase; CYP8B1, sterol 12α-hydroxylase; BAAT, bile acid-CoA:amino acid N acyltransferase; BACS, bile acid-CoA synthase, BSEP, bile salt export pump; NTCP, sodium-taurocholate cotransporting polypeptide; OATP1B3, organic anion transporting peptides 3; FXR, farnesoid X receptor; TGR5, membrane-bound G-protein coupled receptor; SHP, small heterodimer partner; FGFR4, fibroblast growth factor receptor 4; KLβ, Klotho beta.</p>
Full article ">
9 pages, 1028 KiB  
Article
Detection of rs665862918 (15-bp Indel) of the HIAT1 Gene and its Strong Genetic Effects on Growth Traits in Goats
by Jiayang Gao, Xiaoyue Song, Hui Wu, Qi Tang, Zhenyu Wei, Xinyu Wang, Xianyong Lan and Bao Zhang
Animals 2020, 10(2), 358; https://doi.org/10.3390/ani10020358 - 23 Feb 2020
Cited by 9 | Viewed by 3162
Abstract
The hippocampus abundant transcript 1 (HIAT1) gene, which was detected by the genome-wide identification of selective sweeps among elite goat breeds and water buffalo, is proposed to play an important role in meat characteristics. Four indels of the HIAT1 gene selected [...] Read more.
The hippocampus abundant transcript 1 (HIAT1) gene, which was detected by the genome-wide identification of selective sweeps among elite goat breeds and water buffalo, is proposed to play an important role in meat characteristics. Four indels of the HIAT1 gene selected from the NCBI and Ensembl databases were detected via a pooling and sequencing strategy. A 15 bp insertion (rs665862918) in the first intron of HIAT1 was selected and classified on an electrophoresis platform in the Shaanbei white cashmere goat (SBWC) population. The correlation analysis revealed that rs665862918 is significantly highly associated with chest width (p = 1.57 × 10⁻⁵), chest depth (p = 8.85 × 10⁻⁵), heart girth (p = 1.05 × 10⁻⁷), body length (p = 0.022), and height at hip cross (p = 0.023) in the SBWC population (n = 1013). Further analysis revealed that individuals with a genotype insertion/insertion (II) of the rs665862918 locus exhibited better growth trait performance than individuals with an insertion/deletion (ID) or deletion/deletion (DD). These findings verify that HIAT1 affects the body size of goats and that rs665862918 could be a potential molecular marker for growth traits in goat breeding. Full article
Show Figures

Figure 1

Figure 1
<p>Shaanbei white cashmere goats.</p>
Full article ">Figure 2
<p>(<b>a</b>) Sequence diagram of the rs665862918 mutations of the goat <span class="html-italic">HIAT1</span> gene. (<b>b</b>) Analysis of the 15 bp indel sequence of the goat <span class="html-italic">HIAT1</span> gene in reference to NC_030810.1. (<b>c</b>) Electrophoresis assay of the rs665862918 locus of the <span class="html-italic">HIAT1</span> gene of goat (3% agarose gel electrophoresis). HD, heteroduplex.</p>
Full article ">
15 pages, 2886 KiB  
Article
Rumen-Protected Glucose Stimulates the Insulin-Like Growth Factor System and mTOR/AKT Pathway in the Endometrium of Early Postpartum Dairy Cows
by Yan Wang, Xuefeng Han, Zhiliang Tan, Jinhe Kang and Zheng Wang
Animals 2020, 10(2), 357; https://doi.org/10.3390/ani10020357 - 23 Feb 2020
Cited by 13 | Viewed by 4586
Abstract
This study aimed to elucidate the effects of a dietary rumen-protected glucose (RPG) addition on uterine involution through the analysis of an insulin-like growth factor (IGF) system and associated pathways in the post-natal endometrium. Twelve Holstein cows were assigned equally to two groups: [...] Read more.
This study aimed to elucidate the effects of a dietary rumen-protected glucose (RPG) addition on uterine involution through the analysis of an insulin-like growth factor (IGF) system and associated pathways in the post-natal endometrium. Twelve Holstein cows were assigned equally to two groups: a control group (CT) and an RPG group (200 g of RPG per cow per day). The plasma content of insulin-like growth factor 1 (IGF1) was determined by using the ELISA method. Expressions of IGF members, the matrix metalloproteinase, protein kinase B (AKT)/mechanistic target of rapamycin complex1 (mTOR) signaling pathway, and cell proliferation factors (proliferating cell nuclear antigen (PCNA) and Ki67) were detected using real-time polymerase chain reaction, Western blot, immunohistochemistry, and immunofluorescence, respectively. The results showed that the positive cells of PCNA and Ki67 were increased in the endometrium of RPG versus CT cows. The RPG addition significantly increased the plasma IGF1 level 14 d after delivery. The mRNA expressions of the IGF family members (IGF1, IGF2, type 1 IGF receptor (IGF1R) and IGF-binding proteins (IGFBP1, IGFBP2, IGFBP4 and IGFBP5)) were upregulated, and mRNA expressions of matrix metalloproteinase MMP3 and MMP9 were downregulated in cows from the RPG group compared with the CT group. Meanwhile, the protein expressions of IGF1, IGF2, IGF1R, IGFBP1 and IGFBP4 were upregulated in cows from the RPG group compared with the CT group. Immunohistochemical analysis identified a positive response for IGF1R and IGF2R in the endometrium of RPG versus CT cows. Furthermore, the RPG supplementation increased the protein expressions of phosphorylated (p)-AKT to total AKT and p-mTOR to total mTOR ratio in the endometrium. The current results indicated that the RPG supplementation promoted the proliferation of endometrial cells by stimulating the IGFs and mTOR/AKT pathway in the early post-natal endometrium of dairy cows. Full article
Show Figures

Figure 1

Figure 1
<p>Plasma concentrations of IGF1 in post-natal cows in the RPG and the CT group during the experimental period. Data are presented as the means ± SD. Compared to control diet: * <span class="html-italic">p</span> &lt; 0.05.</p>
Full article ">Figure 2
<p>Double-labeling immunofluorescence staining for proliferating cell nuclear antigen (PCNA) (<b>green</b>) and Ki67 (<b>red</b>) in post-natal dairy cows endometrium. Scale bars = 20 μm. Data are presented as the means ± SD. Compared to control diet: ** <span class="html-italic">p</span> &lt; 0.01.</p>
Full article ">Figure 3
<p>Relative mRNA expression levels for (<b>A</b>) IGF1, IGF2, IGF1R, IGF2R, (<b>B</b>) MMP3, MMP9 and (<b>C</b>) IGFBP1-6 in the endometrium of post-natal dairy cows fed with RPG supplementation compared with the control diet (CT) during the experimental period. Data are presented as the means ± SD. * <span class="html-italic">p</span> &lt; 0.05, ** <span class="html-italic">p</span> &lt; 0.01.</p>
Full article ">Figure 4
<p>Immunoblotting results for phosphorylated proteins and IGF family members protein expression in uterine tissue from the post-natal cows fed with RPG supplementation and the control diet (CT) during the experimental period. Least squares geometric means of the ratio of phosphorylated (p) protein kinase B (AKT; Ser473): AKT (<b>A</b>), p-mechanistic target of rapamycin complex 1 (mTOR, Ser2448): mTOR (<b>B</b>), p-phosphatidylinositol 3-kinase (PI3K, Tyr 467): PI3K (<b>C</b>), IGF1 (<b>D</b>), IGF1R (<b>E</b>), IGF2 (<b>F</b>), IGF2R (<b>G</b>), IGFBP1 (<b>H</b>) and IGFBP4 (<b>I</b>) proteins are presented. Data are presented as the means ± SD. * <span class="html-italic">p</span> &lt; 0.05, ** <span class="html-italic">p</span> &lt; 0.01.</p>
Full article ">Figure 5
<p>Hematoxylin and eosin (H&amp;E) staining (<b>A</b>,<b>B</b>) and immunohistochemical analysis of the expression of IGF1R (<b>C</b>,<b>D</b>) and IGF2R (<b>E</b>,<b>F</b>) of the endometrium in post-natal dairy cows. In <b>A</b>, large amounts of eosin-stained (<b>orange arrows</b>) secretions are found in glandular, and blood vessel congestion and thrombosis (<b>green</b>) are widespread, as are the massive neutrophils (<b>yellow</b>) in both luminal epithelium and stroma sections. <b>B</b> shows that the shape of cytoplasm and nucleus is uniform in the endometrium. The positive-immunostained immune cells are shown by the arrows in <b>C</b>, <b>D</b>, <b>E</b> and <b>F</b>. Scale bars = 100 μm.</p>
Full article ">Figure 6
<p>Proposed mechanism for RPG in regulating the uterine involution in post-natal dairy cows. The effect of RPG addition was mediated by both IGFs and mTOR/AKT signaling pathways. RPG addition might promote IGF1 and IGF2 binding to their respective receptors and enhance IGF-independent actions of IGFBPs, thereby activating the mTOR/AKT signaling pathway and accelerating the endometrial proliferation and repair. Each ligand displayed a specific binding affinity for the receptors: continuous arrows indicate high affinity, while dotted arrows and a red “X” indicates low affinity. The black dashed arrows are currently unknown.</p>
Full article ">
18 pages, 3138 KiB  
Article
Protection of Animals during Transport: Analysis of the Infringements Reported from 2009 to 2013 during On-Road Inspections in Italy
by Barbara Padalino, Roberta Barrasso, Daniele Tullio, Martina Zappaterra, Leonardo Nanni Costa and Giancarlo Bozzo
Animals 2020, 10(2), 356; https://doi.org/10.3390/ani10020356 - 22 Feb 2020
Cited by 7 | Viewed by 3455
Abstract
Council Regulation (EC) No 1/2005 requires that vehicles that are transporting animals be subjected to checks conducted by competent authorities. Yearly, each member state sends a report to the European government on the infringements that have been discovered during on-road inspections. The reports [...] Read more.
Council Regulation (EC) No 1/2005 requires that vehicles that are transporting animals be subjected to checks conducted by competent authorities. Yearly, each member state sends a report to the European government on the infringements that have been discovered during on-road inspections. The reports that were published by the Italian Ministry of Public Health from 2009 to 2013 were analyzed. Possible associations between the type of infringement (related to animal welfare (AW), vehicle (V) and accompanying documents (D)), year, season, transported species, place of inspection, and competent authorities were identified. A total of 985 infringements were analyzed, with some vehicles receiving more than one (mean: 1.58; max: 9). A score (from 1 to 3) that was related to the severity of the infringements was created. In 2009 and 2010, there was a 50% higher probability of encountering penalties of a lower severity (D or V) than in 2011 (p < 0.0001). Vehicles that were transporting pigs showed the highest probability of committing animal welfare-related infringements (odds ratio (OR) = 3.85, 95% confidence interval (95%CI) = 1.82–8.76, p < 0.0001). Vehicles were four times more likely to suffer animal welfare-related penalties when traffic police worked in synergy with veterinary services (OR = 4.12, 95%CI = 1.70–11.13, p = 0.0005). Vehicles that were transporting Equidae and “other species,” including pets, for commercial purposes were more likely to be fined for a lack or incompleteness of the veterinary documents than those transporting cattle (p = 0.002 and p = 0.004, respectively). This study gives statistical evidence of the implementation of EC 1/2005. The training of transporters and drivers on how to manage transport in an animal welfare-friendly manner and a standardized method on how to conduct road inspections among competent authorities are recommended. Full article
(This article belongs to the Special Issue Hygienic-Sanitary Problems Related to Livestock Species Slaughtering)
Show Figures

Figure 1

Figure 1
<p>Subcategories of infringements that are related to animal welfare (<b>a</b>), vehicle (<b>b</b>) and documents (<b>c</b>). SSM: scheduled stop missing.</p>
Full article ">Figure 2
<p>Probability of a more severe infringement being uncovered during on-road inspections (1 (blue) = less severe infringements, 2 (orange) = medium severe infringements, 3 (grey) = the most severe ones) associated with year (<b>a</b>), season (<b>b</b>), transported animal species (<b>c</b>), dispatch country (<b>d</b>), supervisory body (<b>e</b>), and the place of inspection in Italy (<b>f</b>).DE/PL: Germany/Poland; BE/NL: Belgium/the Netherlands; ES: Spain; FR: France; HU/RO: Hungary/Romania; IT: Italy; Other: China; Czech Republic; Denmark; Ireland; Lithuania; Slovakia; Slovenia; United Kingdom; and UVAC: Veterinary Offices for Compliance with EU Requirements.</p>
Full article ">Figure 3
<p>Probability of uncovering infringements due to missing a scheduled stop (SSM) for the considered years (<b>a</b>) and for the country of dispatch (<b>b</b>). Probability of uncovering infringements due to overcrowding by species (<b>c</b>) and by country of dispatch for pigs (<b>d</b>). Probability of uncovering infringements due to lack of equipment by species (<b>e</b>). Probability of uncovering infringements due to lack of documents by species (<b>e</b>). DE/PL: Germany/Poland; BE/NL: Belgium/the Netherlands; ES: Spain; FR: France; HU/RO: Hungary/Romania; IT: Italy; Other: China; Czech Republic; Denmark; Ireland; Lithuania; Slovakia; Slovenia; United Kingdom; and SSM: scheduled stop missing.</p>
Full article ">Figure 4
<p>Multiple correspondence analysis biplot with the infringements distinguished on the basis of the transported animal species and the vectors representing the variables with the greatest effect on the two new dimensions (Dim1 and Dim2).</p>
Full article ">
10 pages, 1380 KiB  
Article
Proteomics Analysis of Colostrum Samples from Sows Housed under Different Conditions
by Guoan Yin, Lei Wang, Xiaoyu Zhao, Langchao Yu and Dapeng Huang
Animals 2020, 10(2), 355; https://doi.org/10.3390/ani10020355 - 22 Feb 2020
Cited by 1 | Viewed by 2412
Abstract
This study investigated the proteomic characteristics of colostrum for sows housed under different conditions. Among 12 gilts, four were housed in a gestation-crate and farrowing-crate combined housing system (CC) as controls, four were housed in a gestation-pen and farrowing-pen combined housing system (PP), [...] Read more.
This study investigated the proteomic characteristics of colostrum for sows housed under different conditions. Among 12 gilts, four were housed in a gestation-crate and farrowing-crate combined housing system (CC) as controls, four were housed in a gestation-pen and farrowing-pen combined housing system (PP), and four were housed in a gestation-pen and farrowing-crate combined housing system (PC). Differentially expressed proteins in the colostrum (PP versus CC, and PC versus CC) were screened by proteomics technology, and bioinformatics analysis was then performed. Results showed that 93 proteins were differentially expressed in PP versus CC, and that 126 proteins were differentially expressed in PC versus CC. The differentially expressed proteins in the PP versus CC comparison were mainly enriched in interleukin (IL)-17, transforming growth factor-β, and nuclear factor-κ B signaling pathways, and in metabolic pathways, including glutathione metabolism, peroxisome, and carbon metabolism. In contrast, differentially expressed proteins in the PC versus CC comparison were enriched in the IL-17 signaling pathway, cholesterol metabolism, and peroxisome proliferator-activated receptor signaling pathway. In conclusion, the housing environment appeared to affect the colostrum composition of sows by acting on their immune system and metabolic processes, particularly fat metabolism. Full article
(This article belongs to the Special Issue Animal Proteomics)
Show Figures

Figure 1

Figure 1
<p>(<b>a</b>) Volcano plot of gestation-pen and farrowing-pen combined housing system (PP) vs gestation-crate and farrowing-crate combined housing system (CC) differential expression protein. (<b>b</b>) Volcano plot of gestation-pen and farrowing-crate combined housing system (PC) vs CC differential expression protein. Note: Ratio of differential protein expression over 1.3 was the significant change threshold (<span class="html-italic">p</span> &lt; 0.05).</p>
Full article ">Figure 2
<p>(<b>a</b>) Gene-ontology (GO) function annotation of PP vs. CC differential expression protein. (<b>b</b>) GO function annotation of PC vs. CC differential expression protein.</p>
Full article ">Figure 3
<p>(<b>a</b>) Kyoto Encyclopedia of Genes and Genomes (KEGG) pathway enrichment of PP vs CC differential proteins. (<b>b</b>) KEGG pathway enrichment of PC vs. CC differential proteins. Note: Vertical axis of bubble chart is functional classification or pathway, enrichment test by Fisher’s exact test.</p>
Full article ">
17 pages, 2796 KiB  
Article
Monitoring Acute Pain in Donkeys with the Equine Utrecht University Scale for Donkeys Composite Pain Assessment (EQUUS-DONKEY-COMPASS) and the Equine Utrecht University Scale for Donkey Facial Assessment of Pain (EQUUS-DONKEY-FAP)
by Machteld C. van Dierendonck, Faith A. Burden, Karen Rickards and Johannes P.A.M. van Loon
Animals 2020, 10(2), 354; https://doi.org/10.3390/ani10020354 - 22 Feb 2020
Cited by 32 | Viewed by 7734
Abstract
Objective pain assessment in donkeys is of vital importance for improving welfare in a species that is considered stoic. This study presents the construction and testing of two pain scales, the Equine Utrecht University Scale for Donkey Composite Pain Assessment (EQUUS-DONKEY-COMPASS) and the [...] Read more.
Objective pain assessment in donkeys is of vital importance for improving welfare in a species that is considered stoic. This study presents the construction and testing of two pain scales, the Equine Utrecht University Scale for Donkey Composite Pain Assessment (EQUUS-DONKEY-COMPASS) and the Equine Utrecht University Scale for Donkey Facial Assessment of Pain (EQUUS-DONKEY-FAP), in donkeys with acute pain. A cohort follow-up study using 264 adult donkeys (n = 12 acute colic, n = 25 acute orthopaedic pain, n = 18 acute head-related pain, n = 24 postoperative pain, and n = 185 controls) was performed. Both pain scales showed differences between donkeys with different types of pain and their control animals (p < 0.001). The EQUUS-DONKEY-COMPASS and EQUUS-DONKEY-FAP showed high inter-observer reliability (Cronbach’s alpha = 0.97 and 0.94, respectively, both p < 0.001). Sensitivity of the EQUUS-DONKEY-COMPASS was good for colic and orthopaedic pain (83% and 88%, respectively), but poor for head-related and postoperative pain (17% and 21%, respectively). Sensitivity of the EQUUS-DONKEY-FAP was good for colic and head-related pain (75% and 78%, respectively), but moderate for orthopaedic and postoperative pain (40% and 50%, respectively). Specificity was good for all types of pain with both scales (91%–99%). Different types of acute pain in donkeys can be validly assessed by either a composite or a facial expression-based pain scale. Full article
(This article belongs to the Special Issue Towards a better assessment of acute pain in equines)
Show Figures

Figure 1

Figure 1
<p>Examples of facial characteristics of donkeys with acute pain: backwards-directed ears (<b>A</b>), more open eyelids (<b>B</b>), obviously opened nostrils (<b>C</b>), obviously more opened eyes with sclera visible (<b>D</b>), obviously lifted corners of the mouth (<b>E</b>), obvious orbital tightening of eyelids (<b>F</b>).</p>
Full article ">Figure 2
<p>Inter-observer reliability. Equine Utrecht University Scale for Donkey Composite Pain Assessment (EQUUS-DONKEY-COMPASS): Cronbach’s alpha = 0.97 (<span class="html-italic">p</span> &lt; 0.001), bias = 0.02, and limits of agreement of −1.9 to +2.0 (<span class="html-italic">n</span> = 497) (<b>A</b>,<b>B</b>). Equine Utrecht University Scale for Donkey Facial Assessment of Pain (EQUUS-DONKEY-FAP): Cronbach’s alpha = 0.94 (<span class="html-italic">p</span> &lt; 0.001), bias = 0.02, and limits of agreement of −1.55 to +1.59 (<span class="html-italic">n</span> = 497) (<b>C</b>,<b>D</b>).</p>
Full article ">Figure 3
<p>EQUUS DONKEY COMPASS patients versus controls. <b>(A</b>) Facial pain (<span class="html-italic">n</span> = 18 patients versus = 39 controls), (<b>B</b>) Orthopaedic pain (<span class="html-italic">n</span> = 25 patients versus <span class="html-italic">n</span> = 68 controls); (<b>C</b>) Colic pain (<span class="html-italic">n</span> = 12 patients versus <span class="html-italic">n</span> = 28 controls), (<b>D</b>) Postoperative pain (<span class="html-italic">n</span> = 24 patients versus <span class="html-italic">n</span> = 50 controls). Lines in boxes show median scores; x—mean value; boxes show 25–75th percentiles; error bars show 5–95th percentiles. *** <span class="html-italic">p</span> &lt; 0.001.</p>
Full article ">Figure 4
<p>EQUUS-DONKEY-FAP patients versus controls. <b>(A</b>) Facial pain (<span class="html-italic">n</span> = 18 patients versus <span class="html-italic">n</span> = 39 controls), (<b>B</b>) Orthopaedic pain (<span class="html-italic">n</span> = 25 patients versus <span class="html-italic">n</span> = 68 controls); (<b>C</b>) Colic pain (<span class="html-italic">n</span> = 12 patients versus <span class="html-italic">n</span> = 28 controls), (<b>D</b>) Postoperative pain (<span class="html-italic">n</span> = 24 patients versus <span class="html-italic">n</span> = 50 controls). Lines in boxes show median scores; x—mean value; boxes show 25th–75th percentiles; error bars show 5th–95th percentiles. ***—<span class="html-italic">p</span> &lt; 0.001.</p>
Full article ">Figure 5
<p>EQUUS-DONKEY-COMPASS) and EQUUS-DONKEY-FAP after surgical castration. (<b>A</b>) EQUUS DONKEY COMPASS, (<b>B</b>) EQUUS-DONKEY-FAP (<span class="html-italic">n</span> = 7 patients versus <span class="html-italic">n</span> = 16 controls). Lines in boxes show median scores; boxes show 25th–75th percentiles; error bars show 5th–95th percentiles. * <span class="html-italic">p</span> &lt; 0.05.</p>
Full article ">Figure 6
<p>EQUUS-DONKEY-COMPASS mean patient scores over time. (<b>A</b>) Facial pain (<span class="html-italic">n</span> patients on Day 0: T0a = 7, T01b = 5; Day 1: T1a = 15, T1b = 11; Day 2: T2a = 5, T2b = 5; Day 3: T3a = 3, T3b = 3), (<b>B</b>) Orthopaedic pain (<span class="html-italic">n</span> patients on Day 0: T0a = 16, T01b = 2; Day 1; T1a = 12, T1b = 3; Day 2: T2a = 6, T2b = 0; Day 3: T3a = 5, T3b = 1); (<b>C</b>) Colic pain (<span class="html-italic">n</span> patients on Day 0: T0a = 6, T01b = 3; Day 1; T1a = 4, T1b = 2; Day 2: T2a = 2, T2b = 2; Day 3: T3a = 1, T3b = 0), (<b>D</b>) Postoperative pain (n patients before surgery: T0a = 22; <span class="html-italic">n</span> patients post-surgery: T0b = 23; Day 1; T1a = 17, T1b = 5; Day 2: T2a = 3, T2b = 1; Day 3: T3a = 0, T3b = 0). The ‘a’ score was determined in the morning; the ‘b’ score was determined in the afternoon. Lines in boxes show median scores; x = mean value; boxes show 25th–75th percentiles; error bars show 5th–95th percentiles. T0a: admission to clinic for facial pain, orthopaedic- and colic pain patients, baseline assessment before surgery for surgery patients, T0b: afternoon of first day after admission to clinic for facial pain, orthopaedic- and colic pain patients, first assessment 4 hours after surgery for surgical patients. T1a: morning assessment of day 1, T1b: afternoon assessment of day 1. T2a: morning assessment of day 2, T2b: afternoon assessment of day 2. T3a: morning assessment of day 3, T3b: afternoon assessment of day 3.</p>
Full article ">Figure 7
<p>EQUUS-DONKEY-FAP mean patient scores over time. (<b>A</b>) Facial pain (<span class="html-italic">n</span> patients on Day 0: T0a = 7, T01b = 5; Day 1: T1a = 15, T1b = 11; Day 2: T2a = 5, T2b = 5; Day 3: T3a = 3, T3b = 3), (<b>B</b>) Orthopaedic pain (<span class="html-italic">n</span> patients on Day 0: T0a = 16, T01b = 2; Day 1; T1a = 12, T1b = 3; Day 2: T2a = 6, T2b = 0; Day 3: T3a = 5, T3b = 1); (<b>C</b>) Colic pain (<span class="html-italic">n</span> patients on Day 0: T0a = 6, T01b = 3; Day 1; T1a = 4, T1b = 2; Day 2: T2a = 2, T2b = 2; Day 3: T3a = 1, T3b = 0), (<b>D</b>) Postoperative pain (patients before surgery: T0a = 22; patients post-surgery: T0b = 23; Day 1; T1a = 17, T1b = 5; Day 2: T2a = 3, T2b = 1; Day 3: T3a = 0, T3b = 0). The ‘a’ score was determined in the morning; the ‘b’ score was determined in the afternoon. Lines in boxes show median scores; x= mean value; boxes show 25th–75th percentiles; error bars show 5th–95th percentiles. T0a: admission to clinic for facial pain, orthopaedic- and colic pain patients, baseline assessment before surgery for surgery patients, T0b: afternoon of first day after admission to clinic for facial pain, orthopaedic- and colic pain patients, first assessment 4 hours after surgery for surgical patients. T1a: morning assessment of day 1, T1b: afternoon assessment of day 1. T2a: morning assessment of day 2, T2b: afternoon assessment of day 2. T3a: morning assessment of day 3, T3b: afternoon assessment of day 3.</p>
Full article ">
17 pages, 644 KiB  
Review
Equine Milk Production and Valorization of Marginal Areas—A Review
by Nicoletta Miraglia, Elisabetta Salimei and Francesco Fantuz
Animals 2020, 10(2), 353; https://doi.org/10.3390/ani10020353 - 22 Feb 2020
Cited by 36 | Viewed by 5664
Abstract
The equine dairy chain is renewing the interest toward horse and donkey breeding for the production of milk with potential health promoting properties. The dairy equine chain for human consumption could contribute to the rural eco-sustainable development for the micro-economies of those areas [...] Read more.
The equine dairy chain is renewing the interest toward horse and donkey breeding for the production of milk with potential health promoting properties. The dairy equine chain for human consumption could contribute to the rural eco-sustainable development for the micro-economies of those areas threatened by marginalization. As a part of the whole equine industry, and its possible impact in the modern and future society, the main traits of the equine dairy enterprise are reviewed with a special focus on management of animals and milk. Equine milk compositional and nutritional peculiarities are described as also related to milk hygiene and health issues. Scientific and technical aspects of the feeding management are considered in the frame of the emerging dairy equine enterprise, where pasture is an essential element that allows to match production goals for horses and donkeys, biodiversity preservation, as well as landscape safeguard. Full article
(This article belongs to the Special Issue Horse Feeding and Management)
Show Figures

Figure 1

Figure 1
<p>The average growth of pasture grass in Central Italy during the grazing period (modified from [<a href="#B94-animals-10-00353" class="html-bibr">94</a>]).</p>
Full article ">Figure 2
<p>The average growth of pasture grass in Southern Italy (modified from [<a href="#B94-animals-10-00353" class="html-bibr">94</a>]).</p>
Full article ">
17 pages, 711 KiB  
Article
Sequential Analysis of Livestock Herding Dog and Sheep Interactions
by Jonathan Early, Jessica Aalders, Elizabeth Arnott, Claire Wade and Paul McGreevy
Animals 2020, 10(2), 352; https://doi.org/10.3390/ani10020352 - 22 Feb 2020
Cited by 4 | Viewed by 4420
Abstract
Livestock herding dogs are crucial contributors to Australian agriculture. However, there is a dearth of empirical studies of the behavioural interactions between dog and livestock during herding. A statistical approach that may reveal cause and effect in such interactions is lag sequential analysis. [...] Read more.
Livestock herding dogs are crucial contributors to Australian agriculture. However, there is a dearth of empirical studies of the behavioural interactions between dog and livestock during herding. A statistical approach that may reveal cause and effect in such interactions is lag sequential analysis. Using 48 video recordings of livestock herding dogs and sheep in a yard trial competition, event-based (time between behaviours is irrelevant) and time-based (time between behaviours is defined) lag sequential analyses identified several significant behavioural interactions (adjusted residuals greater than 2.58; the maximum likelihood-ratio chi-squared statistic for all eight contingency tables identified all sequences as highly significant (p < 0.001)). These sequences were: The dog ceasing all movement followed by the sheep also ceasing movement; the dog chasing the sheep and a group of sheep escaping the main flock; a single sheep escaping the flock and the dog chasing; sheep initiating movement followed by the dog following; foot-stamping followed by the dog ceasing all movement; and, foot-stamping by the sheep and the dog lip-licking in response. Log linear regression identified significant relationships among undesirable behaviours in sheep and both observed trial duration (p = 0.001) and trial score (p = 0.009). No differences in the herding styles of dogs were identified between sex of dog and frequency of sheep escape behaviours (p = 0.355) nor the sex of dog and competition level (p = 0.116). The identification of trial score as a predictor of efficient performance confirms the benefits of incorporating extant objective measures to assess livestock herding dogs. Full article
(This article belongs to the Section Human-Animal Interactions, Animal Behaviour and Emotion)
Show Figures

Figure 1

Figure 1
<p>Diagram of competition yard course (not to scale). Illustration of standardised competition yard course. Dog graphic—starting point of dog for competition and video recording coding; Sheep graphic—starting point of sheep for competition and video recording coding; Holding-pen—first holding pen along competition course and end of video recording coding when last sheep entered. Drenching race—commonly used to administer veterinary therapeutics. Solid lines—yard fences; Broken lines—gates. The drafting (commonly used to separate selected sheep from the main flock) and loading pens and races (used to load sheep onto transport vehicles) section of this competition course were excluded from video recording coding. Arrows indicate direction of movement in races.</p>
Full article ">Figure 2
<p>Competition trial results summary: Competition level; Trial score and Observed trial duration. Competition trial scores range and observed trial duration (seconds) range coded divided by sex of dogs and competition level. TS—Trial score range; OD—Observed trial duration range; MI—<span class="html-italic">Improver</span> (n = 7); MO—Male <span class="html-italic">Open</span> (n = 24); FI—Female <span class="html-italic">Improver</span> (n = 7); FO—Female <span class="html-italic">Open</span> (n = 6); MFI—Male and Female <span class="html-italic">Improver</span> (combined; n = 14); MFO—Male and Female <span class="html-italic">Open</span> (combined; n = 32); Circles within ranges indicates the mean value. Competition trial scores range from a perfect score of 100 to 0. Three dogs competed in both <span class="html-italic">Improver</span> and <span class="html-italic">Open</span> competition levels (male n = 2; female n = 1).</p>
Full article ">Figure 3
<p>Significant event-based lag sequential analysis results (observed frequencies and conditional probabilities) for sheep behaviour response to dog behaviour and dog behaviour response to sheep behaviour. D—dog-initiated behavioural interactions (denoted by triangle); S—sheep-initiated behavioural interactions (denoted by circle). Da: Chasing—Escape group; Db: Stalking—Foot-stamping; Dc: Moving—Splitting; Dd: Not moving—Stop; De: Moving—Escape single; Sa: Foot-stamping—Lip-licking; Sb: Start—Barking; Sc: Foot-stamping—Not moving; Sd: Stop—Not moving; Se: Stop—Stalking; Sf: Start—Moving; Sg: Escape single and Chasing.</p>
Full article ">Figure 4
<p>Significant time-based (one, two, three seconds) lag sequential analysis results (observed frequencies and conditional probabilities) for sheep behaviour response to dog behaviour and dog behaviour response to sheep behaviour. D—dog-initiated behavioural interactions (denoted by triangle); S—sheep-initiated behavioural interactions (denoted by circular dot); Number (#) denotes the time-based lag, either 1, 2 or 3 s. D#a: Barking—Splitting; D#b: Crouching—Escape group; D#c: Chasing—Escape group; D#d: Not moving—Stop; D#e: Moving—Escape single; S#a: Foot-stamping—Lip-licking; S#b: Foot-stamping—Not moving; S#c: Stop—Stalking; S#d: Stop—Not moving; S#e: Start—Not moving; S#f: Escape single—Chasing.</p>
Full article ">
14 pages, 685 KiB  
Article
Evaluation of the Physical Properties of Bedding Materials for Dairy Cattle Using Fuzzy Clustering Analysis
by Patrícia Ferreira Ponciano Ferraz, Gabriel Araújo e Silva Ferraz, Lorenzo Leso, Marija Klopčič, Giuseppe Rossi and Matteo Barbari
Animals 2020, 10(2), 351; https://doi.org/10.3390/ani10020351 - 22 Feb 2020
Cited by 11 | Viewed by 5445
Abstract
The bedding materials used in dairy cow housing systems are extremely important for animal welfare and performance. A wide range of materials can be used as bedding for dairy cattle, but their physical properties must be analysed to evaluate their potential. In the [...] Read more.
The bedding materials used in dairy cow housing systems are extremely important for animal welfare and performance. A wide range of materials can be used as bedding for dairy cattle, but their physical properties must be analysed to evaluate their potential. In the present study, the physical properties of various bedding materials for dairy cattle were investigated, and different fuzzy clustering algorithms were employed to cluster these materials based on their physical properties. A total of 51 different bedding materials from various places in Europe were collected and tested. Physical analyses were carried out for the following parameters: bulk density (BD), water holding capacity (WHC), air-filled porosity (AFP), global density (GD), container capacity (CC), total effective porosity (TEP), saturated humidity (SH), humidity (H), and average particle size (APS). These data were analysed by principal components analysis (PCA) to reduce the amount of data and, subsequently, by fuzzy clustering analysis. Three clustering algorithms were tested: k-means (KM), fuzzy c-means (FCM) and Gustafson–Kessel (GK) algorithms. Furthermore, different numbers of clusters (2−8) were evaluated and subsequently compared using five validation indexes. The GK clustering algorithm with eight clusters fit better regarding the division of materials according to their properties. From this clustering analysis, it was possible to understand how the physical properties of the bedding materials may influence their behaviour. Among the materials that fit better as bedding materials for dairy cows, Posidonia oceanica (Cluster 6) can be considered an alternative material. Full article
(This article belongs to the Section Animal System and Management)
Show Figures

Figure 1

Figure 1
<p>GK clusters for eight partitions; the red dots are the cluster centres and the blue dots are data samples.</p>
Full article ">
11 pages, 695 KiB  
Article
Detection and Characterization of Leptospira Infection and Exposure in Rats on the Caribbean Island of Saint Kitts
by Sreekumari Rajeev, Kanae Shiokawa, Alejandro Llanes, Malavika Rajeev, Carlos Mario Restrepo, Raymond Chin, Eymi Cedeño and Esteban Ellis
Animals 2020, 10(2), 350; https://doi.org/10.3390/ani10020350 - 22 Feb 2020
Cited by 8 | Viewed by 3148
Abstract
In this study, we detected and characterized Leptospira infection and exposure in rats on the Caribbean island of Saint Kitts for the first time. We detected Leptospira infection in 17/29 (59%), 14/29 (48)%, and 11/29 (38)% of rats by RT-PCR, culture, and immunofluorescence [...] Read more.
In this study, we detected and characterized Leptospira infection and exposure in rats on the Caribbean island of Saint Kitts for the first time. We detected Leptospira infection in 17/29 (59%), 14/29 (48)%, and 11/29 (38)% of rats by RT-PCR, culture, and immunofluorescence assay, respectively. Whole genome sequencing (WGS) and analysis and serogrouping of 17 Leptospira strains isolated from rats revealed their close relationship with L. interrogans serogroup Icterohaemorrhagiae (n = 10) and L. borgpetersenii serogroup Ballum (n = 7). WGS, serogrouping, and additional PCR tests on rat kidneys confirmed mixed infections with L. interrogans and L. borgpetersenii in the kidneys of three rats. Microscopic agglutination test (MAT) was positive for 25/29 (87%) of the rats tested, and the response was restricted to serovars Icterohaemorrhagiae {24/29(83%)}, Mankarso {4/29(14%)}, Copenhageni {4/29(14%)}, Grippotyphosa {2/29(7%)}, and Wolffi {1/29(3%)}. Interestingly, there was no agglutinating antibody response to serovar Ballum. We observed a similar pattern in the serologic response using Leptospira isolates obtained from this study with each of the rat sera, with strong response to L. interrogans isolates but minimal reactivity to L. borgpetersenii isolates. Our findings suggest the use of multiple complementary diagnostic tests for Leptospira surveillance and diagnosis to improve the accuracy of the data. Full article
(This article belongs to the Section Wildlife)
Show Figures

Graphical abstract

Graphical abstract
Full article ">Figure 1
<p>Distribution of the microscopic agglutination test (MAT) titers in rats. The initial starting titer was 1:50.</p>
Full article ">Figure 2
<p>Cross-isolate MAT Assay. MAT response of individual rat serum and rat <span class="html-italic">Leptospira</span> isolates from this study. The X indicates the response of an individual rat to its own isolate. M = mature, J = juvenile.</p>
Full article ">
13 pages, 282 KiB  
Article
Diet Supplementation with a Bioactive Pomace Extract from Olea europaea Partially Mitigates Negative Effects on Gut Health Arising from a Short-Term Fasting Period in Broiler Chickens
by Javier Herrero-Encinas, Marta Blanch, José J. Pastor and David Menoyo
Animals 2020, 10(2), 349; https://doi.org/10.3390/ani10020349 - 22 Feb 2020
Cited by 7 | Viewed by 3105
Abstract
The effects of supplementing chicken diets with an olive pomace extract (OE) from Olea europaea on performance and gut health after a challenge of intestinal permeability (IP) increase were studied. Treatments included a control diet with no additives (CF), and diets supplemented with [...] Read more.
The effects of supplementing chicken diets with an olive pomace extract (OE) from Olea europaea on performance and gut health after a challenge of intestinal permeability (IP) increase were studied. Treatments included a control diet with no additives (CF), and diets supplemented with 100 ppm of monensin (MF) or with 500 (OE500F) and 1500 ppm (OE1500F) of an OE. At 14 d, all birds, except those allocated in a control group (CNF), were submitted to a 15.5 h short-term fasting period to induce IP increase. Fasting increased (p < 0.05) lactulose/mannitol ratio and Alpha 1 Acid Glycoprotein concentration, and reduced (p < 0.001) villus/crypt ratio. Moreover, a down-regulation of Claudin-1 (p < 0.05), an up-regulation of TLR4 and IL-8 (p < 0.05) ileal gene expression was observed in CF birds compared to CNF. OE500F treatment reduced duodenal crypt depth compared to CF (p < 0.05; OE linear effect). Mannitol concentration and ileal IL-8 expression were reduced in OE500F compared to CF and OE1500F (p = 0.05). Fasting challenge induced an increase in IP triggering an inflammatory response. Supplementation of OE up to 1500 ppm did not affect growth performance and alleviated some of the negative effects of the fasting challenge. Full article
18 pages, 1664 KiB  
Article
Effects of Farrowing Stall Layout and Number of Heat Lamps on Sow and Piglet Production Performance
by Suzanne M. Leonard, Hongwei Xin, Tami M. Brown-Brandl, Brett C. Ramirez, Somak Dutta and Gary A. Rohrer
Animals 2020, 10(2), 348; https://doi.org/10.3390/ani10020348 - 22 Feb 2020
Cited by 10 | Viewed by 4172
Abstract
Most farrowing facilities in the United States use stalls and heat lamps to improve sow and piglet productivity. This study investigated these factors by comparing production outcomes for three different farrowing stall layouts (traditional, expanded creep area, expanded sow area) and use of [...] Read more.
Most farrowing facilities in the United States use stalls and heat lamps to improve sow and piglet productivity. This study investigated these factors by comparing production outcomes for three different farrowing stall layouts (traditional, expanded creep area, expanded sow area) and use of one or two heat lamps. Data were collected on 427 sows and their litters over one year. Results showed no statistical differences due to experimental treatment for any of the production metrics recorded, excluding percent stillborn. Parity one sows had fewer piglets born alive (p < 0.001), lower percent mortality (p = 0.001) and over-lay (p = 0.003), and a greater number of piglets weaned (p < 0.001) with lower average daily weight gain (ADG) (p < 0.001) and more uniform litters (p = 0.001) as compared to higher parity sows. Farrowing turn, associated with group/seasonal changes, had a significant impact on most of the production metrics measured. Number of piglets born influenced the percent stillborn (p < 0.001). Adjusted litter size had a significant impact on percent mortality (p < 0.001), percent over-lay (p < 0.001), and number of piglets weaned (p < 0.001). As the number of piglets weaned per litter increased, both piglet ADG and litter uniformity decreased (p < 0.001). This information can be used to guide producers in farrowing facility design. Full article
(This article belongs to the Section Pigs)
Show Figures

Figure 1

Figure 1
<p>Data were collected on 25 turns of sows entering the farrowing facility. Three farrowing rooms were used and collection occurred from September 2017 to October 2018. Average daily ambient and indoor (average for all three farrowing rooms) air temperatures are displayed.</p>
Full article ">Figure 2
<p>Three experimental farrowing stall layouts used for traditional stall layout (T), expanded creep area layout (C), and expanded sow area layout (S). Shaded areas indicate piglet creep areas and striped areas are sow areas. Sow feeders, shown in solid black, had outer dimensions of (L×W) 0.35 × 0.34 m, of which 0.23 m of feeder length extended into the sow stall area. The “X” symbol represents double water assemblies which were mounted on the bars of the side of the sow stall approximately 0.3 m from the front of the stall. All dimensions are in meters.</p>
Full article ">Figure 3
<p>Experimental layout for arbitrarily selected turns 20-22. Stall layouts were randomized once and remained constant throughout the study, while heat lamp treatments were re-randomized for each turn.</p>
Full article ">Figure 4
<p>Distribution of percent stillborn piglets by treatment. On the boxplots dark lines within the boxes represent the median value while the box shows the interquartile range. The endpoints of the whiskers show 1.5 times the interquartile range, and dots mark any values that are outside of the whisker range. Stall layouts: traditional (T), expanded creep area (C), expanded sow area (S); Heat lamp treatments: one heat lamp (1HL), two heat lamps (2HL).</p>
Full article ">Figure 5
<p>Summary of piglet percent PWM by turn, showing significant seasonal variation (<span class="html-italic">p &lt;</span> 0.001). Overall average mortality was 13.1%, shown by the solid black line.</p>
Full article ">Figure 6
<p>Piglet mortality by cause (general PWM or over-lay) as it occurred within each treatment group. Error bars display standard error by group and mortality cause. Stall layouts: traditional (T), expanded creep area (C), expanded sow area (S); Heat lamp treatments: one heat lamp (1HL), two heat lamps (2HL).</p>
Full article ">Figure 7
<p>Number of piglets weaned per litter by turn. Overall average number of piglets weaned per litter was 10.5, shown by the solid black line.</p>
Full article ">Figure 8
<p>Differences in litter uniformity based on sow parity. Minimum, average, and maximum wean weight of individual piglets within litter are shown.</p>
Full article ">
20 pages, 1550 KiB  
Article
Effect of Carotenoids, Oligosaccharides and Anthocyanins on Growth Performance, Immunological Parameters and Intestinal Morphology in Broiler Chickens Challenged with Escherichia coli Lipopolysaccharide
by Brigitta Csernus, Sándor Biró, László Babinszky, István Komlósi, András Jávor, László Stündl, Judit Remenyik, Péter Bai, János Oláh, Georgina Pesti-Asbóth and Levente Czeglédi
Animals 2020, 10(2), 347; https://doi.org/10.3390/ani10020347 - 21 Feb 2020
Cited by 38 | Viewed by 4465
Abstract
This study was conducted to investigate the effect of carotenoid, oligosaccharide and anthocyanin supplementation in broiler diets under Escherichia coli lipopolysaccharide (LPS) challenge. Ross 308 chickens were fed 5 diets: basal diet (control diet), diet supplemented with β-glucan in 0.05% (positive control) and [...] Read more.
This study was conducted to investigate the effect of carotenoid, oligosaccharide and anthocyanin supplementation in broiler diets under Escherichia coli lipopolysaccharide (LPS) challenge. Ross 308 chickens were fed 5 diets: basal diet (control diet), diet supplemented with β-glucan in 0.05% (positive control) and diets with 0.5% carotenoid-, oligosaccharide- or anthocyanin contents. On the 26th days of age, chickens were challenged intraperitoneally 2 mg LPS per kg of body weight. 12 h after injection, birds were euthanized, then spleen and ileum samples were collected. LPS induced increased relative mRNA expression of splenic (p = 0.0445) and ileal (p = 0.0435) interleukin-1β (IL-1β), which was lower in the spleen in carotenoid (p = 0.0114), oligosaccharide (p = 0.0497) and anthocyanin (p = 0.0303)-treated chickens compared to LPS-injected control birds. Dietary supplementation of carotenoids also decreased relative gene expression of splenic interleukin-6 (IL-6) (p = 0.0325). In the ileum, β-glucan supplementation showed lower relative mRNA expression of toll-like receptor 5 (TLR-5) (p = 0.0387) compared to anthocyanin treatment. Gene expression of both splenic and ileal interferon-α (IFN-α), interferon-γ (IFN-γ), toll-like receptor 4 (TLR-4) and toll-like receptor 5 (TLR-5) were not influenced by dietary supplements. In conclusion, carotenoids, oligosaccharides and anthocyanins could partially mitigate the immune stress caused by LPS challenge. All of the compounds impacted longer villus height (p < 0.0001), villus height:crypt depth ratios were higher after β-glucan (p < 0.0001) and anthocyanin (p = 0.0063) supplementations and thickened mucosa was observed in β-glucan (p < 0.0001), oligosaccharide (p < 0.0001) and anthocyanin (p = 0.048) treatments. All of these findings could represent a more effective absorption of nutrients. Full article
(This article belongs to the Section Poultry)
Show Figures

Figure 1

Figure 1
<p>HPLC profile of DAD detection of carotenoids on 460 nm from Hungarian red sweet pepper.</p>
Full article ">Figure 2
<p>Relative spleen weight (spleen weight compared to live weight) of chickens fed basal diet under <span class="html-italic">Escherichia coli</span> O55:B5 LPS challenge, basal diet under isotonic saline challenge, diet supplemented with 0.05% β-glucan-, diet supplemented with 0.5 % carotenoids-, diet supplemented with 0.5% oligosaccharides- and diet supplemented with 0.5% anthocyanins under <span class="html-italic">Escherichia coli</span> O55:B5 LPS challenge (<span class="html-italic">n</span> = 6/treatment). Error bars represent means ± standard errors of the mean. The effects were analyzed by One-way ANOVA and differences among treatments were considered significant at <span class="html-italic">p</span> &lt; 0.05. Dietary effects were not significant.</p>
Full article ">Figure 3
<p>Relative interleukin-1β (<b>a</b>), interleukin-6 (<b>b</b>), interferon-α (<b>c</b>), interferon-γ (<b>d</b>), toll-like receptor 4 (<b>e</b>) and toll-like receptor 5 (<b>f</b>) mRNA expression in spleen of chickens fed basal diet under <span class="html-italic">Escherichia coli</span> LPS challenge, basal diet under isotonic saline challenge, diet supplemented with 0.05% β-glucan-, diet supplemented with 0.5% carotenoids-, diet supplemented with 0.5% oligosaccharides- and diet supplemented with 0.5% anthocyanins under <span class="html-italic">Escherichia coli</span> O55:B5 LPS challenge (<span class="html-italic">n</span> = 6/treatment). Error bars represent means ± standard errors of the mean. The effects were analyzed by One-way ANOVA and groups that do not share a letter are significantly different (<span class="html-italic">p</span> &lt; 0.05).</p>
Full article ">Figure 3 Cont.
<p>Relative interleukin-1β (<b>a</b>), interleukin-6 (<b>b</b>), interferon-α (<b>c</b>), interferon-γ (<b>d</b>), toll-like receptor 4 (<b>e</b>) and toll-like receptor 5 (<b>f</b>) mRNA expression in spleen of chickens fed basal diet under <span class="html-italic">Escherichia coli</span> LPS challenge, basal diet under isotonic saline challenge, diet supplemented with 0.05% β-glucan-, diet supplemented with 0.5% carotenoids-, diet supplemented with 0.5% oligosaccharides- and diet supplemented with 0.5% anthocyanins under <span class="html-italic">Escherichia coli</span> O55:B5 LPS challenge (<span class="html-italic">n</span> = 6/treatment). Error bars represent means ± standard errors of the mean. The effects were analyzed by One-way ANOVA and groups that do not share a letter are significantly different (<span class="html-italic">p</span> &lt; 0.05).</p>
Full article ">Figure 4
<p>Relative interleukin-1β (<b>a</b>), interferon-α (<b>b</b>), interferon-γ (<b>c</b>), toll-like receptor 4 (<b>d</b>) and toll-like receptor 5 (<b>e</b>) mRNA expression in ileum of chickens fed basal diet under <span class="html-italic">Escherichia coli</span> LPS challenge, basal diet under isotonic saline challenge, diet supplemented with 0.05% β-glucan-, diet supplemented with 0.5% carotenoids-, diet supplemented with 0.5% oligosaccharides- and diet supplemented with 0.5% anthocyanins under <span class="html-italic">Escherichia coli</span> O55:B5 LPS challenge (<span class="html-italic">n</span> = 6/treatment). Error bars represent means ± standard errors of the mean. The effects were analyzed by One-way ANOVA and groups that do not share a letter are significantly different (<span class="html-italic">p</span> &lt; 0.05).</p>
Full article ">Figure 4 Cont.
<p>Relative interleukin-1β (<b>a</b>), interferon-α (<b>b</b>), interferon-γ (<b>c</b>), toll-like receptor 4 (<b>d</b>) and toll-like receptor 5 (<b>e</b>) mRNA expression in ileum of chickens fed basal diet under <span class="html-italic">Escherichia coli</span> LPS challenge, basal diet under isotonic saline challenge, diet supplemented with 0.05% β-glucan-, diet supplemented with 0.5% carotenoids-, diet supplemented with 0.5% oligosaccharides- and diet supplemented with 0.5% anthocyanins under <span class="html-italic">Escherichia coli</span> O55:B5 LPS challenge (<span class="html-italic">n</span> = 6/treatment). Error bars represent means ± standard errors of the mean. The effects were analyzed by One-way ANOVA and groups that do not share a letter are significantly different (<span class="html-italic">p</span> &lt; 0.05).</p>
Full article ">
17 pages, 1374 KiB  
Article
Influences of Immunocastration on Endocrine Parameters, Growth Performance and Carcass Quality, as Well as on Boar Taint and Penile Injuries
by Susanne Zoels, Simon Reiter, Mathias Ritzmann, Christine Weiß, Jasmin Numberger, Aneka Schütz, Peter Lindner, Volker Stefanski and Ulrike Weiler
Animals 2020, 10(2), 346; https://doi.org/10.3390/ani10020346 - 21 Feb 2020
Cited by 19 | Viewed by 3874
Abstract
Castration of male pigs without anesthesia is a significant welfare issue. Improvac®, a GnRH vaccine induces an endogenous immune response leading to a decrease in testicular steroids. Consequences of different vaccination schemes on testicular function and carcass quality were evaluated in [...] Read more.
Castration of male pigs without anesthesia is a significant welfare issue. Improvac®, a GnRH vaccine induces an endogenous immune response leading to a decrease in testicular steroids. Consequences of different vaccination schemes on testicular function and carcass quality were evaluated in immunocastrated boars (IC), surgical castrates (SC), and entire males (EM). Therefore, 128 male piglets were assigned to five treatment-groups and a long term follow-up group. IC groups received two vaccinations (V1, V2) with Improvac® at 8 and 12, 12 and 16, or 12 and 18 weeks. Testosterone-concentrations decreased significantly two weeks after V2 in feces and dropped in serum from V2 to slaughter (S) except IC-8/12 without differing significantly. GnRH-binding results indicated the highest values for IC-12/18 animals. While IC-12/16 and IC-12/18 animals showed boar taint compounds below the threshold levels, two IC-8/12 animals had concentrations above the threshold level. Feed-efficiency was higher in EM than in SC with IC in between. In IC compared to EM, a decreasing amount of polyunsaturated-fatty-acids was obvious and GnRH-vaccination reduced penile injuries. The examined vaccination protocols reduce penile injuries, improve feed efficiency and carcass quality, and reliably prevents boar taint, if manufacturer’s recommendations concerning vaccination schedules are applied. Therefore immunocastration offers a reliable, animal friendly alternative to surgical castration. Full article
(This article belongs to the Section Animal System and Management)
Show Figures

Figure 1

Figure 1
<p>Individual (-) and mean (- -) fecal testosterone concentrations (ng/g) of animals in the long term follow-up group IC-12/18X (<span class="html-italic">n</span> = 7) from 12th to 38th week of age; * indicate significant (<span class="html-italic">p</span> &lt; 0.05) differences compared to two weeks earlier; ** indicate significant difference to testosterone concentration compared to week 30.</p>
Full article ">Figure 2
<p>Testosterone levels (ng/mL) and absolute GnRH binding (%) in serum of animals slaughtered at batch 1 (∆), batch 2 (o), and batch 3 (□).</p>
Full article ">Figure 3
<p>Androstenone (ng/g) and skatole (ng/g) levels of animals slaughtered at batch 1 (∆), batch 2 (o), and batch 3 (□) with threshold levels for androstenone (1000 ng/g) and skatole (250 ng/g) of group EM, IC-8/12, IC-12/16, IC-12/18, and IC-12/18X.</p>
Full article ">
11 pages, 2381 KiB  
Article
Effect of Antimicrobial Peptide Microcin J25 on Growth Performance, Immune Regulation, and Intestinal Microbiota in Broiler Chickens Challenged with Escherichia coli and Salmonella
by Gang Wang, Qinglong Song, Shuo Huang, Yuming Wang, Shuang Cai, Haitao Yu, Xiuliang Ding, Xiangfang Zeng and Jiang Zhang
Animals 2020, 10(2), 345; https://doi.org/10.3390/ani10020345 - 21 Feb 2020
Cited by 68 | Viewed by 4745
Abstract
The purpose of this study was to investigate the effects of antimicrobial peptide microcin J25 (MccJ25) on growth performance, immune regulation, and intestinal microbiota in broilers. A total of 3120 one-day-old male Arbor Acres (AA) broilers were randomly allocated to five groups (12 [...] Read more.
The purpose of this study was to investigate the effects of antimicrobial peptide microcin J25 (MccJ25) on growth performance, immune regulation, and intestinal microbiota in broilers. A total of 3120 one-day-old male Arbor Acres (AA) broilers were randomly allocated to five groups (12 replicates, 52 chickens per replicate). The treatments were control, challenge (0 mg/kg MccJ25), different dosages of antimicrobial peptide (AMP) (0.5 and 1mg/kg MccJ25), and antibiotic groups (20 mg/kg colistin sulfate). The MccJ25 groups increased the body weight gain (starter and overall) that was reduced in the challenge group. The overall (day 1 to day 42) feed-to-gain ratio (G:F) was significantly decreased in AMP groups compared with the challenge group. Birds fed AMP had a decreased population of total anaerobic bacteria (day 21 and day 42) and E. coli (day 21 and day 42) in feces, as well as a lower Salmonella infection rate (day 21 and day 42) compared with birds in the challenge group. The villus height of the duodenum, jejunum, and ileum, as well as the villus height/crypt depth of the duodenum and jejunum were greater in AMP groups than birds in the challenge group. Moreover, MccJ25 linearly improved the villus height of the duodenum and jejunum. The addition of MccJ25 decreased the concentration of TNF-α, IL-1β, and IL-6 compared with challenge group. At d 21, MccJ25 linearly reduced the level of IL-6. In conclusion, dietary supplemented MccJ25 effectively improved performance, systematic inflammation, and improved fecal microbiota composition of the broilers. Full article
Show Figures

Figure 1

Figure 1
<p>Effects of MccJ25 on <span class="html-italic">Escherichia coli</span> (<span class="html-italic">E. Coli</span>), lactic acid bacteria (LAB), <span class="html-italic">Bifidobacterium</span> counts (log 10 cfu/g), and total aerobic bacteria in the feces, as well as the <span class="html-italic">Salmonella</span> infection rate in broilers on days 21 and 42. Bars represent means ± SEM for 12 broilers per treatment. Within the same day, bars with different letters differ significantly (<span class="html-italic">p</span> &lt; 0.05).</p>
Full article ">Figure 2
<p>Effect of MccJ25 on intestinal mucosal morphology of duodenum, jejunum, and ileum in broilers. Scale bars, 100 μm.</p>
Full article ">Figure 3
<p>Effects of MccJ25 on immunomodulatory factors concentration in the serum on day 21 and day 42. Bars represent means ± SEM for 12 broilers per treatment. Bars with different letters differ significantly (<span class="html-italic">p</span> &lt; 0.05).</p>
Full article ">
13 pages, 2182 KiB  
Article
RNA Sequencing (RNA-Seq) Based Transcriptome Analysis in Immune Response of Holstein Cattle to Killed Vaccine against Bovine Viral Diarrhea Virus Type I
by Bryan Irvine Lopez, Kier Gumangan Santiago, Donghui Lee, Seungmin Ha and Kangseok Seo
Animals 2020, 10(2), 344; https://doi.org/10.3390/ani10020344 - 21 Feb 2020
Cited by 15 | Viewed by 4723
Abstract
Immune response of 107 vaccinated Holstein cattle was initially obtained prior to the ELISA test. Five cattle with high and low bovine viral diarrhea virus (BVDV) type I antibody were identified as the final experimental animals. Blood samples from these animals were then [...] Read more.
Immune response of 107 vaccinated Holstein cattle was initially obtained prior to the ELISA test. Five cattle with high and low bovine viral diarrhea virus (BVDV) type I antibody were identified as the final experimental animals. Blood samples from these animals were then utilized to determine significant differentially expressed genes (DEGs) using the RNA-seq transcriptome analysis and enrichment analysis. Our analysis identified 261 DEGs in cattle identified as experimental animals. Functional enrichment analysis in gene ontology (GO) annotations and Kyoto Encyclopedia of Genes and Genomes (KEGG) pathways revealed the DEGs potentially induced by the inactivated BVDV type I vaccine, and might be responsible for the host immune responses. Our findings suggested that inactivated vaccine induced upregulation of genes involved in different GO annotations, including antigen processing and presentation of peptide antigen (via MHC class I), immune response, and positive regulation of interferon-gamma production. The observed downregulation of other genes involved in immune response might be due to inhibition of toll-like receptors (TLRs) by the upregulation of the Bcl-3 gene. Meanwhile, the result of KEGG pathways revealed that the majority of DEGs were upregulated and enriched to different pathways, including cytokine-cytokine receptor interaction, platelet activation, extracellular matrix (ECM) receptor interaction, hematopoietic cell lineage, and ATP-binding cassette (ABC) transporters. These significant pathways supported our initial findings and are known to play a vital role in shaping adaptive immunity against BVDV type 1. In addition, type 1 diabetes mellitus pathways tended to be significantly enriched. Thus, further studies are needed to investigate the prevalence of type 1 diabetes mellitus in cattle vaccinated with inactivated and live BVDV vaccine. Full article
(This article belongs to the Special Issue Genetics of Animal Health and Disease in Livestock)
Show Figures

Figure 1

Figure 1
<p>Sample to positive (S/P) ratio of cattle groups identified as high (<span class="html-italic">n</span> = 5), low (<span class="html-italic">n</span> = 5) and average (<span class="html-italic">n</span> = 107) bovine viral diarrhea virus (BVDV) type I antibody level at different time points. The error bars indicate standard error.</p>
Full article ">Figure 2
<p>Density plot of normalized data using Relative Log Expression (RLE) normalization method based on read count and log2.</p>
Full article ">Figure 3
<p>Number of up- and down-regulated genes after comparison of normalized values using the DESeq2 package.</p>
Full article ">Figure 4
<p>Gene ontology (GO) enrichment analysis of differentially expressed genes (DEGs) in vaccinated cattle, selected based on BVDV type I antibody level (<b>a</b>) GOTERM_Biological Process, (<b>b</b>) GOTERM_Cellular Component, and (<b>c</b>) GOTERM_Molecular Function. GO terms are located on the y-axis and terms with (*) (**) (***) means significant enrichment with a <span class="html-italic">p</span>-value of &lt;0.05, 0.01, and 0.001, respectively.</p>
Full article ">
11 pages, 1003 KiB  
Article
Effect of Accumulation of Heavy Metals in the Red Fox Intestine on the Prevalence of Its Intestinal Parasites
by Marie Borkovcova, Vladimir Fiser, Martina Bednarova, Zdenek Havlicek, Anna Adámková, Jiri Mlcek, Tunde Jurikova, Stefan Balla and Martin Adámek
Animals 2020, 10(2), 343; https://doi.org/10.3390/ani10020343 - 21 Feb 2020
Cited by 5 | Viewed by 3720
Abstract
The aim of this study was (i) to compare levels of accumulated heavy metals in the fox intestines with and without parasites. Moreover, our research also dealt with (ii) examination of the relationship between heavy metal content in fox intestines and between the [...] Read more.
The aim of this study was (i) to compare levels of accumulated heavy metals in the fox intestines with and without parasites. Moreover, our research also dealt with (ii) examination of the relationship between heavy metal content in fox intestines and between the presence of fox intestinal parasites. The intestines of 34 hunter-killed foxes were dissected to detect the occurrence of parasites. In 15 intestinal samples, parasitic intestinal helminths were found. Heavy metal content in small intestine tissue and in parasites was determined using atomic absorption spectrometry (AAS). The prevalence of parasites was significantly dependent on Cd content in the host’s small intestine (p < 0.01). To conclude, the authors suggest that parasites are sensitive to Cd levels; their prevalence in the intestines of the fox host decreases to zero with increasing Cd content. Full article
(This article belongs to the Section Wildlife)
Show Figures

Figure 1

Figure 1
<p>Association between prevalence of parasites and Cd content in fox intestines.</p>
Full article ">Figure 2
<p>Comparison of Cd concentrations in parasite tissues with Cd concentrations in intestines of the host.</p>
Full article ">Figure 3
<p>Prevalence of parasites and content of Cd in intestines of the host.</p>
Full article ">
28 pages, 2404 KiB  
Article
Effects of a Dietary L-Carnitine Supplementation on Performance, Energy Metabolism and Recovery from Calving in Dairy Cows
by Jennifer Meyer, Susanne Ursula Daniels, Sandra Grindler, Johanna Tröscher-Mußotter, Mohamadtaher Alaedin, Jana Frahm, Liane Hüther, Jeannette Kluess, Susanne Kersten, Dirk von Soosten, Ulrich Meyer, Erika Most, Klaus Eder, Helga Sauerwein, Jana Seifert, Korinna Huber, Jürgen Rehage and Sven Dänicke
Animals 2020, 10(2), 342; https://doi.org/10.3390/ani10020342 - 21 Feb 2020
Cited by 21 | Viewed by 5260
Abstract
Dairy cows are metabolically challenged during the transition period. Furthermore, the process of parturition represents an energy-consuming process. The degree of negative energy balance and recovery from calving also depends on the efficiency of mitochondrial energy generation. At this point, L-carnitine plays an [...] Read more.
Dairy cows are metabolically challenged during the transition period. Furthermore, the process of parturition represents an energy-consuming process. The degree of negative energy balance and recovery from calving also depends on the efficiency of mitochondrial energy generation. At this point, L-carnitine plays an important role for the transfer of fatty acids to the site of their mitochondrial utilisation. A control (n = 30) and an L-carnitine group (n = 29, 25 g rumen-protected L-carnitine per cow and day) were created and blood samples were taken from day 42 ante partum (ap) until day 110 post-partum (pp) to clarify the impact of L-carnitine supplementation on dairy cows, especially during the transition period and early puerperium. Blood and clinical parameters were recorded in high resolution from 0.5 h to 72 h pp. L-carnitine-supplemented cows had higher amounts of milk fat in early lactation and higher triacylglyceride concentrations in plasma ap, indicating increased efficiency of fat oxidation. However, neither recovery from calving nor energy balance and lipomobilisation were influenced by L-carnitine. Full article
(This article belongs to the Section Animal Nutrition)
Show Figures

Figure 1

Figure 1
<p>(<b>a</b>) Dry matter intake, (<b>b</b>) concentrate intake, (<b>c</b>) milk yield and (<b>d</b>) energy-corrected milk (ECM) of cows fed a non-supplemented (control, CON) or an L-carnitine-supplemented diet (25 g/d from 6 weeks <span class="html-italic">ap</span> up to week 15 <span class="html-italic">pp</span>, CAR). (<b>e</b>) Data statistics. Data are given as Least Square (LS)-Means. <sup>1</sup> pooled standard error.</p>
Full article ">Figure 1 Cont.
<p>(<b>a</b>) Dry matter intake, (<b>b</b>) concentrate intake, (<b>c</b>) milk yield and (<b>d</b>) energy-corrected milk (ECM) of cows fed a non-supplemented (control, CON) or an L-carnitine-supplemented diet (25 g/d from 6 weeks <span class="html-italic">ap</span> up to week 15 <span class="html-italic">pp</span>, CAR). (<b>e</b>) Data statistics. Data are given as Least Square (LS)-Means. <sup>1</sup> pooled standard error.</p>
Full article ">Figure 2
<p>(<b>a</b>) Milk fat and protein and (<b>b</b>) fat-protein ratio in milk of cows fed a non-supplemented (CON) or an L-carnitine-supplemented diet (25 g/d from 6 weeks <span class="html-italic">ap</span> up to week 15 <span class="html-italic">pp</span>, CAR). (<b>c</b>) Data statistics. Data are given as LS-means. <sup>1</sup> pooled standard error.</p>
Full article ">Figure 3
<p>(<b>a</b>) Net energy balance (NEB), (<b>b</b>) total NEL intake of cows fed a non-supplemented (CON) or an L-carnitine-supplemented diet (25 g/d from 6 weeks <span class="html-italic">ap</span> up to week 15 <span class="html-italic">pp</span>, CAR), (<b>c</b>) regression of energy release from adipose tissue in dependence on net energy balance in the first six weeks of lactation. (<span class="html-italic">y<sub>CON</sub></span> = −0.15 <span class="html-italic"><sup>p</sup></span> <sup>&gt; 0.05</sup><span class="html-italic">x</span> + 16.25, <span class="html-italic">r</span><sup>2</sup> = 0.041; <span class="html-italic">y<sub>CAR</sub></span> = −0.40 <span class="html-italic"><sup>p</sup></span> <sup>&lt; 0.05</sup><span class="html-italic">x</span> + 8.00, <span class="html-italic">r</span><sup>2</sup> = 0.229; slopes were not significantly different (<span class="html-italic">p</span> &gt; 0.05)), (<b>d</b>) and regression of net energy balance in dependence on residual energy intake from the first week until week 15 of lactation (<span class="html-italic">y<sub>CON</sub></span> = 0.82 <span class="html-italic"><sup>p</sup></span> <sup>&lt; 0.05</sup><span class="html-italic">x</span> − 12.88, <span class="html-italic">r</span><sup>2</sup> = 0.549; <span class="html-italic">y<sub>CAR</sub></span> = 0.89 <sup><span class="html-italic">p</span> &lt; 0.05</sup><span class="html-italic">x</span> − 15.67, <span class="html-italic">r</span><sup>2</sup> = 0.548); the slopes between CON and CAR were not significantly different (<span class="html-italic">p</span> &gt; 0.05). (<b>e</b>) Data statistics. Data are given as LS-means in (a) and (b), <sup>1</sup> pooled standard error.</p>
Full article ">Figure 4
<p>(<b>a</b>) Respiratory rate, (<b>b</b>) heart rate, (<b>c</b>) primary rumen contractions and (<b>d</b>) rectal temperature of cows fed a non-supplemented (CON) or an L-carnitine-supplemented diet (25 g/d from 6 weeks <span class="html-italic">ap</span> up to week 15 <span class="html-italic">pp</span>, CAR). Data are given as LS-means. (<b>e</b>) Data statistics. <sup>1</sup> pooled standard error.</p>
Full article ">Figure 5
<p>(<b>a</b>) Percentages of different categories (posture and behaviour, digestive system, respiratory system, circulatory system and rectal temperature) of cumulative score from maximum reachable score (29 points/100%) of cows fed a non-supplemented (CON) or an L-carnitine-supplemented diet (25 g/d from 6 weeks <span class="html-italic">ap</span> up to week 15 <span class="html-italic">pp</span>, CAR). (<b>b</b>) Data statistics. <sup>1</sup> pooled standard error.</p>
Full article ">Figure 5 Cont.
<p>(<b>a</b>) Percentages of different categories (posture and behaviour, digestive system, respiratory system, circulatory system and rectal temperature) of cumulative score from maximum reachable score (29 points/100%) of cows fed a non-supplemented (CON) or an L-carnitine-supplemented diet (25 g/d from 6 weeks <span class="html-italic">ap</span> up to week 15 <span class="html-italic">pp</span>, CAR). (<b>b</b>) Data statistics. <sup>1</sup> pooled standard error.</p>
Full article ">Figure 6
<p>Concentrations of (<b>a</b>) N<sup>ε</sup>-trimethyllysine (TML), (<b>b</b>) y-butyrobetaine (yBB), (<b>c</b>) acetylcarnitine and (<b>d</b>) L-carnitine in plasma of cows fed a non-supplemented (CON) or an L-carnitine-supplemented diet (25 g/d from 6 weeks <span class="html-italic">ap</span> up to week 15 <span class="html-italic">pp</span>, CAR). (<b>e</b>) Data statistics. Data are given as LS-means. <sup>1</sup> pooled standard error.</p>
Full article ">Figure 6 Cont.
<p>Concentrations of (<b>a</b>) N<sup>ε</sup>-trimethyllysine (TML), (<b>b</b>) y-butyrobetaine (yBB), (<b>c</b>) acetylcarnitine and (<b>d</b>) L-carnitine in plasma of cows fed a non-supplemented (CON) or an L-carnitine-supplemented diet (25 g/d from 6 weeks <span class="html-italic">ap</span> up to week 15 <span class="html-italic">pp</span>, CAR). (<b>e</b>) Data statistics. Data are given as LS-means. <sup>1</sup> pooled standard error.</p>
Full article ">Figure 7
<p>Serum concentrations of (<b>a</b>) non-esterified fatty acids (NEFA), (<b>b</b>) ß-hydroxybutyrate (BHB) and (<b>c</b>) triacylglycerides of cows fed a non-supplemented (CON) or an L-carnitine-supplemented diet (25 g/d from 6 weeks <span class="html-italic">ap</span> up to week 15 <span class="html-italic">pp</span>, CAR). (<b>d</b>) Data statistics. Data are given as LS-means. * symbol indicates significant differences between groups in a particular week according to the Tukey–Kramer test (<span class="html-italic">p</span> ≤ 0.05). <sup>1</sup> pooled standard error.</p>
Full article ">Figure 8
<p>Changes in the (<b>a</b>) subcutaneous (SAT), (<b>b</b>) retroperitoneal (RAT), (<b>c</b>) omental (OAT), (<b>d</b>) mesenteric (MAT), (<b>e</b>) abdominal (AAT) adipose tissue masses and changes in masses of (f) SAT, RAT, OAT and MAT in sum of cows fed a non-supplemented (CON) or an L-carnitine-supplemented diet (25 g/d from 6 weeks <span class="html-italic">ap</span> up to week 15 <span class="html-italic">pp</span>, CAR), while positive values indicate a reduction and negative values indicate a gain of particular masses. (<b>g</b>) Data statistics. Period 1 = day 42 <span class="html-italic">ap</span> until day 3 <span class="html-italic">pp</span>, period 2 = day 3 <span class="html-italic">pp</span> until day 42 <span class="html-italic">pp</span>, period 3 = day 42 <span class="html-italic">pp</span> until day 100 <span class="html-italic">pp</span>. Data are given as LS-means ± standard error. <sup>1</sup> pooled standard error.</p>
Full article ">Figure 8 Cont.
<p>Changes in the (<b>a</b>) subcutaneous (SAT), (<b>b</b>) retroperitoneal (RAT), (<b>c</b>) omental (OAT), (<b>d</b>) mesenteric (MAT), (<b>e</b>) abdominal (AAT) adipose tissue masses and changes in masses of (f) SAT, RAT, OAT and MAT in sum of cows fed a non-supplemented (CON) or an L-carnitine-supplemented diet (25 g/d from 6 weeks <span class="html-italic">ap</span> up to week 15 <span class="html-italic">pp</span>, CAR), while positive values indicate a reduction and negative values indicate a gain of particular masses. (<b>g</b>) Data statistics. Period 1 = day 42 <span class="html-italic">ap</span> until day 3 <span class="html-italic">pp</span>, period 2 = day 3 <span class="html-italic">pp</span> until day 42 <span class="html-italic">pp</span>, period 3 = day 42 <span class="html-italic">pp</span> until day 100 <span class="html-italic">pp</span>. Data are given as LS-means ± standard error. <sup>1</sup> pooled standard error.</p>
Full article ">
8 pages, 226 KiB  
Article
Transplacental Transmission of Theileria equi Is Not a Common Cause of Abortions and Infection of Foals in Israel
by Sharon Tirosh-Levy, Yuval Gottlieb, Lea Mimoun, Monica L. Mazuz and Amir Steinman
Animals 2020, 10(2), 341; https://doi.org/10.3390/ani10020341 - 21 Feb 2020
Cited by 10 | Viewed by 2572
Abstract
Although the main route of transmission of Theileria equi is through tick feeding, transplacental transmission is also possible and may lead to abortion, or to the birth of a sick or carrier foal. The aim of this study was to evaluate the role [...] Read more.
Although the main route of transmission of Theileria equi is through tick feeding, transplacental transmission is also possible and may lead to abortion, or to the birth of a sick or carrier foal. The aim of this study was to evaluate the role of T. equi as a cause of abortions in Israel and the risk of foals being infected at a young age. Eight aborting mares were serologically evaluated for exposure to T. equi via the immunofluorescence antibody test (IFAT) and their aborted fetuses were evaluated using PCR and qPCR. In addition, five mares and their foals (aged 4–6 months) from a highly endemic farm were tested for T. equi infection using IFAT, PCR and qPCR. Five of the eight aborting mares were seropositive for T. equi; however, none of the aborted fetuses was infected. All five mares from the endemic farm were subclinically infected with T. equi. Of their five foals, one was infected, with relatively high parasitemia and different parasite genotype than its dam’s, suggesting another source of infection. The results of this study suggest that transplacental transmission of T. equi is not common and does not appear to be a prominent cause of abortion in chronically infected mares. Full article
(This article belongs to the Special Issue Equine Parasitology)
11 pages, 2176 KiB  
Article
Distribution of Superficial Body Temperature in Horses Ridden by Two Riders with Varied Body Weights
by Izabela Wilk, Elżbieta Wnuk-Pawlak, Iwona Janczarek, Beata Kaczmarek, Marta Dybczyńska and Monika Przetacznik
Animals 2020, 10(2), 340; https://doi.org/10.3390/ani10020340 - 21 Feb 2020
Cited by 19 | Viewed by 5017
Abstract
It was assumed that a horse with its rider body weight found in the upper limit may negatively impact the horse’s welfare. The objective of this paper was to analyze the differences in body temperature and selected heart rate parameters in horses in [...] Read more.
It was assumed that a horse with its rider body weight found in the upper limit may negatively impact the horse’s welfare. The objective of this paper was to analyze the differences in body temperature and selected heart rate parameters in horses in response to physical exercise accompanied by various rider’s body weight loads. The study was carried out on 12 leisure, 10–15-year-old warmblood geldings. The horses were ridden by two equally qualified riders whose body weights were about 20% and 10% of the average body weight (BW) of the animals (about 470 kg). Each rider rode each of the 12 horses for 13 min walking and 20 min of trotting. Images of the horse at rest, after physical exercise directly after unsaddling, and during the recovery phase (10 min after unsaddling) were taken with an infrared thermography camera. For analysis, the temperatures of selected body parts were measured on the surface of the head, neck, front, middle, and back (croup) parts of the trunk, forelimb, and hind limb. Immediately after the infrared thermography images were taken, the rectal temperature of the horse was measured. The heart rate parameters were measured at rest for 10 min directly before, during, and 10 min following the end of a training session. A multivariate analysis of variance (ANOVA) for repeated measurements was performed. Statistical significance was accepted for p < 0.05. A rider BW load on a horse of approximately 20% of the horse’s BW led to a substantial increase in the superficial temperatures of the neck, front, middle, and back parts of the trunk in relation to these body parts’ average temperatures when the load was about 10% BW. The head and limb average temperatures were not significantly affected by the load of the exercised horse. A horse’s load above 20% of his body weight, even with little effort, affects changes in surface temperature and the activity of the autonomic nervous system. Full article
(This article belongs to the Section Equids)
Show Figures

Figure 1

Figure 1
<p>The seven areas of the body that were thermal imaged on 12 different horses: 1—head, 2—neck, 3—front of trunk, 4—middle part of trunk, 5—back of trunk, 6—foreleg, 7—hind leg.</p>
Full article ">Figure 2
<p>Average temperature (°C) of the surface on the investigated body parts of the horse recorded during subsequent stages of the trial. The means denoted with different letters differ significantly at <span class="html-italic">p</span> ≤ 0.05.</p>
Full article ">
16 pages, 426 KiB  
Article
Short-Term Effect of the Inclusion of Silage Artichoke By-Products in Diets of Dairy Goats on Milk Quality
by Paula Monllor, Gema Romero, Esther Sendra, Alberto Stanislao Atzori and José Ramón Díaz
Animals 2020, 10(2), 339; https://doi.org/10.3390/ani10020339 - 21 Feb 2020
Cited by 14 | Viewed by 3014
Abstract
Artichoke by-products represent a high amount of waste whose removal entails several costs. Moreover, feed is the main cost in a farm. So, including these by-products in ruminant diets would lower feed costs. Two experiments were conducted to evaluate the effect of two [...] Read more.
Artichoke by-products represent a high amount of waste whose removal entails several costs. Moreover, feed is the main cost in a farm. So, including these by-products in ruminant diets would lower feed costs. Two experiments were conducted to evaluate the effect of two levels of inclusion, 12.5% and 25.0%, of two silages of artichoke by-products (artichoke bracts, AB and artichoke plant, AP) in the diet of goats on the milk yield, composition and quality and on the metabolic profile of the animals. AB presented the lowest blood urea content and there were no differences in milk yield in the two experiments. However, with 25.0% of silage by-product in the diet, a higher fat content was observed in AB and of protein in AP, as well as this treatment showing a slightly higher Se content. Regarding the milk lipid profile, milk from 12.5% of AP treatment presented a higher PUFA content. In conclusion, the use of silage artichoke by-products in dairy goat diets does not jeopardise milk yield and quality and health status of animals and, from a nutritional point of view for human health, a slightly better mineral and lipid profile is observed in milk from AP treatments. Full article
(This article belongs to the Section Small Ruminants)
Show Figures

Figure 1

Figure 1
<p>Changes in milk yield (<b>a</b>), fat corrected milk (<b>b</b>) and average body weight (<b>c</b>) due to diet throughout the lactation in experiments 1 and 2.</p>
Full article ">
15 pages, 2307 KiB  
Article
Comparative Transcriptomics Analysis of Testicular miRNA from Cryptorchid and Normal Horses
by Haoyuan Han, Qiuming Chen, Yuan Gao, Jun Li, Wantao Li, Ruihua Dang and Chuzhao Lei
Animals 2020, 10(2), 338; https://doi.org/10.3390/ani10020338 - 21 Feb 2020
Cited by 5 | Viewed by 2818
Abstract
In the biological process of testicular spermatogenesis, the expression and interaction of many genes are regulated by microRNAs (miRNAs). However, comparisons of miRNA expression between descended testes (DTs) and undescended testes (UDTs) are rarely done in horses. In this study, we selected two [...] Read more.
In the biological process of testicular spermatogenesis, the expression and interaction of many genes are regulated by microRNAs (miRNAs). However, comparisons of miRNA expression between descended testes (DTs) and undescended testes (UDTs) are rarely done in horses. In this study, we selected two UDTs (CKY2b and GU4b) from Chakouyi (CKY) and Guanzhong (GU) horses and eight DTs (GU1–3, CKY1, CKY3, CKY2a, GU4a, and GU5). Three groups were compared to evaluate expression patterns of testicular miRNA in stallion testes. Group 1 compared normal CKY horses and GU horses (CKY1 and CKY3 vs. GU1–3). Group 2 (CKY2a and GU4a (DTs) vs. CKY2b and GU4b (UDTs)) and group 3 (GU1–3, CKY1, CKY3 (DTs) vs. CKY2b and GU4b (UDTs)) compared the expression levels in unilateral retained testes to normal testes. The results show that 42 miRNAs (7 upregulated and 35 downregulated) had significantly different expression levels in both comparisons. The expression levels of eca-miR-545, eca-miR-9084, eca-miR-449a, eca-miR-9024, eca-miR-9121, eca-miR-8908e, eca-miR-136, eca-miR-329b, eca-miR-370, and eca-miR-181b were further confirmed by quantitative real-time PCR assay. The target genes of differentially expressed miRNAs in three comparisons were predicted, and the functions were annotated. The putative target genes of the 42 co-differentially expressed miRNAs were annotated to 15 functional terms, including metal ion binding, GTPase activator activity, zinc ion binding, intracellular, cytoplasm, and cancer pathways, and osteoclast differentiation. Our data indicate that the differentially expressed miRNAs in undescended testis suggests a potential role in male fertility and a relationship with cryptorchidism in horses. The discovery of miRNAs in stallion testes might contribute to a new direction in the search for biomarkers of stallion fertility. Full article
(This article belongs to the Section Animal Genetics and Genomics)
Show Figures

Figure 1

Figure 1
<p>Testes of GU4 horse: (<b>A</b>) normal testis, (<b>B</b>) undescended testis.</p>
Full article ">Figure 2
<p>Length distribution of small RNA in equine testes: (<b>A</b>) in 10 testicular samples, (<b>B</b>) in normal testes, and (<b>C</b>) in undescended testes.</p>
Full article ">Figure 3
<p>Principal component analysis (PCA) of horse testicular tissues. Colored dots represent different samples; CKY represents CKY1 and CKY3; GU represents GU1, GU2, GU3, and GU5; colored circles represent four groups clustered by PCA.</p>
Full article ">Figure 4
<p>Top 30 microRNAs expressed in Chakouyi and Guanzhong horses.</p>
Full article ">Figure 5
<p>Volcano plot displaying differentially expressed microRNAs of testicular tissue between Chakouyi and Guanzhong horses. Red dots: upregulated; green dots: downregulated.</p>
Full article ">Figure 6
<p>Top 30 microRNAs expressed in GU4a, GU4b, CKY2a, and CKY2b.</p>
Full article ">Figure 7
<p>(<b>A</b>) Volcano plot displaying differentially expressed microRNAs of testicular tissue between GU4a and CKY2a compared with GU4b and CKY2b. Red dots: upregulated; green dots: downregulated. (<b>B</b>) Distribution of Gene Ontology (GO) assigned to differentially expressed microRNAs of horse testicular tissues between GU4a and CKY2a compared with GU4b and CKY2b. (<b>C</b>) Kyoto Encyclopedia of Genes and Genomes (KEGG) categories assigned to differentially expressed microRNAs of horse testicular tissues between GU4a and CKY2a compared with GU4b and CKY2b.</p>
Full article ">Figure 8
<p>Top 30 microRNAs expressed in GU1–3, CKY1, CKY3, CKY2b, and GU4b.</p>
Full article ">Figure 9
<p><b>(</b><b>A</b>) Volcano plot displaying differentially expressed microRNAs of testicular tissue between GU1–3, CKY1, and CKY3 compared with CKY2b and GU4b. Red dots: upregulated; green dots: downregulated. (<b>B</b>) Distribution of GO assigned to differentially expressed microRNAs of horse testicular tissues between GU1–3, CKY1, and CKY3 compared with CKY2b and GU4b. (<b>C</b>) KEGG categories assigned to differentially expressed microRNAs of horse testicular tissues between GU1–3, CKY1, and CKY3 compared with CKY2b and GU4b.</p>
Full article ">Figure 10
<p>Correlations of miRNA expression levels of 10 differentially expressed miRNAs in equine testicular tissues (group 2) using RNA-Seq and qRT-PCR; the x- and y-axis show log2 (ratio of miRNA levels) measured by RNA-seq and qRT-PCR, respectively.</p>
Full article ">Figure 11
<p>Venn map of microRNAs distributed in three groups. 1: Differentially expressed microRNAs between Guanzhong and Chakouyi horses; 2: differentially expressed microRNAs between GU4a and CKY2a compared with GU4b and CKY2b; 3: differentially expressed microRNAs between GU1–3, CKY1, and CKY3 compared with CKY2b and GU4b.</p>
Full article ">Figure 12
<p>Distribution of (<b>A</b>) GO and (<b>B</b>) KEGG categories assigned to differentially expressed microRNAs of groups 2 and 3.</p>
Full article ">
Previous Issue
Next Issue
Back to TopTop