[go: up one dir, main page]

Next Issue
Volume 13, May-1
Previous Issue
Volume 13, April-1


Diagnostics, Volume 13, Issue 8 (April-2 2023) – 145 articles

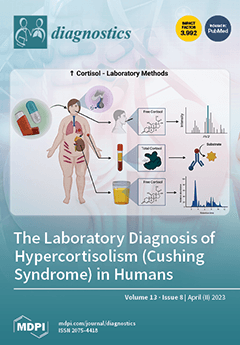
Cover Story (view full-size image): The biochemical confirmation of hypercortisolism is complicated by the overlap with non-autonomous conditions and the practical difficulties of cortisol measurement. This limited narrative review focuses on the laboratory confirmation of hypercortisolism in patients with Cushing syndrome. Although analytically less specific, immunoassays remain cheap, quick, and mostly reliable. Cortisol metabolism however affects patient preparation, specimen selection (e.g., consideration of free cortisol, or late-night specimens and cessation of drugs), and method selection (e.g., mass spectrometry if abnormal metabolites are present). Urine steroid profiles and salivary cortisone may have a role in future guidelines as technology and costs improve. View this paper
  • Issues are regarded as officially published after their release is announced to the table of contents alert mailing list.
  • You may sign up for e-mail alerts to receive table of contents of newly released issues.
  • PDF is the official format for papers published in both, html and pdf forms. To view the papers in pdf format, click on the "PDF Full-text" link, and use the free Adobe Reader to open them.
Order results
Result details
Section
Select all
Export citation of selected articles as:
14 pages, 1952 KiB  
Article
A Semi-Supervised Graph Convolutional Network for Early Prediction of Motor Abnormalities in Very Preterm Infants
by Hailong Li, Zhiyuan Li, Kevin Du, Yu Zhu, Nehal A. Parikh and Lili He
Diagnostics 2023, 13(8), 1508; https://doi.org/10.3390/diagnostics13081508 - 21 Apr 2023
Cited by 2 | Viewed by 1477
Abstract
Approximately 32–42% of very preterm infants develop minor motor abnormalities. Earlier diagnosis soon after birth is urgently needed because the first two years of life represent a critical window of opportunity for early neuroplasticity in infants. In this study, we developed a semi-supervised [...] Read more.
Approximately 32–42% of very preterm infants develop minor motor abnormalities. Earlier diagnosis soon after birth is urgently needed because the first two years of life represent a critical window of opportunity for early neuroplasticity in infants. In this study, we developed a semi-supervised graph convolutional network (GCN) model that is able to simultaneously learn the neuroimaging features of subjects and consider the pairwise similarity between them. The semi-supervised GCN model also allows us to combine labeled data with additional unlabeled data to facilitate model training. We conducted our experiments on a multisite regional cohort of 224 preterm infants (119 labeled subjects and 105 unlabeled subjects) who were born at 32 weeks or earlier from the Cincinnati Infant Neurodevelopment Early Prediction Study. A weighted loss function was applied to mitigate the impact of an imbalanced positive:negative (~1:2) subject ratio in our cohort. With only labeled data, our GCN model achieved an accuracy of 66.4% and an AUC of 0.67 in the early prediction of motor abnormalities, outperforming prior supervised learning models. By taking advantage of additional unlabeled data, the GCN model had significantly better accuracy (68.0%, p = 0.016) and a higher AUC (0.69, p = 0.029). This pilot work suggests that the semi-supervised GCN model can be utilized to aid early prediction of neurodevelopmental deficits in preterm infants. Full article
(This article belongs to the Special Issue Artificial Intelligence for Magnetic Resonance Imaging)
Show Figures

Figure 1

Figure 1
<p>The proposed semi-supervised learning framework to predict motor impairment at 2 years corrected age using brain structural connectomes derived from DTI data acquired at term in very preterm infants. Given both labeled (blue and red) and unlabeled (gray) subjects ready for model learning, our task was to classify new subjects (yellow) into one of the label groups. (<b>A</b>) We constructed an <span class="html-italic">initial cohort graph</span>, including labeled subjects (positive (P) and negative (N)), unlabeled (U) subjects, and to-be-predicted new subjects. The semi-supervised GCN model learned the <span class="html-italic">initial cohort graph</span> and assigned labels (i.e., positive for high risk and negative for low risk of developing motor impairment) to new subjects in the <span class="html-italic">learned cohort graph</span>. (<b>B</b>) We used diffusion tensor imaging (DTI)-derived brain structural connectomes as node features and (<b>C</b>) the similarity between brain connectomes as edge weights between nodes.</p>
Full article ">Figure 2
<p>Edge weights between two nodes are dependent on the Euclidean distance between the brain connectomes of two nodes. Various coefficients <math display="inline"><semantics> <mi>σ</mi> </semantics></math> (i.e., sigma values) determine the edge weight distribution.</p>
Full article ">Figure 3
<p>Architecture of the semi-supervised graph convolutional network (GCN) model. The model learns the whole cohort graph and outputs labels for individual nodes/subjects. Our GCN model consists of L hidden graph learning blocks and a final output block with a SoftMax layer for classifying graph nodes. Labeled samples are marked blue and red, Unlabeled samples are marked gray. New samples are marked yellow. P: positive, N: negative, U: unlabeled.</p>
Full article ">Figure 4
<p>The model performance of the graph convolutional network model using (<b>A</b>) various edge weight coefficients for <span class="html-italic">initial cohort graph</span> construction and (<b>B</b>) different numbers of graph convolutional filters in individual layers.</p>
Full article ">Figure 5
<p>The model performance of the graph convolutional network model using different numbers of graph convolutional layers. The x-axis represents the number of graph convolutional layers, while the y-axis indicates the model performance. (<b>A</b>) Accuracy. (<b>B</b>) Balanced accuracy (BA). (<b>C</b>) Sensitivity. (<b>D</b>) Specificity. (<b>E</b>) Area under the receiver operating characteristic curve (AUC).</p>
Full article ">Figure 6
<p>The model performance comparison of the graph convolutional network model using cross-entropy and weighted cross-entropy loss functions.</p>
Full article ">
14 pages, 598 KiB  
Review
Video Capsule Endoscopy Plays an Important Role in the Management of Crohn’s Disease
by Asaf Levartovsky and Rami Eliakim
Diagnostics 2023, 13(8), 1507; https://doi.org/10.3390/diagnostics13081507 - 21 Apr 2023
Cited by 6 | Viewed by 1947
Abstract
Crohn’s disease (CD) is a chronic inflammatory disorder characterized by a transmural inflammation that may involve any part of the gastrointestinal tract. An evaluation of small bowel involvement, allowing recognition of disease extent and severity, is important for disease management. Current guidelines recommend [...] Read more.
Crohn’s disease (CD) is a chronic inflammatory disorder characterized by a transmural inflammation that may involve any part of the gastrointestinal tract. An evaluation of small bowel involvement, allowing recognition of disease extent and severity, is important for disease management. Current guidelines recommend the use of capsule endoscopy (CE) as a first-line diagnosis method for suspected small bowel CD. CE has an essential role in monitoring disease activity in established CD patients, as it can assess response to treatment and identify high-risk patients for disease exacerbation and post-operative relapse. Moreover, several studies have shown that CE is the best tool to assess mucosal healing as part of the treat-to-target strategy in CD patients. The PillCam Crohn’s capsule is a novel pan-enteric capsule which enables visualization of the whole gastrointestinal tract. It is useful to monitor pan-enteric disease activity, mucosal healing and accordingly allows for the prediction of relapse and response using a single procedure. In addition, the integration of artificial intelligence algorithms has showed improved accuracy rates for automatic ulcer detection and the ability to shorten reading times. In this review, we summarize the main indications and virtue for using CE for the evaluation of CD, as well as its implementation in clinical practice. Full article
(This article belongs to the Special Issue IBD: New Trends in Diagnosis and Management)
Show Figures

Figure 1

Figure 1
<p>The PillCam Crohn’s capsule.</p>
Full article ">
21 pages, 2183 KiB  
Article
Polycystic Ovary Syndrome Detection Machine Learning Model Based on Optimized Feature Selection and Explainable Artificial Intelligence
by Hela Elmannai, Nora El-Rashidy, Ibrahim Mashal, Manal Abdullah Alohali, Sara Farag, Shaker El-Sappagh and Hager Saleh
Diagnostics 2023, 13(8), 1506; https://doi.org/10.3390/diagnostics13081506 - 21 Apr 2023
Cited by 18 | Viewed by 4602
Abstract
Polycystic ovary syndrome (PCOS) has been classified as a severe health problem common among women globally. Early detection and treatment of PCOS reduce the possibility of long-term complications, such as increasing the chances of developing type 2 diabetes and gestational diabetes. Therefore, effective [...] Read more.
Polycystic ovary syndrome (PCOS) has been classified as a severe health problem common among women globally. Early detection and treatment of PCOS reduce the possibility of long-term complications, such as increasing the chances of developing type 2 diabetes and gestational diabetes. Therefore, effective and early PCOS diagnosis will help the healthcare systems to reduce the disease’s problems and complications. Machine learning (ML) and ensemble learning have recently shown promising results in medical diagnostics. The main goal of our research is to provide model explanations to ensure efficiency, effectiveness, and trust in the developed model through local and global explanations. Feature selection methods with different types of ML models (logistic regression (LR), random forest (RF), decision tree (DT), naive Bayes (NB), support vector machine (SVM), k-nearest neighbor (KNN), xgboost, and Adaboost algorithm to get optimal feature selection and best model. Stacking ML models that combine the best base ML models with meta-learner are proposed to improve performance. Bayesian optimization is used to optimize ML models. Combining SMOTE (Synthetic Minority Oversampling Techniques) and ENN (Edited Nearest Neighbour) solves the class imbalance. The experimental results were made using a benchmark PCOS dataset with two ratios splitting 70:30 and 80:20. The result showed that the Stacking ML with REF feature selection recorded the highest accuracy at 100 compared to other models. Full article
Show Figures

Figure 1

Figure 1
<p>The phases of prediction PCOS.</p>
Full article ">Figure 2
<p>The different types of feature selection methods.</p>
Full article ">Figure 3
<p>Scores of selected features by mutual_info.</p>
Full article ">Figure 4
<p>Sores of selected features by based tree.</p>
Full article ">Figure 5
<p>Ranking of the selected features by RFE.</p>
Full article ">Figure 6
<p>ROC curves of splitting 80:20.</p>
Full article ">Figure 7
<p>ROC curves of splitting 70:30.</p>
Full article ">Figure 8
<p>The best models for 80:20 splitting.</p>
Full article ">Figure 9
<p>The best models for 70:30 splitting.</p>
Full article ">Figure 10
<p>Global explainability of the developed model: (<b>a</b>) bar plot (<b>b</b>) Cohort plot.</p>
Full article ">Figure 11
<p>Heatmap of the developed model.</p>
Full article ">Figure 12
<p>Full water plot for the first and second observation: (<b>a</b>) first observation; (<b>b</b>) second observation.</p>
Full article ">Figure 13
<p>Individual fore plot for several instances according to the developed model (<b>a</b>) for observation 1 and (<b>b</b>) for observation 2.</p>
Full article ">Figure 14
<p>Collective force plot for the developed model.</p>
Full article ">
11 pages, 1524 KiB  
Article
The Prevalence of Multidrug-Resistant Enterobacteriaceae among Neonates in Kuwait
by Rehab Zafer Alajmi, Wadha Ahmed Alfouzan and Abu Salim Mustafa
Diagnostics 2023, 13(8), 1505; https://doi.org/10.3390/diagnostics13081505 - 21 Apr 2023
Cited by 3 | Viewed by 1778
Abstract
Increasing numbers of neonates with serious bacterial infections, due to resistant bacteria, are associated with considerable morbidity and mortality rates. The aim of this study was to evaluate the prevalence of drug-resistant Enterobacteriaceae in the neonatal population and their mothers in Farwaniya Hospital [...] Read more.
Increasing numbers of neonates with serious bacterial infections, due to resistant bacteria, are associated with considerable morbidity and mortality rates. The aim of this study was to evaluate the prevalence of drug-resistant Enterobacteriaceae in the neonatal population and their mothers in Farwaniya Hospital in Kuwait and to determine the basis of resistance. Rectal screening swabs were taken from 242 mothers and 242 neonates in labor rooms and wards. Identification and sensitivity testing were performed using the VITEK® 2 system. Each isolate flagged with any resistance was subjected to the E-test susceptibility method. The detection of resistance genes was performed by PCR, and the Sanger sequencing method was used to identify mutations. Among 168 samples tested by the E-test method, no MDR Enterobacteriaceae were detected among the neonates, while 12 (13.6%) isolates from the mothers’ samples were MDR. ESBL, aminoglycosides, fluoroquinolones, and folate pathway inhibitor resistance genes were detected, while beta-lactam–beta-lactamase inhibitor combinations, carbapenems, and tigecycline resistance genes were not. Our results showed that the prevalence of antibiotic resistance in Enterobacteriaceae obtained from neonates in Kuwait is low, and this is encouraging. Furthermore, it is possible to conclude that neonates are acquiring resistance mostly from the environment and after birth but not from their mothers. Full article
(This article belongs to the Special Issue Diagnosis of Neonatal Diseases)
Show Figures

Figure 1

Figure 1
<p>Phylogenetic tree based on DNA gyrase A (<span class="html-italic">gyr A</span>) sequences illustrating the evolutionary distance between 16 isolates of <span class="html-italic">Escherichia coli</span> from 14 mothers and 2 neonates and 5 strains of <span class="html-italic">Escherichia coli</span> with known pathotypes.</p>
Full article ">Figure 2
<p>Phylogenetic tree based on DNA topoisomerase IV (<span class="html-italic">parC</span>) sequences illustrating the evolutionary distance between 16 isolates of <span class="html-italic">Escherichia coli</span> from 14 mothers and 2 neonates and 4 strains of <span class="html-italic">Escherichia coli</span> with known pathotypes.</p>
Full article ">
23 pages, 2090 KiB  
Review
Myocardial Recovery
by Nikolaos Chrysakis, Andrew Xanthopoulos, Dimitrios Magouliotis, Randall C. Starling, Stavros G. Drakos, Filippos Triposkiadis and John Skoularigis
Diagnostics 2023, 13(8), 1504; https://doi.org/10.3390/diagnostics13081504 - 21 Apr 2023
Cited by 2 | Viewed by 1836
Abstract
In this paper, the feasibility of myocardial recovery is analyzed through a literature review. First, the phenomena of remodeling and reverse remodeling are analyzed, approached through the physics of elastic bodies, and the terms myocardial depression and myocardial recovery are defined. Continuing, potential [...] Read more.
In this paper, the feasibility of myocardial recovery is analyzed through a literature review. First, the phenomena of remodeling and reverse remodeling are analyzed, approached through the physics of elastic bodies, and the terms myocardial depression and myocardial recovery are defined. Continuing, potential biochemical, molecular, and imaging markers of myocardial recovery are reviewed. Then, the work focuses on therapeutic techniques that can facilitate the reverse remodeling of the myocardium. Left ventricular assist device (LVAD) systems are one of the main ways to promote cardiac recovery. The changes that take place in cardiac hypertrophy, extracellular matrix, cell populations and their structural elements, β-receptors, energetics, and several biological processes, are reviewed. The attempt to wean the patients who experienced cardiac recovery from cardiac assist device systems is also discussed. The characteristics of the patients who will benefit from LVAD are presented and the heterogeneity of the studies performed in terms of patient populations included, diagnostic tests performed, and their results are addressed. The experience with cardiac resynchronization therapy (CRT) as another way to promote reverse remodeling is also reviewed. Myocardial recovery is a phenomenon that presents with a continuous spectrum of phenotypes. There is a need for algorithms to screen suitable patients who may benefit and identify specific ways to enhance this phenomenon in order to help combat the heart failure epidemic. Full article
(This article belongs to the Section Pathology and Molecular Diagnostics)
Show Figures

Figure 1

Figure 1
<p>(<b>A</b>) A material, when an increasing stress is applied to it, can increase its length up to a certain point and, when the applied stress is stopped, it can return to its original state without affecting its structure (elastic deformation). From this point onwards, the material will partially return to its original state as permanent structural changes are created in its structure (plastic deformation). (<b>B</b>,<b>C</b>) Myocardial tissue shows a similar behavior. When tension is exerted on the myocardial wall, the damage it will suffer can be either permanent or reversible, in whole or in part, depending on the damage and its duration. (<b>D</b>) The three factors that will determine the evolution of myocardial functionality are (1) its macroscopic geometry, (2) the cardiomyocyte and (3) the extracellular matrix. The clinical impact that the degree of remodeling will have concerns two possible outcomes, myocardial remission and myocardial recovery. Abbreviations: C, cardiac myocyte; M, extracellular matrix; LV, left ventricle. Reprinted with permission from Mann DL, et al., (2012), Copyright © 2012, American College of Cardiology Foundation. Published by Elsevier Inc. Ref. [<a href="#B1-diagnostics-13-01504" class="html-bibr">1</a>].</p>
Full article ">Figure 2
<p>(<b>A</b>,<b>B</b>): The changes in the mRNAs of COLIAN1, TGF1β, in which no statistical difference is observed before and after the removal of the LVAD. (<b>C</b>,<b>D</b>): The changes in the mRNAs of THY1 and TIMP4, where there is a statistically significant difference between the patients who recovered and those who did not. (<b>E</b>–<b>H</b>): mRNA expression of COL1A1, COL3A1, FN and THY1 after LVAD removal was negatively correlated with ejection fraction. Reprinted with permission from Felkin LE, et al., (2009), Copyright © 2009 International Society for Heart and Lung Transplantation. Published by Elsevier Inc. Ref. [<a href="#B19-diagnostics-13-01504" class="html-bibr">19</a>].</p>
Full article ">Figure 3
<p>After LVAD placement (<b>A</b>): cell size and (<b>B</b>): capacitance (an index of cell surface area), tend to return to normal donor values, indicating reversal of hypertrophy. (<b>C</b>): No increase in the contraction-frequency-dependent relationship was observed in patient cells with or after LVAD use in contrast to donor cells. As a result, the researchers hypothesized the involvement of calcium transport mechanisms as responsible for the improvement in contraction. (<b>D</b>): LVAD-implanted HF patients show reduced calcium current amplitude compared to LVAD-removal patients and no-difference compared to donors. After LVAD removal there is an increase in the amount of calcium observed compared to heart failure patients and donors. The LVAD increases the amplitude of the calcium current and its quantity, improving the excitation-contraction relationship of the cardiomyocyte, being a mechanism for promoting cardiac recovery. * <span class="html-italic">p</span> &lt; 0.05; ** <span class="html-italic">p</span> &lt; 0.01; LVAD core: left ventricular tissue taken at LVAD implant; post LVAD: left ventricular tissue taken at LVAD removal. Reprinted with permission from Terracciano CMN, et al., (2003), Copyright © 2003, Oxford University Press [<a href="#B27-diagnostics-13-01504" class="html-bibr">27</a>].</p>
Full article ">Figure 4
<p>Extrapolating the lessons learned from patients with ventricular assist devices to the broader heart failure population. Reprinted with permission from Taleb I, et al., (2022), Copyright © 2022, Wolters Kluwer Health [<a href="#B65-diagnostics-13-01504" class="html-bibr">65</a>].</p>
Full article ">Figure 5
<p>Heart failure (HF) is a spectrum of phenotypes. Each HF phenotype is the result of a patient-specific trajectory wherein the heart remodels towards concentric hypertrophy, eccentric hypertrophy or a combination of both. The way of entry and the subsequent path of the trajectory depend on the patient’s risk factors, comorbidities and disease modifiers (genome, proteome, metabolome). Both pharmaceutical treatment (i.e., β-blocker, ARNI/ACE-i/ARB, MRA, SGLT-2 inhibitor, diuretic) and device therapy (i.e., cardiac resynchronization therapy, left ventricular assist devices) may lead to reverse remodeling. Abbreviations: ARNI, angiotensin receptor-neprilysin inhibitor; ACE-I, angiotensin-converting enzyme inhibitor; ARB, angiotensin receptor blockers; MRA, mineralocorticoid receptor antagonists; SGLT2-inhibitor, sodium-glucose Cotransporter 2-nhibitor; CRT, cardiac resynchronization therapy; GDMT, guideline medical therapy.</p>
Full article ">
16 pages, 5189 KiB  
Article
A Transfer Learning Approach for Clinical Detection Support of Monkeypox Skin Lesions
by Maram Fahaad Almufareh, Samabia Tehsin, Mamoona Humayun and Sumaira Kausar
Diagnostics 2023, 13(8), 1503; https://doi.org/10.3390/diagnostics13081503 - 21 Apr 2023
Cited by 24 | Viewed by 2640
Abstract
Monkeypox (MPX) is a disease caused by monkeypox virus (MPXV). It is a contagious disease and has associated symptoms of skin lesions, rashes, fever, and respiratory distress lymph swelling along with numerous neurological distresses. This can be a deadly disease, and the latest [...] Read more.
Monkeypox (MPX) is a disease caused by monkeypox virus (MPXV). It is a contagious disease and has associated symptoms of skin lesions, rashes, fever, and respiratory distress lymph swelling along with numerous neurological distresses. This can be a deadly disease, and the latest outbreak of it has shown its spread to Europe, Australia, the United States, and Africa. Typically, diagnosis of MPX is performed through PCR, by taking a sample of the skin lesion. This procedure is risky for medical staff, as during sample collection, transmission and testing, they can be exposed to MPXV, and this infectious disease can be transferred to medical staff. In the current era, cutting-edge technologies such as IoT and artificial intelligence (AI) have made the diagnostics process smart and secure. IoT devices such as wearables and sensors permit seamless data collection while AI techniques utilize the data in disease diagnosis. Keeping in view the importance of these cutting-edge technologies, this paper presents a non-invasive, non-contact, computer-vision-based method for diagnosis of MPX by analyzing skin lesion images that are more smart and secure compared to traditional methods of diagnosis. The proposed methodology employs deep learning techniques to classify skin lesions as MPXV positive or not. Two datasets, the Kaggle Monkeypox Skin Lesion Dataset (MSLD) and the Monkeypox Skin Image Dataset (MSID), are used for evaluating the proposed methodology. The results on multiple deep learning models were evaluated using sensitivity, specificity and balanced accuracy. The proposed method has yielded highly promising results, demonstrating its potential for wide-scale deployment in detecting monkeypox. This smart and cost-effective solution can be effectively utilized in underprivileged areas where laboratory infrastructure may be lacking. Full article
Show Figures

Figure 1

Figure 1
<p>Architectural diagram of proposed method.</p>
Full article ">Figure 2
<p>Sample images of datasets: first row shows images of MSLD and the second row shows MSID samples.</p>
Full article ">Figure 3
<p>Dataset visualization for monkeypox and other class distribution.</p>
Full article ">Figure 4
<p>Confusion matrix for different architectures. Top row shows a sample of the labeled confusion matrix. THe middle row shows the results for MSID, and the bottom row shows them for MSLD.</p>
Full article ">Figure 5
<p>Comparison of ROC curve for different architectures.</p>
Full article ">Figure 6
<p>Accuracy loss curves for training and validation data. The first column shows the results for MSID and the second column shows them for MSLD.</p>
Full article ">
24 pages, 22945 KiB  
Review
Craniovertebral Junction Instability after Oncological Resection: A Narrative Review
by Malte Ottenhausen, Elena Greco, Giacomo Bertolini, Andrea Gerosa, Salvatore Ippolito, Erik H. Middlebrooks, Graziano Serrao, Maria Grazia Bruzzone, Francesco Costa, Paolo Ferroli and Emanuele La Corte
Diagnostics 2023, 13(8), 1502; https://doi.org/10.3390/diagnostics13081502 - 21 Apr 2023
Cited by 5 | Viewed by 2438
Abstract
The craniovertebral junction (CVJ) is a complex transition area between the skull and cervical spine. Pathologies such as chordoma, chondrosarcoma and aneurysmal bone cysts may be encountered in this anatomical area and may predispose individuals to joint instability. An adequate clinical and radiological [...] Read more.
The craniovertebral junction (CVJ) is a complex transition area between the skull and cervical spine. Pathologies such as chordoma, chondrosarcoma and aneurysmal bone cysts may be encountered in this anatomical area and may predispose individuals to joint instability. An adequate clinical and radiological assessment is mandatory to predict any postoperative instability and the need for fixation. There is no common consensus on the need for, timing and setting of craniovertebral fixation techniques after a craniovertebral oncological surgery. The aim of the present review is to summarize the anatomy, biomechanics and pathology of the craniovertebral junction and to describe the available surgical approaches to and considerations of joint instability after craniovertebral tumor resections. Although a one-size-fits-all approach cannot encompass the extremely challenging pathologies encountered in the CVJ area, including the possible mechanical instability that is a consequence of oncological resections, the optimal surgical strategy (anterior vs posterior vs posterolateral) tailored to the patient’s needs can be assessed preoperatively in many instances. Preserving the intrinsic and extrinsic ligaments, principally the transverse ligament, and the bony structures, namely the C1 anterior arch and occipital condyle, ensures spinal stability in most of the cases. Conversely, in situations that require the removal of those structures, or in cases where they are disrupted by the tumor, a thorough clinical and radiological assessment is needed to timely detect any instability and to plan a surgical stabilization procedure. We hope that this review will help shed light on the current evidence and pave the way for future studies on this topic. Full article
(This article belongs to the Special Issue Assessment and Management of Instability in Spinal Tumors)
Show Figures

Figure 1

Figure 1
<p>Craniovertebral junction chordoma. Sagittal (<b>A</b>) T1-weighted image after contrast and (<b>B</b>) T2-weighted image depicting a large chordoma invading the rhinopharynx and extending into the premedullary cistern.</p>
Full article ">Figure 2
<p>Lower clivus solitary plasmacytoma. (<b>A</b>) Axial CT scan showing a lytic expansile lesion at the left lower clivus (circle). (<b>B</b>) Axial T1-weighted after contrast injection image showing a heterogenous and hyperintense lesion (circle). A minimally invasive endoscopic endonasal biopsy disclosed the plasmacytoma.</p>
Full article ">Figure 3
<p>Commonly used radiological parameters to predict CVJ instability. (<b>A</b>) Clivoaxial Angle (CXA). (<b>B</b>) Grabb–Oakes line. (<b>C</b>) Basion–Dens Interval (BDI). (<b>D</b>) Basion–Axial Interval (BAI). (<b>E</b>) Atlantodental Interval (ADI). (<b>F</b>) Powers ratio: ab/cd.</p>
Full article ">Figure 4
<p>Endoscopic endonasal approach (EEA) to a CVJ chordoma. Sagittal (<b>A</b>) and axial (<b>B</b>) T1-weighted images after contrast injection showing a craniovertebral junction chordoma invading the C1 anterior arch, transverse ligament and tip of the odontoid. The patient underwent a gross total removal through an EEA. Postoperative sagittal (<b>C</b>) and axial (<b>D</b>) T1-weighted images after contrast injection confirmed the entity of resection and the integrity of C1-C2 joint. (<b>E</b>) Axial CT scan showing the occipital condyle integrity &gt;90%. Dynamic cervical spine CT scans in maximal extension (<b>F</b>) and flexion (<b>G</b>) showing no abnormal movements and excluding any postoperative CVJ instability.</p>
Full article ">Figure 5
<p>Endoscopic endonasal approach to CVJ chordoma and occipitocervical fixation. Sagittal preoperative (<b>A</b>) and postoperative (<b>B</b>) T1-weighted MR images after contrast injection showing the chordoma infiltration of C0-C1-C2 complex joint and a gross total resection. In the same surgical setting, an occipitocervical fixation was performed. A 3D reconstruction of the postoperative CT (<b>C</b>).</p>
Full article ">Figure 6
<p>Combined endoscopic endonasal approach and far-lateral transcondylar and petro-occipital trans-sigmoid approach to recurrent CVJ chordoma and subsequent occipitocervical fixation. Axial T2-weighted MR image (<b>A</b>) and angio CT scan (<b>B</b>) showing a recurrent predominantly right craniovertebral junction chordoma. The chordoma infiltrates the rhinopharynx, C0-C1-C2 joint complex and the entire right occipital condyle. A combined endoscopic endonasal approach associated with far-lateral transcondylar and petro-occipital trans-sigmoid approach has been performed. (<b>C</b>) Axial postoperative T1-weighted after contrast injection image and (<b>D</b>) noncontrast CT scan disclosed a gross total resection with the destruction of the right clival–atlo–axial joint. An occipital-cervical fixation was therefore postoperatively planned and performed (<b>E</b>,<b>F</b>).</p>
Full article ">
10 pages, 2720 KiB  
Article
The Stability of the Anti-Müllerian Hormone in Serum and Plasma Samples under Various Preanalytical Conditions
by Radana Vrzáková, Václav Šimánek, Ondřej Topolčan, Vladimír Vurm, David Slouka and Radek Kučera
Diagnostics 2023, 13(8), 1501; https://doi.org/10.3390/diagnostics13081501 - 21 Apr 2023
Cited by 3 | Viewed by 1392
Abstract
The anti-Müllerian hormone (AMH) is a glycoprotein that plays an important role in prenatal sex differentiation. It is used as a biomarker in polycystic ovary syndrome (PCOS) diagnostics, as well as for estimating an individual’s ovarian reserve and the ovarian response to hormonal [...] Read more.
The anti-Müllerian hormone (AMH) is a glycoprotein that plays an important role in prenatal sex differentiation. It is used as a biomarker in polycystic ovary syndrome (PCOS) diagnostics, as well as for estimating an individual’s ovarian reserve and the ovarian response to hormonal stimulation during in vitro fertilization (IVF). The aim of this study was to test the stability of AMH during various preanalytical conditions that are in accordance with the ISBER (International Society for Biological and Environmental Repositories) protocol. Plasma and serum samples were taken from each of the 26 participants. The samples were then processed according to the ISBER protocol. AMH levels were measured in all the samples simultaneously using the chemiluminescent kit ACCESS AMH in a UniCel® DxI 800 Immunoassay System (Beckman Coulter, Brea, CA, USA). The study proved that AMH retains a relatively high degree of stability during repeated freezing and thawing in serum. AMH was shown to be less stable in plasma samples. Room temperature proved to be the least suitable condition for the storage of samples before performing the biomarker analysis. During the testing of storage stability at 5–7 °C, the values decreased over time for all the plasma samples but remained stable in the serum samples. We proved that AMH is highly stable under various stress conditions. The anti-Müllerian hormone retained the greatest stability in the serum samples. Full article
(This article belongs to the Section Pathology and Molecular Diagnostics)
Show Figures

Figure 1

Figure 1
<p>The difference in the distribution of initial AMH values in serum and plasma. Legend: The distribution of the values in serum and plasma samples were very similar and showed no statistically significant difference (<span class="html-italic">p</span> = 0.8858).</p>
Full article ">Figure 2
<p>AMH stability during freezing in serum and plasma samples. Legend: The stability of the samples during freezing and thawing did not change over time in serum samples, whereas the stability of the plasma samples decreased over time. An equivalence test using a ±0.30 ng/mL limit of tolerance found equivalence only for serum (<span class="html-italic">p</span> = 0.0196), but not for plasma (<span class="html-italic">p</span> = 0.3778); 1C, 2C, 3C, 4C, 5C-number of freeze–thaw cycles.</p>
Full article ">Figure 3
<p>The stability of AMH after separation, stored at RT. Legend: The stability of AMH after separation, stored at RT, decreased for both types of samples with time. An equivalence test using a ±0.30 ng/mL limit of tolerance failed to find equivalence for either serum or plasma samples (<span class="html-italic">p</span> = 0.9790 for serum, <span class="html-italic">p</span> = 1.0000 for plasma).</p>
Full article ">Figure 4
<p>The stability of AMH after separation, stored at 4 °C. Legend: The stability of AMH measured in the samples stored at 4 °C after separation remained unchanged in the serum samples, whereas the level of AMH in the plasma samples decreased over time. An equivalence test using a ±0.30 ng/mL limit of tolerance found equivalence only for serum samples (<span class="html-italic">p</span> = 0.0431), but not for plasma (<span class="html-italic">p</span> = 0.3487).</p>
Full article ">Figure 5
<p>The stability of AMH during the 30-day storage at −20 °C. The molecule showed high stability in both serum and plasma samples. Legend: The stability of AMH in the samples stored for 30 days at −20 °C did not show any significant change in concentration over time in either type of sample. Equivalence was proved at a ±0.30 ng/mL limit of tolerance (<span class="html-italic">p</span> &lt; 0.0001 for serum, <span class="html-italic">p</span> = 0.0238 for plasma).</p>
Full article ">
10 pages, 277 KiB  
Article
Analysis of Corneal Deformation in Paediatric Patients Affected by Maturity Onset Diabetes of the Young Type 2
by Michele Lanza, Enza Mozzillo, Rosa Boccia, Ludovica Fedi, Francesca Di Candia, Nadia Tinto, Paolo Melillo, Francesca Simonelli and Adriana Franzese
Diagnostics 2023, 13(8), 1500; https://doi.org/10.3390/diagnostics13081500 - 21 Apr 2023
Viewed by 1435
Abstract
Background: To evaluate corneal deformation in Maturity Onset Diabetes of the Young type 2 (MODY2), paediatric subjects were analysed using a Scheimpflug-based device. The purpose of this analysis was to find new biomarkers for MODY2 disease and to gain a better understanding of [...] Read more.
Background: To evaluate corneal deformation in Maturity Onset Diabetes of the Young type 2 (MODY2), paediatric subjects were analysed using a Scheimpflug-based device. The purpose of this analysis was to find new biomarkers for MODY2 disease and to gain a better understanding of the pathogenesis of the disease. Methods: A total of 15 patients with genetic and metabolic diagnoses of MODY2 (mean age 12.8 ± 5.66 years) and 15 age-matched healthy subjects were included. The biochemical and anthropometric data of MODY2 patients were collected from clinical records, and a complete ophthalmic check with a Pentacam HR EM-3000 Specular Microscope and Corvis ST devices was performed in both groups. Results: Highest concavity (HC) deflection length, Applanation 1 (A1) deflection amplitude, and A1 deflection area showed significantly lower values in MODY2 patients compared to healthy subjects. A significant positive correlation was observed between Body Mass Index (BMI) and HC deflection area and between waist circumference (WC) and the following parameters: maximum deformation amplitude, HC deformation amplitude, and HC deflection area. The glycosylated hemoglobin level (HbA1c) showed a significant positive correlation with Applanation 2 time and HC time. Conclusions: The obtained results show, for the first time, differences regarding corneal distortion features in the MODY2 population compared with healthy eyes. Full article
(This article belongs to the Section Medical Imaging and Theranostics)
13 pages, 2068 KiB  
Systematic Review
Effectiveness of Using the FreeStyle Libre® System for Monitoring Blood Glucose during the COVID-19 Pandemic in Diabetic Individuals: Systematic Review
by Luelia Teles Jaques-Albuquerque, Elzi dos Anjos-Martins, Luiza Torres-Nunes, Ana Gabriellie Valério-Penha, Ana Carolina Coelho-Oliveira, Viviani Lopes da Silva Sarandy, Aline Reis-Silva, Adérito Seixas, Mario Bernardo-Filho, Redha Taiar and Danúbia Cunha de Sá-Caputo
Diagnostics 2023, 13(8), 1499; https://doi.org/10.3390/diagnostics13081499 - 21 Apr 2023
Cited by 1 | Viewed by 2114
Abstract
Background: Artificial Intelligence (AI) is an area of computer science/engineering that is aiming to spread technological systems. The COVID-19 pandemic caused economic and public health turbulence around the world. Among the many possibilities for using AI in the medical field is FreeStyle Libre [...] Read more.
Background: Artificial Intelligence (AI) is an area of computer science/engineering that is aiming to spread technological systems. The COVID-19 pandemic caused economic and public health turbulence around the world. Among the many possibilities for using AI in the medical field is FreeStyle Libre® (FSL), which uses a disposable sensor inserted into the user’s arm, and a touchscreen device/reader is used to scan and retrieve other continuous monitoring of glucose (CMG) readings. The aim of this systematic review is to summarize the effectiveness of FSL blood glucose monitoring during the COVID-19 pandemic. Methods: This systematic review was carried out in accordance with the Preferred Reporting Items for Systematic Review and Meta-Analyses (PRISMA) and was registered in the international prospective register of systematic reviews (PROSPERO: CRD42022340562). The inclusion criteria considered studies involving the use of the FSL device during the COVID-19 pandemic and published in English. No publication date restrictions were set. The exclusion criteria were abstracts, systematic reviews, studies with patients with other diseases, monitoring with other equipment, patients with COVID-19, and bariatrics patients. Seven databases were searched (PubMed, Scopus, Embase, Web of Science, Scielo, PEDro and Cochrane Library). The ACROBAT-NRSI tool (A Cochrane Risk of Bias Assessment Tool for Non-Randomized Studies) was used to evaluate the risk of bias in the selected articles. Results: A total of 113 articles were found. Sixty-four were excluded because they were duplicates, 39 were excluded after reading the titles and abstracts, and twenty articles were considered for full reading. Of the 10 articles analyzed, four articles were excluded because they did not meet the inclusion criteria. Thus, six articles were included in the current systematic review. It was observed that among the selected articles, only two were classified as having serious risk of bias. It was shown that FSL had a positive impact on glycemic control and on reducing the number of individuals with hypoglycemia. Conclusion: The findings suggest that the implementation of FSL during COVID-19 confinement in this population can be confidently stated to have been effective in diabetes mellitus patients. Full article
(This article belongs to the Section Pathology and Molecular Diagnostics)
Show Figures

Figure 1

Figure 1
<p>National Health and Medical Research Council evidence hierarchy scale.</p>
Full article ">Figure 2
<p>Flowchart with the steps of selection for this study.</p>
Full article ">Figure 3
<p>Risk of bias assessment of the studies included in this review [<a href="#B37-diagnostics-13-01499" class="html-bibr">37</a>,<a href="#B38-diagnostics-13-01499" class="html-bibr">38</a>,<a href="#B39-diagnostics-13-01499" class="html-bibr">39</a>,<a href="#B40-diagnostics-13-01499" class="html-bibr">40</a>,<a href="#B41-diagnostics-13-01499" class="html-bibr">41</a>,<a href="#B42-diagnostics-13-01499" class="html-bibr">42</a>].</p>
Full article ">
10 pages, 924 KiB  
Article
Comparison of Diagnostic Yield and Safety of Serial Pancreatic Juice Aspiration Cytologic Examination (SPACE) with Different Indications
by Tatsunori Satoh, Shinya Kawaguchi, Shodai Takeda, Yuya Ishiguro, Kazuhisa Asahara, Shuzo Terada, Shinya Endo, Naofumi Shirane, Hideyuki Kanemoto and Kazuya Ohno
Diagnostics 2023, 13(8), 1498; https://doi.org/10.3390/diagnostics13081498 - 21 Apr 2023
Cited by 2 | Viewed by 1477
Abstract
We assessed whether there are differences in the diagnostic yield and safety of serial pancreatic juice aspiration cytologic examination (SPACE) among different indications. We retrospectively analyzed 226 patients who underwent SPACE. They were classified into group A (patients with pancreatic masses, including advanced [...] Read more.
We assessed whether there are differences in the diagnostic yield and safety of serial pancreatic juice aspiration cytologic examination (SPACE) among different indications. We retrospectively analyzed 226 patients who underwent SPACE. They were classified into group A (patients with pancreatic masses, including advanced adenocarcinoma, sclerosing pancreatitis, or autoimmune pancreatitis), group B (suspicious pancreatic carcinoma patients without obvious pancreatic masses, including small pancreatic carcinoma, carcinoma in situ, or benign pancreatic duct stenosis), and group C (intraductal papillary mucinous neoplasm, IPMN). There were 41, 66, and 119 patients, with malignancy diagnosed in 29, 14, and 22 patients, in groups A, B, and C, respectively. The sensitivity, specificity, positive predictive value, negative predictive value, and accuracy were 69%, 100%, 100%, 57%, and 78% in group A; 79%, 98%, 92%, 94%, and 94% in group B; and 27%, 87%, 32%, 84%, and 76% in group C, respectively. PEP was observed in three (7.3%), three (4.5%), and fifteen (13%) patients in group A, B, and C, respectively (p = 0.20). SPACE is useful and safe in patients with suspicious small pancreatic carcinoma. However, it has limited efficacy and might not be recommended in patients with IPMN because of the high frequency of PEP. Full article
(This article belongs to the Special Issue Early Diagnosis of Pancreatic Cancer 2022–2023)
Show Figures

Figure 1

Figure 1
<p>Flow diagram of the study. There were no significant differences in technical success among the three groups (<span class="html-italic">p</span> = 0.63). Group A included patients with pancreatic masses, Group B included patients without obvious pancreatic masses, and Group C included IPMN patients. IPMN, intraductal papillary mucinous neoplasm; SPACE, serial pancreatic-juice aspiration cytologic examination; NPD, naso-pancreatic drainage.</p>
Full article ">
12 pages, 941 KiB  
Article
Rapid Detection of Mycobacterium Tuberculosis Using a Novel Point-of-Care BZ TB/NTM NALF Assay: Integrating LAMP and LFIA Technologies
by Ha Nui Kim, Junmin Lee, Soo-Young Yoon, Woong Sik Jang and Chae Seung Lim
Diagnostics 2023, 13(8), 1497; https://doi.org/10.3390/diagnostics13081497 - 21 Apr 2023
Cited by 2 | Viewed by 2394
Abstract
Tuberculosis (TB) is one of the leading causes of infectious mortality from a single infectious agent, Mycobacterium tuberculosis (MTB). This study evaluated the performance of the newly developed BZ TB/NTM NALF assay, which integrated loop-mediated isothermal amplification and lateral flow immunochromatographic assay technologies, [...] Read more.
Tuberculosis (TB) is one of the leading causes of infectious mortality from a single infectious agent, Mycobacterium tuberculosis (MTB). This study evaluated the performance of the newly developed BZ TB/NTM NALF assay, which integrated loop-mediated isothermal amplification and lateral flow immunochromatographic assay technologies, for the detection of MTB. A total of 80 MTB-positive samples and 115 MTB-negative samples were collected, all of which were confirmed by TB real-time PCR (RT-PCR) using either AdvanSureTM TB/NTM RT-PCR Kit or Xpert® MTB/RIF Assay. The performance of the BZ TB/NTM NALF assay was evaluated by calculating its sensitivity, specificity, positive predictive value (PPV), and negative predictive value (NPV) in comparison to those of the RT-PCR methods. Compared to the RT-PCR, the sensitivity, specificity, PPV, and NPV of BZ TB/NTM NALF assay were 98.7%, 99.1%, 98.7%, and 99.1%, respectively. The concordance rate between BZ TB/NTM NALF and RT-PCR was 99.0%. Rapid and simple detection of MTB is essential for global case detection and further elimination of TB. The performance of the BZ TB/NTM NALF Assay is acceptable with a high concordance with RT-PCR, indicating that it is reliable for use in a low-resource environment. Full article
(This article belongs to the Special Issue Point-of-Care Diagnostic Tests for Tuberculosis Disease)
Show Figures

Figure 1

Figure 1
<p>Schematic representation for the principle of lateral flow immunochromatographic assay in BZ TB/NTM NALF Assay.</p>
Full article ">Figure 2
<p>Interpretations of BZ TB/NTM NALF Assay with schematic illustrations of corresponding test cassette (upper right). A control line should be present in all tests and the absence of this line is considered an invalid result. (<b>A</b>) Negative result, one red line appears on control region. (<b>B</b>) MTB-positive result, two red lines present on T1/T2 and control. (<b>C</b>) NTM-positive result, two red lines appear on T2 and control region. (<b>D</b>) A photograph of test device representing MTB-positive, NTM-positive, and negative results (<b>left</b> to <b>right</b>).</p>
Full article ">Figure 2 Cont.
<p>Interpretations of BZ TB/NTM NALF Assay with schematic illustrations of corresponding test cassette (upper right). A control line should be present in all tests and the absence of this line is considered an invalid result. (<b>A</b>) Negative result, one red line appears on control region. (<b>B</b>) MTB-positive result, two red lines present on T1/T2 and control. (<b>C</b>) NTM-positive result, two red lines appear on T2 and control region. (<b>D</b>) A photograph of test device representing MTB-positive, NTM-positive, and negative results (<b>left</b> to <b>right</b>).</p>
Full article ">
13 pages, 11370 KiB  
Article
Patello-Femoral Pain Syndrome: Magnetic Resonance Imaging versus Ultrasound
by Patrizia Pacini, Milvia Martino, Luca Giuliani, Gabriele Santilli, Francesco Agostini, Giovanni Del Gaudio, Andrea Bernetti, Massimiliano Mangone, Marco Paoloni, Martina Toscano, Corrado De Vito, Carlo Ottonello, Valter Santilli and Vito Cantisani
Diagnostics 2023, 13(8), 1496; https://doi.org/10.3390/diagnostics13081496 - 21 Apr 2023
Viewed by 3741
Abstract
Background: Magnetic Resonance Imaging (MRI) and Ultrasound (US) in combination with clinical data could contribute to the diagnosis, staging and follow-up of Patello-Femoral Syndrome (PFS), which often overlaps with other pathologies of the knee. Purpose of the Study: To evaluate the diagnostic role [...] Read more.
Background: Magnetic Resonance Imaging (MRI) and Ultrasound (US) in combination with clinical data could contribute to the diagnosis, staging and follow-up of Patello-Femoral Syndrome (PFS), which often overlaps with other pathologies of the knee. Purpose of the Study: To evaluate the diagnostic role of MRI and US findings associated with PFS and define the range values of instrumental measurements obtained in pathological cases and healthy controls, the performance of the two methods in comparison, and the correlation with clinical data. Materials and Methods: 100 subjects were examined: 60 patients with a high suspicion of PFS at the clinical evaluation and 40 healthy controls. All measurements obtained by MRI and US examination were correlated with clinical data. A descriptive analysis of all measurements was stratified for pathological cases and healthy controls. A Student’s t-test for continuous variables was used to compare patients to controls and US to MRI. Logistic regression analysis was applied to test the correlation between MRI and US measurements with clinical data. Results: Statistical descriptive analysis determined the MRI and US range values of medial patello-femoral distance and the thickness of retinacles and cartilages in pathological cases and healthy controls. In pathological cases, the retinacle results of both increased; the medial appeared to be slightly more increased than the lateral. Furthermore, in some cases, the thickness of the cartilage decreased in both techniques; the medial cartilage was more thinned than the lateral. According to logistic regression analyses, the best diagnostic parameter was the medial patello-femoral distance due to the overlapping results of the US and MRI. Furthermore, all clinical data obtained by different tests showed a good correlation with patello-femoral distance. In particular, the correlation between medial patello-femoral distance and the VAS score is direct and equal to 97–99%, which is statistically significant (p < 0.001), and the correlation with the KOOS score is inverse and equal to 96–98%, which is statistically significant. Conclusions: MRI and Ultrasound examination in combination with clinical data demonstrated high-value results in the diagnosis of PFS. Full article
(This article belongs to the Special Issue Advanced MRI in Clinical Diagnosis)
Show Figures

Figure 1

Figure 1
<p>MRI and US values of retinacles (<b>A</b>) and cartilage (<b>B</b>) thickness and medial patello-femoral distance (<b>C</b>). Images of severe pathological cases.</p>
Full article ">Figure 2
<p>MRI and US values of retinacles (<b>A</b>) and cartilage (<b>B</b>) thickness and medial patello-femoral distance (<b>C</b>). Images of moderate pathological cases.</p>
Full article ">Figure 3
<p>MRI and US values of retinacles (<b>A</b>) and cartilage (<b>B</b>) thickness and medial patello-femoral distance (<b>C</b>). Images of mild pathological cases.</p>
Full article ">Figure 4
<p>MRI and US values of retinacles (<b>A</b>) and cartilage (<b>B</b>) thickness and medial patello-femoral distance (<b>C</b>). Images of healthy controls.</p>
Full article ">
8 pages, 1085 KiB  
Brief Report
Multiparametric Skin Assessment in a Monocentric Cohort of Systemic Sclerosis Patients: Is There a Role for Ultra-High Frequency Ultrasound?
by Marco Di Battista, Simone Barsotti, Saverio Vitali, Marco Palma, Giammarco Granieri, Teresa Oranges, Giacomo Aringhieri, Valentina Dini, Alessandra Della Rossa, Emanuele Neri, Marco Romanelli and Marta Mosca
Diagnostics 2023, 13(8), 1495; https://doi.org/10.3390/diagnostics13081495 - 21 Apr 2023
Cited by 1 | Viewed by 1352
Abstract
Background: To assess skin involvement in a cohort of patients with systemic sclerosis (SSc) by comparing results obtained from modified Rodnan skin score (mRSS), durometry and ultra-high frequency ultrasound (UHFUS). Methods: SSc patients were enrolled along with healthy controls (HC), assessing [...] Read more.
Background: To assess skin involvement in a cohort of patients with systemic sclerosis (SSc) by comparing results obtained from modified Rodnan skin score (mRSS), durometry and ultra-high frequency ultrasound (UHFUS). Methods: SSc patients were enrolled along with healthy controls (HC), assessing disease-specific characteristics. Five regions of interest were investigated in the non-dominant upper limb. Each patient underwent a rheumatological evaluation of the mRSS, dermatological measurement with a durometer, and radiological UHFUS assessment with a 70 MHz probe calculating the mean grayscale value (MGV). Results: Forty-seven SSc patients (87.2% female, mean age 56.4 years) and 15 HC comparable for age and sex were enrolled. Durometry showed a positive correlation with mRSS in most regions of interest (p = 0.025, ρ = 0.34 in mean). When performing UHFUS, SSc patients had a significantly thicker epidermal layer (p < 0.001) and lower epidermal MGV (p = 0.01) than HC in almost all the different regions of interest. Lower values of dermal MGV were found at the distal and intermediate phalanx (p < 0.01). No relationships were found between UHFUS results either with mRSS or durometry. Conclusions: UHFUS is an emergent tool for skin assessment in SSc, showing significant alterations concerning skin thickness and echogenicity when compared with HC. The lack of correlations between UHFUS and both mRSS and durometry suggests that these are not equivalent techniques but may represent complementary methods for a full non-invasive skin evaluation in SSc. Full article
Show Figures

Figure 1

Figure 1
<p>Skin regions of interest undergoing multiparametric non-invasive assessment. DP: distal phalanx; IP: intermediate phalanx; PP: proximal phalanx; DH: dorsum hand; VF: volar forearm.</p>
Full article ">Figure 2
<p>Measurement of epidermal thickness at the intermediate phalanx of the second finger. Note the increased thickness of the epidermal layer in the SSc patient compared to the control subject.</p>
Full article ">Figure 3
<p>Measurement of epidermal and dermal grayscale values using ROIs positioned at the intermediate phalanx of the second finger. Note the reduction in the mean grayscale value in the SSc patient compared to the control subject in the epidermal and dermal areas.</p>
Full article ">
19 pages, 6407 KiB  
Article
An Ensemble of Deep Learning Object Detection Models for Anatomical and Pathological Regions in Brain MRI
by Ramazan Terzi
Diagnostics 2023, 13(8), 1494; https://doi.org/10.3390/diagnostics13081494 - 20 Apr 2023
Cited by 4 | Viewed by 2684
Abstract
This paper proposes ensemble strategies for the deep learning object detection models carried out by combining the variants of a model and different models to enhance the anatomical and pathological object detection performance in brain MRI. In this study, with the help of [...] Read more.
This paper proposes ensemble strategies for the deep learning object detection models carried out by combining the variants of a model and different models to enhance the anatomical and pathological object detection performance in brain MRI. In this study, with the help of the novel Gazi Brains 2020 dataset, five different anatomical parts and one pathological part that can be observed in brain MRI were identified, such as the region of interest, eye, optic nerves, lateral ventricles, third ventricle, and a whole tumor. Firstly, comprehensive benchmarking of the nine state-of-the-art object detection models was carried out to determine the capabilities of the models in detecting the anatomical and pathological parts. Then, four different ensemble strategies for nine object detectors were applied to boost the detection performance using the bounding box fusion technique. The ensemble of individual model variants increased the anatomical and pathological object detection performance by up to 10% in terms of the mean average precision (mAP). In addition, considering the class-based average precision (AP) value of the anatomical parts, an up to 18% AP improvement was achieved. Similarly, the ensemble strategy of the best different models outperformed the best individual model by 3.3% mAP. Additionally, while an up to 7% better FAUC, which is the area under the TPR vs. FPPI curve, was achieved on the Gazi Brains 2020 dataset, a 2% better FAUC score was obtained on the BraTS 2020 dataset. The proposed ensemble strategies were found to be much more efficient in finding the anatomical and pathological parts with a small number of anatomic objects, such as the optic nerve and third ventricle, and producing higher TPR values, especially at low FPPI values, compared to the best individual methods. Full article
(This article belongs to the Special Issue Application of Deep Learning in the Diagnosis of Brain Diseases)
Show Figures

Figure 1

Figure 1
<p>An example of the dataset preparation: (<b>a</b>) an original FLAIR slice; (<b>b</b>) segmented by experts; and (<b>c</b>) the extracted anatomical objects (red: ROI, green: eye, blue: optic nerve, yellow: lateral ventricle, magenta: third ventricle, white: whole tumor).</p>
Full article ">Figure 2
<p>Workflow of the proposed methodology and ensemble strategies for anatomical and pathological object detection: (<b>a</b>) An ensemble of different variants of a model; (1) for all folds, Strategy 1, and (2) for the best folds, Strategy 2. (<b>b</b>) An ensemble of different models fold-by-fold; (3) for all models, Strategy 3, and (4) for the best different models, Strategy 4.</p>
Full article ">Figure 3
<p>FROC curves based on the TPR and FPPI for each anatomical and pathological region for the best ensemble strategy and the best individual models on the Gazi Brains 2020 dataset.</p>
Full article ">Figure 3 Cont.
<p>FROC curves based on the TPR and FPPI for each anatomical and pathological region for the best ensemble strategy and the best individual models on the Gazi Brains 2020 dataset.</p>
Full article ">Figure 4
<p>FROC curve for the pathological region for the best different model strategy on the BraTS 2020 Dataset.</p>
Full article ">Figure 5
<p>Example results for the best different models ensemble strategy on the FLAIR sequence. The first row shows the ground truth, the second row shows the best individual model, and the third row shows the ensemble results for the different best models. (red: ROI, green: eye, blue: optic nerve, yellow: lateral ventricle, magenta: third ventricle, white: whole tumor).</p>
Full article ">
15 pages, 1119 KiB  
Article
Diagnostic Value of Chromosomal Microarray Analysis for Fetal Congenital Heart Defects with Different Cardiac Phenotypes and Extracardiac Abnormalities
by Simin Zhang, Jingjing Wang, Yan Pei, Jijing Han, Xiaowei Xiong, Yani Yan, Juan Zhang, Yan Liu, Fangfei Su, Jinyu Xu and Qingqing Wu
Diagnostics 2023, 13(8), 1493; https://doi.org/10.3390/diagnostics13081493 - 20 Apr 2023
Cited by 2 | Viewed by 1582
Abstract
(1) Background: The objective of this study was to investigate the diagnostic value of chromosomal microarray analysis (CMA) for congenital heart defects (CHDs) with different cardiac phenotypes and extracardiac abnormalities (ECAs) and to explore the pathogenic genetic factors of CHDs. (2) Methods: We [...] Read more.
(1) Background: The objective of this study was to investigate the diagnostic value of chromosomal microarray analysis (CMA) for congenital heart defects (CHDs) with different cardiac phenotypes and extracardiac abnormalities (ECAs) and to explore the pathogenic genetic factors of CHDs. (2) Methods: We collected fetuses diagnosed with CHDs by echocardiography at our hospital from January 2012 to December 2021. We analyzed the CMA results of 427 fetuses with CHDs. We then categorized the CHD into different groups according to two dimensions: different cardiac phenotypes and whether it was combined with ECAs. The correlation between the numerical chromosomal abnormalities (NCAs) and copy number variations (CNVs) with CHDs was analyzed. Statistical analyses, including Chi-square tests and t-tests, were performed on the data using IBM SPSS and GraphPad Prism. (3) Results: In general, CHDs with ECAs increased the detection rate for CA, especially the conotruncal defects. CHD combined with the thoracic and abdominal walls and skeletal, thymic and multiple ECAs, were more likely to exhibit CA. Among the CHD phenotypes, VSD and AVSD were associated with NCA, while DORV may be associated with NCA. The cardiac phenotypes associated with pCNVs were IAA (type A and B), RAA, TAPVC, CoA and TOF. In addition, IAA, B, RAA, PS, CoA and TOF were also associated with 22q11.2DS. The length distribution of the CNV was not significantly different between each CHD phenotype. We detected twelve CNV syndromes, of which six syndromes may be related to CHDs. The pregnancy outcome in this study suggests that termination of pregnancy with fetal VSD and vascular abnormality is more dependent on genetic diagnosis, whereas the outcome in other phenotypes of CHDs may be associated with other additional factors. (4) Conclusions: CMA examination for CHDs is still necessary. We should identify the existence of fetal ECAs and specific cardiac phenotypes, which are helpful for genetic counseling and prenatal diagnosis. Full article
(This article belongs to the Special Issue Fetal Medicine: From Basic Science to Prenatal Diagnosis and Therapy)
Show Figures

Figure 1

Figure 1
<p>A detailed distribution map of chromosomal abnormalities. DS: deletion syndrome; del: deletion; dup: duplication; WBS: Williams-Beuren syndrome; 16p13.11 microduplication: 16p13.11 recurrent microduplication syndrome; SMS: Smith-Magenis syndrome; HNPP: Hereditary Liability to Pressure Palsies; MDLS: Miller-Dieker lissencephaly syndrome; 22q11.2 microduplication: 22q11.2 microduplication syndrome; PHMDS: Phelan-McDermid syndrome; CES: Cat eye syndrome; LWD: Leri-Weill dyschondrosteosis.</p>
Full article ">Figure 2
<p>Violin plots show the distribution of the total CNV length in each group of fetal CHDs. The distribution of the lengths of all CNVs of fetuses with CHDs is represented in the figure. The thickened dotted lines indicate the median, the dotted lines represent the first and third quartiles, and the vertices of each violin plot represent outside points. VSD: ventricular septal defect; AVSD: atrioventricular septal defect; LVOTO: left ventricular outflow tract obstruction; RVOTO: right ventricular outflow tract obstruction; TAPVC: total anomalous pulmonary venous connection.</p>
Full article ">Figure 3
<p>Pregnancy outcomes associated with a phenotype of fetal CHDs. A total of 138 fetuses had conotruncal defects, 60 fetuses had a septal defect, 25 fetuses had heterotaxy, 39 fetuses had AVSD, 47 fetuses had LVOTO, 42 fetuses had RVOTO, 4 fetuses had TAPVC, 22 fetuses had a vascular malformation, 33 fetuses had complex CHD, and 17 fetuses had other CHD. VSD: ventricular septal defect; AVSD: atrioventricular septal defect; LVOTO: left ventricular outflow tract obstruction; RVOTO: right ventricular outflow tract obstruction; TAPVC: total anomalous pulmonary venous connection.</p>
Full article ">
16 pages, 1730 KiB  
Systematic Review
A Systematic Review of Diagnostic and Prognostic Biomarkers for Head and Neck Cancer of Unknown Primary: An Unmet Clinical Need
by Daria Maria Filippini, Elisabetta Broseghini, Francesca Carosi, Davide Dal Molin, Mattia Riefolo, Laura Fabbri, Andi Abeshi, Ignacio Javier Fernandez and Manuela Ferracin
Diagnostics 2023, 13(8), 1492; https://doi.org/10.3390/diagnostics13081492 - 20 Apr 2023
Cited by 2 | Viewed by 3823
Abstract
Head and neck cancer of unknown primary (HNCUP) is defined as cervical lymph node metastases without a detectable primary tumor. The management of these patients presents a challenge to clinicians since guidelines in the diagnosis and treatment of HNCUP remain controversial. An accurate [...] Read more.
Head and neck cancer of unknown primary (HNCUP) is defined as cervical lymph node metastases without a detectable primary tumor. The management of these patients presents a challenge to clinicians since guidelines in the diagnosis and treatment of HNCUP remain controversial. An accurate diagnostic workup is fundamental for the search for the hidden primary tumor to allow the best adequate treatment strategy. The purpose of this systematic review is to present the currently available data about the diagnostic and prognostic molecular biomarkers for HNCUP. Systematic research in an electronic database was conducted using the Preferred Reporting Items for Systematic Reviews and Meta-Analyses (PRISMA) protocol and identified 704 articles, of which 23 studies were selected and included in the analysis. Fourteen studies investigated HNCUP diagnostic biomarkers and focused on the human papilloma virus (HPV) and the Epstein–Barr virus (EBV) due to the strong associations with oropharyngeal cancer and nasopharyngeal cancer, respectively. HPV status was shown to possess prognostic value, correlating with longer disease-free survival and overall survival. HPV and EBV are the only available HNCUP biomarkers, and they are already used in clinical practice. A better characterization of the molecular profiling and the development of tissue-of-origin classifiers are necessary to improve the diagnosis, staging, and therapeutic management of patients with HNCUP. Full article
Show Figures

Figure 1

Figure 1
<p>HNCUP diagnostic procedure. Figure created with Biorender.com.</p>
Full article ">Figure 2
<p>First lymph node levels of lymphatic drainage according to the head and neck tumor site.</p>
Full article ">Figure 3
<p>PRISMA flow diagram showing the steps of the systematic review of the literature. Of 704 papers, 23 original papers were selected in this systematic review.</p>
Full article ">
0 pages, 5636 KiB  
Article
Human Pathogenic Monkeypox Disease Recognition Using Q-Learning Approach
by Malathi Velu, Rajesh Kumar Dhanaraj, Balamurugan Balusamy, Seifedine Kadry, Yang Yu, Ahmed Nadeem and Hafiz Tayyab Rauf
Diagnostics 2023, 13(8), 1491; https://doi.org/10.3390/diagnostics13081491 (registering DOI) - 20 Apr 2023
Cited by 5 | Viewed by 2094
Abstract
While the world is working quietly to repair the damage caused by COVID-19’s widespread transmission, the monkeypox virus threatens to become a global pandemic. There are several nations that report new monkeypox cases daily, despite the virus being less deadly and contagious than [...] Read more.
While the world is working quietly to repair the damage caused by COVID-19’s widespread transmission, the monkeypox virus threatens to become a global pandemic. There are several nations that report new monkeypox cases daily, despite the virus being less deadly and contagious than COVID-19. Monkeypox disease may be detected using artificial intelligence techniques. This paper suggests two strategies for improving monkeypox image classification precision. Based on reinforcement learning and parameter optimization for multi-layer neural networks, the suggested approaches are based on feature extraction and classification: the Q-learning algorithm determines the rate at which an act occurs in a particular state; Malneural networks are binary hybrid algorithms that improve the parameters of neural networks. The algorithms are evaluated using an openly available dataset. In order to analyze the proposed optimization feature selection for monkeypox classification, interpretation criteria were utilized. In order to evaluate the efficiency, significance, and robustness of the suggested algorithms, a series of numerical tests were conducted. There were 95% precision, 95% recall, and 96% f1 scores for monkeypox disease. As compared to traditional learning methods, this method has a higher accuracy value. The overall macro average was around 0.95, and the overall weighted average was around 0.96. When compared to the benchmark algorithms, DDQN, Policy Gradient, and Actor–Critic, the Malneural network had the highest accuracy (around 0.985). In comparison with traditional methods, the proposed methods were found to be more effective. Clinicians can use this proposal to treat monkeypox patients and administration agencies can use it to observe the origin and current status of the disease. Full article
Show Figures

Figure 1

Figure 1
<p>Sample dataset.</p>
Full article ">Figure 2
<p>Framework of reinforcement learning.</p>
Full article ">Figure 3
<p>Data creation for the various model.</p>
Full article ">Figure 4
<p>Framework of the DQN Model.</p>
Full article ">Figure 5
<p>Framework of the DDQN Model.</p>
Full article ">Figure 6
<p>Framework of the Policy Gradient model.</p>
Full article ">Figure 7
<p>Framework of the Actor–Critic model.</p>
Full article ">Figure 8
<p>Proposed system framework.</p>
Full article ">Figure 9
<p>Training and validation learning curve.</p>
Full article ">Figure 10
<p>Training loss learning curve.</p>
Full article ">Figure 11
<p>Validation loss learning curve.</p>
Full article ">Figure 12
<p>Analysis of precision value for the deep learning algorithms.</p>
Full article ">Figure 13
<p>Analysis of accuracy value for the deep learning algorithms.</p>
Full article ">Figure 14
<p>Analysis of Recall value for the deep learning algorithms.</p>
Full article ">Figure 15
<p>Analysis of F1 score value for the deep learning algorithms.</p>
Full article ">Figure 16
<p>Overall performance evaluation of the diseases.</p>
Full article ">Figure 17
<p>Confusion matrix for monkeypox disease classification.</p>
Full article ">Figure 18
<p>Analysis of Reinforcement learning algorithm for the classification of monkeypox.</p>
Full article ">Figure 19
<p>Analysis of reinforcement learning algorithm for the classification of monkeypox.</p>
Full article ">Figure 20
<p>Analysis of reinforcement learning algorithm for the classification of monkeypox.</p>
Full article ">Figure 21
<p>Analysis of reinforcement learning algorithm for the classification of monkeypox.</p>
Full article ">
10 pages, 886 KiB  
Article
Aortic Dilatation in Pediatric Patients with Bicuspid Aortic Valve: How the Choice of Nomograms May Change Prevalence
by Gaia Spaziani, Francesca Bonanni, Francesca Girolami, Elena Bennati, Giovanni Battista Calabri, Chiara Di Filippo, Giulio Porcedda, Silvia Passantino, Stefano Nistri, Iacopo Olivotto and Silvia Favilli
Diagnostics 2023, 13(8), 1490; https://doi.org/10.3390/diagnostics13081490 - 20 Apr 2023
Viewed by 1775
Abstract
Background: Aortic dilation (AoD) is commonly reported in patients with bicuspid aortic valve (BAV) and has been related to flow abnormalities and genetic predisposition. AoD-related complications are reported to be extremely rare in children. Conversely, an overestimate of AoD related to body size [...] Read more.
Background: Aortic dilation (AoD) is commonly reported in patients with bicuspid aortic valve (BAV) and has been related to flow abnormalities and genetic predisposition. AoD-related complications are reported to be extremely rare in children. Conversely, an overestimate of AoD related to body size may lead to excess diagnoses and negatively impact quality of life and an active lifestyle. In the present study, we compared the diagnosis performance of the newly introduced Q-score (based on a machine-learning algorithm) versus the traditional Z-score in a large consecutive pediatric cohort with BAV. Materials and methods: Prevalence and progression of AoD were evaluated in 281 pediatric patients ages > 5 and < 18 years at first observation, 249 of whom had isolated BAV and 32 had BAV associated with aortic coarctation (CoA–BAV). An additional group of 24 pediatric patients with isolated CoA was considered. Measurements were made at the level of the aortic annulus, Valsalva sinuses, sinotubular aorta, and proximal ascending aorta. Both Z-scores using traditional nomograms and the new Q-score were calculated at baseline and at followup (mean 4.5 years). Results: A dilation of the proximal ascending aorta was suggested by traditional nomograms (Z-score > 2) in 31.2% of patients with isolated BAV and 18.5% with CoA–BAV at baseline and in 40.7% and 33.3%, respectively, at followup. No significant dilation was found in patients with isolated CoA. Using the new Q-score calculator, ascending aorta dilation was detected in 15.4% of patients with BAV and 18.5% with CoA–BAV at baseline and in 15.8% and 3.7%, respectively, at followup. AoD was significantly related to the presence and degree of aortic stenosis (AS) but not to aortic regurgitation (AR). No AoD-related complications occurred during the followup. Conclusions: Our data confirm the presence of ascending aorta dilation in a consistent subgroup of pediatric patients with isolated BAV, with progression during followup, while AoD was less common when CoA was associated with BAV. A positive correlation was found with the prevalence and degree of AS, but not with AR. Finally, the nomograms used may significantly influence the prevalence of AoD, especially in children, with a possible overestimation by traditional nomograms. This concept requires prospective validation in long-term followup. Full article
(This article belongs to the Special Issue Thoracic Aortic Disease: From Bench to Bedside)
Show Figures

Figure 1

Figure 1
<p>Schematic morphology of bicuspid aortic valve as seen by parasternal short-axis echocardiographic view. RC = right cusp, LC = left cusp, NC = noncoronary cusp. (<b>A</b>): fused type with right–left cusp fusion; (<b>B</b>): fused type with right noncoronary cusp fusion; (<b>C</b>): fused type with left noncoronary cusp fusion; (<b>D</b>): 2-sinus type with latero–lateral phenotype; (<b>E</b>): 2-sinus type with anteroposterior phenotype.</p>
Full article ">Figure 2
<p>Prevalence of aortic dilation in the 2 groups of patients at baseline and followup; <span class="html-italic">p</span> &lt; 0.0001 for both comparisons. BAV = bicuspid aortic valve; CoA = aortic coarctation.</p>
Full article ">
10 pages, 1098 KiB  
Article
Laboratory Assessment of Unfractionated Heparin (UFH) with Activated Clotting Time (ACT) and Anti-Xa Activity during Peripheral Arterial Angiographic Procedure
by Tuukka Helin, Tomi Tirri, Heidi Korkala, Kimmo Lappalainen and Lotta Joutsi-Korhonen
Diagnostics 2023, 13(8), 1489; https://doi.org/10.3390/diagnostics13081489 - 20 Apr 2023
Cited by 1 | Viewed by 1625
Abstract
Activated clotting time (ACT) is used in cardiac surgery for monitoring unfractionated heparin (UFH). In endovascular radiology, ACT use is less established. We aimed to test the validity of ACT in UFH monitoring in endovascular radiology. We recruited 15 patients undergoing endovascular radiologic [...] Read more.
Activated clotting time (ACT) is used in cardiac surgery for monitoring unfractionated heparin (UFH). In endovascular radiology, ACT use is less established. We aimed to test the validity of ACT in UFH monitoring in endovascular radiology. We recruited 15 patients undergoing endovascular radiologic procedure. ACT was measured with ICT Hemochron® device as point-of-care (1) before standard UFH bolus, (2) immediately after the bolus, and in some cases (3) 1 h into the procedure or a combination thereof (altogether 32 measurements). A total of two different cuvettes, ACT-LR and ACT+ were tested. A reference method of chromogenic anti-Xa was used. Blood count, APTT, thrombin time and antithrombin activity were also measured. UFH levels (anti-Xa) varied between 0.3–2.1 IU/mL (median 0.8) and correlated with ACT-LR moderately (R2 = 0.73). The corresponding ACT-LR values were 146–337 s (median 214). ACT-LR and ACT+ measurements correlated only modestly with one another at this lower UFH level, with ACT-LR being more sensitive. Thrombin time and APTT were unmeasurably high after the UFH dose, rendering them of limited use in this indication. We adopted an ACT target of >200–250 s in endovascular radiology based on this study. While ACT correlation with anti-Xa is suboptimal, the readily available point-of-care nature increases its suitability. Full article
(This article belongs to the Section Point-of-Care Diagnostics and Devices)
Show Figures

Figure 1

Figure 1
<p>Correlation between activated clotting time (ACT, Hemochron<sup>®</sup>) and UFH level measured with anti-FXa (IL<sup>®</sup>), <span class="html-italic">n</span> = 32 different measurement points in 15 patients after IV heparin treatment undergoing peripheral arterial angiographic procedure. Correlation with low-range ACT-LR measurement, R<sup>2</sup> = 0.73. Correlation with high-range ACT+-measurement, R<sup>2</sup> = 0.70.</p>
Full article ">Figure 2
<p>ACT-LR and ACT+ (Hemochron <sup>®</sup>) correlated with one another fairly well R<sup>2</sup> = 0.70 (<b>a</b>). ACT-LR was consistently more prolonged than ACT+ when measured in parallel. Differences increased after heparin bolus, Bland–Altmann plot with mean for difference (solid line) and ± 1,96 SD (dashed lines) are shown (<b>b</b>).</p>
Full article ">Figure 3
<p>UFH level measured with chromogenic anti-FXa (IU/mL) after 5000 IU bolus and weight of the patient (kg), UFH level after 5000 IU UFH bolus. The correlation between patient weight and anti-Xa measurement was poor (A), R<sup>2</sup> = 0.38. The correlation with ACT-LR measurement was even poorer R<sup>2</sup> = 0.22.</p>
Full article ">
20 pages, 12587 KiB  
Review
Update on the Applications of Radiomics in Diagnosis, Staging, and Recurrence of Intrahepatic Cholangiocarcinoma
by Maria Chiara Brunese, Maria Rita Fantozzi, Roberta Fusco, Federica De Muzio, Michela Gabelloni, Ginevra Danti, Alessandra Borgheresi, Pierpaolo Palumbo, Federico Bruno, Nicoletta Gandolfo, Andrea Giovagnoni, Vittorio Miele, Antonio Barile and Vincenza Granata
Diagnostics 2023, 13(8), 1488; https://doi.org/10.3390/diagnostics13081488 - 20 Apr 2023
Cited by 10 | Viewed by 2415
Abstract
Background: This paper offers an assessment of radiomics tools in the evaluation of intrahepatic cholangiocarcinoma. Methods: The PubMed database was searched for papers published in the English language no earlier than October 2022. Results: We found 236 studies, and 37 satisfied our research [...] Read more.
Background: This paper offers an assessment of radiomics tools in the evaluation of intrahepatic cholangiocarcinoma. Methods: The PubMed database was searched for papers published in the English language no earlier than October 2022. Results: We found 236 studies, and 37 satisfied our research criteria. Several studies addressed multidisciplinary topics, especially diagnosis, prognosis, response to therapy, and prediction of staging (TNM) or pathomorphological patterns. In this review, we have covered diagnostic tools developed through machine learning, deep learning, and neural network for the recurrence and prediction of biological characteristics. The majority of the studies were retrospective. Conclusions: It is possible to conclude that many performing models have been developed to make differential diagnosis easier for radiologists to predict recurrence and genomic patterns. However, all the studies were retrospective, lacking further external validation in prospective and multicentric cohorts. Furthermore, the radiomics models and the expression of results should be standardized and automatized to be applicable in clinical practice. Full article
Show Figures

Figure 1

Figure 1
<p>Combined hepatocellular cholangiocarcinoma MRI assessment: the lesion (arrow) shown in T2-W sequence (<b>A</b>); targetoid appearance, with restricted diffusion in b800 s/mm<sup>2</sup> (<b>B</b>); and progressive contrast enhancement during contrast study (arterial phase (<b>C</b>) and portal phase (<b>D</b>)).</p>
Full article ">Figure 2
<p>Flowchart of included and excluded studies.</p>
Full article ">Figure 3
<p>US and CEUS assessment of ICC: On US (<b>A</b>), the lesion (arrow) shows iso-hypoechoic pattern compared to hepatic parenchymal. During arterial phase (<b>B</b>), the lesion shows arterial hyperenhancement (arrow), with washout (arrow) in portal phase (<b>C</b>).</p>
Full article ">Figure 4
<p>CT assessment of ICC (arrow) during arterial (<b>A</b>) and portal (<b>B</b>) phase of contrast study. The lesion (arrow) shows an infiltrative pattern with biliary tree dilatation.</p>
Full article ">Figure 5
<p>ICC MRI assessment. The lesion (arrow) shows hypointense signal in T2-W sequence (<b>A</b>) due to fibrotic tissue, with targetoid appearance in DWI (<b>B</b>) and ADC map (<b>C</b>) and progressive contrast enhancement during arterial (<b>D</b>), portal (<b>E</b>), and delay (<b>F</b>) phases of contrast study.</p>
Full article ">Figure 6
<p>MRI assessment of periductal-infiltrating CCA. The lesion (arrow) shows hyperintense signal in T2-W (<b>A</b>), causing biliary tree dilatation in cholangiography sequences (<b>B</b>). During arterial phase (<b>C</b>), the lesion causes hyperenhancement of surrounding liver parenchymal, showing a progressive contrast enhancement in portal phase (<b>D</b>).</p>
Full article ">
17 pages, 10461 KiB  
Article
Automatic Segmentation of Teeth, Crown–Bridge Restorations, Dental Implants, Restorative Fillings, Dental Caries, Residual Roots, and Root Canal Fillings on Orthopantomographs: Convenience and Pitfalls
by Emel Gardiyanoğlu, Gürkan Ünsal, Nurullah Akkaya, Seçil Aksoy and Kaan Orhan
Diagnostics 2023, 13(8), 1487; https://doi.org/10.3390/diagnostics13081487 - 20 Apr 2023
Cited by 7 | Viewed by 2860
Abstract
Background: The aim of our study is to provide successful automatic segmentation of various objects on orthopantomographs (OPGs). Methods: 8138 OPGs obtained from the archives of the Department of Dentomaxillofacial Radiology were included. OPGs were converted into PNGs and transferred to the segmentation [...] Read more.
Background: The aim of our study is to provide successful automatic segmentation of various objects on orthopantomographs (OPGs). Methods: 8138 OPGs obtained from the archives of the Department of Dentomaxillofacial Radiology were included. OPGs were converted into PNGs and transferred to the segmentation tool’s database. All teeth, crown–bridge restorations, dental implants, composite–amalgam fillings, dental caries, residual roots, and root canal fillings were manually segmented by two experts with the manual drawing semantic segmentation technique. Results: The intra-class correlation coefficient (ICC) for both inter- and intra-observers for manual segmentation was excellent (ICC > 0.75). The intra-observer ICC was found to be 0.994, while the inter-observer reliability was 0.989. No significant difference was detected amongst observers (p = 0.947). The calculated DSC and accuracy values across all OPGs were 0.85 and 0.95 for the tooth segmentation, 0.88 and 0.99 for dental caries, 0.87 and 0.99 for dental restorations, 0.93 and 0.99 for crown–bridge restorations, 0.94 and 0.99 for dental implants, 0.78 and 0.99 for root canal fillings, and 0.78 and 0.99 for residual roots, respectively. Conclusions: Thanks to faster and automated diagnoses on 2D as well as 3D dental images, dentists will have higher diagnosis rates in a shorter time even without excluding cases. Full article
(This article belongs to the Section Machine Learning and Artificial Intelligence in Diagnostics)
Show Figures

Figure 1

Figure 1
<p>Manual segmentation process of the dental implants. Note the precision for the dental implant’s grove segmentation in order to achieve higher accuracy and DSC.</p>
Full article ">Figure 2
<p>Automatic segmentation of the teeth. Manual segmentation (<b>upper image</b>) and automatic segmentation (<b>lower image</b>) can be seen above. Each tooth has a unique label according to FDI World Dental Federation notation.</p>
Full article ">Figure 3
<p>Automatic segmentation of the carious lesions at the upper-left second molar and lower-right first molar. Manual segmentation (<b>left</b>) as well as automatic segmentation (<b>right</b>) can be seen above.</p>
Full article ">Figure 4
<p>Automatic segmentation of the bridges. Manual segmentation (<b>upper image</b>) and automatic segmentation (<b>lower image</b>) can be seen above.</p>
Full article ">Figure 5
<p>Automatic segmentation of dental implants. Manual segmentation (<b>upper image</b>) and automatic segmentation (<b>lower image</b>) can be seen above.</p>
Full article ">Figure 6
<p>Automatic segmentation of root-canal fillings. Manual segmentation (<b>upper image</b>) and automatic segmentation (<b>lower image</b>) can be seen above.</p>
Full article ">Figure 7
<p>Automatic segmentation of residual roots. Manual segmentation (<b>upper image</b>) and automatic segmentation (<b>lower image</b>) can be seen above.</p>
Full article ">Figure 8
<p>Erroneous automatic segmentation at the maxillary left third molar due to the superimposition between the maxillary sinus floor and root apices of the tooth. Manual segmentation (<b>upper image</b>) and automatic segmentation (<b>lower image</b>) can be seen above.</p>
Full article ">Figure 9
<p>Erroneous automatic segmentation at the mandibular left second molar due to the superimposition between the mandibular left first and mandibular left second premolars. Manual segmentation (<b>upper image</b>) and automatic segmentation (<b>lower image</b>) can be seen above.</p>
Full article ">Figure 10
<p>A wide amalgam restoration in the mandibular left first premolar tooth was mis-segmented as a crown restoration. Manual segmentation (<b>upper image</b>) and automatic segmentation (<b>lower image</b>) can be seen above.</p>
Full article ">Figure 11
<p>Crown–abutment and implant parts of a dental implant with a crown (<b>left</b>). Manual segmentation of the dental implant (<b>middle</b>) and automatic segmentation of the dental implant (<b>right</b>). Note that the abutment part and the superior portion of the implant were not segmented by our model in this case.</p>
Full article ">Figure 12
<p>Imperfect segmentation of a gutta-percha is seen at the mandibular left first molar tooth’s mesial root. Manual segmentation (<b>upper image</b>) and automatic segmentation (<b>lower image</b>) can be seen above.</p>
Full article ">
7 pages, 1176 KiB  
Interesting Images
Neurofibromatosis Symptom-Lacking B-Cell Lineage Acute Lymphoblastic Leukemia with Only an NF1 Gene Pathogenic Variant
by Zehwan Kim and Jong Ho Lee
Diagnostics 2023, 13(8), 1486; https://doi.org/10.3390/diagnostics13081486 - 20 Apr 2023
Cited by 1 | Viewed by 1421
Abstract
Next-generation sequencing technology has improved molecular genetic analysis, and many molecular genetic studies have been utilized for diagnostic classification, risk stratification, and prognosis prediction of acute lymphoblastic leukemia (ALL). Inactivation of neurofibromin or Nf1, a protein derived from the NF1 gene, causes Ras [...] Read more.
Next-generation sequencing technology has improved molecular genetic analysis, and many molecular genetic studies have been utilized for diagnostic classification, risk stratification, and prognosis prediction of acute lymphoblastic leukemia (ALL). Inactivation of neurofibromin or Nf1, a protein derived from the NF1 gene, causes Ras pathway regulation failure, which is related to leukemogenesis. Pathogenic variants of the NF1 gene in B-cell lineage ALL are uncommon, and in this study, we reported a pathogenic variant that is not registered in any public database. The patient diagnosed with B-cell lineage ALL had no clinical symptoms of neurofibromatosis. Studies on the biology, diagnosis, and treatment of this uncommon disease, as well as other related hematologic neoplasms, such as acute myeloid leukemia and juvenile myelomonocytic leukemia, were reviewed. Biological studies included epidemiological differences among age intervals and pathways for leukemia, such as the Ras pathway. Diagnostic studies included cytogenetic, FISH, and molecular tests for leukemia-related genes and ALL classification, such as Ph-like ALL or BCR-ABL1-like ALL. Treatment studies included pathway inhibitors and chimeric antigen cell receptor T-cells. Resistance mechanisms related to leukemia drugs were also investigated. We believe that these literature reviews will enhance medical care for the uncommon diagnosis of B-cell lineage ALL. Full article
(This article belongs to the Section Pathology and Molecular Diagnostics)
Show Figures

Figure 1

Figure 1
<p>Bone marrow hematological cells from aspirate smear sample. The number of small- to medium-sized blasts with scant cytoplasm increased in up to 98% of absolute nucleated cells and the number of megakaryocytes and their precursors decreased. The granulocytic series and the erythroid series cells were also suppressed. (Wright stain, ×1000).</p>
Full article ">Figure 2
<p>Screen capture of the Integrative Genomic Viewer tool. It shows the content of the Binary Alignment Map (BAM) file, obtained from NGS study, from the position 29,588,800 to 29,588,895 (hg19 version reference genome) of chromosome 17. The block arrow and box indicates the indel variant NM_001042492.2(NF1):c.4691_4698delinsGGCCCTCCC. The BAM file was generated by Illumina MiSeq Dx system, which uses hybridization with oligonucleotide probes for target enrichment.</p>
Full article ">Figure 3
<p>Corresponding indel variant via Sanger sequencing. The same indel variant as in <a href="#diagnostics-13-01486-f002" class="html-fig">Figure 2</a> can be confirmed by its forward sequence with the indel variant (red arrow and box) and the reverse sequence with the indel variant (blue arrow and box). We conclude that the variant is somatic because of the following four reasons. Initially, we could not find any neurofibromatosis symptom including café-au-lait spots, freckling, or multiple cutaneous neurofibromas. However, pathogenic germline <span class="html-italic">NF1</span> mutation has almost 100% penetrance to neurofibromatosis [<a href="#B9-diagnostics-13-01486" class="html-bibr">9</a>]. Therefore, we thought the patient did not have the variant before the onset of the leukemia. Secondly, neurofibromatosis is an autosomal dominant inherited disorder [<a href="#B9-diagnostics-13-01486" class="html-bibr">9</a>]. This fact also lowers the possibility of germline mutation. Thirdly, variant allele frequency (VAF) of the found <span class="html-italic">NF1</span> gene variant was 80%, which is not around 50% for heterozygous nor around 100% for homozygous germline variants. Finally, Sanger sequencing shows overlapped sequences which are the mix of wild-type sequence and the indel variant-induced sequence (in the red as well as blue boxes). If the variant is germline heterozygous, the overlapped sequence (in the red and blue boxes) should show that some nucleotides have almost the same amplitude of the two difference sequences. If the variant is germline homozygous, the overlapped sequence (in the red and blue boxes) should show only one indel variant-induced sequence. The found <span class="html-italic">NF1</span> variant c.4691_4698delins(p.Leu1564Argfs*7) was an indel one, which consists of 8 base-pair deletion followed by 9 base-pair insertion. It causes frame-shift during translation from mRNA to protein and it introduces stop-codon after 7 codons. The result is the formation of a truncated Nf1 protein.</p>
Full article ">
21 pages, 2976 KiB  
Article
Metaverse and Medical Diagnosis: A Blockchain-Based Digital Twinning Approach Based on MobileNetV2 Algorithm for Cervical Vertebral Maturation
by Omid Moztarzadeh, Mohammad (Behdad) Jamshidi, Saleh Sargolzaei, Fatemeh Keikhaee, Alireza Jamshidi, Shabnam Shadroo and Lukas Hauer
Diagnostics 2023, 13(8), 1485; https://doi.org/10.3390/diagnostics13081485 - 20 Apr 2023
Cited by 20 | Viewed by 2586
Abstract
Advanced mathematical and deep learning (DL) algorithms have recently played a crucial role in diagnosing medical parameters and diseases. One of these areas that need to be more focused on is dentistry. This is why creating digital twins of dental issues in the [...] Read more.
Advanced mathematical and deep learning (DL) algorithms have recently played a crucial role in diagnosing medical parameters and diseases. One of these areas that need to be more focused on is dentistry. This is why creating digital twins of dental issues in the metaverse is a practical and effective technique to benefit from the immersive characteristics of this technology and adapt the real world of dentistry to the virtual world. These technologies can create virtual facilities and environments for patients, physicians, and researchers to access a variety of medical services. Experiencing an immersive interaction between doctors and patients can be another considerable advantage of these technologies, which can dramatically improve the efficiency of the healthcare system. In addition, offering these amenities through a blockchain system enhances reliability, safety, openness, and the ability to trace data exchange. It also brings about cost savings through improved efficiencies. In this paper, a digital twin of cervical vertebral maturation (CVM), which is a critical factor in a wide range of dental surgery, within a blockchain-based metaverse platform is designed and implemented. A DL method has been used to create an automated diagnosis process for the upcoming CVM images in the proposed platform. This method includes MobileNetV2, a mobile architecture that improves the performance of mobile models in multiple tasks and benchmarks. The proposed technique of digital twinning is simple, fast, and suitable for physicians and medical specialists, as well as for adapting to the Internet of Medical Things (IoMT) due to its low latency and computing costs. One of the important contributions of the current study is to use of DL-based computer vision as a real-time measurement method so that the proposed digital twin does not require additional sensors. Furthermore, a comprehensive conceptual framework for creating digital twins of CVM based on MobileNetV2 within a blockchain ecosystem has been designed and implemented, showing the applicability and suitability of the introduced approach. The high performance of the proposed model on a collected small dataset demonstrates that low-cost deep learning can be used for diagnosis, anomaly detection, better design, and many more applications of the upcoming digital representations. In addition, this study shows how digital twins can be performed and developed for dental issues with the lowest hardware infrastructures, reducing the costs of diagnosis and treatment for patients. Full article
(This article belongs to the Section Medical Imaging and Theranostics)
Show Figures

Figure 1

Figure 1
<p>A sample of lateral cephalometric radiographs.</p>
Full article ">Figure 2
<p>(<b>a</b>) The first stage. The inferior borders of the second, third, and fourth cervical vertebrae are flat and without indent; (<b>b</b>) the second stage. An indentation appeared on the inferior border of the second cervical vertebral, while the third and fourth ones are flat; (<b>c</b>) the third stage. A notch appears on the inferior border of the second and third cervical vertebrae; (<b>d</b>) the fourth stage. All three cervical bodies are indented.</p>
Full article ">Figure 3
<p>(<b>a</b>) The fifth stage. The bodies of the third and fourth cervical vertebrae are square in shape; (<b>b</b>) the sixth stage. The bodies of the third and fourth cervical vertebrae are rectangular in form.</p>
Full article ">Figure 4
<p>An illustration of a basic blockchain platform implementation for the system.</p>
Full article ">Figure 5
<p>(<b>a</b>) Mean and standard deviation of all five folds’ losses per epoch; (<b>b</b>) mean and standard deviation of all five folds’ accuracies per epoch.</p>
Full article ">Figure 6
<p>The confusion matrix for the validation sets of the (<b>a</b>) first, (<b>b</b>) second, (<b>c</b>) third, (<b>d</b>) fourth, and (<b>e</b>) fifth folds show that the number of false positives is greater than false negatives in all cases. Despite this, the consistency of false and true values suggests that the model is effectively identifying indicators for the sixth stage. It can be concluded that, with more data points, the number of false positives could be reduced significantly given that the only variable between each fold is the training and validation set.</p>
Full article ">Figure 7
<p>Receiver operating characteristic (ROC) curve for each fold. The mean ROC is shown in blue color.</p>
Full article ">
28 pages, 6757 KiB  
Article
COVID-19 Diagnosis in Computerized Tomography (CT) and X-ray Scans Using Capsule Neural Network
by Andronicus A. Akinyelu and Bubacarr Bah
Diagnostics 2023, 13(8), 1484; https://doi.org/10.3390/diagnostics13081484 - 20 Apr 2023
Cited by 4 | Viewed by 1313
Abstract
This study proposes a deep-learning-based solution (named CapsNetCovid) for COVID-19 diagnosis using a capsule neural network (CapsNet). CapsNets are robust for image rotations and affine transformations, which is advantageous when processing medical imaging datasets. This study presents a performance analysis of CapsNets on [...] Read more.
This study proposes a deep-learning-based solution (named CapsNetCovid) for COVID-19 diagnosis using a capsule neural network (CapsNet). CapsNets are robust for image rotations and affine transformations, which is advantageous when processing medical imaging datasets. This study presents a performance analysis of CapsNets on standard images and their augmented variants for binary and multi-class classification. CapsNetCovid was trained and evaluated on two COVID-19 datasets of CT images and X-ray images. It was also evaluated on eight augmented datasets. The results show that the proposed model achieved classification accuracy, precision, sensitivity, and F1-score of 99.929%, 99.887%, 100%, and 99.319%, respectively, for the CT images. It also achieved a classification accuracy, precision, sensitivity, and F1-score of 94.721%, 93.864%, 92.947%, and 93.386%, respectively, for the X-ray images. This study presents a comparative analysis between CapsNetCovid, CNN, DenseNet121, and ResNet50 in terms of their ability to correctly identify randomly transformed and rotated CT and X-ray images without the use of data augmentation techniques. The analysis shows that CapsNetCovid outperforms CNN, DenseNet121, and ResNet50 when trained and evaluated on CT and X-ray images without data augmentation. We hope that this research will aid in improving decision making and diagnostic accuracy of medical professionals when diagnosing COVID-19. Full article
(This article belongs to the Special Issue AI and Big Data in Healthcare)
Show Figures

Figure 1

Figure 1
<p>The proposed CapsNet architecture (CapsNetCovid).</p>
Full article ">Figure 2
<p>Samples of standard and augmented CT images used for training.</p>
Full article ">Figure 3
<p>Samples of standard and augmented X-ray images used for training.</p>
Full article ">Figure 4
<p>CapsNetCovid training and validation performance.</p>
Full article ">Figure 5
<p>CapsNet ROC curves for CT images.</p>
Full article ">Figure 6
<p>CNN training and validation performance.</p>
Full article ">Figure 7
<p>DenseNet121 training and validation performance.</p>
Full article ">Figure 8
<p>ResNet50 training and validation performance.</p>
Full article ">Figure 9
<p>CNN ROC curves for CT images.</p>
Full article ">Figure 10
<p>DesNet121 ROC curves for CT images.</p>
Full article ">Figure 11
<p>ResNet50 ROC curves for CT images.</p>
Full article ">Figure 12
<p>CapsNet training and validation performance for X-ray images.</p>
Full article ">Figure 13
<p>CapsNet ROC curves for X-ray images.</p>
Full article ">Figure 14
<p>CNN training and validation performance for X-ray images.</p>
Full article ">Figure 15
<p>DenseNet121 training and validation performance for X-ray images.</p>
Full article ">Figure 16
<p>ResNet50 training and validation performance for X-ray images.</p>
Full article ">Figure 17
<p>CNN ROC curves for X-ray images.</p>
Full article ">Figure 18
<p>DesNet121 ROC curves for X-ray images.</p>
Full article ">Figure 19
<p>ResNet50 ROC curves for X-ray images.</p>
Full article ">
10 pages, 280 KiB  
Article
PAH Pathogenic Variants and Clinical Correlations in a Group of Hyperphenylalaninemia Patients from North-Western Romania
by Alin Iuhas, Claudia Jurca, Kinga Kozma, Anca-Lelia Riza, Ioana Streață, Codruța Petcheși, Andra Dan, Cristian Sava, Andreea Balmoș, Cristian Marinău, Larisa Niulaș, Mihai Ioana and Marius Bembea
Diagnostics 2023, 13(8), 1483; https://doi.org/10.3390/diagnostics13081483 - 20 Apr 2023
Cited by 6 | Viewed by 1335
Abstract
Phenylketonuria (PKU) is caused by mutations in the phenylalanine hydroxylase (PAH) gene and is characterized by altered amino acid metabolism. More than 1500 known PAH variants intricately determine a spectrum of metabolic phenotypes. We aim to report on clinical presentation and [...] Read more.
Phenylketonuria (PKU) is caused by mutations in the phenylalanine hydroxylase (PAH) gene and is characterized by altered amino acid metabolism. More than 1500 known PAH variants intricately determine a spectrum of metabolic phenotypes. We aim to report on clinical presentation and PAH variants identified in 23 hyperphenylalaninemia (HPA)/PKU Romanian patients. Our cohort exhibited classic PKU (73.9%, 17/23), mild PKU (17.4%, 4/23), and mild HPA (8.7%, 2/23). Severe central nervous system sequelae are frequent in our cohort in late-diagnosis symptomatic patients, which highlights yet again the significance of an early dietary treatment, neonatal screening and diagnosis, and facilitated access to treatment. Next-generation sequencing (NGS) identified a total of 11 PAH pathogenic variants, all previously reported, mostly missense changes (7/11) in important catalytic domains. c.1222C>T p.Arg408Trp was the most frequent variant, with an allele frequency of 56.5%. Twelve distinct genotypes were identified, the most frequent of which was p.Arg408Trp/p.Arg408Trp (34.8%, 8/23). Compound heterozygous genotypes were common (13/23), three of which had not been previously reported to the best of our knowledge; two correlated with cPKU and one showed an mPKU phenotype. Generally, there are genotype–phenotype correlation overlaps with the public data reported in BIOPKUdb; as our study shows, clinical correlates are subject to variation, in part due to uncontrolled or unknown epigenetic or environmental regulatory factors. We highlight the importance of establishing the genotype on top of using blood phenylalanine levels. Full article
(This article belongs to the Special Issue Diagnosis of Neonatal Diseases)
10 pages, 2476 KiB  
Article
Comparison of a Presbyopia-Correcting Supplementary Intraocular Lens Combination and a Capsular-Bag Lens: An In Vitro Study
by Ramin Khoramnia, Isabella Diana Baur, Weijia Yan, Grzegorz Łabuz and Gerd Uwe Auffarth
Diagnostics 2023, 13(8), 1482; https://doi.org/10.3390/diagnostics13081482 - 20 Apr 2023
Cited by 2 | Viewed by 1438
Abstract
We evaluated the optical quality of two approaches to trifocality: polypseudophakia versus monopseudophakia. The combination (polypseudophakia) of a monofocal Basis Z B1AWY0 and AddOn Trifocal A4DW0M intraocular lens (IOL) was compared to using one Basis Z Trifocal B1EWYN IOL, all from 1stQ GmbH. [...] Read more.
We evaluated the optical quality of two approaches to trifocality: polypseudophakia versus monopseudophakia. The combination (polypseudophakia) of a monofocal Basis Z B1AWY0 and AddOn Trifocal A4DW0M intraocular lens (IOL) was compared to using one Basis Z Trifocal B1EWYN IOL, all from 1stQ GmbH. In both approaches, we measured modulation transfer function (MTF) and Strehl Ratio (SR) values at 3.0 and 4.5 mm pupil sizes. We determined the through-focus (TF) MTF at 25, 50 and 100 lp/mm for the 3 mm aperture. United States Air Force (USAF) target images were recorded. MTF measurement of the trifocal lens and the combined monofocal and trifocal AddOn IOL showed good performance at the far and near focus for the 3 mm aperture. For the 4.5 mm aperture the MTF improved for the far focus but decreased for the intermediate and near focus. TF MTF showed better contrast at the far focus for the polypseudophakic setup but at the expense of the efficiency at the near focus. However, the USAF chart images revealed only minimal differences between both approaches. The optical quality of the polypseudophakic approach was not affected by the presence of two IOLs instead of one and proved to be comparable with the performance of one capsular-bag-fixated trifocal IOL. Differences between the single vs. two-lens approach seen in the TF MTF analysis could be attributed to the optical design that varied between the trifocal models. Full article
(This article belongs to the Section Pathology and Molecular Diagnostics)
Show Figures

Figure 1

Figure 1
<p>The three IOL models studied. The Basis Z and Basis Z trifocal share the same platform with C-loop haptics and are implanted in the capsular bag. The AddOn trifocal features a square design with four haptics and is implanted into the ciliary sulcus.</p>
Full article ">Figure 2
<p>The modulation transfer function (MTF) of the monofocal, and single-lens trifocal and Mono-AddOn measured at a 3 and 4.5 mm pupil. The dotted lines show the values of each lens separately, the solid lines refer to the average of two IOLs.</p>
Full article ">Figure 3
<p>Strehl Ratio as a function of defocus. A higher Strehl Ratio indicates a better optical quality. Both the trifocal and AddOn IOL showed two peaks, corresponding to the far and near focus.</p>
Full article ">Figure 4
<p>USAF target images recorded at the far, intermediate and near focus and apertures 3 mm and 4.5 mm.</p>
Full article ">Figure 5
<p>The through-focus modulation transfer function (MTF) of the single-lens trifocal and Mono + AddOn IOLs at 25, 50 and 100 lp/mm for the 3 mm aperture.</p>
Full article ">
22 pages, 8484 KiB  
Review
Endocardial Fibroelastosis as an Independent Predictor of Atrioventricular Valve Rupture in Maternal Autoimmune Antibody Exposed Fetus: A Systematic Review with Clinicopathologic Analysis
by Monika Kantilal Kotecha, Khurshid Merchant, Charmaine Jiahui Chan, Jonathan Tze Liang Choo, Krishna Revanna Gopagondanahalli, Dyan Zhewei Zhang, Teng Hong Tan and Sreekanthan Sundararaghavan
Diagnostics 2023, 13(8), 1481; https://doi.org/10.3390/diagnostics13081481 - 20 Apr 2023
Cited by 1 | Viewed by 1941
Abstract
Background: Neonatal lupus (NL) is a clinical syndrome that develops in the fetus as a result of maternal autoimmune antibodies. Congenital complete heart block (CHB) is the most common manifestation, while extranodal cardiac manifestations of NL, such as endocardial fibroelastosis (EFE) and myocarditis, [...] Read more.
Background: Neonatal lupus (NL) is a clinical syndrome that develops in the fetus as a result of maternal autoimmune antibodies. Congenital complete heart block (CHB) is the most common manifestation, while extranodal cardiac manifestations of NL, such as endocardial fibroelastosis (EFE) and myocarditis, are rare but more serious. Less is known about this atrioventricular valve rupture due to valvulitis as a consequence of maternal autoantibodies. We have described a case of cardiac neonatal lupus with an antenatally detected CHB patient who developed mitral and tricuspid valve chordal rupture at 45 days of age. We compared the cardiac histopathology and the fetal cardiac echocardiographic findings of this case with another fetus that was aborted after being antenatally diagnosed with CHB but without valvar rupture. A narrative analysis after a systematic review of the literature regarding atrioventricular valve apparatus rupture due to autoimmune etiology along with maternal characteristics, presentation, treatment, and outcome have been discussed in this article. Objectives: To describe published data on atrioventricular valve rupture in neonatal lupus, including clinical presentation, diagnostic evaluation, management, and outcomes. Methods: We conducted a PRISMA-compliant descriptive systematic examination of case reports that included accounts of lupus during pregnancy or in the newborn period that resulted in an atrioventricular valve rupture. We gathered information on the patient’s demographics, the details of the valve rupture and other comorbidities, the maternal therapy, the clinical course, and the results. We also used a standardized method to evaluate the cases’ quality. A total of 12 cases were investigated, with 11 cases drawn from 10 case reports or case series and 1 from our own experience. Results: Tricuspid valve rupture (50%) is more common than mitral valve rupture (17%). Unlike mitral valve rupture, which occurs postnatally, the timing of tricuspid valve rupture is perinatal. A total of 33% of the patients had concomitant complete heart block, while 75% of the patients had endocardial fibroelastosis on an antenatal ultrasound. Antenatal changes pertaining to endocardial fibroelastosis can be seen as early as 19 weeks of gestation. Patients with both valve ruptures generally have a poor prognosis, especially if they occur at close intervals. Conclusion: Atrioventricular valve rupture in neonatal lupus is rare. A majority of patients with valve rupture had antenatally detected endocardial fibroelastosis in the valvar apparatus. Appropriate and expedited surgical repair of ruptured atrioventricular valves is feasible and has a low mortality risk. Rupture of both atrioventricular valves occurring at close intervals carries a high mortality risk. Full article
(This article belongs to the Special Issue Critical Care Imaging)
Show Figures

Figure 1

Figure 1
<p>Case A: (<b>a</b>) M-mode echocardiogram showing atrioventricular dissociation; ‘a’ shows atrial contractions and ‘V’ shows ventricular contractions. (<b>b</b>) Antenatal echocardiogram, four-chamber view, showing hyperechoic papillary muscles (white arrow) in the left ventricle (LV) and right ventricle (RV). RA—right atrium, LA—left atrium. (<b>c</b>) Antenatal echocardiogram, four-chamber view, showing mild tricuspid regurgitation (white arrow) and no mitral regurgitation with normal atrioventricular valves.</p>
Full article ">Figure 2
<p>Case A—Postnatal electrocardiogram showing complete heart block. There is complete atrioventricular dissociation, an atrial rate of 125 bpm, and a ventricular rate of 52 bpm.</p>
Full article ">Figure 3
<p>Case A: (<b>a</b>) Postnatal echocardiogram—four-chamber view showing normal mitral and tricuspid valves. Hyperechoic papillary muscles (yellow arrow) were noted. RA—right atrium, LA—left atrium, RV—right ventricle, LV—left ventricle. (<b>b</b>) Immediate postnatal echocardiogram, long axis view, showing no regurgitation of the mitral valve. Ao—Aorta. (<b>c</b>) Postnatal echocardiogram, short axis at the level just below the mitral valve, showing hyperechoic papillary muscles in the left (bottom) and right (top) ventricles (white arrow).</p>
Full article ">Figure 4
<p>Case A: (<b>a</b>) Echocardiogram, four-chamber view with color doppler showing severe tricuspid regurgitation (pink arrow) and severe mitral regurgitation (green arrow) noted on day 45 of life. (<b>b</b>) Echocardiogram, four-chamber view, demonstrating ruptured chordae resulting in prolapse of tricuspid valve leaflets (white arrow) and mitral valve leaflets (pink arrow). *—Pericardial effusion. (<b>c</b>) 2D and color doppler long axis views of the mitral valve showing valve prolapse (pink arrow in 2D image) and severe mitral valve regurgitation (white arrow in color image) (<b>d</b>) Modified long axis view on a 2D echocardiogram, showing rupture of the tricuspid valve chordae (pink arrow) and severe tricuspid regurgitation (white arrow). (<b>e</b>) Echocardiogram, four-chamber view of ruptured mitral valve leaflet chordae causing mitral valve prolapse (white arrow). (<b>f</b>) X-plane color doppler image on a 2D echocardiogram showing severe mitral regurgitation (black arrow).</p>
Full article ">Figure 5
<p>Case B: (<b>a</b>) M-mode echocardiogram showing atrioventricular dissociation in the fetus. A—atrial contractions; V—ventricular contractions. (<b>b</b>) Echocardiogram, four-chamber view—hyperechoic papillary muscle (white arrow in RV and LV).</p>
Full article ">Figure 6
<p>(<b>a</b>) Case A—postmortem gross morphology: mitral valve with ruptured chordae of the anterior leaflet of the mitral valve resulting in shrunken leaflets (black arrow). Calcified chordae (blue arrow). (<b>b</b>) Case A—postmortem gross morphology: mitral valve with retraction and loss of leaflet tissue (black arrow). Calcified/fibrotic chordae (brown arrow). (<b>c</b>) Case B—postmortem gross morphology: left ventricle showing normal mitral valve leaflets (*). Fibrotic/calcified chordae and papillary muscle tips (black arrows).</p>
Full article ">Figure 7
<p>Case A: (<b>a</b>) Hematoxylin and eosin-stained section (original magnification 4×) of the left ventricular papillary muscle with calcified tip (green arrow). *—ruptured chordae showing fibrosis. (<b>b</b>) Hematoxylin and eosin-stained section (original magnification 10×) of the atrioventricular node area with calcification (green arrow) and fibrosis (*). (<b>c</b>) Hematoxylin and eosin-stained section (original magnification 20×) of the myocardium (black arrow) and pericardium (light blue arrow) showing extensive subpericardial calcification (green arrow) extending to the myocardium. (<b>d</b>) Hematoxylin and eosin-stained section (original magnification 10×) of the coronary artery (black arrow), which showed no inflammation.</p>
Full article ">Figure 8
<p>Case B: (<b>a</b>) Hematoxylin and eosin-stained section of the atrioventricular node (original magnification 10×)—calcification (black arrow), fibrosis (*), granulation tissue with neovascularization (red arrow). (<b>b</b>) Hematoxylin and eosin-stained section (original magnification 10×) of the atrioventricular node—acute inflammatory changes with granulation tissue (*), multinucleated giant cell (black arrow). (<b>c</b>) Hematoxylin and eosin-stained section (original magnification 4×) of the right ventricular papillary muscle with chordae. (<b>d</b>) Hematoxylin and eosin-stained section (original magnification 10×) of the right ventricular papillary muscle with chordae, fibrosis (green arrow), and calcification (black arrow).</p>
Full article ">Figure 9
<p>PRISMA flow diagram for systemic review.</p>
Full article ">Figure 10
<p>(<b>a</b>) Venn diagram showing tricuspid valve rupture (TV) in 50% (<span class="html-italic">n</span> = 6), mitral valve rupture (MV) in 17% (<span class="html-italic">n</span> = 2), and both mitral and tricuspid valve rupture (MV+TV) in 33% (<span class="html-italic">n</span> = 4). (<b>b</b>) Target chart showing patients with valve rupture (<span class="html-italic">n</span> = 12), of whom 75% (<span class="html-italic">n</span> = 9) had changes of endocardial fibroelastosis (EFE) reported and 33% (<span class="html-italic">n</span>= 4) had complete heart block (CHB).</p>
Full article ">Figure 11
<p>Pie chart showing mothers who received no antenatal therapy (<span class="html-italic">n</span> = 5), steroids only (<span class="html-italic">n</span> = 4), and intravenous immunoglobulin (IVIG) and steroids (<span class="html-italic">n</span> = 3).</p>
Full article ">Figure 12
<p>Bar chart showing the timing of rupture for the tricuspid valve (TV) and mitral valve (MV). X-axis: age of valve rupture from 34 to 40 weeks antenatal and subsequently postnatal. Y-axis: number of patients.</p>
Full article ">Figure 13
<p>Bar chart showing valve involvement (blue) and mortality (orange). X-axis represents the valve involved. Y-axis shows the number of patients.</p>
Full article ">
7 pages, 1213 KiB  
Case Report
Nevus Sebaceous of Jadassohn in Adults—Can Reflectance Confocal Microscopy Detect Malignant Transformation?
by Vlad Mihai Voiculescu, Ana Maria Celarel, Elena Codruta Cozma, Madalina Laura Banciu and Mihai Lupu
Diagnostics 2023, 13(8), 1480; https://doi.org/10.3390/diagnostics13081480 - 20 Apr 2023
Cited by 1 | Viewed by 3493
Abstract
Nevus sebaceous of Jadassohn (NSJ) is a rare congenital lesion that affects the adnexal structures of the skin. It is typically located on the scalp and face of females and presents as a well-defined, slightly elevated, yellow lesion. It is also linked to [...] Read more.
Nevus sebaceous of Jadassohn (NSJ) is a rare congenital lesion that affects the adnexal structures of the skin. It is typically located on the scalp and face of females and presents as a well-defined, slightly elevated, yellow lesion. It is also linked to a high risk of secondary tumors, which are more frequently benign than malignant. In vivo reflectance confocal microscopy (RCM) is a non-invasive imaging technique that provides a horizontal image of the skin with a resolution similar to histology. We report a case of basal cell carcinoma (BCC) developed in an NSJ with its dermoscopic, confocal, and histopathological features. A 49-year-old female presented with a well-circumscribed, 1 cm-diameter verrucous, yellowish lesion surrounded by a poorly defined, slightly erythematous, translucent plaque, located on the scalp in the temporoparietal region, which had been present since birth, grew at puberty, and changed its appearance in the last three years. Dermoscopy of the central lesion revealed yellow globules grouped into clusters, with peripheral linear and arborescent thin vessels, surrounded by several translucent nodular lesions with fine, arborizing vessels. RCM examination showed large, monomorphic cells with a hyperreflective periphery and a hyperreflective center located on the central lesion, corresponding to sebocytes, surrounded by multiple dark silhouettes lined with hyperreflective bands of thickened collagen, corresponding to tumor islands. The histopathological findings confirmed the diagnosis of BCC developed on an NJS. RCM can be a useful technique for the non-invasive examination and monitoring of these lesions, taking into account their transformation risk and preventing unnecessary excisions that might have a detrimental aesthetic impact on patients. Full article
(This article belongs to the Section Medical Imaging and Theranostics)
Show Figures

Figure 1

Figure 1
<p>Clinical and dermoscopic aspects of the lesion. (<b>A</b>) A yellowish, verrucous lesion surrounded by a poorly defined, erythematous plaque on the scalp (temporoparietal area) of a 49 year-old female. (<b>B</b>) A close-up of the lesion from panel (<b>A</b>) (the dermoscopy of the main lesion is depicted in panel (<b>C</b>) and the dermoscopy of the lesion in the blue square is illustrated in panel (<b>D</b>)). (<b>C</b>) Dermoscopy of the central lesion showing globules aggregated in clusters and fine peripheral linear, serpiginous, and arborizing vessels. The vessels do not cross the central region of the tumor. Multiple yellow dots are observed on the surface of the lesion. (<b>D</b>) Dermoscopy of a nodular lesion in the proximity of the central one reveals a pink, poorly defined nodular lesion with fine, arborizing vessels that cross the central surface of the lesion and fade towards the periphery.</p>
Full article ">Figure 2
<p>Histopathological and confocal microscopy images of the lesion. (<b>A</b>) A histopathological image showing nodular proliferation composed of islands of basaloid cells (red asterisks) with peripheral palisading (red arrows). Deep apocrine glands can also be seen (black square). (<b>B</b>) A close-up of the perilesional skin showing acanthosis (yellow asterisks) and sebaceous glands (black arrows). Hematoxylin-eosin stain, original magnification: (<b>A</b>) ×20; (<b>B</b>) ×40. (<b>C</b>) Confocal images showing large, monomorphic, hyperreflective cells with a hyperreflective center corresponding to sebocytes (red arrowheads). (<b>D</b>) Confocal microscopy image showing dark silhouettes corresponding to tumor islands (white asterisks) and hyperreflective collagen bundles surrounding tumor islands (yellow arrows).</p>
Full article ">
13 pages, 12821 KiB  
Article
A CT-Based Radiomics Model for Prediction of Prognosis in Patients with Novel Coronavirus Disease (COVID-19) Pneumonia: A Preliminary Study
by Lizhen Duan, Longjiang Zhang, Guangming Lu, Lili Guo, Shaofeng Duan and Changsheng Zhou
Diagnostics 2023, 13(8), 1479; https://doi.org/10.3390/diagnostics13081479 - 19 Apr 2023
Cited by 1 | Viewed by 1505
Abstract
This study aimed to develop a computed tomography (CT)-based radiomics model to predict the outcome of COVID-19 pneumonia. In total of 44 patients with confirmed diagnosis of COVID-19 were retrospectively enrolled in this study. The radiomics model and subtracted radiomics model were developed [...] Read more.
This study aimed to develop a computed tomography (CT)-based radiomics model to predict the outcome of COVID-19 pneumonia. In total of 44 patients with confirmed diagnosis of COVID-19 were retrospectively enrolled in this study. The radiomics model and subtracted radiomics model were developed to assess the prognosis of COVID-19 and compare differences between the aggravate and relief groups. Each radiomic signature consisted of 10 selected features and showed good performance in differentiating between the aggravate and relief groups. The sensitivity, specificity, and accuracy of the first model were 98.1%, 97.3%, and 97.6%, respectively (AUC = 0.99). The sensitivity, specificity, and accuracy of the second model were 100%, 97.3%, and 98.4%, respectively (AUC = 1.00). There was no significant difference between the models. The radiomics models revealed good performance for predicting the outcome of COVID-19 in the early stage. The CT-based radiomic signature can provide valuable information to identify potential severe COVID-19 patients and aid clinical decisions. Full article
Show Figures

Figure 1

Figure 1
<p>Workflow of the radiomics method. An experienced radiologist segmented the region of interest (ROI) of the lesions. Features were selected to build models. The receiver operating characteristic (ROC) was used to demonstrate diagnostic efficiency of the models.</p>
Full article ">Figure 2
<p>The <span class="html-italic">p</span> values of the 10 feature parameters and corresponding coefficients after screening in the first model are shown in this Manhattan plot.</p>
Full article ">Figure 3
<p>(<b>A</b>) AUC barplot showing AUCs of the features used in the first model. (<b>B</b>) The 10 feature parameters and corresponding coefficients after screening in the first model are shown in a heatmap.</p>
Full article ">Figure 4
<p>The <span class="html-italic">p</span> values of the 10 feature parameters and corresponding coefficients after screening in the second model are shown in this Manhattan plot.</p>
Full article ">Figure 5
<p>(<b>A</b>) AUC barplot showing AUCs of features used in the second model. (<b>B</b>) The 10 feature parameters and corresponding coefficients after screening in the second model in a heatmap.</p>
Full article ">Figure 6
<p>The differences in wavelet_LLH_firstorder_Variance between relief and aggravate groups.</p>
Full article ">Figure 7
<p>The differences of original_firstorder_TotalEnergy between relief and aggravate groups.</p>
Full article ">Figure 8
<p>The 10 feature parameters and corresponding coefficients after screening in the first model.</p>
Full article ">Figure 9
<p>The 10 feature parameters and corresponding coefficients after screening in the second model.</p>
Full article ">Figure 10
<p>Receiver operating characteristic (ROC) curve for the first model. The AUC (area under the ROC) was 0.99 for the model.</p>
Full article ">Figure 11
<p>Receiver operating characteristic (ROC) curve for the second model. The AUC (area under the ROC) was 1.00 for the model.</p>
Full article ">
Previous Issue
Next Issue
Back to TopTop