[go: up one dir, main page]

Next Issue
Volume 13, March-1
Previous Issue
Volume 13, February-1


Diagnostics, Volume 13, Issue 4 (February-2 2023) – 237 articles

Cover Story (view full-size image): 
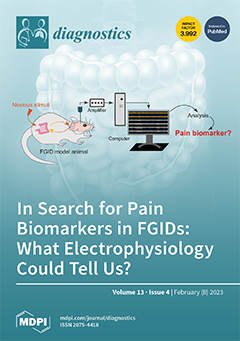
Abdominal pain is prevalent in GI disorders. Pain signals actively shape brain dynamics, and disturbance of oscillatory brain activity is associated with GI disorders. However, the precise mechanisms are still in their early infancy. In this issue, Drs. Alam and Chen highlighted extracellular electrophysiology as an emerging tool capable of capturing brain signals across different brain regions with high spatiotemporal resolution. This method permits monitoring neuronal firing patterns and comparative characterization of the brain oscillations in awake-behaving animals. Future works in this field might provide better insight into identifying pain biomarkers in FGIDs. This method may also reveal the role of gut–brain communication in patients with neurological disorders such as Alzheimer’s disease. View this paper
  • Issues are regarded as officially published after their release is announced to the table of contents alert mailing list.
  • You may sign up for e-mail alerts to receive table of contents of newly released issues.
  • PDF is the official format for papers published in both, html and pdf forms. To view the papers in pdf format, click on the "PDF Full-text" link, and use the free Adobe Reader to open them.
Order results
Result details
Section
Select all
Export citation of selected articles as:
25 pages, 6387 KiB  
Article
Multi-Techniques for Analyzing X-ray Images for Early Detection and Differentiation of Pneumonia and Tuberculosis Based on Hybrid Features
by Ibrahim Abdulrab Ahmed, Ebrahim Mohammed Senan, Hamzeh Salameh Ahmad Shatnawi, Ziad Mohammad Alkhraisha and Mamoun Mohammad Ali Al-Azzam
Diagnostics 2023, 13(4), 814; https://doi.org/10.3390/diagnostics13040814 - 20 Feb 2023
Cited by 17 | Viewed by 2817
Abstract
An infectious disease called tuberculosis (TB) exhibits pneumonia-like symptoms and traits. One of the most important methods for identifying and diagnosing pneumonia and tuberculosis is X-ray imaging. However, early discrimination is difficult for radiologists and doctors because of the similarities between pneumonia and [...] Read more.
An infectious disease called tuberculosis (TB) exhibits pneumonia-like symptoms and traits. One of the most important methods for identifying and diagnosing pneumonia and tuberculosis is X-ray imaging. However, early discrimination is difficult for radiologists and doctors because of the similarities between pneumonia and tuberculosis. As a result, patients do not receive the proper care, which in turn does not prevent the disease from spreading. The goal of this study is to extract hybrid features using a variety of techniques in order to achieve promising results in differentiating between pneumonia and tuberculosis. In this study, several approaches for early identification and distinguishing tuberculosis from pneumonia were suggested. The first proposed system for differentiating between pneumonia and tuberculosis uses hybrid techniques, VGG16 + support vector machine (SVM) and ResNet18 + SVM. The second proposed system for distinguishing between pneumonia and tuberculosis uses an artificial neural network (ANN) based on integrating features of VGG16 and ResNet18, before and after reducing the high dimensions using the principal component analysis (PCA) method. The third proposed system for distinguishing between pneumonia and tuberculosis uses ANN based on integrating features of VGG16 and ResNet18 separately with handcrafted features extracted by local binary pattern (LBP), discrete wavelet transform (DWT) and gray level co-occurrence matrix (GLCM) algorithms. All the proposed systems have achieved superior results in the early differentiation between pneumonia and tuberculosis. An ANN based on the features of VGG16 with LBP, DWT and GLCM (LDG) reached an accuracy of 99.6%, sensitivity of 99.17%, specificity of 99.42%, precision of 99.63%, and an AUC of 99.58%. Full article
Show Figures

Figure 1

Figure 1
<p>The framework of the structure for the proposed systems for the diagnosis of X-rays of pneumonia and tuberculosis, and for distinguishing between them.</p>
Full article ">Figure 2
<p>Samples from the pneumonia and tuberculosis data set. (<b>a</b>). Before improving the X-rays. (<b>b</b>). After improving the X-rays.</p>
Full article ">Figure 3
<p>Structure framework of the hybrid system for early diagnosis and discrimination between pneumonia and tuberculosis.</p>
Full article ">Figure 4
<p>The structure of the early diagnosis technique and the discrimination of pneumonia and tuberculosis by ANN, based on the fusion of CNN features.</p>
Full article ">Figure 5
<p>Structure framework of the technique for early diagnosis and discrimination of pneumonia and tuberculosis by ANN, based on the fusion of CNN features with hand-crafted features.</p>
Full article ">Figure 6
<p>The number of X-rays of pneumonia and tuberculosis in the data set before and after applying the data augmentation technique.</p>
Full article ">Figure 7
<p>The performance of the hybrid methods for diagnosing the X-rays of the pneumonia and tuberculosis data set.</p>
Full article ">Figure 8
<p>The confusion matrix displays the X-ray results for diagnosing pneumonia and tuberculosis using (<b>a</b>). VGG16 + SVM; (<b>b</b>). ResNet18 + SVM.</p>
Full article ">Figure 9
<p>The ANN performance based on integrating the features for the X-ray diagnostics of the pneumonia and tuberculosis data set.</p>
Full article ">Figure 10
<p>Confusion matrix displaying the ANN results for the diagnosis of X-rays of pneumonia and tuberculosis based on deep feature integration, (<b>a</b>). VGG16 + ResNet18 before PCA algorithm; (<b>b</b>). VGG16 + ResNet18 after PCA algorithm.</p>
Full article ">Figure 11
<p>The error histogram for diagnosing the X-ray images of pneumonia and tuberculosis using the ANN with features (<b>a</b>). VGG16 and LDG; (<b>b</b>). ResNet18 and LDG.</p>
Full article ">Figure 12
<p>The best validation performance for diagnosing X-ray images of pneumonia and tuberculosis using the ANN with features (<b>a</b>). VGG16 and LDG; (<b>b</b>). ResNet18 and LDG.</p>
Full article ">Figure 13
<p>The GVC for diagnosing X-ray images of pneumonia and tuberculosis using the ANN with features (<b>a</b>). VGG16 and LDG; (<b>b</b>). ResNet18 and LDG.</p>
Full article ">Figure 14
<p>Confusion matrix for diagnosing the X-ray images of pneumonia and tuberculosis using the ANN with features (<b>a</b>). VGG16 and LDG; (<b>b</b>). ResNet18 and LDG.</p>
Full article ">Figure 15
<p>ANN achievement based on fusing the features of CNN with hand-crafted features for diagnosing the X-rays of the pneumonia and tuberculosis data set.</p>
Full article ">Figure 16
<p>The execution and differentiation of the proposed methods for diagnosing the X-rays of the pneumonia and tuberculosis data set.</p>
Full article ">
15 pages, 2637 KiB  
Hypothesis
From Pathogens to Cancer: Are Cancer Cells Evolved Mitochondrial Super Cells?
by Mario G. Balzanelli, Pietro Distratis, Rita Lazzaro, Van Hung Pham, Raffaele Del Prete, Adriana Mosca, Francesco Inchingolo, Sergey K. Aityan, Luigi Santacroce, Kieu C. D. Nguyen and Ciro Gargiulo Isacco
Diagnostics 2023, 13(4), 813; https://doi.org/10.3390/diagnostics13040813 - 20 Feb 2023
Cited by 2 | Viewed by 2271
Abstract
Life is based on a highly specific combination of atoms, metabolism, and genetics which eventually reflects the chemistry of the Universe which is composed of hydrogen, oxygen, nitrogen, sulfur, phosphorus, and carbon. The interaction of atomic, metabolic, and genetic cycles results in the [...] Read more.
Life is based on a highly specific combination of atoms, metabolism, and genetics which eventually reflects the chemistry of the Universe which is composed of hydrogen, oxygen, nitrogen, sulfur, phosphorus, and carbon. The interaction of atomic, metabolic, and genetic cycles results in the organization and de-organization of chemical information of that which we consider as living entities, including cancer cells. In order to approach the problem of the origin of cancer it is therefore reasonable to start from the assumption that the sub-molecular level, the atomic structure, should be the considered starting point on which metabolism, genetics, and external insults eventually emanate. Second, it is crucial to characterize which of the entities and parts composing human cells may live a separate life; certainly, this theoretical standpoint would consider mitochondria, an organelle of “bacteria” origin embedded in conditions favorable for the onset of both. This organelle has not only been tolerated by immunity but has also been placed as a central regulator of cell defense. Virus, bacteria, and mitochondria are also similar in the light of genetic and metabolic elements; they share not only equivalent DNA and RNA features but also many basic biological activities. Thus, it is important to finalize that once the cellular integrity has been constantly broken down, the mitochondria like any other virus or bacteria return to their original autonomy to simply survive. The Warburg’s law that states the ability of cancers to ferment glucose in the presence of oxygen, indicates mitochondria respiration abnormalities may be the underlying cause of this transformation towards super cancer cells. Though genetic events play a key part in altering biochemical metabolism, inducing aerobic glycolysis, this is not enough to impair mitochondrial function since mitochondrial biogenesis and quality control are constantly upregulated in cancers. While some cancers have mutations in the nuclear-encoded mitochondrial tricarboxylic acid (TCA) cycle, enzymes that produce oncogenic metabolites, there is also a bio-physic pathway for pathogenic mitochondrial genome mutations. The atomic level of all biological activities can be considered the very beginning, marked by the electron abnormal behavior that consequently affects DNA of both cells and mitochondria. Whilst the cell’s nucleus DNA after a certain number of errors and defection tends to gradually switch off, the mitochondria DNA starts adopting several escape strategies, switching-on a few important genes that belong back at their original roots as independent beings. The ability to adopt this survival trick, by becoming completely immune to current life-threatening events, is probably the beginning of a differentiation process towards a “super-power cell”, the cancer cells that remind many pathogens, including virus, bacteria, and fungi. Thus, here, we present a hypothesis regarding those changes that first begin at the mitochondria atomic level to steadily involve molecular, tissue and organ levels in response to the virus or bacteria constant insults that drive a mitochondria itself to become an “immortal cancer cell”. Improved insights into this interplay between these pathogens and mitochondria progression may disclose newly epistemological paradigms as well as innovative procedures in targeting cancer cell progressive invasion. Full article
(This article belongs to the Section Pathology and Molecular Diagnostics)
Show Figures

Figure 1

Figure 1
<p>The picture represents the unstable atomic compound of mitochondria, the structure of the matter is indicated by the precise order of electrons and nuclei in atoms and molecules and is based on electron spin as a crucial moment which has physical significance in chemistry. When atoms tend to lose electrons, the red spheres, they start being negatively charged becoming unstable as ROS (Gargiulo Isacco Ciro and Nguyen CD Kieu).</p>
Full article ">Figure 2
<p>The “Endo-symbiotic Theory of Mitochondrial Evolution” states that mitochondria originally evolved from aerobic bacteria that were incorporated into eukaryotic cells. The mitochondria in response to pathogens return to their original state as independent bacteria and upon constant insults switch into cancer cells to survive the aggression.</p>
Full article ">Figure 3
<p>Pathogens as virus or bacteria may start a chain of events that trigger the mitochondria reverse process which takes place on multiple levels, initiating from the atomic compartment of both cell and mitochondria nuclei.</p>
Full article ">Figure 4
<p>The cancer microenvironment is depicted as chaotic system characterized by an extremely high consumption of energy which in turns produces an increasing level of disorder of the biostructures which is reflected by the huge amount of Ca<sup>2+</sup> and Mg<sup>2++</sup> accumulated within the cancer intracellular compartment.</p>
Full article ">
16 pages, 4925 KiB  
Review
Meta-Analysis of Cardiovascular Risk Factors in Offspring of Preeclampsia Pregnancies
by Weikai Wang, Ru Lin, Lan Yang, Yanxia Wang, Baohong Mao, Xiaoying Xu and Jing Yu
Diagnostics 2023, 13(4), 812; https://doi.org/10.3390/diagnostics13040812 - 20 Feb 2023
Cited by 5 | Viewed by 1697
Abstract
This study aimed to assess cardiovascular risk factors in the offspring of preeclampsia (PE) pregnancies. PubMed, Web of Science, Ovid, and other foreign language databases, as well as SinoMed, China National Knowledge Infrastructure, Wanfang, and China Science and Technology Journal Databases, were searched. [...] Read more.
This study aimed to assess cardiovascular risk factors in the offspring of preeclampsia (PE) pregnancies. PubMed, Web of Science, Ovid, and other foreign language databases, as well as SinoMed, China National Knowledge Infrastructure, Wanfang, and China Science and Technology Journal Databases, were searched. The case-control studies on cardiovascular risk factors in the offspring of PE pregnancies from 1 January 2010 to 31 December 2019 were collected. A random-effects model or a fixed-effects model was used, and RevMan 5.3 software was used for meta-analysis to determine the OR value and 95%CI of each cardiovascular risk factor. A total of 16 documents were included in this research, all of which were case-control studies, with a total of 4046 cases in the experimental group and 31,505 in the control group. The meta-analysis that was conducted demonstrated that SBP [MD = 1.51, 95%CI (1.15, 1.88)] and DBP [MD = 1.90, 95%CI (1.69, 2.10)] values in the PE pregnancy offspring group presented an elevation relative to the non-PE pregnancy offspring group. The total cholesterol value in the PE pregnancy offspring group presented an elevation relative to the non-PE pregnancy offspring group [MD = 0.11, 95%CI (0.08, 0.13)]. The low-density lipoprotein cholesterol value in the PE pregnancy offspring group was comparable to that in the non-PE pregnancy offspring group [MD = 0.01, 95%CI (−0.02, 0.05)]. The high-density lipoprotein cholesterol value in the PE pregnancy offspring group presented an elevation relative to the non-PE pregnancy offspring group [MD = 0.02, 95%CI (0.01, 0.03)]. The non-HDL cholesterol value in the PE pregnancy offspring group presented an elevation relative to the non-PE pregnancy offspring group [MD = 0.16, 95%CI (0.13, 0.19)]. The triglycerides [MD = −0.02, 95%CI (−0.03, −0.01)] and glucose [MD = −0.08, 95%CI (−0.09, −0.07)] values in the PE pregnancy offspring group presented a depletion relative to the non-PE pregnancy group. The insulin value in the PE pregnancy offspring group presented a depletion relative to the non-PE pregnancy offspring group [MD = −0.21, 95%CI (−0.32, −0.09)]. The BMI value in the PE pregnancy offspring group presented an elevation relative to the non-PE pregnancy offspring group [MD = 0.42, 95%CI (0.27, 0.57)]. In conclusion, dyslipidemia, elevated blood pressure, and increased BMI occur postpartum with PE, all of which are risk factors for cardiovascular diseases. Full article
(This article belongs to the Special Issue Implementing AI in Diagnosis of Cardiovascular Diseases)
Show Figures

Figure 1

Figure 1
<p>The flowchart of the literature retrieval and screening.</p>
Full article ">Figure 2
<p>Meta-analysis forest map for systolic blood pressure of offspring of PE pregnancies. Geelhoed 2010, [<a href="#B17-diagnostics-13-00812" class="html-bibr">17</a>]; Pierre 2010, [<a href="#B18-diagnostics-13-00812" class="html-bibr">18</a>]; Kvehaugen 2010, [<a href="#B16-diagnostics-13-00812" class="html-bibr">16</a>]; Fugelseth 2011, [<a href="#B19-diagnostics-13-00812" class="html-bibr">19</a>]; Lawlor 2011, [<a href="#B20-diagnostics-13-00812" class="html-bibr">20</a>]; Kvehaugen 2011, [<a href="#B21-diagnostics-13-00812" class="html-bibr">21</a>]; Fraser 2013, [<a href="#B24-diagnostics-13-00812" class="html-bibr">24</a>]; Miettola 2013, [<a href="#B23-diagnostics-13-00812" class="html-bibr">23</a>]; Alsnes 2014, [<a href="#B25-diagnostics-13-00812" class="html-bibr">25</a>]; Davis 2015, [<a href="#B26-diagnostics-13-00812" class="html-bibr">26</a>]; Reveret 2015, [<a href="#B27-diagnostics-13-00812" class="html-bibr">27</a>]; Alsnes 2017, [<a href="#B25-diagnostics-13-00812" class="html-bibr">25</a>]; Gürlek 2019 [<a href="#B29-diagnostics-13-00812" class="html-bibr">29</a>].</p>
Full article ">Figure 3
<p>Meta-analysis forest map for diastolic blood pressure of offspring of PE pregnancies. Pierre 2010, [<a href="#B18-diagnostics-13-00812" class="html-bibr">18</a>]; Geelhoed 2010, [<a href="#B17-diagnostics-13-00812" class="html-bibr">17</a>]; Kvehaugen 2010, [<a href="#B16-diagnostics-13-00812" class="html-bibr">16</a>]; Lawlor 2011, [<a href="#B20-diagnostics-13-00812" class="html-bibr">20</a>]; Kvehaugen 2011, [<a href="#B21-diagnostics-13-00812" class="html-bibr">21</a>]; Fugelseth 2011, [<a href="#B19-diagnostics-13-00812" class="html-bibr">19</a>]; Miettola 2013, [<a href="#B23-diagnostics-13-00812" class="html-bibr">23</a>]; Fraser 2013, [<a href="#B24-diagnostics-13-00812" class="html-bibr">24</a>]; Alsnes 2014, [<a href="#B25-diagnostics-13-00812" class="html-bibr">25</a>]; Reveret 2015, [<a href="#B27-diagnostics-13-00812" class="html-bibr">27</a>]; Davis 2015, [<a href="#B26-diagnostics-13-00812" class="html-bibr">26</a>]; Alsnes 2017, [<a href="#B25-diagnostics-13-00812" class="html-bibr">25</a>]; Gürlek 2019 [<a href="#B29-diagnostics-13-00812" class="html-bibr">29</a>].</p>
Full article ">Figure 4
<p>Meta-analysis forest map for total cholesterol of offspring of PE pregnancies. Akcakus 2010 [<a href="#B14-diagnostics-13-00812" class="html-bibr">14</a>]; Lazdam 2010 [<a href="#B15-diagnostics-13-00812" class="html-bibr">15</a>]; Lazdam 2012 [<a href="#B22-diagnostics-13-00812" class="html-bibr">22</a>]; Fraser 2013, [<a href="#B24-diagnostics-13-00812" class="html-bibr">24</a>]; Miettola 2013, [<a href="#B23-diagnostics-13-00812" class="html-bibr">23</a>]; Alsnes 2014, [<a href="#B25-diagnostics-13-00812" class="html-bibr">25</a>]; Davis 2015, [<a href="#B26-diagnostics-13-00812" class="html-bibr">26</a>].</p>
Full article ">Figure 5
<p>Meta-analysis forest map for low-density lipoprotein cholesterol of offspring of PE pregnancies. Akcakus 2010 [<a href="#B14-diagnostics-13-00812" class="html-bibr">14</a>]; Lazdam 2010 [<a href="#B15-diagnostics-13-00812" class="html-bibr">15</a>]; Lazdam 2012 [<a href="#B22-diagnostics-13-00812" class="html-bibr">22</a>]; Fraser 2013, [<a href="#B24-diagnostics-13-00812" class="html-bibr">24</a>]; Miettola 2013, [<a href="#B23-diagnostics-13-00812" class="html-bibr">23</a>]; Davis 2015, [<a href="#B26-diagnostics-13-00812" class="html-bibr">26</a>].</p>
Full article ">Figure 6
<p>Meta-analysis forest map for high-density lipoprotein cholesterol of offspring of PE pregnancies. Lazdam 2010 [<a href="#B15-diagnostics-13-00812" class="html-bibr">15</a>]; Akcakus 2010 [<a href="#B14-diagnostics-13-00812" class="html-bibr">14</a>]; Lawlor 2011, [<a href="#B20-diagnostics-13-00812" class="html-bibr">20</a>]; Miettola 2013, [<a href="#B23-diagnostics-13-00812" class="html-bibr">23</a>]; Fraser 2013, [<a href="#B24-diagnostics-13-00812" class="html-bibr">24</a>]; Alsnes 2014, [<a href="#B25-diagnostics-13-00812" class="html-bibr">25</a>]; Davis 2015, [<a href="#B26-diagnostics-13-00812" class="html-bibr">26</a>]; Alsnes 2017, [<a href="#B28-diagnostics-13-00812" class="html-bibr">28</a>].</p>
Full article ">Figure 7
<p>Meta-analysis forest map for non-HDL cholesterol of offspring of PE pregnancies. Lawlor 2011, [<a href="#B20-diagnostics-13-00812" class="html-bibr">20</a>]; Alsnes 2014, [<a href="#B25-diagnostics-13-00812" class="html-bibr">25</a>]; Alsnes 2017, [<a href="#B28-diagnostics-13-00812" class="html-bibr">28</a>].</p>
Full article ">Figure 8
<p>Meta-analysis forest map for triglycerides of offspring of PE pregnancies. Lazdam 2010 [<a href="#B15-diagnostics-13-00812" class="html-bibr">15</a>]; Akcakus 2010 [<a href="#B14-diagnostics-13-00812" class="html-bibr">14</a>]; Lawlor 2011, [<a href="#B20-diagnostics-13-00812" class="html-bibr">20</a>]; Lazdam 2012 [<a href="#B22-diagnostics-13-00812" class="html-bibr">22</a>]; Fraser 2013 [<a href="#B24-diagnostics-13-00812" class="html-bibr">24</a>]; Miettola 2013, [<a href="#B23-diagnostics-13-00812" class="html-bibr">23</a>]; Davis 2015, [<a href="#B26-diagnostics-13-00812" class="html-bibr">26</a>]; Alsnes 2017, [<a href="#B28-diagnostics-13-00812" class="html-bibr">28</a>].</p>
Full article ">Figure 9
<p>Meta-analysis forest map for glucose of offspring of PE pregnancies. Kvehaugen 2010, [<a href="#B16-diagnostics-13-00812" class="html-bibr">16</a>]; Lazdam 2010 [<a href="#B15-diagnostics-13-00812" class="html-bibr">15</a>]; Lazdam 2012 [<a href="#B22-diagnostics-13-00812" class="html-bibr">22</a>]; Fraser 2013 [<a href="#B24-diagnostics-13-00812" class="html-bibr">24</a>]; Miettola 2013, [<a href="#B23-diagnostics-13-00812" class="html-bibr">23</a>]; Alsnes 2014, [<a href="#B25-diagnostics-13-00812" class="html-bibr">25</a>]; Davis 2015, [<a href="#B26-diagnostics-13-00812" class="html-bibr">26</a>].</p>
Full article ">Figure 10
<p>Meta-analysis forest map for insulin of offspring of PE pregnancies. Lazdam 2010 [<a href="#B15-diagnostics-13-00812" class="html-bibr">15</a>]; Lazdam 2012 [<a href="#B22-diagnostics-13-00812" class="html-bibr">22</a>]; Fraser 2013 [<a href="#B24-diagnostics-13-00812" class="html-bibr">24</a>]; Miettola 2013, [<a href="#B23-diagnostics-13-00812" class="html-bibr">23</a>]; Davis 2015, [<a href="#B26-diagnostics-13-00812" class="html-bibr">26</a>].</p>
Full article ">Figure 11
<p>Meta-analysis forest map for BMI of offspring of PE pregnancies. Kvehaugen 2010, [<a href="#B16-diagnostics-13-00812" class="html-bibr">16</a>]; Pierre 2010, [<a href="#B18-diagnostics-13-00812" class="html-bibr">18</a>]; Lazdam 2010 [<a href="#B15-diagnostics-13-00812" class="html-bibr">15</a>]; Akcakus 2010 [<a href="#B14-diagnostics-13-00812" class="html-bibr">14</a>]; Geelhoed 2010, [<a href="#B17-diagnostics-13-00812" class="html-bibr">17</a>]; Kvehaugen 2011, [<a href="#B21-diagnostics-13-00812" class="html-bibr">21</a>]; Lawlor 2011, [<a href="#B20-diagnostics-13-00812" class="html-bibr">20</a>]; Fugelseth 2011, [<a href="#B19-diagnostics-13-00812" class="html-bibr">19</a>]; Lazdam 2012 [<a href="#B22-diagnostics-13-00812" class="html-bibr">22</a>]; Miettola 2013, [<a href="#B23-diagnostics-13-00812" class="html-bibr">23</a>]; Fraser 2013, [<a href="#B24-diagnostics-13-00812" class="html-bibr">24</a>]; Davis 2015, [<a href="#B26-diagnostics-13-00812" class="html-bibr">26</a>]; Alsnes 2017, [<a href="#B25-diagnostics-13-00812" class="html-bibr">25</a>]; Gürlek 2019 [<a href="#B29-diagnostics-13-00812" class="html-bibr">29</a>].</p>
Full article ">Figure 12
<p>Funnel plot.</p>
Full article ">
11 pages, 2915 KiB  
Article
AI: Can It Make a Difference to the Predictive Value of Ultrasound Breast Biopsy?
by Jean L. Browne, Maria Ángela Pascual, Jorge Perez, Sulimar Salazar, Beatriz Valero, Ignacio Rodriguez, Darío Cassina, Juan Luis Alcázar, Stefano Guerriero and Betlem Graupera
Diagnostics 2023, 13(4), 811; https://doi.org/10.3390/diagnostics13040811 - 20 Feb 2023
Cited by 6 | Viewed by 2126
Abstract
(1) Background: This study aims to compare the ground truth (pathology results) against the BI-RADS classification of images acquired while performing breast ultrasound diagnostic examinations that led to a biopsy and against the result of processing the same images through the AI algorithm [...] Read more.
(1) Background: This study aims to compare the ground truth (pathology results) against the BI-RADS classification of images acquired while performing breast ultrasound diagnostic examinations that led to a biopsy and against the result of processing the same images through the AI algorithm KOIOS DS TM (KOIOS). (2) Methods: All results of biopsies performed with ultrasound guidance during 2019 were recovered from the pathology department. Readers selected the image which better represented the BI-RADS classification, confirmed correlation to the biopsied image, and submitted it to the KOIOS AI software. The results of the BI-RADS classification of the diagnostic study performed at our institution were set against the KOIOS classification and both were compared to the pathology reports. (3) Results: 403 cases were included in this study. Pathology rendered 197 malignant and 206 benign reports. Four biopsies on BI-RADS 0 and two images are included. Of fifty BI-RADS 3 cases biopsied, only seven rendered cancers. All but one had a positive or suspicious cytology; all were classified as suspicious by KOIOS. Using KOIOS, 17 B3 biopsies could have been avoided. Of 347 BI-RADS 4, 5, and 6 cases, 190 were malignant (54.7%). Because only KOIOS suspicious and probably malignant categories should be biopsied, 312 biopsies would have resulted in 187 malignant lesions (60%), but 10 cancers would have been missed. (4) Conclusions: KOIOS had a higher ratio of positive biopsies in this selected case study vis-à-vis the BI-RADS 4, 5 and 6 categories. A large number of biopsies in the BI-RADS 3 category could have been avoided. Full article
(This article belongs to the Section Medical Imaging and Theranostics)
Show Figures

Figure 1

Figure 1
<p>Probability of malignant biopsies for each combination of BI-RADS and KOIOS score.</p>
Full article ">Figure 2
<p>Suspicious image rated B2 by reader because of prior benign core biopsy (usual hyperplasia) and absence of change; rated KPM by KOIOS. Our multidisciplinary committee indicated a new and wider biopsy that was performed with US guidance and vacuum assistance. Pathology reported adenosis.</p>
Full article ">Figure 3
<p>Nodule rated B3 by reader, Kpb by KOIOS. Cytology reported fibroadenoma with simple hyperplasia; biopsy rendered a fibroadenoma diagnosis.</p>
Full article ">Figure 4
<p>Nodule rated B3 by reader (no Doppler), KSS by KOIOS. Cytology reported grade 1 carcinoma. Biopsy confirmed invasive carcinoma.</p>
Full article ">Figure 5
<p>New nodule in right breast with previous carcinoma 25 years before. Rated B4a, Kbe by KOIOS. Surgery rendered a malignant fibrous histiocytoma.</p>
Full article ">Figure 6
<p>Palpable nodule rated B4b on BUS, Kbe by KOIOS. Confirmed invasive carcinoma.</p>
Full article ">Figure 7
<p>Rated B4c (B4b in mammography), KOIOS rendered a Kbe category. Pathology: chronic and acute inflammation. No signs of malignancy. Patient refused further surgery. BUS 2 years later found no significative residual lesion.</p>
Full article ">
11 pages, 666 KiB  
Article
Assessment of the Accuracy, Usability and Acceptability of a Rapid Test for the Simultaneous Diagnosis of Syphilis and HIV Infection in a Real-Life Scenario in the Amazon Region, Brazil
by Daniela Cristina Soares, Luciano Chaves Franco Filho, Herald Souza dos Reis, Yan Corrêa Rodrigues, Felipe Bonfim Freitas, Cintya de Oliveira Souza, Giseli Nogueira Damacena, Nazle Mendonça Collaço Véras, Pamela Cristina Gaspar, Adele Schwartz Benzaken, Joana da Felicidade Ribeiro Favacho, Olinda Macedo and Maria Luiza Bazzo
Diagnostics 2023, 13(4), 810; https://doi.org/10.3390/diagnostics13040810 - 20 Feb 2023
Cited by 5 | Viewed by 4221
Abstract
We field-assessed the accuracy, acceptability, and feasibility of the SD BIOLINE HIV/Syphilis Duo rapid diagnostic test in three groups: pregnant women, female sex workers (FSW), and men who have sex with men (MSM). Venous blood samples collected in the field were compared with [...] Read more.
We field-assessed the accuracy, acceptability, and feasibility of the SD BIOLINE HIV/Syphilis Duo rapid diagnostic test in three groups: pregnant women, female sex workers (FSW), and men who have sex with men (MSM). Venous blood samples collected in the field were compared with the respective gold standard methods: SD BIOLINE HIV/Syphilis Duo Treponemal Test versus FTA-abs (Wama brand) treponemal laboratory test for syphilis, and SD BIOLINE HIV/Syphilis Duo Test versus the fourth generation Genscreen Ultra HIV Ag-Ag (Bio-Rad brand) laboratory test for HIV. From a total of 529 participants, 397 (75.1%) were pregnant women, 76 (14.3%) FSW and 56 (10.6%) MSM. Sensitivity and specificity parameters of HIV were 100.0% (95% CI: 82.35–100.0%) and 100.0% (95% CI: 99.28–100.0%), respectively. Sensitivity and specificity parameters found for TP antibody detection were 95.00% (95% CI: 87.69–98.62%) and 100.0% (95% CI: 98.18–100.0%), respectively. The SD BIOLINE HIV/Syphilis Duo Test showed high acceptability among participants (85.87%) and health professionals (85.51%), as well as easy usability by professionals (91.06%). The usability of the SD BIOLINE HIV/Syphilis Duo Test kit would not be a barrier to accessing rapid testing, if the product were incorporated into the list of health service supplies. Full article
(This article belongs to the Section Point-of-Care Diagnostics and Devices)
Show Figures

Figure 1

Figure 1
<p>Key populations enrollment and testing procedures.</p>
Full article ">
14 pages, 336 KiB  
Review
Advances in the Microbiological Diagnosis of Prosthetic Joint Infections
by Maria Eugenia Portillo and Ignacio Sancho
Diagnostics 2023, 13(4), 809; https://doi.org/10.3390/diagnostics13040809 - 20 Feb 2023
Cited by 13 | Viewed by 2799
Abstract
A significant number of prosthetic joint infections (PJI) are culture-negative and/or misinterpreted as aseptic failures in spite of the correct implementation of diagnostic culture techniques, such as tissue sample processing in a bead mill, prolonged incubation time, or sonication of removed implants. Misinterpretation [...] Read more.
A significant number of prosthetic joint infections (PJI) are culture-negative and/or misinterpreted as aseptic failures in spite of the correct implementation of diagnostic culture techniques, such as tissue sample processing in a bead mill, prolonged incubation time, or sonication of removed implants. Misinterpretation may lead to unnecessary surgery and needless antimicrobial treatment. The diagnostic value of non-culture techniques has been investigated in synovial fluid, periprosthetic tissues, and sonication fluid. Different feasible improvements, such as real-time technology, automated systems and commercial kits are now available to support microbiologists. In this review, we describe non-culture techniques based on nucleic acid amplification and sequencing methods. Polymerase chain reaction (PCR) is a frequently used technique in most microbiology laboratories which allows the detection of a nucleic acid fragment by sequence amplification. Different PCR types can be used to diagnose PJI, each one requiring the selection of appropriate primers. Henceforward, thanks to the reduced cost of sequencing and the availability of next-generation sequencing (NGS), it will be possible to identify the whole pathogen genome sequence and, additionally, to detect all the pathogen sequences present in the joint. Although these new techniques have proved helpful, strict conditions need to be observed in order to detect fastidious microorganisms and rule out contaminants. Specialized microbiologists should assist clinicians in interpreting the result of the analyses at interdisciplinary meetings. New technologies will gradually be made available to improve the etiologic diagnoses of PJI, which will remain an important cornerstone of treatment. Strong collaboration among all specialists involved is essential for the correct diagnosis of PJI. Full article
(This article belongs to the Special Issue Diagnosis and Treatment of Periprosthetic Joint Infections)
Show Figures

Graphical abstract

Graphical abstract
Full article ">
20 pages, 1660 KiB  
Review
Airway Epithelium: A Neglected but Crucial Cell Type in Asthma Pathobiology
by Sabita Singh, Joytri Dutta, Archita Ray, Atmaja Karmakar and Ulaganathan Mabalirajan
Diagnostics 2023, 13(4), 808; https://doi.org/10.3390/diagnostics13040808 - 20 Feb 2023
Cited by 15 | Viewed by 2571
Abstract
The features of allergic asthma are believed to be mediated mostly through the Th2 immune response. In this Th2-dominant concept, the airway epithelium is presented as the helpless victim of Th2 cytokines. However, this Th2-dominant concept is inadequate to fill some of the [...] Read more.
The features of allergic asthma are believed to be mediated mostly through the Th2 immune response. In this Th2-dominant concept, the airway epithelium is presented as the helpless victim of Th2 cytokines. However, this Th2-dominant concept is inadequate to fill some of the vital knowledge gaps in asthma pathogenesis, like the poor correlation between airway inflammation and airway remodeling and severe asthma endotypes, including Th2-low asthma, therapy resistance, etc. Since the discovery of type 2 innate lymphoid cells in 2010, asthma researchers started believing in that the airway epithelium played a crucial role, as alarmins, which are the inducers of ILC2, are almost exclusively secreted by the airway epithelium. This underscores the eminence of airway epithelium in asthma pathogenesis. However, the airway epithelium has a bipartite functionality in sustaining healthy lung homeostasis and asthmatic lungs. On the one hand, the airway epithelium maintains lung homeostasis against environmental irritants/pollutants with the aid of its various armamentaria, including its chemosensory apparatus and detoxification system. Alternatively, it induces an ILC2-mediated type 2 immune response through alarmins to amplify the inflammatory response. However, the available evidence indicates that restoring epithelial health may attenuate asthmatic features. Thus, we conjecture that an epithelium-driven concept in asthma pathogenesis could fill most of the gaps in current asthma knowledge, and the incorporation of epithelial-protective agents to enhance the robustness of the epithelial barrier and the combative capacity of the airway epithelium against exogenous irritants/allergens may mitigate asthma incidence and severity, resulting in better asthma control. Full article
(This article belongs to the Special Issue State-of-the-Art Research on Asthma)
Show Figures

Figure 1

Figure 1
<p>A diagram that describes the concept changes that happened in asthma pathogenesis with time.</p>
Full article ">Figure 2
<p>Scheme diagram to illustrate the structural changes in the airway epithelial barrier in asthmatics compared to healthy airway epithelium. When the asthmatic airway epithelium is exposed to allergens and air pollutants, it causes disruption to the tight epithelial junction and adherens junction. This leads to heightened mucosal permeability, effectuating more inhaled particles and allergens present in the subepithelial region and promoting innate and adaptive immune responses. This is accompanied by PNEC hyperplasia, a loss of ciliated cell numbers, goblet cell metaplasia, mucus hypersecretion, the thickening of the basal membrane, subepithelial fibrosis, increased airway smooth muscle mass, and the excess deposition of extracellular matrix.</p>
Full article ">Figure 3
<p>Airway epithelia regulating epi-immune response upon allergen/pathogen exposure. Pathogens or allergens disrupt the airway epithelia. Disrupted epithelia releases alarmins (IL-25, IL-33, and TSLP). Alarmins activate dendritic cells for Th2 polarization of the immune response. On the other hand, alarmins can directly activate ILC2 cells to secret IL-4, IL-5, and IL-13 cytokines. The dysregulation of this pathway leads to asthma pathogenicity.</p>
Full article ">
18 pages, 4505 KiB  
Systematic Review
Diagnostic Performance of Two-Dimensional Ultrasound, Two-Dimensional Sonohysterography and Three-Dimensional Ultrasound in the Diagnosis of Septate Uterus—A Systematic Review and Meta-Analysis
by Juan Luis Alcázar, Isabel Carriles, María Belén Cajas, Susana Costa, Sofia Fabra, Maria Cabrero, Elena Castro, Aida Tomaizeh, María Victoria Laza, Alba Monroy, Irene Martinez, Maria Isabel Aguilar, Elena Hernani, Cristina Castellet, Agustin Oliva, María Ángela Pascual and Stefano Guerriero
Diagnostics 2023, 13(4), 807; https://doi.org/10.3390/diagnostics13040807 - 20 Feb 2023
Cited by 3 | Viewed by 1684
Abstract
Background: The septate uterus is the most common congenital uterine anomaly, and hysteroscopy is the gold standard for diagnosing it. The goal of this meta-analysis is to perform a pooled analysis of the diagnostic performance of two-dimensional transvaginal ultrasonography, two-dimensional transvaginal sonohysterography, three-dimensional [...] Read more.
Background: The septate uterus is the most common congenital uterine anomaly, and hysteroscopy is the gold standard for diagnosing it. The goal of this meta-analysis is to perform a pooled analysis of the diagnostic performance of two-dimensional transvaginal ultrasonography, two-dimensional transvaginal sonohysterography, three-dimensional transvaginal ultrasound, and three-dimensional transvaginal sonohysterography for the diagnosis of the septate uterus. Methods: Studies published between 1990 and 2022 were searched in PubMed, Scopus, and Web of Science. From 897 citations, we selected eighteen studies to include in this meta-analysis. Results: The mean prevalence of uterine septum in this meta-analysis was 27.8%. Pooled sensitivity and specificity were 83% and 99% for two-dimensional transvaginal ultrasonography (ten studies), 94% and 100% for two-dimensional transvaginal sonohysterography (eight studies), and 98% and 100% for three-dimensional transvaginal ultrasound (seven articles), respectively. The diagnostic accuracy of three-dimensional transvaginal sonohysterography was only described in two studies, and we did not calculate the pooled sensitivity and specificity for this method. Conclusion: Three-dimensional transvaginal ultrasound has the best performance capacity for the diagnosis of the septate uterus. Full article
(This article belongs to the Section Medical Imaging and Theranostics)
Show Figures

Figure 1

Figure 1
<p>Flowchart showing the study selection process, indicating the titles found in each database, the exclusion process, and the final number of articles included in the meta-analysis.</p>
Full article ">Figure 2
<p>Forest plot for sensitivity and specificity for all studies concerning the diagnostic performance of two-dimensional transvaginal ultrasonography for uterine septum detection [<a href="#B13-diagnostics-13-00807" class="html-bibr">13</a>,<a href="#B22-diagnostics-13-00807" class="html-bibr">22</a>,<a href="#B23-diagnostics-13-00807" class="html-bibr">23</a>,<a href="#B24-diagnostics-13-00807" class="html-bibr">24</a>,<a href="#B26-diagnostics-13-00807" class="html-bibr">26</a>,<a href="#B28-diagnostics-13-00807" class="html-bibr">28</a>,<a href="#B32-diagnostics-13-00807" class="html-bibr">32</a>,<a href="#B34-diagnostics-13-00807" class="html-bibr">34</a>,<a href="#B36-diagnostics-13-00807" class="html-bibr">36</a>,<a href="#B37-diagnostics-13-00807" class="html-bibr">37</a>].</p>
Full article ">Figure 3
<p>Forest plot for sensitivity and specificity for all studies concerning the diagnostic performance of two-dimensional sonohysterography for uterine septum detection [<a href="#B13-diagnostics-13-00807" class="html-bibr">13</a>,<a href="#B23-diagnostics-13-00807" class="html-bibr">23</a>,<a href="#B24-diagnostics-13-00807" class="html-bibr">24</a>,<a href="#B27-diagnostics-13-00807" class="html-bibr">27</a>,<a href="#B28-diagnostics-13-00807" class="html-bibr">28</a>,<a href="#B29-diagnostics-13-00807" class="html-bibr">29</a>,<a href="#B31-diagnostics-13-00807" class="html-bibr">31</a>,<a href="#B36-diagnostics-13-00807" class="html-bibr">36</a>].</p>
Full article ">Figure 4
<p>Summary ROC curve for the diagnostic performance of two-dimensional transvaginal ultrasonography to detect uterine septum, showing the sensitivity and specificity for each study and pooled estimation. The dashed line around the summary point estimate (red diamond) represents the 95% confidence region. The dotted line showing the 95% prediction contour corresponds to the predicted performance taking into account all individual studies.</p>
Full article ">Figure 5
<p>Summary ROC curve for the diagnostic performance of two-dimensional sonohysterography to detect uterine septum, showing the sensitivity and specificity for each study and pooled estimation. The dashed line around the summary point estimate (red diamond) represents the 95% confidence region. The dotted line showing the 95% prediction contour corresponds to the predicted performance taking into account all individual studies.</p>
Full article ">Figure 6
<p>Fagan nomogram for two-dimensional transvaginal ultrasonography. It can be observed how the test changes the pre-test probability depending on a positive or negative result.</p>
Full article ">Figure 7
<p>Fagan nomogram for two-dimensional transvaginal sonohysterography. It can be observed how the test changes the pre-test probability depending on a positive or negative result.</p>
Full article ">Figure 8
<p>Publication bias regarding two-dimensional transvaginal ultrasonography.</p>
Full article ">Figure 9
<p>Publication bias regarding two-dimensional transvaginal sonohysterography.</p>
Full article ">Figure 10
<p>Forest plot for sensitivity and specificity for all studies concerning the diagnostic performance of three-dimensional transvaginal ultrasonography for uterine septum detection [<a href="#B13-diagnostics-13-00807" class="html-bibr">13</a>,<a href="#B24-diagnostics-13-00807" class="html-bibr">24</a>,<a href="#B25-diagnostics-13-00807" class="html-bibr">25</a>,<a href="#B30-diagnostics-13-00807" class="html-bibr">30</a>,<a href="#B34-diagnostics-13-00807" class="html-bibr">34</a>,<a href="#B35-diagnostics-13-00807" class="html-bibr">35</a>,<a href="#B38-diagnostics-13-00807" class="html-bibr">38</a>].</p>
Full article ">Figure 11
<p>Summary ROC curve for the diagnostic performance of three-dimensional transvaginal ultrasonography to detect uterine septum, showing the sensitivity and specificity for each study and pooled estimation. The dashed line around the summary point estimate (red diamond) represents the 95% confidence region. The dotted line showing the 95% prediction contour corresponds to the predicted performance taking into account all individual studies.</p>
Full article ">Figure 12
<p>Fagan nomogram for three-dimensional transvaginal ultrasonography. It can be observed how the test changes the pre-test probability depending on a positive or negative result.</p>
Full article ">Figure 13
<p>Publication bias regarding three-dimensional transvaginal ultrasonography.</p>
Full article ">
14 pages, 1243 KiB  
Review
Diagnostic Performance Evaluation of Multiparametric Magnetic Resonance Imaging in the Detection of Prostate Cancer with Supervised Machine Learning Methods
by Hamide Nematollahi, Masoud Moslehi, Fahimeh Aminolroayaei, Maryam Maleki and Daryoush Shahbazi-Gahrouei
Diagnostics 2023, 13(4), 806; https://doi.org/10.3390/diagnostics13040806 - 20 Feb 2023
Cited by 12 | Viewed by 2534
Abstract
Prostate cancer is the second leading cause of cancer-related death in men. Its early and correct diagnosis is of particular importance to controlling and preventing the disease from spreading to other tissues. Artificial intelligence and machine learning have effectively detected and graded several [...] Read more.
Prostate cancer is the second leading cause of cancer-related death in men. Its early and correct diagnosis is of particular importance to controlling and preventing the disease from spreading to other tissues. Artificial intelligence and machine learning have effectively detected and graded several cancers, in particular prostate cancer. The purpose of this review is to show the diagnostic performance (accuracy and area under the curve) of supervised machine learning algorithms in detecting prostate cancer using multiparametric MRI. A comparison was made between the performances of different supervised machine-learning methods. This review study was performed on the recent literature sourced from scientific citation websites such as Google Scholar, PubMed, Scopus, and Web of Science up to the end of January 2023. The findings of this review reveal that supervised machine learning techniques have good performance with high accuracy and area under the curve for prostate cancer diagnosis and prediction using multiparametric MR imaging. Among supervised machine learning methods, deep learning, random forest, and logistic regression algorithms appear to have the best performance. Full article
(This article belongs to the Special Issue Artificial Intelligence in Clinical Medical Imaging Analysis)
Show Figures

Figure 1

Figure 1
<p>An example of mp-MRI diagnostic performance in a 66-year-old man with PSA 9.1 ng/mL. A focal low signal (arrow) in the midline apex TZ, (<b>a</b>) but there is not a high signal on the DWI, (<b>c</b>) or low signal on ADC maps (<b>d</b>). An early and clear enhancement on the DCE-MRI (arrow) in the midline apex TZ (<b>b</b>) was recognized as a high-possibility lesion. This lesion was proven by targeted transperineal biopsy (Gleason 5 + 4). “Reprinted with permission from Ref. [<a href="#B34-diagnostics-13-00806" class="html-bibr">34</a>]. 2020, Springer”. More details on “Copyright and Licensing” are available via the following link: <a href="https://link.springer.com/article/10.1007/s00330-020-06782-0" target="_blank">https://link.springer.com/article/10.1007/s00330-020-06782-0</a> (accessed on 12 March 2020).</p>
Full article ">Figure 2
<p>An example of mp-MRI diagnostic performance in a 62-year-old man with PSA 6.04 ng/mL. The DWI (<b>a</b>) and ADC maps (arrows) (<b>b</b>) showed a mild restricted diffusion in the bilateral base PZ. Unclear signal intensity on the T<sub>2</sub>WI (<b>c</b>) and a diffuse wedge-shaped enhancement on the DCE-MRI (<b>d</b>), imagined showing an inflammatory change. A systematic TRUS biopsy was performed with negative cores. “Reprinted with permission from Ref. [<a href="#B34-diagnostics-13-00806" class="html-bibr">34</a>]. 2020, Springer”. More details on “Copyright and Licensing” are available via the following link: <a href="https://link.springer.com/article/10.1007/s00330-020-06782-0" target="_blank">https://link.springer.com/article/10.1007/s00330-020-06782-0</a> (accessed on 12 March 2020).</p>
Full article ">Figure 3
<p>General data flow diagram of a computer-aided diagnosis system.</p>
Full article ">
12 pages, 1810 KiB  
Article
Role of Preoperative Ultrasound Shear-Wave Elastography and Radiofrequency-Based Arterial Wall Tracking in Assessing the Vulnerability of Carotid Plaques: Preliminary Results
by Daniela Mazzaccaro, Matteo Giannetta, Fabiana Fancoli, Giulia Matrone, Nicoletta Curcio, Michele Conti, Paolo Righini and Giovanni Nano
Diagnostics 2023, 13(4), 805; https://doi.org/10.3390/diagnostics13040805 - 20 Feb 2023
Viewed by 1798
Abstract
We aimed at evaluating the ability of point shear-wave elastography (pSWE) and of a radiofrequency (RF) echo-tracking-based method in preoperatively assessing the vulnerability of the carotid plaque in patients undergoing carotid endarterectomy (CEA) for significant asymptomatic stenosis. All patients who underwent CEA from [...] Read more.
We aimed at evaluating the ability of point shear-wave elastography (pSWE) and of a radiofrequency (RF) echo-tracking-based method in preoperatively assessing the vulnerability of the carotid plaque in patients undergoing carotid endarterectomy (CEA) for significant asymptomatic stenosis. All patients who underwent CEA from 03/2021 to 03/2022 performed a preoperative pSWE and an RF echo-based wall evaluation of arterial stiffness using an Esaote MyLab ultrasound system (EsaoteTM, Genova, Italy) with dedicated software. The data derived from these evaluations (Young’s modulus (YM), augmentation index (AIx), pulse-wave velocity (PWV)) were correlated with the outcome of the analysis of the plaque removed during the surgery. Data were analyzed on 63 patients (33 vulnerable and 30 stable plaques). In stable plaques, YM was significantly higher than in vulnerable plaques (49.6 + 8.1 kPa vs. 24.6 + 4.3 kPa, p = 0.009). AIx also tended to be slightly higher in stable plaques, even if it was not statistically significant (10.4 + 0.9% vs. 7.7 + 0.9%, p = 0.16). The PWV was similar (12.2 + 0.9 m/s for stable plaques vs. 10.6 + 0.5 m/s for vulnerable plaques, p = 0.16). For YM, values >34 kPa had a sensitivity of 50% and a specificity of 73.3% in predicting plaque nonvulnerability (area under the curve = 0.66). Preoperative measurement of YM by means of pSWE could be a noninvasive and easily applicable tool for assessing the preoperative risk of plaque vulnerability in asymptomatic patients who are candidates for CEA. Full article
(This article belongs to the Collection Vascular Diseases Diagnostics)
Show Figures

Figure 1

Figure 1
<p>Position of the patient for the ultrasound evaluation (both for QAS and for Q-Elaxto). Note the position of the linear array on the vessel’s longitudinal axis (black dashed line), just below the carotid bulb (orange line), and the ultrasound beam is perpendicular to that.</p>
Full article ">Figure 2
<p>Screenshot of the QAS evaluation of the carotid artery on the diseased side. The red lines represent the vessel wall average diameter tracking. The green lines are associated with the wall distension. The real distensibility represented by the green line movement is “amplified” giving a fast estimation of the vessel’s elastic properties. The velocity curve over time is shown in blue below the ultrasound image.</p>
Full article ">Figure 3
<p>Report of QAS with reported measurements and the plotted graph of local pressure waveform versus time. The mean distension with standard deviation and the mean diameter with standard deviation are measured (up left side), along with some parameters of stiffness (on the right side) that are explained in the text and in Appendix A.</p>
Full article ">Figure 4
<p>Q-Elaxto evaluation of the carotid plaque with measurement of Young’s Modulus.</p>
Full article ">Figure 5
<p>ROC curve of Young’s modulus for predicting plaque nonvulnerability.</p>
Full article ">
13 pages, 1795 KiB  
Article
Correlation of sLOX-1 Levels and MR Characteristics of Culprit Plaques in Intracranial Arteries with Stroke Recurrence
by Kaixuan Ren, Huayun Jiang, Tiantian Li, Chengqun Qian, Li Zhu and Tianle Wang
Diagnostics 2023, 13(4), 804; https://doi.org/10.3390/diagnostics13040804 - 20 Feb 2023
Cited by 2 | Viewed by 1737
Abstract
(1) Background: Symptomatic intracranial artery atherosclerosis (sICAS) is an important cause of acute ischaemic stroke (AIS) and is associated with a high risk of stroke recurrence. High-resolution magnetic resonance vessel wall imaging (HR-MR-VWI) is an effective method for evaluating atherosclerotic plaque characteristics. Soluble [...] Read more.
(1) Background: Symptomatic intracranial artery atherosclerosis (sICAS) is an important cause of acute ischaemic stroke (AIS) and is associated with a high risk of stroke recurrence. High-resolution magnetic resonance vessel wall imaging (HR-MR-VWI) is an effective method for evaluating atherosclerotic plaque characteristics. Soluble lectin-like oxidised low-density lipoprotein receptor-1 (sLOX-1) is closely associated with plaque formation and rupture. We aim to explore the correlation between sLOX-1 levels and culprit plaque characteristics, based on HR-MR-VWI, with stroke recurrence in patients with sICAS. (2) Methods: A total of 199 patients with sICAS underwent HR-MR-VWI between June 2020 and June 2021 in our hospital. The culprit vessel and plaque characteristics were assessed according to HR-MR-VWI, and sLOX-1 levels were measured by ELISA (enzyme linked immunosorbent assay). Outpatient follow-up was performed 3, 6, 9, and 12 months after discharge. (3) Results: sLOX-1 levels were significantly higher in the recurrence group than in the non-recurrence group (p < 0.001). The culprit plaque thickness, degree of stenosis and plaque burden were higher in the recurrence group than in the non-recurrence group (p = 0.003, p = 0.014 and p = 0.010, respectively). The incidence of hyperintensity on T1WI, positive remodelling and significant enhancement (p < 0.001, p = 0.003 and p = 0.027, respectively) was higher in the recurrence group than in the non-recurrence group. Kaplan–Meier curves showed that patients with sLOX-1 levels > 912.19 pg/mL and hyperintensity on T1WI in the culprit plaque had a higher risk of stroke recurrence (both p < 0.001). Multivariate Cox regression analysis showed that sLOX-1 > 912.19 pg/mL (HR = 2.583, 95%CI 1.142, 5.846, p = 0.023) and hyperintensity on T1WI in the culprit plaque (HR = 2.632, 95% CI 1.197, 5.790, p = 0.016) were independent risk factors for stroke recurrence. sLOX-1 levels were significantly associated with the culprit plaque thickness (r = 0.162, p = 0.022), degree of stenosis (r = 0.217, p = 0.002), plaque burden (r = 0.183, p = 0.010), hyperintensity on T1WI (F = 14.501, p < 0.001), positive remodelling (F = 9.602, p < 0.001), and significant enhancement (F = 7.684, p < 0.001) (4) Conclusions: sLOX-1 levels were associated with vulnerability of the culprit plaque and can be used as a supplement to HR-MR-VWI to predict stroke recurrence. Full article
(This article belongs to the Special Issue Advances in the Imaging of Stroke and Neurodegenerative Disorders)
Show Figures

Figure 1

Figure 1
<p>Flow chart showing the selection of patients.</p>
Full article ">Figure 2
<p>A 54-year-old man presented with acute infarction in the left cerebral hemisphere (<b>A</b>–<b>F</b>). No recurrence was observed during follow-up, and the sLOX-1 level was 214.46 pg/mL. (<b>A</b>,<b>B</b>): High DWI signal (white arrow) and low apparent diffusion coefficient (ADC) value (white arrow) in the left cerebral hemisphere. (<b>C</b>): Localised stenosis of the distal segment of the left middle cerebral artery (white arrow). (<b>D</b>): Localised thickening and enhancement of the distal wall of the left middle cerebral artery (white arrow). (<b>E</b>): Culprit plaque 3D-T1-space plain scan showed isosignal (white arrow). (<b>F</b>): There was no significant enhancement after the enhancement of culprit plaque (white arrow). A 69-year-old man with acute pontine infarction was diagnosed with recurrent stroke 6 months after discharge, with an sLOX-1 level of 1429.44 pg/mL (<b>G</b>–<b>L</b>). (<b>G</b>,<b>H</b>): DWI in the right pons is high (white arrow), and the ADC value is decreased (white arrow). (<b>I</b>): Basilar artery localised stenosis (white arrow). (<b>J</b>): Basilar artery wall localised thickening with enhancement (white arrow). (<b>K</b>): Hyperintensity was observed on the 3D-T1-space plain scan of the culprit plaque (white arrow). (<b>L</b>): There was no significant enhancement after enhancement of the culprit plaque (white arrow).</p>
Full article ">Figure 3
<p>ROC curves of sLOX-1 level and hyperintensity on T1WI to predict stroke recurrence. The optimal cutoff value of sLOX-1 to predict stroke recurrence was 912.19 pg/mL with an AUC value of 0.707, sensitivity of 80.49%, and specificity of 52.53%; the AUC value of hyperintensity on T1WI to predict stroke recurrence was 0.724, sensitivity of 70.73% and 74.05% specificity. However, the difference was not statistically significant (Z = 0.315, <span class="html-italic">p</span> = 0.753).</p>
Full article ">Figure 4
<p>Kaplan–Meier survival curve in patients with stroke recurrence. Patients with sLOX-1 levels &gt; 912.19 pg/mL (<span class="html-italic">p</span> &lt; 0.001) and hyperintensity on T1WI in the culprit plaque (<span class="html-italic">p</span> &lt; 0.001) had a higher risk of stroke recurrence at follow-up.</p>
Full article ">Figure 5
<p>Relationship between sLOX-1 levels and culprit plaque quantitative characteristics. sLOX-1 levels were significantly correlated with the culprit plaque thickness (r = 0.162, <span class="html-italic">p</span> = 0.022), stenosis (r = 0.217, <span class="html-italic">p</span> = 0.002), and plaque burden (r = 0.283, <span class="html-italic">p</span> = 0.010).</p>
Full article ">
16 pages, 610 KiB  
Review
Diagnostic Methods for Evaluation of Gastric Motility—A Mini Review
by Yan Wang, Jiande D. Z. Chen and Borko Nojkov
Diagnostics 2023, 13(4), 803; https://doi.org/10.3390/diagnostics13040803 - 20 Feb 2023
Cited by 7 | Viewed by 4173
Abstract
Gastric motility abnormalities are common in patients with disorders of gut-brain interaction, such as functional dyspepsia and gastroparesis. Accurate assessment of the gastric motility in these common disorders can help understand the underlying pathophysiology and guide effective treatment. A variety of clinically applicable [...] Read more.
Gastric motility abnormalities are common in patients with disorders of gut-brain interaction, such as functional dyspepsia and gastroparesis. Accurate assessment of the gastric motility in these common disorders can help understand the underlying pathophysiology and guide effective treatment. A variety of clinically applicable diagnostic methods have been developed to objectively evaluate the presence of gastric dysmotility, including tests of gastric accommodation, antroduodenal motility, gastric emptying, and gastric myoelectrical activity. The aim of this mini review is to summarize the advances in clinically available diagnostic methods for evaluation of gastric motility and describe the advantages and disadvantages of each test. Full article
Show Figures

Graphical abstract

Graphical abstract
Full article ">Figure 1
<p>A barostat device used to assess gastric accommodation.</p>
Full article ">Figure 2
<p>Summarized diagnostic methods for evaluation of gastric motility.</p>
Full article ">
19 pages, 1398 KiB  
Article
Diffuse Pulmonary Meningotheliomatosis: Clinic-Pathologic Entity or Indolent Metastasis from Meningioma (or Both)?
by Laura Melocchi, Giulio Rossi, Mirca Valli, Maria Cecilia Mengoli, Michele Mondoni, Luigi Lazzari-Agli, Giacomo Santandrea, Fabio Davoli, Chiara Baldovini, Alberto Cavazza and Thomas V. Colby
Diagnostics 2023, 13(4), 802; https://doi.org/10.3390/diagnostics13040802 - 20 Feb 2023
Cited by 3 | Viewed by 2220
Abstract
Pulmonary minute meningothelial-like nodules (MMNs) are common incidental findings in surgical specimens, consisting of tiny proliferation (usually no larger than 5–6 mm) of bland-looking meningothelial cells showing a perivenular and interstitial distribution, sharing morphologic, ultrastructural, and immunohistochemical profiles with meningiomas. The identification of [...] Read more.
Pulmonary minute meningothelial-like nodules (MMNs) are common incidental findings in surgical specimens, consisting of tiny proliferation (usually no larger than 5–6 mm) of bland-looking meningothelial cells showing a perivenular and interstitial distribution, sharing morphologic, ultrastructural, and immunohistochemical profiles with meningiomas. The identification of multiple bilateral MMNs leading to an interstitial lung disease characterized by diffuse and micronodular/miliariform patterns radiologically allows the diagnosis of diffuse pulmonary meningotheliomatosis (DPM). Nevertheless, the lung is the most common site of metastatic primary intracranial meningioma, and differential diagnosis with DPM may be impossible without clinic–radiologic integration. Herein, we report four cases (three females; mean age, 57.5 years) fitting the criteria of DPM, all incidentally discovered and histologically evidenced on transbronchial biopsy (2) and surgical resection (2). All cases showed immunohistochemical expression of epithelial membrane antigen (EMA), progesterone receptor, and CD56. Notably, three of these patients had a proven or radiologically suspected intracranial meningioma; in two cases, it was discovered before, and in one case, after the diagnosis of DPM. An extensive literature review (44 patients with DPM) revealed similar cases with imaging studies excluding intracranial meningioma in only 9% (4 of 44 cases studied). The diagnosis of DPM requires close correlation with the clinic–radiologic data since a subset of cases coexist with or follow a previously diagnosed intracranial meningioma and, thus, may represent incidental and indolent metastatic deposits of meningioma. Full article
(This article belongs to the Special Issue Advances in the Diagnosis and Management of Tumors/Cancers)
Show Figures

Figure 1

Figure 1
<p>Case #1 manifested with an incidental discovery of diffuse bilateral micronodules also showing ground glass appearance and central cavitation at chest CT scan (<b>A</b>) and spindled-to-epithelioid cell proliferation with intermingled fibrosis (see black dots) at transbronchial biopsy (<b>B</b>), hematoxylin–eosin magnification ×100, consisting of bland-looking cells with moderate cytoplasm lacking mitotic figures (<b>C</b>), hematoxylin–eosin stain magnification ×200. These cells showed a meningothelial cell differentiation by expressing EMA at cytoplasmic level (<b>D</b>), immunohistochemistry magnification ×200, progesterone receptors in the nuclei (<b>E</b>), immunohistochemistry magnification ×200, CD56 in cytoplasm and membrane (<b>F</b>), and immunohistochemistry magnification ×200.</p>
Full article ">Figure 2
<p>In case #2, the patient presented with several bilateral micronodules with ground glass periphery and some cavitation at chest CT scan (<b>A</b>) and had a previous history of non-excised meningioma in the right frontal region (<b>B</b>,<b>C</b>). A surgical lung biopsy demonstrated a perivenular (black arrow) and irregular proliferation of meningothelial-like cells (<b>D</b>), hematoxylin-eosin magnification ×40, growing and thickening the alveolar interstitium (<b>E</b>), hematoxylin-eosin stain magnification ×200 and expressing EMA in the cytoplasm (<b>F</b>), immunohistochemistry magnification ×200, and progesterone receptors in the nuclei (<b>G</b>), immunohistochemistry magnification ×200.</p>
Full article ">
19 pages, 3190 KiB  
Article
Alzheimer Disease Classification through Transfer Learning Approach
by Noman Raza, Asma Naseer, Maria Tamoor and Kashif Zafar
Diagnostics 2023, 13(4), 801; https://doi.org/10.3390/diagnostics13040801 - 20 Feb 2023
Cited by 24 | Viewed by 4403
Abstract
Alzheimer’s disease (AD) is a slow neurological disorder that destroys the thought process, and consciousness, of a human. It directly affects the development of mental ability and neurocognitive functionality. The number of patients with Alzheimer’s disease is increasing day by day, especially in [...] Read more.
Alzheimer’s disease (AD) is a slow neurological disorder that destroys the thought process, and consciousness, of a human. It directly affects the development of mental ability and neurocognitive functionality. The number of patients with Alzheimer’s disease is increasing day by day, especially in old aged people, who are above 60 years of age, and, gradually, it becomes cause of their death. In this research, we discuss the segmentation and classification of the Magnetic resonance imaging (MRI) of Alzheimer’s disease, through the concept of transfer learning and customizing of the convolutional neural network (CNN) by specifically using images that are segmented by the Gray Matter (GM) of the brain. Instead of training and computing the proposed model accuracy from the start, we used a pre-trained deep learning model as our base model, and, after that, transfer learning was applied. The accuracy of the proposed model was tested over a different number of epochs, 10, 25, and 50. The overall accuracy of the proposed model was 97.84%. Full article
(This article belongs to the Special Issue AI/ML-Based Medical Image Processing and Analysis)
Show Figures

Figure 1

Figure 1
<p>MRI to 2D GM slice.</p>
Full article ">Figure 2
<p>One Dense Block in DenseNet [<a href="#B26-diagnostics-13-00801" class="html-bibr">26</a>].</p>
Full article ">Figure 3
<p>Proposed model workflow.</p>
Full article ">Figure 4
<p>Major Steps of Pre-processing on MRIs.</p>
Full article ">Figure 5
<p>MRIs of Axial and Sagittal planes before and after skull striping.</p>
Full article ">Figure 6
<p>(<b>a</b>) Original (<b>b</b>) Grey Matter (GM (<b>c</b>) White Matter (WM) (<b>d</b>) Cerebrospinal Fluid.</p>
Full article ">Figure 7
<p>Gaussian Smoothing Kernel.</p>
Full article ">Figure 8
<p>Effects of augmentation on MRI.</p>
Full article ">Figure 9
<p>Proposed Model Architecture.</p>
Full article ">Figure 10
<p>Output size and model parameters at each layer of the proposed DenseNet.</p>
Full article ">Figure 11
<p>Gray matter images for proposed model.</p>
Full article ">Figure 12
<p>Framework of the proposed methodology.</p>
Full article ">Figure 13
<p>Average Class Accuracy of the four Models.</p>
Full article ">
20 pages, 4770 KiB  
Article
A Deep Learning-Based Framework for Uncertainty Quantification in Medical Imaging Using the DropWeak Technique: An Empirical Study with Baresnet
by Mehmet Akif Cifci
Diagnostics 2023, 13(4), 800; https://doi.org/10.3390/diagnostics13040800 - 20 Feb 2023
Cited by 9 | Viewed by 2720
Abstract
Lung cancer is a leading cause of cancer-related deaths globally. Early detection is crucial for improving patient survival rates. Deep learning (DL) has shown promise in the medical field, but its accuracy must be evaluated, particularly in the context of lung cancer classification. [...] Read more.
Lung cancer is a leading cause of cancer-related deaths globally. Early detection is crucial for improving patient survival rates. Deep learning (DL) has shown promise in the medical field, but its accuracy must be evaluated, particularly in the context of lung cancer classification. In this study, we conducted uncertainty analysis on various frequently used DL architectures, including Baresnet, to assess the uncertainties in the classification results. This study focuses on the use of deep learning for the classification of lung cancer, which is a critical aspect of improving patient survival rates. The study evaluates the accuracy of various deep learning architectures, including Baresnet, and incorporates uncertainty quantification to assess the level of uncertainty in the classification results. The study presents a novel automatic tumor classification system for lung cancer based on CT images, which achieves a classification accuracy of 97.19% with an uncertainty quantification. The results demonstrate the potential of deep learning in lung cancer classification and highlight the importance of uncertainty quantification in improving the accuracy of classification results. This study’s novelty lies in the incorporation of uncertainty quantification in deep learning for lung cancer classification, which can lead to more reliable and accurate diagnoses in clinical settings. Full article
(This article belongs to the Section Machine Learning and Artificial Intelligence in Diagnostics)
Show Figures

Figure 1

Figure 1
<p>Aleatoric and epistemic uncertainties in the data.</p>
Full article ">Figure 2
<p>Comparison of (<b>a</b>) DropOut; (<b>b</b>) DropConnect and (<b>c</b>) MC Dropweak node activation.</p>
Full article ">Figure 3
<p>Proposed Baresnet model architecture: A study on uncertainty quantification in lung cancer diagnosis.</p>
Full article ">Figure 4
<p>Comparison of Baresnet model’s predictive uncertainty with and without MC Dropweak.</p>
Full article ">Figure 5
<p>Performance evaluation of the proposed model: accuracy and loss values.</p>
Full article ">Figure 6
<p>Grad-CAM visualization of model predictions on CT images.</p>
Full article ">Figure 7
<p>Baresnet model ROC curve and accuracy rates.</p>
Full article ">Figure 8
<p>Distribution of estimated aleatoric uncertainty.</p>
Full article ">
13 pages, 287 KiB  
Article
White Matter Lesions Identified by Magnetic Resonance in Women with Migraine: A Volumetric Analysis and Clinical Correlations
by Natália de Oliveira Silva, Nicoly Machado Maciel, Júlio César Nather, Jr., Gabriela Ferreira Carvalho, Carina Ferreira Pinheiro, Marcelo Eduardo Bigal, Antônio Carlos dos Santos, Debora Bevilaqua-Grossi and Fabiola Dach
Diagnostics 2023, 13(4), 799; https://doi.org/10.3390/diagnostics13040799 - 20 Feb 2023
Viewed by 1586
Abstract
Background: Repeated migraine attacks and aura could independently cause structural changes in the central nervous system. Our research aims to study the correlation of migraine type, attack frequency, and other clinical variables with the presence, volume and localization of white matter lesions (WML), [...] Read more.
Background: Repeated migraine attacks and aura could independently cause structural changes in the central nervous system. Our research aims to study the correlation of migraine type, attack frequency, and other clinical variables with the presence, volume and localization of white matter lesions (WML), in a controlled study. Methods: Sixty volunteers from a tertiary headache center were selected and divided equally into four groups: episodic migraine without aura (MoA), episodic migraine with aura (MA), chronic migraine (CM) and controls (CG). Voxel-based morphometry techniques were used to analyze WML. Results: There were no differences in WML variables between groups. There was a positive correlation between age and the number and total volume of WMLs, which persisted in the comparison categorized by size and brain lobe. Disease duration was positively correlated with the number and total volume of WML, and when controlled by age, the correlation maintained significance only for the insular lobe. Aura frequency was associated with frontal and temporal lobe WMLs. There was no statistically significant correlation between WML and other clinical variables. Conclusion: Migraine overall is not a risk factor for WML. Aura frequency is, however, associated with temporal WML. Disease duration, in adjusted analyses that account for age, is associated with insular WML. Full article
(This article belongs to the Special Issue Advanced MRI in Clinical Diagnosis)
20 pages, 2955 KiB  
Article
Innovation in Hyperinsulinemia Diagnostics with ANN-L(atin square) Models
by Nevena Rankovic, Dragica Rankovic and Igor Lukic
Diagnostics 2023, 13(4), 798; https://doi.org/10.3390/diagnostics13040798 - 20 Feb 2023
Cited by 1 | Viewed by 1479
Abstract
Hyperinsulinemia is a condition characterized by excessively high levels of insulin in the bloodstream. It can exist for many years without any symptomatology. The research presented in this paper was conducted from 2019 to 2022 in cooperation with a health center in Serbia [...] Read more.
Hyperinsulinemia is a condition characterized by excessively high levels of insulin in the bloodstream. It can exist for many years without any symptomatology. The research presented in this paper was conducted from 2019 to 2022 in cooperation with a health center in Serbia as a large cross-sectional observational study of adolescents of both genders using datasets collected from the field. Previously used analytical approaches of integrated and relevant clinical, hematological, biochemical, and other variables could not identify potential risk factors for developing hyperinsulinemia. This paper aims to present several different models using machine learning (ML) algorithms such as naive Bayes, decision tree, and random forest and compare them with a new methodology constructed based on artificial neural networks using Taguchi’s orthogonal vector plans (ANN-L), a special extraction of Latin squares. Furthermore, the experimental part of this study showed that ANN-L models achieved an accuracy of 99.5% with less than seven iterations performed. Furthermore, the study provides valuable insights into the share of each risk factor contributing to the occurrence of hyperinsulinemia in adolescents, which is crucial for more precise and straightforward medical diagnoses. Preventing the risk of hyperinsulinemia in this age group is crucial for the well-being of the adolescents and society as a whole. Full article
(This article belongs to the Section Machine Learning and Artificial Intelligence in Diagnostics)
Show Figures

Figure 1

Figure 1
<p>ANN-L27 architecture—graphical representation.</p>
Full article ">Figure 2
<p>ANN-L12 architecture—graphical representation.</p>
Full article ">Figure 3
<p>ANN-L16 architecture—graphical representation.</p>
Full article ">Figure 4
<p>Correlation coefficients between the risk factors.</p>
Full article ">Figure 5
<p>Graphical representation—the percentage share of each risk factor for the occurrence of hyperinsulinemia for the used models.</p>
Full article ">Figure 6
<p>Correlation coefficients—ANN-L.</p>
Full article ">Figure 7
<p>Monitoring of the value of the total risk for the occurrence of hyperinsulinemia within the framework of all three proposed ANN-L models (ANN-L12, ANN-L16, ANN-L27), on the total sample through six iterations.</p>
Full article ">Figure 8
<p>Graphical representation—occurrence of hyperinsulinemia within the risk factors assessed by ANN-L—experimental and control group.</p>
Full article ">
12 pages, 2793 KiB  
Article
Retinal Vascular Tortuosity Index Change after Idiopathic Epiretinal Membrane Surgery: Does Internal Limiting Membrane Peeling Affect Retinal Vascular Tortuosity?
by Özge Yanık, Pınar Aydın Ellialtıoğlu, Sibel Demirel, Figen Batıoğlu and Emin Özmert
Diagnostics 2023, 13(4), 797; https://doi.org/10.3390/diagnostics13040797 - 20 Feb 2023
Cited by 2 | Viewed by 1541
Abstract
Background: Idiopathic epiretinal membrane (iERM) surgery is one of the most commonly performed vitreoretinal surgeries, and the issue of internal limiting membrane (ILM) peeling in ERM surgery is still controversial. The aims of this study are to evaluate the changes in retinal vascular [...] Read more.
Background: Idiopathic epiretinal membrane (iERM) surgery is one of the most commonly performed vitreoretinal surgeries, and the issue of internal limiting membrane (ILM) peeling in ERM surgery is still controversial. The aims of this study are to evaluate the changes in retinal vascular tortuosity index (RVTI) after pars plana vitrectomy for the iERM using optical coherence tomography angiography (OCTA) and to assess whether ILM peeling has an additional effect on RVTI reduction. Methods: This study included25 eyes of 25 iERM patients who underwent ERM surgery. The ERM was removed without ILM peeling in 10 eyes (40.0%), and the ILM was peeled in addition to the ERM in 15 eyes (60.0%). The existence of the ILM after ERM peeling was checked with second staining in all eyes. Best corrected visual acuity (BCVA) and 6 × 6 mm en-face OCTA images were recorded before surgery and at the first month postoperatively. A skeleton model of the retinal vascular structure was created following Otsu binarization of en-face OCTA images using ImageJ software (1.52U). RVTI was calculated as the ratio of each vessel length to its Euclidean distance on the skeleton model using the Analyze Skeleton plug-in. Results: The mean RVTI declined from 1.220 ± 0.017 to 1.201 ± 0.020 (p = 0.036) in eyes with ILM peeling and from 1.230 ± 0.038 to 1.195 ± 0.024 in eyes without ILM peeling (p = 0.037). There was no difference between the groups in terms of postoperative RVTI (p = 0.494). A statistically significant correlation was found between postoperative RVTI and postoperative BCVA (rho = 0.408, p = 0.043). Conclusions: The RVTI is an indirect indicator of the traction created by the iERM on retinal microvascular structures, and it was effectively reduced after iERM surgery. The postoperative RVTIs were similar in cases who underwent iERM surgery with or without ILM peeling. Therefore, ILM peeling may not have an additive effect on the loosening of microvascular traction and thus may be reserved for recurrent ERM surgeries. Full article
Show Figures

Figure 1

Figure 1
<p>Binarized en-face OCTA images of a 65-year-old female before and after idiopathic epiretinal membrane (iERM) surgery. (<b>A</b>) Otsu binarization of en-face OCTA image before iERM surgery. (<b>B</b>) Skeleton model of the superficial retinal vascular plexus, retinal vascular tortuosity index was 1.22. (<b>C</b>) Otsu binarization of en-face OCTA image after iERM surgery. (<b>D</b>) Skeleton model of the superficial retinal vascular plexus, the retinal tortuosity index regressed to 1.17 after surgery.</p>
Full article ">Figure 2
<p>OCT and en-face OCTA images of a 67-year-old male before and after idiopathic epiretinal membrane (iERM) surgery. (<b>A</b>) Preoperative retinal thickness map calculated by the software of SD-OCT device showed the increased retinal thickness. The central subfield thickness was 545 µm. (<b>B</b>) The horizontal B-scan SD-OCT passing through the fovea revealed a stage 3 epiretinal membrane: The reflectivity of the ectopic inner foveal layers is similar to that of the inner nuclear layer. (<b>C</b>) The en-face OCTA image shows measured foveal parameters including foveal avascular zone (FAZ) area (0.025 mm<sup>2</sup>), FAZ perimeter (0.666 mm), and foveal vessel density (43.59%). Note the increased retinal vessel tortuosity. (<b>D</b>) En-face OCT reveals the surface traction. (<b>E</b>) Postoperative retinal thickness map showed the reduction in retinal thickness. The central subfield thickness was 511 µm. (<b>F</b>) The horizontal B-scan OCT passing through the fovea revealed an absence of foveal pit. (<b>G</b>) After iERM surgery, all the measured foveal parameters increased (FAZ area = 0.063 mm<sup>2</sup>, FAZ perimeter = 0.991 mm, and foveal vessel density (46.50%). (<b>H</b>) The surface traction was relieved together with decreased vessel tortuosity. Note the inner retinal dimples coursing along the path of the nerve fiber layer caused by the internal limiting membrane peeling.</p>
Full article ">Figure 3
<p>Scatter plot graph showing the correlation of postoperative best-corrected visual acuity (BCVA) scores and postoperative retinal vascular tortuosity index (RVTI).</p>
Full article ">
19 pages, 4910 KiB  
Article
A Novel Proposal for Deep Learning-Based Diabetes Prediction: Converting Clinical Data to Image Data
by Muhammet Fatih Aslan and Kadir Sabanci
Diagnostics 2023, 13(4), 796; https://doi.org/10.3390/diagnostics13040796 - 20 Feb 2023
Cited by 18 | Viewed by 3622
Abstract
Diabetes, one of the most common diseases worldwide, has become an increasingly global threat to humans in recent years. However, early detection of diabetes greatly inhibits the progression of the disease. This study proposes a new method based on deep learning for the [...] Read more.
Diabetes, one of the most common diseases worldwide, has become an increasingly global threat to humans in recent years. However, early detection of diabetes greatly inhibits the progression of the disease. This study proposes a new method based on deep learning for the early detection of diabetes. Like many other medical data, the PIMA dataset used in the study contains only numerical values. In this sense, the application of popular convolutional neural network (CNN) models to such data are limited. This study converts numerical data into images based on the feature importance to use the robust representation of CNN models in early diabetes diagnosis. Three different classification strategies are then applied to the resulting diabetes image data. In the first, diabetes images are fed into the ResNet18 and ResNet50 CNN models. In the second, deep features of the ResNet models are fused and classified with support vector machines (SVM). In the last approach, the selected fusion features are classified by SVM. The results demonstrate the robustness of diabetes images in the early diagnosis of diabetes. Full article
Show Figures

Figure 1

Figure 1
<p>Application steps of proposed methods.</p>
Full article ">Figure 2
<p>Importance weight of features in the PIMA dataset.</p>
Full article ">Figure 3
<p>Min<tt>–</tt>max normalization of PIMA dataset.</p>
Full article ">Figure 3 Cont.
<p>Min<tt>–</tt>max normalization of PIMA dataset.</p>
Full article ">Figure 4
<p>Conversion selected features to image (numeric to image).</p>
Full article ">Figure 5
<p>Data augmentation methodologies and sample augmented images.</p>
Full article ">Figure 6
<p>Classification of diabetes images as diabetic (1) and nondiabetic (0) with ResNet models.</p>
Full article ">Figure 7
<p>Implementation steps of the proposed CNN-SVM approach.</p>
Full article ">Figure 8
<p>Application flow chart in the last step.</p>
Full article ">Figure 9
<p>Training and loss graphics of ResNet models. (<b>a</b>) ResNet18. (<b>b</b>) ResNet50.</p>
Full article ">Figure 9 Cont.
<p>Training and loss graphics of ResNet models. (<b>a</b>) ResNet18. (<b>b</b>) ResNet50.</p>
Full article ">Figure 10
<p>Confusion matrices obtained as a result of classification of all fused features with SVM.</p>
Full article ">Figure 11
<p>Confusion matrices obtained as a result of classification of selected features with SVM.</p>
Full article ">Figure 12
<p>Structure of confusion matrices.</p>
Full article ">
9 pages, 765 KiB  
Article
Timing of Early Postoperative MRI following Primary Glioblastoma Surgery—A Retrospective Study of Contrast Enhancements in 311 Patients
by Alexander Malcolm Rykkje, Vibeke Andrée Larsen, Jane Skjøth-Rasmussen, Michael Bachmann Nielsen, Jonathan Frederik Carlsen and Adam Espe Hansen
Diagnostics 2023, 13(4), 795; https://doi.org/10.3390/diagnostics13040795 - 20 Feb 2023
Cited by 4 | Viewed by 1726
Abstract
An early postoperative MRI is recommended following Glioblastoma surgery. This retrospective, observational study aimed to investigate the timing of an early postoperative MRI among 311 patients. The patterns of the contrast enhancement (thin linear, thick linear, nodular, and diffuse) and time from surgery [...] Read more.
An early postoperative MRI is recommended following Glioblastoma surgery. This retrospective, observational study aimed to investigate the timing of an early postoperative MRI among 311 patients. The patterns of the contrast enhancement (thin linear, thick linear, nodular, and diffuse) and time from surgery to the early postoperative MRI were recorded. The primary endpoint was the frequencies of the different contrast enhancements within and beyond the 48-h from surgery. The time dependence of the resection status and the clinical parameters were analysed as well. The frequency of the thin linear contrast enhancements significantly increased from 99/183 (50.8%) within 48-h post-surgery to 56/81 (69.1%) beyond 48-h post-surgery. Similarly, MRI scans with no contrast enhancements significantly declined from 41/183 (22.4%) within 48-h post-surgery to 7/81 (8.6%) beyond 48-h post-surgery. No significant differences were found for the other types of contrast enhancements and the results were robust in relation to the choice of categorisation of the postoperative periods. Both the resection status and the clinical parameters were not statistically different in patients with an MRI performed before and after 48 h. The findings suggest that surgically induced contrast enhancements are less frequent when an early postoperative MRI is performed earlier than 48-h, supporting the recommendation of a 48-h window for an early postoperative MRI. Full article
(This article belongs to the Special Issue Advances in the Diagnostics and Therapies of Glioma)
Show Figures

Figure 1

Figure 1
<p>Overview of the data categorisation process. Enhancement patterns are specified in the left table with corresponding resection status specified in the table to the right. Several types of contrast enhancements could be present in one patient. Abbreviations: contrast enhancement (CE).</p>
Full article ">Figure 2
<p>Examples of contrast enhancement. Enhancement patterns are marked with yellow arrows.</p>
Full article ">Figure 3
<p>Histogram showing the time distribution of the early postoperative MRI for all patients. The x-axis represents the time from surgery to early postoperative MRI and the y-axis represents the number of patients for each hour.</p>
Full article ">
10 pages, 1298 KiB  
Article
Deep Learning-Based Image Quality Improvement in Digital Positron Emission Tomography for Breast Cancer
by Mio Mori, Tomoyuki Fujioka, Mayumi Hara, Leona Katsuta, Yuka Yashima, Emi Yamaga, Ken Yamagiwa, Junichi Tsuchiya, Kumiko Hayashi, Yuichi Kumaki, Goshi Oda, Tsuyoshi Nakagawa, Iichiroh Onishi, Kazunori Kubota and Ukihide Tateishi
Diagnostics 2023, 13(4), 794; https://doi.org/10.3390/diagnostics13040794 - 20 Feb 2023
Cited by 1 | Viewed by 1631
Abstract
We investigated whether 18F-fluorodeoxyglucose positron emission tomography (PET)/computed tomography images restored via deep learning (DL) improved image quality and affected axillary lymph node (ALN) metastasis diagnosis in patients with breast cancer. Using a five-point scale, two readers compared the image quality of [...] Read more.
We investigated whether 18F-fluorodeoxyglucose positron emission tomography (PET)/computed tomography images restored via deep learning (DL) improved image quality and affected axillary lymph node (ALN) metastasis diagnosis in patients with breast cancer. Using a five-point scale, two readers compared the image quality of DL-PET and conventional PET (cPET) in 53 consecutive patients from September 2020 to October 2021. Visually analyzed ipsilateral ALNs were rated on a three-point scale. The standard uptake values SUVmax and SUVpeak were calculated for breast cancer regions of interest. For “depiction of primary lesion”, reader 2 scored DL-PET significantly higher than cPET. For “noise”, “clarity of mammary gland”, and “overall image quality”, both readers scored DL-PET significantly higher than cPET. The SUVmax and SUVpeak for primary lesions and normal breasts were significantly higher in DL-PET than in cPET (p < 0.001). Considering the ALN metastasis scores 1 and 2 as negative and 3 as positive, the McNemar test revealed no significant difference between cPET and DL-PET scores for either reader (p = 0.250, 0.625). DL-PET improved visual image quality for breast cancer compared with cPET. SUVmax and SUVpeak were significantly higher in DL-PET than in cPET. DL-PET and cPET exhibited comparable diagnostic abilities for ALN metastasis. Full article
(This article belongs to the Special Issue The Impact of PET/CT Imaging in Oncology)
Show Figures

Figure 1

Figure 1
<p>Maximum-intensity projection of (<b>a</b>) conventional positron emission tomography (PET) reconstruction and (<b>b</b>) deep learning (DL) PET restoration of a woman in her 60 s with invasive ductal carcinoma in the right breast (arrows): invasive diameter, 15 mm; nuclear grade, 2; lymphatic invasion, negative; vascular invasion, negative; estrogen receptor, positive; progesterone receptor, positive; HER2 receptor, positive; Ki-67 staining, 25.5%; and nodal stage, 0. Axial view of a tumor cross-section for the same woman using (<b>c</b>) cPET reconstruction and (<b>d</b>) DL-PET restoration. Images were scored on a five-point scale from 1 = extremely poor to 5 = excellent. The scores of reader 1 for “depiction of the primary lesion”, “noise”, “clarity of mammary gland”, and “overall image quality” were 4, 5, 5, and 5 for cPET and 5, 5, 5, and 5 for DL-PET, respectively; the scores of reader 2 were 3, 4, 4, and 4 for cPET and 5, 5, 5, and 5 for DL-PET, respectively.</p>
Full article ">Figure 2
<p>Axial image of an axillary lymph node (ALN) cross-section via (<b>a</b>) cPET and (<b>b</b>) DL-PET of a woman in her 40 s with invasive lobular carcinoma in the right breast: invasive diameter, 18 mm; nuclear grade, 1; lymphatic invasion, positive; vascular invasion, positive; estrogen receptor, positive; progesterone receptor, positive; HER2 receptor, negative; Ki-67 staining, 17.3%; and nodal stage, 1a. Of 18 ALNs, 3 were positive for metastasis; the maximum diameter was 3 mm, and an extranodal invasion was evident. Visual analysis for ipsilateral ALN metastasis was rated on a scale of 1–3 (1 = negative, 2 = intermediate, 3 = positive). For ALN metastasis, reader 1 gave a score of 2 for cPET and 3 for DL-PET, and reader 2 gave a score of 1 for both the PET types. cPET, PET with conventional reconstruction; DL-PET, PET with deep learning restoration.</p>
Full article ">
19 pages, 15748 KiB  
Review
Management of Non-Melanoma Skin Cancer: Radiologists Challenging and Risk Assessment
by Gaetano Maria Russo, Anna Russo, Fabrizio Urraro, Fabrizio Cioce, Luigi Gallo, Maria Paola Belfiore, Angelo Sangiovanni, Stefania Napolitano, Teresa Troiani, Pasquale Verolino, Antonello Sica, Gabriella Brancaccio, Giulia Briatico, Valerio Nardone and Alfonso Reginelli
Diagnostics 2023, 13(4), 793; https://doi.org/10.3390/diagnostics13040793 - 20 Feb 2023
Cited by 4 | Viewed by 2297
Abstract
Basal cell carcinoma, squamous cell carcinoma, and Merkel cell carcinoma are the three main types of nonmelanoma skin cancers and their rates of occurrence and mortality have been steadily rising over the past few decades. For radiologists, it is still difficult to treat [...] Read more.
Basal cell carcinoma, squamous cell carcinoma, and Merkel cell carcinoma are the three main types of nonmelanoma skin cancers and their rates of occurrence and mortality have been steadily rising over the past few decades. For radiologists, it is still difficult to treat patients with advanced nonmelanoma skin cancer. Nonmelanoma skin cancer patients would benefit greatly from an improved diagnostic imaging-based risk stratification and staging method that takes into account patient characteristics. The risk is especially elevated among those who previously received systemic treatment or phototherapy. Systemic treatments, including biologic therapies and methotrexate (MTX), are effective in managing immune-mediated diseases; however, they may increase susceptibility to NMSC due to immunosuppression or other factors. Risk stratification and staging tools are crucial in treatment planning and prognostic evaluation. PET/CT appears more sensitive and superior to CT and MRI for nodal and distant metastasis as well as in surveillance after surgery. The patient treatment response improved with advent and utilization of immunotherapy and different immune-specific criteria are established to standardized evaluation criteria of clinical trials but none of them have been utilized routinely with immunotherapy. The advent of immunotherapy has also arisen new critical issues for radiologists, such as atypical response pattern, pseudo-progression, as well as immune-related adverse events that require early identification to optimize and improve patient prognosis and management. It is important for radiologists to have knowledge of the radiologic features site of the tumor, clinical stage, histological subtype, and any high-risk features to assess immunotherapy treatment response and immune-related adverse events. Full article
(This article belongs to the Special Issue Image-Guided Cancer Diagnosis and Therapy)
Show Figures

Figure 1

Figure 1
<p>(<b>A</b>) A 73-year-old male patient. Right frontal diffuse infiltrative squamous cell carcinoma 444 two slightly hyperchromic hard and hypomobile areas to the underlying floors. (<b>B</b>–<b>D</b>) HF Ultra-445 sound examination performed with a very high frequency probe (48 Mhz). (<b>B</b>) Right upper frontal 446 site hypoechoic area of the hypodermis with blurred margins lower. (<b>C</b>) Non-encapsulated of the 447 following dimensions: Dt 6.9 mm × DL2.4 mm. (<b>D</b>) The lesion shows intralesional micro-vasculature 448 on Color Doppler control.</p>
Full article ">Figure 2
<p>US examination performed with a very high frequency probe (48 Mhz) (<b>A</b>) Upper frontal skin site with evident post-actinic scar already treated with previous radiotherapy. (<b>B</b>) Round hy-452 hypoechoic area of the hypodermis with non-encapsulated blurred margins (<b>C</b>) The lesion shows in-453 intralesional micro-vasculature on Color Doppler control.</p>
Full article ">Figure 3
<p>US examination. Submandibular metastatic lymph node of squamous cell carcinoma. (<b>A</b>) The lymph node appears round in shape, without hilum differentiation. (<b>B</b>) Colorimetric enhancement on Color Doppler examination.</p>
Full article ">Figure 4
<p>A 65-year-old male patient MRI examination. Lesion interesting the cutaneous and subcutaneous tissues without involving the bone tissue. (<b>A</b>) T1 weighted imaging and (<b>B</b>) T2 weighted imaging.</p>
Full article ">Figure 5
<p>MRI examination of the previous patient. The lesion shows high signal in DWI and inten-sity reinforcement in the contrast-enhanced study image. (<b>A</b>) Enhanced MRI imaging and (<b>B</b>) DWI.</p>
Full article ">Figure 6
<p>MRI examination of the previous patient. (<b>A</b>) Enhanced MRI imaging: sagittal section. The lesion shows high intensity reinforcement in the contrastographic study image. (<b>B</b>) Axial section lymph node. Metastatic lymph node with high intensity reinforcement in the contrastographic study image.</p>
Full article ">Figure 7
<p>A 53-year-old female patient, MRI examination. (<b>A</b>) Enhanced MRI imaging: T2 weighted imaging. (<b>B</b>) T2 weighted imaging fat sat. (<b>C</b>) Enhanced MRI imaging. The lesion shows high intensity reinforcement in the contrast-enhanced study image (<b>C</b>) and bone involvement.</p>
Full article ">Figure 8
<p>A 53-year-old female patient, PET/TC examination. The exam confirms a cutaneous and subcutaneous lesion with bone involvement.</p>
Full article ">Figure 9
<p>A 78-year-old male patient in treatment with immunotherapy, enhanced CT imaging (128 slices) performed in July 2021. Pre contrast phase CT (<b>A</b>), Arterial phase (<b>B</b>), Portal phase (<b>C</b>), Tardive phase (<b>D</b>). In the portal phase (<b>C</b>), vague hypodense areas not visible in the other phases of the study, fifth hepatic segment. These areas were suspected of liver metastases from squamous cell carcinoma.</p>
Full article ">Figure 10
<p>MRI examination of the previous patient performed in August 2021—T2 weighted imaging. Axial section (<b>A</b>), Coronal section (<b>B</b>). Hypointense areas in the fifth hepatic segment.</p>
Full article ">Figure 11
<p>MRI examination of the previous patient performed in August 2021. DWI (<b>A</b>), ADC (<b>B</b>), enhanced MRI imaging (<b>C</b>). The lesions show high signal in DWI, low signal in ADC, and intensity reinforcement in the contrast-enhanced study image. Suspicious areas are confirmed as metastatic lesions.</p>
Full article ">Figure 12
<p>Enhanced CT imaging (128 slices) of the previous patient performed in March 2022. Non enhanced CT (<b>A</b>), Arterial phase (<b>B</b>), Portal phase (<b>C</b>), Tardive phase (<b>D</b>). The metastatic lesions were no longer present, pseudo progression.</p>
Full article ">
11 pages, 2387 KiB  
Article
Risk of Secondary Cancer after Adjuvant Tamoxifen Treatment for Ductal Carcinoma In Situ: A Nationwide Cohort Study in South Korea
by Dooreh Kim, Jooyoung Oh, Jeong-Ho Seok, Hye Sun Lee, Soyoung Jeon and Chang Ik Yoon
Diagnostics 2023, 13(4), 792; https://doi.org/10.3390/diagnostics13040792 - 20 Feb 2023
Cited by 2 | Viewed by 1826
Abstract
Endocrine therapy is the mainstay treatment for hormone receptor-positive ductal carcinoma in situ. The aim of this study was to examine the long-term secondary malignancy risk of tamoxifen therapy. The data of patients diagnosed with breast cancer between January 2007 and December 2015 [...] Read more.
Endocrine therapy is the mainstay treatment for hormone receptor-positive ductal carcinoma in situ. The aim of this study was to examine the long-term secondary malignancy risk of tamoxifen therapy. The data of patients diagnosed with breast cancer between January 2007 and December 2015 were retrieved from the database of the Health Insurance Review and Assessment Service of South Korea. The International Classification of Diseases, 10th revision, was used to track all-site cancers. Age at the time of surgery, chronic disease status, and type of surgery were considered covariates in the propensity score matching analysis. The median follow-up duration was 89 months. Forty-one patients in the tamoxifen group and nine in the control group developed endometrial cancer. The Cox regression hazard ratio model showed that tamoxifen therapy was the only significant predictor of the development of endometrial cancer (hazard ratio, 2.791; 95% confidence interval, 1.355–5.747; p = 0.0054). No other type of cancer was associated with long-term tamoxifen use. In consonance with the established knowledge, the real-world data in this study demonstrated that tamoxifen therapy is related to an increased incidence of endometrial cancer. Full article
(This article belongs to the Section Pathology and Molecular Diagnostics)
Show Figures

Figure 1

Figure 1
<p>Consort diagram of study design.</p>
Full article ">Figure 2
<p>Cumulative incidence of endometrial cancer according to long-term use of tamoxifen: (<b>a</b>) before matching, log-rank test, <span class="html-italic">p</span>-value = 0.0036; (<b>b</b>) after matching, log-rank test, <span class="html-italic">p</span>-value = 0.004.</p>
Full article ">Figure 3
<p>Risk of developing secondary cancer due to long-term tamoxifen use in patients with breast cancer: (<b>A</b>) before matching; (<b>B</b>) after matching. HR, hazard ratio; CI, confidence interval.</p>
Full article ">Figure 3 Cont.
<p>Risk of developing secondary cancer due to long-term tamoxifen use in patients with breast cancer: (<b>A</b>) before matching; (<b>B</b>) after matching. HR, hazard ratio; CI, confidence interval.</p>
Full article ">
12 pages, 2363 KiB  
Article
Ultrasound Control of Cervical Regeneration after Large Loop Excision of the Transformation Zone: Results of an Innovative Measurement Technique
by Vincenzo Pinto, Miriam Dellino, Carla Mariaflavia Santarsiero, Gennaro Cormio, Vera Loizzi, Valentina Griseta, Antonella Vimercati, Gerardo Cazzato, Eliano Cascardi and Ettore Cicinelli
Diagnostics 2023, 13(4), 791; https://doi.org/10.3390/diagnostics13040791 - 20 Feb 2023
Cited by 2 | Viewed by 1901
Abstract
The objective of this research is to evaluate cervical regeneration after large loop excision of the transformation zone (LLETZ) through the identification of a new sonographic reference point at the level of the uterine margins. In the period March 2021–January 2022, a total [...] Read more.
The objective of this research is to evaluate cervical regeneration after large loop excision of the transformation zone (LLETZ) through the identification of a new sonographic reference point at the level of the uterine margins. In the period March 2021–January 2022, a total of 42 patients affected by CIN 2–3 were treated with LLETZ at the University Hospital of Bari (Italy). Before performing LLETZ, cervical length and volume were measured with trans-vaginal 3D ultrasound. From the multiplanar images, the cervical volume was obtained using the Virtual Organ Computer-aided AnaLysis (VOCAL™) program with manual contour mode. The line that connects the points where the common trunk of the uterine arteries reaches the uterus splitting into the ascending major branch and the cervical branch was considered as the upper limit of the cervical canal. From the acquired 3D volume, the length and the volume of the cervix were measured between this line and the external uterine os. Immediately after LLETZ, the removed cone was measured using Vernier’s caliper, and before fixation in formalin, the volume of the excised tissue was evaluated by the fluid displacement technique based on the Archimedes principle. The proportion of excised cervical volume was 25.50 ± 17.43%. The volume and the height of the excised cone were 1.61 ± 0.82 mL and 9.65 ± 2.49 mm corresponding to 14.74 ± 11.91% and 36.26 ± 15.49% of baseline values, respectively. The volume and length of the residual cervix were also assessed using 3D ultrasound up to the sixth month after excision. At 6 weeks, about 50% of cases reported an unchanged or lower cervical volume compared to the baseline pre-LLETZ values. The average percentage of volume regeneration in examined patients was equal to 9.77 ± 55.33%. In the same period, the cervical length regeneration rate was 69.41 ± 14.8%. Three months after LLETZ, a volume regeneration rate of 41.36 ± 28.31% was found. For the length, an average regeneration rate of 82.48 ± 15.25% was calculated. Finally, at 6 months, the percentage of regeneration of the excised volume was 90.99 ± 34.91%. The regrowth percentage of the cervical length was 91.07 ± 8.03%. The cervix measurement technique that we have proposed has the advantage of identifying an unequivocal reference point in 3D cervical measurement. Ultrasound 3D evaluation could be useful in the clinical practice to evaluate the cervical tissue deficit and express the “potential of cervical regeneration” as well as provide the surgeon useful information about the cervical length. Full article
Show Figures

Figure 1

Figure 1
<p>Color Doppler use for the identification of the point where the common trunk of the uterine artery reaches the lateral margin of the uterus (arrow).</p>
Full article ">Figure 2
<p>(<b>A</b>) B-mode image of the midsagittal view of the cervix after LLETZ. The contour of the cervix is manually drawn to measure the residual volume. The white arrow indicate the uterine external os; the yellow arrows indicate the upper limit of measurement. (<b>B</b>) Transverse view of the cervix. The arrows indicate the uterine arteries. (<b>C</b>) Coronal view of the cervix. (<b>D</b>) Cervical residual volume obtained by Virtual Organ Computer-Aided Analysis (VOCAL™).</p>
Full article ">Figure 3
<p>Flowchart with eligible patients and patients included in the study.</p>
Full article ">Figure 4
<p>Representation of cervical volume and length regeneration (%) at 6 weeks, 3 months and 6 months compared to the excised cone (tissue deficit regeneration).</p>
Full article ">Figure 5
<p>Representation of cervical volume and length regeneration (%) at 6 weeks, 3 months and 6 months not considering the cone size and compared to biometry before LLETZ.</p>
Full article ">Figure 6
<p>Agreement of VOCAL™ contour mode technique and the geometric formula of the cylinder in the measurement of cervical volume at Bland–Altman plot.</p>
Full article ">
11 pages, 646 KiB  
Article
Cardiometabolic Phenotyping in Heart Failure: Differences between Patients with Reduced vs. Preserved Ejection Fraction
by Alessio Balletti, Nicolò De Biase, Lavinia Del Punta, Francesco Filidei, Silvia Armenia, Filippo Masi, Valerio Di Fiore, Matteo Mazzola, Alessandra Bacca, Frank L. Dini, Stefano Taddei, Stefano Masi and Nicola Riccardo Pugliese
Diagnostics 2023, 13(4), 790; https://doi.org/10.3390/diagnostics13040790 - 20 Feb 2023
Cited by 1 | Viewed by 1750
Abstract
Aims. We explored multiple cardiometabolic patterns, including inflammatory and congestive pathways, in patients with heart failure (HF). Methods and Results. We enrolled 270 HF patients with reduced (<50%, HFrEF; n = 96) and preserved (≥50%, HFpEF; n = 174) ejection fraction. In HFpEF, [...] Read more.
Aims. We explored multiple cardiometabolic patterns, including inflammatory and congestive pathways, in patients with heart failure (HF). Methods and Results. We enrolled 270 HF patients with reduced (<50%, HFrEF; n = 96) and preserved (≥50%, HFpEF; n = 174) ejection fraction. In HFpEF, glycated hemoglobin (Hb1Ac) seemed to be relevant in its relationship with inflammation as Hb1Ac positively correlated with high-sensitivity C-reactive protein (hs-CRP; Spearman’s rank correlation coefficient ρ = 0.180, p < 0.05). In HFrEF, we found a correlation between Hb1Ac and norepinephrine (ρ = 0.207, p < 0.05). In HFpEF, we found a positive correlation between Hb1Ac and congestion expressed as pulmonary B lines (ρ = 0.187, p < 0.05); the inverse correlation, although not significant, was found in HFrEF between Hb1Ac and N-terminal pro-B-type natriuretic peptide (ρ = 0.079) and between Hb1Ac and B lines (ρ = −0.051). In HFrEF, we found a positive correlation between E/e’ ratio and Hb1Ac (ρ = 0.203, p < 0.05) and a negative correlation between tricuspid annular systolic excursion (TAPSE)/echocardiographically measured systolic pulmonary artery pressure (sPAP) (TAPSE/sPAP ratio) (ρ = −0.205, p < 0.05) and Hb1Ac. In HFpEF, we found a negative correlation between TAPSE/sPAP ratio and uric acid (ρ = −0.216, p < 0.05). Conclusion. In HF patients, HFpEF and HFrEF phenotypes are characterized by different cardiometabolic indices related to distinct inflammatory and congestive pathways. Patients with HFpEF showed an important relationship between inflammatory and cardiometabolic parameters. Conversely, in HFrEF, there is a significant relationship between congestion and inflammation, while cardiometabolism appears not to influence inflammation, instead affecting sympathetic hyperactivation. Full article
(This article belongs to the Special Issue Diagnosis and Treatment of Cardiac Diseases)
Show Figures

Figure 1

Figure 1
<p>Univariate correlation matrix for different markers of cardiometabolism, inflammation, and congestion using Spearman’s Rank correlation. Red shading indicates positive correlations, and blue shading indicates inverse correlations. White boxes are nonsignificant (<span class="html-italic">p</span> &gt; 0.05). HbA1c: glycated hemoglobin; hs-CRP: high-sensitivity C-reactive protein.</p>
Full article ">Figure 2
<p>Cardiometabolic phenotyping using glycated hemoglobin. Hb1Ac as a tool to understand the pathophysiology of heart failure with preserved ejection fraction. Hb1Ac in heart failure with reduced ejection fraction as a tool to assess disease severity. HbA1c: glycated hemoglobyn; HFpEF: heart failure with preserved ejection fraction; HFrEF: heart failure with reduced ejection fraction. Indeed, it has been demonstrated from a molecular and cellular perspective that metabolic dysregulation is essential in the pathophysiology of heart failure [<a href="#B16-diagnostics-13-00790" class="html-bibr">16</a>]. The myocardium is a metabolically very active tissue that can be affected by glucose and lipid metabolic alterations. In fact, under normal conditions, the myocardium uses predominantly fatty acids as a substrate to produce energy [<a href="#B17-diagnostics-13-00790" class="html-bibr">17</a>]. In heart failure, the shift from fatty acid utilization to glucose utilization as an energy source is well known [<a href="#B18-diagnostics-13-00790" class="html-bibr">18</a>]. Our study expands the usefulness of assessing cardiometabolism as an index of severity in HFrEF and a potential therapeutic target in HFpEF.</p>
Full article ">
11 pages, 1833 KiB  
Article
The Impact of Novel Reconstruction Algorithms on Calcium Scoring: Results on a Dedicated Cardiac CT Scanner
by Milán Vecsey-Nagy, Zsófia Jokkel, Ádám Levente Jermendy, Martin Nagy, Melinda Boussoussou, Borbála Vattay, Márton Kolossváry, Csaba Csobay-Novák, Sigal Amin-Spector, Béla Merkely and Bálint Szilveszter
Diagnostics 2023, 13(4), 789; https://doi.org/10.3390/diagnostics13040789 - 20 Feb 2023
Cited by 1 | Viewed by 2099
Abstract
Contemporary reconstruction algorithms yield the potential of reducing radiation exposure by denoising coronary computed tomography angiography (CCTA) datasets. We aimed to assess the reliability of coronary artery calcium score (CACS) measurements with an advanced adaptive statistical iterative reconstruction (ASIR-CV) and model-based adaptive filter [...] Read more.
Contemporary reconstruction algorithms yield the potential of reducing radiation exposure by denoising coronary computed tomography angiography (CCTA) datasets. We aimed to assess the reliability of coronary artery calcium score (CACS) measurements with an advanced adaptive statistical iterative reconstruction (ASIR-CV) and model-based adaptive filter (MBAF2) designed for a dedicated cardiac CT scanner by comparing them to the gold-standard filtered back projection (FBP) calculations. We analyzed non-contrast coronary CT images of 404 consecutive patients undergoing clinically indicated CCTA. CACS and total calcium volume were quantified and compared on three reconstructions (FBP, ASIR-CV, and MBAF2+ASIR-CV). Patients were classified into risk categories based on CACS and the rate of reclassification was assessed. Patients were categorized into the following groups based on FBP reconstructions: 172 zero CACS, 38 minimal (1–10), 87 mild (11–100), 57 moderate (101–400), and 50 severe (400<). Overall, 19/404 (4.7%) patients were reclassified into a lower-risk group with MBAF2+ASIR-CV, while 8 additional patients (27/404, 6.7%) shifted downward when applying stand-alone ASIR-CV. The total calcium volume with FBP was 7.0 (0.0–133.25) mm3, 4.0 (0.0–103.5) mm3 using ASIR-CV, and 5.0 (0.0–118.5) mm3 with MBAF2+ASIR-CV (all comparisons p < 0.001). The concomitant use of ASIR-CV and MBAF2 may allow the reduction of noise levels while maintaining similar CACS values as FBP measurements. Full article
Show Figures

Figure 1

Figure 1
<p>A representative example of a 61-year-old female patient with atypical chest pain. Acquisition acquired at routine dose reconstructed with FBP, ASIR-CV, and MBAF2+ASIR-CV. Both techniques markedly decreased image noise; however, the utilization of ASIR-CV resulted in the reclassification of the patient into a smaller cardiovascular risk group. FBP: filtered back projection; ASIR: adaptive statistical iterative reconstruction; MBAF2: model-based adaptive filter.</p>
Full article ">Figure 2
<p>Flowchart of the study. PCI: percutaneous coronary intervention; CABG: coronary artery bypass grafting.</p>
Full article ">Figure 3
<p>Violin plots showing the results of quantitative analysis of image noise obtained with FBP, ASIR-CV, and MBAF2+ASIR-CV algorithms. FBP: filtered back projection; ASIR: adaptive statistical iterative reconstruction; MBAF2: model-based adaptive filter.</p>
Full article ">Figure 4
<p>Sankey diagram of reclassification tendencies between different reconstruction methods. FBP: filtered back projection; MBAF2: model-based adaptive filter; ASIR: adaptive statistical iterative reconstruction.</p>
Full article ">Figure 5
<p>Bland–Altman plots demonstrating the differences observed between FBP and the different reconstruction techniques regarding Agatston scores. Compared with FBP, ASIR-CV underestimated calcium score by a mean of 14.1 (<b>A</b>), while on average, the combination of MBAF2 and ASIR-CV measured 10.5 less than FBP (<b>B</b>). FBP: filtered back projection; ASIR: adaptive statistical iterative reconstruction; MBAF2: model-based adaptive filter.</p>
Full article ">
24 pages, 2956 KiB  
Review
How to Identify Advanced Fibrosis in Adult Patients with Non-Alcoholic Fatty Liver Disease (NAFLD) and Non-Alcoholic Steatohepatitis (NASH) Using Ultrasound Elastography—A Review of the Literature and Proposed Multistep Approach
by Madalina-Gabriela Taru, Lidia Neamti, Vlad Taru, Lucia Maria Procopciuc, Bogdan Procopet and Monica Lupsor-Platon
Diagnostics 2023, 13(4), 788; https://doi.org/10.3390/diagnostics13040788 - 19 Feb 2023
Cited by 8 | Viewed by 4418
Abstract
Non-alcoholic fatty liver disease (NAFLD), and its progressive form, non-alcoholic steatohepatitis (NASH), represent, nowadays, real challenges for the healthcare system. Liver fibrosis is the most important prognostic factor for NAFLD, and advanced fibrosis is associated with higher liver-related mortality rates. Therefore, the key [...] Read more.
Non-alcoholic fatty liver disease (NAFLD), and its progressive form, non-alcoholic steatohepatitis (NASH), represent, nowadays, real challenges for the healthcare system. Liver fibrosis is the most important prognostic factor for NAFLD, and advanced fibrosis is associated with higher liver-related mortality rates. Therefore, the key issues in NAFLD are the differentiation of NASH from simple steatosis and identification of advanced hepatic fibrosis. We critically reviewed the ultrasound (US) elastography techniques for the quantitative characterization of fibrosis, steatosis, and inflammation in NAFLD and NASH, with a specific focus on how to differentiate advanced fibrosis in adult patients. Vibration-controlled transient elastography (VCTE) is still the most utilized and validated elastography method for liver fibrosis assessment. The recently developed point shear wave elastography (pSWE) and two-dimensional shear wave elastography (2D-SWE) techniques that use multiparametric approaches could bring essential improvements to diagnosis and risk stratification. Full article
Show Figures

Figure 1

Figure 1
<p>Vibration- controlled transient elastography (VCTE).</p>
Full article ">Figure 2
<p>Point shear wave elastography (pSWE) using Siemens equipment. The “red arrow” is pointing to the region of interest (ROI).</p>
Full article ">Figure 3
<p>Two-dimensional shear wave elastography (2D-SWE) using SuperSonic equipment.</p>
Full article ">Figure 4
<p>Screening algorithm for NAFLD-related Fibrosis. * the metabolic conditions include central obesity—waist circumference with ethnicity-specific cut-offs, serum triglycerides ≥150 mg/dL or specific treatment for hypertriglyceridemia, reduced serum high-density lipoprotein cholesterol &lt;40 mg/dL in males (&lt;50 mg/dL in females) or those undergoing a specific treatment, systolic blood pressure ≥130 mmHg, or diastolic blood pressure ≥85 mmHg or specific treatment, raised fasting plasma glucose between 100 mg/dL and 125 mg/dL (prediabetes) [<a href="#B128-diagnostics-13-00788" class="html-bibr">128</a>,<a href="#B129-diagnostics-13-00788" class="html-bibr">129</a>]; T2DM—type two diabetes mellitus; AST—aspartate aminotransferase; ALT—alanine aminotransferase; ** ≥30 g/day for men and ≥20 g/day for women; HBV—hepatitis B virus; HCV—hepatitis C virus; FIB4—Fibrosis-4 Index; LSM—liver stiffness measurement; T2DM—type two diabetes mellitus; VCTE—vibration-controlled transient elastography, whereby the values obtained with the XL probe are usually lower than those with the M probe [<a href="#B26-diagnostics-13-00788" class="html-bibr">26</a>]. (1) shear wave elastography (SWE) within the normal range can rule out significant liver fibrosis when in it is in agreement with the clinical and laboratory background [<a href="#B26-diagnostics-13-00788" class="html-bibr">26</a>], an LS ≤ 5 kPa presents high probability of being normal as recommended in the “rule of four” for acoustic radiation force impulse (ARFI) techniques [<a href="#B28-diagnostics-13-00788" class="html-bibr">28</a>], (2) VCTE &lt; 8 kPa rules out advanced fibrosis in NAFLD [<a href="#B123-diagnostics-13-00788" class="html-bibr">123</a>], (3) the 8 kPa and 12 kPa dual cut-offs have a better diagnostic accuracy of NAFLD-related cACLD than the previously established cut-offs do [<a href="#B115-diagnostics-13-00788" class="html-bibr">115</a>] (cACLD is a term introduced in 2015 to describe the spectrum of advanced fibrosis (≥F3) and cirrhosis (F4) in compensated patients) (4) cut-off result from a recently published meta-analysis [<a href="#B130-diagnostics-13-00788" class="html-bibr">130</a>], and (5) according to the Baveno VII criteria [<a href="#B51-diagnostics-13-00788" class="html-bibr">51</a>], *** ELF<sup>TM</sup> &lt; 9.8 or FibroMeter<sup>TM</sup> &lt; 0.45 or FibroTest<sup>®</sup> &lt; 0.48 to rule-out ≥F3 in NAFLD [<a href="#B123-diagnostics-13-00788" class="html-bibr">123</a>]. CSPH—clinical significant portal hypertension.</p>
Full article ">
11 pages, 922 KiB  
Article
Neoductgenesis in Ductal Carcinoma In Situ Coexists with Morphological Abnormalities Characteristic for More Aggressive Tumor Biology
by Agnieszka Łazarczyk, Joanna Streb, Przemysław Hałubiec, Anna Streb-Smoleń, Robert Jach, Diana Hodorowicz-Zaniewska, Elżbieta Łuczyńska and Joanna Szpor
Diagnostics 2023, 13(4), 787; https://doi.org/10.3390/diagnostics13040787 - 19 Feb 2023
Cited by 1 | Viewed by 1727
Abstract
Ductal carcinoma in situ (DCIS) is a non-invasive form of breast cancer that is generally indolent, however, could advance to invasive carcinoma in more than one-third of cases if left untreated. Thus, there is continuous research to find DCIS characteristics that would enable [...] Read more.
Ductal carcinoma in situ (DCIS) is a non-invasive form of breast cancer that is generally indolent, however, could advance to invasive carcinoma in more than one-third of cases if left untreated. Thus, there is continuous research to find DCIS characteristics that would enable clinicians to decide if it could be left without intensive treatment. Neoductgenesis (i.e., formation of the new duct of improper morphology) is a promising, but still not sufficiently evaluated indicator of future tumor invasiveness. We gathered data from 96 cases of DCIS (histopathological, clinical, and radiological) to assess the relationship between the neoductgenesis and well-established features of high-risk tumor behavior. Furthermore, our intention was to determine which degree of neoductgenesis should be considered clinically significant. Our major finding was that neoductgenesis is strictly related to other characteristics that indicate the invasive potential of the tumor and, to achieve more accurate prediction, neoductgenesis should be accordingly recognized to less strict criteria. Therefore, we conclude that neoductgenesis is another important revelator of tumor malignancy and that it requires further investigation during prospective controlled trials. Full article
(This article belongs to the Special Issue Diagnosis and Management of Gynecological Cancers: Volume 2)
Show Figures

Figure 1

Figure 1
<p>DCIS with signs of neoductgenesis. Hematoxylin-eosin stain. Magnification 100×. An asterisk (*) in each panel was added to indicate an example of the pathological duct. (<b>A</b>): focal concentration of duct-like structures and focal loss of normal ductal-lobular architecture–1 point, mild periductal lymphocytic infiltration–1 point, little fibrosis-like thickening of the periductal stroma–1 point, total score–3 points; (<b>B</b>): focal concentration of duct-like structures and focal loss of normal ductal-lobular architecture–1 point, intense periductal lymphocytic infiltration–2 points, no fibrosis-like thickening of the periductal stroma–0 points, total score: 3 points; (<b>C</b>): focal concentration of duct-like structures and focal loss of normal ductal-lobular architecture–1 point, no periductal lymphocytic infiltration–0 points, much fibrosis-like thickening of the periductal stroma–2 points, total score–3 points; (<b>D</b>): general concentration of duct-like structures and loss of normal ductal-lobular architecture–2 points, mild periductal lymphocytic infiltration–1 point, little fibrosis-like thickening of the periductal stroma–1 point, total points–4 points; (<b>E</b>), (<b>F</b>): focal concentration of duct-like structures and focal loss of normal ductal-lobular architecture–1 point, intense periductal lymphocytic infiltration–2 points, much fibrosis-like thickening of the periductal stroma–2 points, total score–5 points.</p>
Full article ">
13 pages, 293 KiB  
Article
Pressure Pain Thresholds and Central Sensitization in Relation to Psychosocial Predictors of Chronicity in Low Back Pain
by Anke Steinmetz, Franziska Hacke and Karl-Stefan Delank
Diagnostics 2023, 13(4), 786; https://doi.org/10.3390/diagnostics13040786 - 19 Feb 2023
Cited by 5 | Viewed by 2621
Abstract
(1) Background: Peripheral, as well as central, sensitization have been described in chronic low back pain (cLBP). The purpose of this study is to investigate the influence of psychosocial factors on the development of central sensitization. (2) Methods: This prospective study investigated local [...] Read more.
(1) Background: Peripheral, as well as central, sensitization have been described in chronic low back pain (cLBP). The purpose of this study is to investigate the influence of psychosocial factors on the development of central sensitization. (2) Methods: This prospective study investigated local and peripheral pressure pain thresholds and their dependence on psychosocial risk factors in patients with cLBP receiving inpatient multimodal pain therapy. Psychosocial factors were assessed using the Örebro Musculoskeletal Pain Screening Questionnaire (ÖMPSQ). (3) Results: A total of 90 patients were included in the study, 61 (75.4% women, 24.6% men) of whom had significant psychosocial risk factors. The control group consisted of 29 patients (62.1% women, 37.9% men). At baseline, patients with psychosocial risk factors showed significantly lower local and peripheral pressure pain thresholds, suggesting central sensitization, compared to the control group. Sleep quality, measured by the Pittsburgh Sleep Quality Index (PSQI), was also correlated with altered PPTs. After multimodal therapy, all participants reported increased local pain thresholds compared to at admission, independent of psychosocial chronification factors. (4) Conclusions: Psychosocial chronicity factors measured using the ÖMPSQ have a significant influence on pain sensitization in cLBP. A 14-day multimodal pain therapy increased local, but not peripheral, pressure pain thresholds. Full article
(This article belongs to the Special Issue Clinical Diagnosis and Treatment of Chronic Pain)
19 pages, 2407 KiB  
Review
The Role of Heart Rate Variability (HRV) in Different Hypertensive Syndromes
by Louise Buonalumi Tacito Yugar, Juan Carlos Yugar-Toledo, Nelson Dinamarco, Luis Gustavo Sedenho-Prado, Beatriz Vaz Domingues Moreno, Tatiane de Azevedo Rubio, Andre Fattori, Bruno Rodrigues, Jose Fernando Vilela-Martin and Heitor Moreno
Diagnostics 2023, 13(4), 785; https://doi.org/10.3390/diagnostics13040785 - 19 Feb 2023
Cited by 19 | Viewed by 6991
Abstract
Cardiac innervation by the parasympathetic nervous system (PNS) and the sympathetic nervous system (SNS) modulates the heart rate (HR) (chronotropic activity) and the contraction of the cardiac muscle (inotropic activity). The peripheral vasculature is controlled only by the SNS, which is responsible for [...] Read more.
Cardiac innervation by the parasympathetic nervous system (PNS) and the sympathetic nervous system (SNS) modulates the heart rate (HR) (chronotropic activity) and the contraction of the cardiac muscle (inotropic activity). The peripheral vasculature is controlled only by the SNS, which is responsible for peripheral vascular resistance. This also mediates the baroreceptor reflex (BR), which in turn mediates blood pressure (BP). Hypertension (HTN) and the autonomic nervous system (ANS) are closely related, such that derangements can lead to vasomotor impairments and several comorbidities, including obesity, hypertension, resistant hypertension, and chronic kidney disease. Autonomic dysfunction is also associated with functional and structural changes in target organs (heart, brain, kidneys, and blood vessels), increasing cardiovascular risk. Heart rate variability (HRV) is a method of assessing cardiac autonomic modulation. This tool has been used for clinical evaluation and to address the effect of therapeutic interventions. The present review aims (a) to approach the heart rate (HR) as a CV risk factor in hypertensive patients; (b) to analyze the heart rate variability (HRV) as a “tool” to estimate the individual risk stratum for Pre-HTN (P-HTN), Controlled-HTN (C-HTN), Resistant and Refractory HTN (R-HTN and Rf-HTN, respectively), and hypertensive patients with chronic renal disease (HTN+CKD). Full article
(This article belongs to the Special Issue New Progress in Diagnostics of Clinical Hypertension)
Show Figures

Figure 1

Figure 1
<p>RR interval measurements on an ECG.</p>
Full article ">Figure 2
<p>(<b>A</b>) Analysis of HRV by geometric methods. Triangular Indexes of Heart Rate Variability (RRtri and TINN). h: height of the yellow triangle. (<b>B</b>) Baevsky’s stress index (SI).</p>
Full article ">Figure 3
<p>Analysis of the Poincare’s plot—Consecutive RR intervals (RRn) are plotted on the <span class="html-italic">x</span>-axis versus the next interval (RRn+1) on the <span class="html-italic">y</span>-axis.</p>
Full article ">Figure 4
<p>HRV spectrum estimates using FFT-based Welch’s periodogram method (left) and autoregressive (AR) modeling-based spectrum estimation method.</p>
Full article ">Figure 5
<p>Frequency (Hz) and amplitude (ms<sup>2</sup>) evaluate the spectral components. The area under each part allows the division of the spectral density into bands of frequencies. VLF: very-low-frequency band; LF: low-frequency band; HF—high-frequency band.</p>
Full article ">Figure 6
<p>HR Variability (HRV) reports from a healthy subject. (<b>A</b>): Time-domain variables analysis (Mean RR, Mean HR, Min HR, Max HR, SDNN, RMSSD, NN50, pNN50, RR triangular index, and TINN, as described in the text); (<b>B</b>): frequency-domain variables analysis (FFT spectrum): Very Low (VLF), Low (LF) and High (HF) bands of frequencies; (<b>C</b>): Nonlinear results analysis with Poincare’s plot based on RR distribution and geometrical modeling for an ellipsis. Figures from our archive made with the software Kubios. *: Results are calculated from the non-detrended selected RR series.</p>
Full article ">Figure 7
<p>HR Variability (HRV) reports from a diabetic and resistant hypertensive subject. (<b>A</b>): time-domain variables analysis (Mean RR, Mean HR, Min HR, Max HR, SDNN, RMSSD, NN50, pNN50, RR triangular index, and TINN, as described in the text); (<b>B</b>): frequency-domain variables analysis (FFT spectrum): Very Low (VLF), Low (LF) and High (HF) bands of frequencies; (<b>C</b>): Nonlinear results analysis with Poincare’s Plot based on RR distribution and geometrical modeling for an ellipsis. Figures from our archive made with the software Kubios. *: Results are calculated from the non-detrended selected RR series.</p>
Full article ">
Previous Issue
Next Issue
Back to TopTop