[go: up one dir, main page]

Next Issue
Volume 13, December-1
Previous Issue
Volume 13, November-1


Diagnostics, Volume 13, Issue 22 (November-2 2023) – 95 articles

Cover Story (view full-size image): 
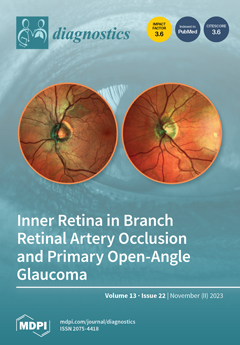
Delayed or late presentation of BRAO, after the acute phase findings have resolved, may result in a relatively normal-looking fundus. The resultant inner retinal changes and visual field defects can resemble primary open-angle glaucoma, particularly when patients are asymptomatic and there are no evident signs of BRAO. This study assessed and compared the tomographic thickness of retinal layers in patients with BRAO and glaucoma. Inner nuclear layer thinning and hemisphere asymmetry difference over 17 μm in total retinal layer thinning is suggestive of temporal BRAO. This information is particularly useful in the diagnosis of previously undiagnosed BRAO and may help prevent further retinal arterial occlusion and possible cerebrovascular incidents. View this paper
  • Issues are regarded as officially published after their release is announced to the table of contents alert mailing list.
  • You may sign up for e-mail alerts to receive table of contents of newly released issues.
  • PDF is the official format for papers published in both, html and pdf forms. To view the papers in pdf format, click on the "PDF Full-text" link, and use the free Adobe Reader to open them.
Order results
Result details
Section
Select all
Export citation of selected articles as:
22 pages, 3628 KiB  
Review
Dynamic Contrast-Enhanced Study in the mpMRI of the Prostate—Unnecessary or Underutilised? A Narrative Review
by Silva Guljaš, Zdravka Dupan Krivdić, Maja Drežnjak Madunić, Mirela Šambić Penc, Oliver Pavlović, Vinko Krajina, Deni Pavoković, Petra Šmit Takač, Marin Štefančić and Tamer Salha
Diagnostics 2023, 13(22), 3488; https://doi.org/10.3390/diagnostics13223488 - 20 Nov 2023
Cited by 2 | Viewed by 2156
Abstract
The aim of this review is to summarise recent scientific literature regarding the clinical use of DCE-MRI as a component of multiparametric resonance imaging of the prostate. This review presents the principles of DCE-MRI acquisition and analysis, the current role of DCE-MRI in [...] Read more.
The aim of this review is to summarise recent scientific literature regarding the clinical use of DCE-MRI as a component of multiparametric resonance imaging of the prostate. This review presents the principles of DCE-MRI acquisition and analysis, the current role of DCE-MRI in clinical practice with special regard to its role in presently available categorisation systems, and an overview of the advantages and disadvantages of DCE-MRI described in the current literature. DCE-MRI is an important functional sequence that requires intravenous administration of a gadolinium-based contrast agent and gives information regarding the vascularity and capillary permeability of the lesion. Although numerous studies have confirmed that DCE-MRI has great potential in the diagnosis and monitoring of prostate cancer, its role is still inadequate in the PI-RADS categorisation. Moreover, there have been numerous scientific discussions about abandoning the intravenous application of gadolinium-based contrast as a routine part of MRI examination of the prostate. In this review, we summarised the recent literature on the advantages and disadvantages of DCE-MRI, focusing on an overview of currently available data on bpMRI and mpMRI, as well as on studies providing information on the potential better usability of DCE-MRI in improving the sensitivity and specificity of mpMRI examinations of the prostate. Full article
(This article belongs to the Section Pathology and Molecular Diagnostics)
Show Figures

Figure 1

Figure 1
<p>A 47-year-old male patient underwent mpMRI due to a slightly elevated serum PSA level. There were no suspicious findings. Figures present original examples of standard anatomical and functional sequences, respectively: (<b>a</b>) T2W and (<b>b</b>) T1W; (<b>c</b>) DWI; (<b>d</b>) ADC map; and (<b>e</b>) DCE.</p>
Full article ">Figure 2
<p>The mpMRI performed on a 75-year-old male patient shows a right peripheral zone prostate lesion (white arrow) that was confirmed to be cancer on biopsy; Gleason score 4 + 3 = 7. The images present the following: (<b>a</b>) T2W as a hypointense focal lesion; (<b>b</b>) DWI b = 1400 s/mm<sup>3</sup>; (<b>c</b>) ADC map demonstrates highly restricted diffusion and early contrast enhancement; (<b>d</b>) raw data; (<b>e</b>) semi-quantitative colour-coded parametric map for a wash-in; (<b>f</b>) pharmacokinetic quantitative colour-coded parametric map for Ktrans.</p>
Full article ">Figure 3
<p>Schematic diagram of the DCE-MRI time-signal intensity (semi-quantitative analysis)/time-concentration (quantitative analysis) enhancement kinetic curves: Type 1 (progressive), type 2 (plateau), and type 3 (wash-in and wash-out).</p>
Full article ">Figure 4
<p>Schematic diagram of PI-RADS v.2.1. in which DCE-MRI has a role only in peripheral zone lesions categorised on DWI as PI-RADS 3—if those lesions show early arterial accumulation of contrast, DCE-MRI is considered positive, and lesions are upgraded to PI-RADS 4.</p>
Full article ">Figure 5
<p>Schematic diagram of the PI-RR score in patients after radiation therapy. DWI and DCE have the key role, and the final score is defined by the sequence with a higher score.</p>
Full article ">Figure 6
<p>Schematic diagram of the PI-RR score in patients after radical prostatectomy, where DCE has a key role in the final score.</p>
Full article ">Figure 7
<p>mpMRI shows a left transitional zone prostate lesion (white arrow) in a 69-year-old male patient, which was confirmed to be cancer on biopsy; Gleason score 4 + 3 = 7. It can be seen on (<b>a</b>) T2W as a hypointense focal lesion. The lesion is obscured on (<b>b</b>) DWI b = 1400 s/mm<sup>3</sup> and (<b>c</b>) ADC maps that are of suboptimal diagnostic quality due to artifacts. DCE-MRI does not demonstrate early contrast enhancement on the (<b>d</b>) pharmacokinetic quantitative colour-coded parametric map for K<sub>trans</sub>.</p>
Full article ">Figure 8
<p>mpMRI shows a right peripheral zone prostate lesion (white arrow) in a 72-year-old male patient, which was confirmed to be cancer on biopsy; Gleason score 3 + 3 = 6. The images present (<b>a</b>) T2W as a lightly hypointense focal lesion, obscured on (<b>b</b>) ADC map due to artifacts, and the most noticeable on (<b>c</b>) DCE-MRI, which demonstrates early contrast enhancement on the pharmacokinetic quantitative colour-coded parametric map for K<sub>trans</sub>.</p>
Full article ">
17 pages, 2149 KiB  
Article
Depth-Resolved Attenuation Mapping of the Vaginal Wall under Prolapse and after Laser Treatment Using Cross-Polarization Optical Coherence Tomography: A Pilot Study
by Ekaterina Gubarkova, Arseniy Potapov, Alexander Moiseev, Elena Kiseleva, Darya Krupinova, Ksenia Shatilova, Maria Karabut, Andrey Khlopkov, Maria Loginova, Stefka Radenska-Lopovok, Grigory Gelikonov, Gennady Grechkanev, Natalia Gladkova and Marina Sirotkina
Diagnostics 2023, 13(22), 3487; https://doi.org/10.3390/diagnostics13223487 - 20 Nov 2023
Cited by 1 | Viewed by 1321
Abstract
Vaginal wall prolapse is the most common type of pelvic organ prolapse and is mainly associated with collagen bundle changes in the lamina propria. Neodymium (Nd:YAG) laser treatment was used as an innovative, minimally invasive and non-ablative procedure for the treatment of early-stage [...] Read more.
Vaginal wall prolapse is the most common type of pelvic organ prolapse and is mainly associated with collagen bundle changes in the lamina propria. Neodymium (Nd:YAG) laser treatment was used as an innovative, minimally invasive and non-ablative procedure for the treatment of early-stage vaginal wall prolapse. The purpose of this pilot study was to assess connective tissue changes in the vaginal wall under prolapse without treatment and after Nd:YAG laser treatment using cross-polarization optical coherence tomography (CP OCT) with depth-resolved attenuation mapping. A total of 26 freshly excised samples of vaginal wall from 26 patients with age norm (n = 8), stage I–II prolapses without treatment (n = 8) and stage I–II prolapse 1–2 months after Nd:YAG laser treatment (n = 10) were assessed. As a result, for the first time, depth-resolved attenuation maps of the vaginal wall in the B-scan projection in the co- and cross-polarization channels were constructed. Two parameters within the lamina propria were target calculated: the median value and the percentages of high (≥4 mm−1) and low (<4 mm−1) attenuation coefficient values. A significant (p < 0.0001) decrease in the parameters in the case of vaginal wall prolapse compared to the age norm was identified. After laser treatment, a significant (p < 0.0001) increase in the parameters compared to the normal level was also observed. Notably, in the cross-channel, both parameters showed a greater difference between the groups than in the co-channel. Therefore, using the cross-channel achieved more reliable differentiation between the groups. To conclude, attenuation coefficient maps allow visualization and quantification of changes in the condition of the connective tissue of the vaginal wall. In the future, CP OCT could be used for in vivo detection of early-stage vaginal wall prolapse and for monitoring the effectiveness of treatment. Full article
(This article belongs to the Special Issue Advanced Role of Optical Coherence Tomography in Clinical Medicine)
Show Figures

Figure 1

Figure 1
<p>Overview of the methodology for construction and processing of the dataset. Each sample was scanned with the CP OCT system, and B-scans were obtained. After that, attenuation coefficient maps were built and compared to the labeled cross-sectional histology to define and analyze the ROI within the lamina propria (yellow rectangles). Two parameters—median values of the attenuation coefficient and percentage ratio with values above/below a certain threshold within the same ROI—were calculated. A threshold equal to 4 mm<sup>−1</sup> was proposed to binary-separate pixels with high values from low ones (see binarized attenuation maps).</p>
Full article ">Figure 2
<p>Attenuation coefficient mapping for the vaginal wall at different states: age norm (left column, (<b>a1</b>–<b>e1</b>)), stages I–II prolapse (central column, (<b>a2</b>–<b>e2</b>)), stages I–II prolapse after laser treatment (right column, (<b>a3</b>–<b>e3</b>)). Depth-resolved attenuation maps in co- (<b>a1</b>–<b>a3</b>) and cross- (<b>b1</b>–<b>b3</b>) channels. (<b>c1</b>–<b>c3</b>) Overview of histological images stained with Van-Gieson’s show two-layer tissue architecture with a sharp border between the glycogenated epithelium and the lamina propria underlying it (×200); (<b>d1</b>–<b>d3</b>) an enlarged area of the subepithelial region of the lamina propria showing different thicknesses and patterns of arrangement of collagen bundles (×1000); (<b>e1</b>–<b>e3</b>) immunohistochemical examination with Podoplanin; the area of the lamina propria is demonstrated, where orange arrows indicate lymphatic vessels (×1000). In the attenuation coefficient maps, the white rectangles are the areas corresponding to the histological images in (<b>c1</b>–<b>c4</b>), and the orange arrows indicate lymphatic vessels. Abbreviations: E—epithelium, LP—lamina propria.</p>
Full article ">Figure 3
<p>Boxplots for (<b>a</b>) Att(co) and (<b>b</b>) Att(cross) coefficients counted for three states of vaginal wall tissue. Center line in the boxes—median; box limits—25th and 75th percentiles; whiskers—minimum and maximum values within the 1.5× interquartile range of the first and third quartile. Segment indicates a statistically significant difference between the study groups (Mann–Whitney U-test with Bonferroni correction for multiple comparisons), where <span class="html-italic">p</span>—the magnitude of the statistical significance of the differences between states of vaginal wall tissue, and <span class="html-italic">n</span>—is the number of examined images for each group.</p>
Full article ">Figure 4
<p>Binarized attenuation maps in co- (<b>a1</b>–<b>a3</b>) and cross- (<b>b1</b>–<b>b3</b>) channels for three states of the vaginal wall: age norm (<b>a1</b>,<b>b1</b>), stage I–II prolapse (<b>a2</b>,<b>b2</b>) and stage I–II prolapse after Nd:YAG laser treatment (<b>a3</b>,<b>b3</b>) and its quantitative assessment (<b>c</b>,<b>d</b>) by calculation of the percentage of pixels with high (red color) and low (blue color) Att(co) (<b>c</b>) and Att(cross) (<b>d</b>) values (<span class="html-italic">n</span>—the number of examined images for each group). Binarization was performed using a threshold of 4 mm<sup>−1</sup>.</p>
Full article ">
14 pages, 1269 KiB  
Article
A Study on the Factors and Prediction Model of Triple-Negative Breast Cancer for Public Health Promotion
by Young-Hee Nam
Diagnostics 2023, 13(22), 3486; https://doi.org/10.3390/diagnostics13223486 - 20 Nov 2023
Cited by 1 | Viewed by 1190
Abstract
This study was conducted to identify the risk causes and predictive models based on the clinical features of patients with breast cancer classified as triple-negative breast cancer (TNBC) and non-triple-negative breast cancer (non-TNBCs) using Korean cancer statistics. A total of 2045 cases that [...] Read more.
This study was conducted to identify the risk causes and predictive models based on the clinical features of patients with breast cancer classified as triple-negative breast cancer (TNBC) and non-triple-negative breast cancer (non-TNBCs) using Korean cancer statistics. A total of 2045 cases that underwent three types of hormone receptor tests were obtained from Korean cancer data in 2016. Research data were analyzed with the software SPSS Ver. 26.0. TNBC and non-TNBCs accounted for 12.4% and 87.6% of the data, respectively. Tubular and lobular tumors occurred most frequently in the external quadrant of the breast (C50.4–C50.5; 43.1%). Compared to non-TNBCs, the incidence of TNBC was the most common in patients under the age of 39 (19.5%), followed by those over the age of 70 (17.3%). Tumors larger than 2 cm accounted for 16.0%, which was higher than the number of tumors smaller than 2 cm. Cases in stage IV cancer represented 21.7% of the data. Additionally, 21.0% of the patients were in the SEER stage of distant metastasis, which was the most prevalent SEER (surveillance, epidemiology, and end outcomes) stage. Neoadjuvant therapy was administered more frequently, with a rate of 24.1%. In the logistic regression and decision-making tree model, the variables that affected TNBC were age, differentiation grade, and neoadjuvant therapy. The predictive accuracies of logistic regression and decision-making tree models were 87.8% and 87.6%, respectively. In a decision-marking tree model, the differentiation grades of TNBC affect neoadjuvant therapy, and neoadjuvant therapy affects the cancer stage. Therefore, in order to promote the health of breast cancer patients, it is urgent to apply an intensive early health check-up program for those in their 40s and 50s with a high prevalence of TNBC. For patients with breast cancer, in TNBC cases, except for poorly differentiated cases, neoadjuvant therapy must be applied first at all differentiation grades. The establishment of a policy system is necessary for the success of this process. Full article
Show Figures

Figure 1

Figure 1
<p>Breast cancer prediction model (CART).</p>
Full article ">Figure 2
<p>Breast cancer prediction model (CHAID).</p>
Full article ">
21 pages, 6612 KiB  
Article
Early Detection of Lung Nodules Using a Revolutionized Deep Learning Model
by Durgesh Srivastava, Santosh Kumar Srivastava, Surbhi Bhatia Khan, Hare Ram Singh, Sunil K. Maakar, Ambuj Kumar Agarwal, Areej A. Malibari and Eid Albalawi
Diagnostics 2023, 13(22), 3485; https://doi.org/10.3390/diagnostics13223485 - 20 Nov 2023
Cited by 14 | Viewed by 3447
Abstract
According to the WHO (World Health Organization), lung cancer is the leading cause of cancer deaths globally. In the future, more than 2.2 million people will be diagnosed with lung cancer worldwide, making up 11.4% of every primary cause of cancer. Furthermore, lung [...] Read more.
According to the WHO (World Health Organization), lung cancer is the leading cause of cancer deaths globally. In the future, more than 2.2 million people will be diagnosed with lung cancer worldwide, making up 11.4% of every primary cause of cancer. Furthermore, lung cancer is expected to be the biggest driver of cancer-related mortality worldwide in 2020, with an estimated 1.8 million fatalities. Statistics on lung cancer rates are not uniform among geographic areas, demographic subgroups, or age groups. The chance of an effective treatment outcome and the likelihood of patient survival can be greatly improved with the early identification of lung cancer. Lung cancer identification in medical pictures like CT scans and MRIs is an area where deep learning (DL) algorithms have shown a lot of potential. This study uses the Hybridized Faster R-CNN (HFRCNN) to identify lung cancer at an early stage. Among the numerous uses for which faster R-CNN has been put to good use is identifying critical entities in medical imagery, such as MRIs and CT scans. Many research investigations in recent years have examined the use of various techniques to detect lung nodules (possible indicators of lung cancer) in scanned images, which may help in the early identification of lung cancer. One such model is HFRCNN, a two-stage, region-based entity detector. It begins by generating a collection of proposed regions, which are subsequently classified and refined with the aid of a convolutional neural network (CNN). A distinct dataset is used in the model’s training process, producing valuable outcomes. More than a 97% detection accuracy was achieved with the suggested model, making it far more accurate than several previously announced methods. Full article
Show Figures

Figure 1

Figure 1
<p>Architecture of the proposed model where integration of FPN (feature pyramid network), ASAR (adjusting anchor scales and aspect ratios), ǖ (intersection over union), and Я (bounding box regression) enhance the processing capability of F-RCNN on the available dataset, LIDC-IDRI, in nodule detection.</p>
Full article ">Figure 2
<p>Illustration of the HFRCNN workflow, emphasizing the strategic use of Ǻ (representing a collection of anchor boxes), δ (denoting various anchor scales), and ꭆ (indicating a range of anchor aspect ratios). These elements collaboratively contribute to the generation of feature maps, <math display="inline"><semantics> <mrow> <msubsup> <mi>G</mi> <mi>n</mi> <mrow> <msub> <mi>F</mi> <mi>N</mi> </msub> </mrow> </msubsup> </mrow> </semantics></math>, within the feature pyramid network (FPN), optimizing the detection of nodules.</p>
Full article ">Figure 3
<p>Analysis of detection accuracy.</p>
Full article ">Figure 4
<p>Precision evaluation in the lung nodule detection process.</p>
Full article ">Figure 5
<p>Analysis of ROC-AUC.</p>
Full article ">Figure 6
<p>Evaluation of ǖ.</p>
Full article ">Figure 7
<p>FROC curve.</p>
Full article ">Figure 8
<p>Ground truth vs. predicted ROIs.</p>
Full article ">Figure 9
<p>HFRCNN adaptation across different medical imaging modalities and healthcare systems.</p>
Full article ">Figure 10
<p>Comparative analysis of patient survival rates and healthcare costs before and after the implementation of HFRCNN over a three-month period.</p>
Full article ">Figure 11
<p>Effectiveness of the integration of HFRCNN into global telemedicine platforms.</p>
Full article ">
13 pages, 1699 KiB  
Systematic Review
Prognosis Following Surgery for Recurrent Ovarian Cancer and Diagnostic Criteria Predictive of Cytoreduction Success: A Systematic Review and Meta-Analysis
by Faiza Gaba, Oleg Blyuss, Dhivya Chandrasekaran, Nicolò Bizzarri, Basel Refky, Desmond Barton, Thomas Ind, Marielle Nobbenhuis, John Butler, Owen Heath, Arjun Jeyarajah, Elly Brockbank, Alexandra Lawrence, Ranjit Manchanda, James Dilley, Saurabh Phadnis and on behalf of the GO SOAR Collaborative
Diagnostics 2023, 13(22), 3484; https://doi.org/10.3390/diagnostics13223484 - 20 Nov 2023
Cited by 3 | Viewed by 1526
Abstract
For women achieving clinical remission after the completion of initial treatment for epithelial ovarian cancer, 80% with advanced-stage disease will develop recurrence. However, the standard treatment of women with recurrent platinum-sensitive diseases remains poorly defined. Secondary (SCS), tertiary (TCS) or quaternary (QCS) cytoreduction [...] Read more.
For women achieving clinical remission after the completion of initial treatment for epithelial ovarian cancer, 80% with advanced-stage disease will develop recurrence. However, the standard treatment of women with recurrent platinum-sensitive diseases remains poorly defined. Secondary (SCS), tertiary (TCS) or quaternary (QCS) cytoreduction surgery for recurrence has been suggested to be associated with increased overall survival (OS). We searched five databases for studies reporting death rate, OS, cytoreduction rates, post-operative morbidity/mortality and diagnostic models predicting complete cytoreduction in a platinum-sensitive disease recurrence setting. Death rates calculated from raw data were pooled based on a random-effects model. Meta-regression/linear regression was performed to explore the role of complete or optimal cytoreduction as a moderator. Pooled death rates were 45%, 51%, 66% for SCS, TCS and QCS, respectively. Median OS for optimal cytoreduction ranged from 16–91, 24–99 and 39–135 months for SCS, TCS and QCS, respectively. Every 10% increase in complete cytoreduction rates at SCS corresponds to a 7% increase in median OS. Complete cytoreduction rates ranged from 9–100%, 35–90% and 33–100% for SCS, TCS and QCS, respectively. Major post-operative thirty-day morbidity was reported to range from 0–47%, 13–33% and 15–29% for SCS, TCS and QCS, respectively. Thirty-day post-operative mortality was 0–6%, 0–3% and 0–2% for SCS, TCS and QCS, respectively. There were two externally validated diagnostic models predicting complete cytoreduction at SCS, but none for TCS and QCS. In conclusion, our data confirm that maximal effort higher order cytoreductive surgery resulting in complete cytoreduction can improve survival. Full article
(This article belongs to the Section Pathology and Molecular Diagnostics)
Show Figures

Figure 1

Figure 1
<p>Forest plot of the death rate for secondary cytoreduction surgery [<a href="#B4-diagnostics-13-03484" class="html-bibr">4</a>,<a href="#B6-diagnostics-13-03484" class="html-bibr">6</a>,<a href="#B11-diagnostics-13-03484" class="html-bibr">11</a>,<a href="#B12-diagnostics-13-03484" class="html-bibr">12</a>,<a href="#B13-diagnostics-13-03484" class="html-bibr">13</a>,<a href="#B14-diagnostics-13-03484" class="html-bibr">14</a>,<a href="#B15-diagnostics-13-03484" class="html-bibr">15</a>,<a href="#B16-diagnostics-13-03484" class="html-bibr">16</a>,<a href="#B17-diagnostics-13-03484" class="html-bibr">17</a>,<a href="#B18-diagnostics-13-03484" class="html-bibr">18</a>,<a href="#B19-diagnostics-13-03484" class="html-bibr">19</a>,<a href="#B20-diagnostics-13-03484" class="html-bibr">20</a>,<a href="#B21-diagnostics-13-03484" class="html-bibr">21</a>,<a href="#B22-diagnostics-13-03484" class="html-bibr">22</a>,<a href="#B23-diagnostics-13-03484" class="html-bibr">23</a>,<a href="#B24-diagnostics-13-03484" class="html-bibr">24</a>,<a href="#B25-diagnostics-13-03484" class="html-bibr">25</a>,<a href="#B26-diagnostics-13-03484" class="html-bibr">26</a>,<a href="#B27-diagnostics-13-03484" class="html-bibr">27</a>,<a href="#B29-diagnostics-13-03484" class="html-bibr">29</a>,<a href="#B30-diagnostics-13-03484" class="html-bibr">30</a>,<a href="#B31-diagnostics-13-03484" class="html-bibr">31</a>,<a href="#B32-diagnostics-13-03484" class="html-bibr">32</a>,<a href="#B33-diagnostics-13-03484" class="html-bibr">33</a>,<a href="#B34-diagnostics-13-03484" class="html-bibr">34</a>,<a href="#B35-diagnostics-13-03484" class="html-bibr">35</a>,<a href="#B37-diagnostics-13-03484" class="html-bibr">37</a>,<a href="#B38-diagnostics-13-03484" class="html-bibr">38</a>,<a href="#B39-diagnostics-13-03484" class="html-bibr">39</a>,<a href="#B40-diagnostics-13-03484" class="html-bibr">40</a>,<a href="#B41-diagnostics-13-03484" class="html-bibr">41</a>,<a href="#B42-diagnostics-13-03484" class="html-bibr">42</a>,<a href="#B43-diagnostics-13-03484" class="html-bibr">43</a>,<a href="#B71-diagnostics-13-03484" class="html-bibr">71</a>].</p>
Full article ">Figure 2
<p>Forest plot of the death rate for tertiary cytoreduction surgery [<a href="#B72-diagnostics-13-03484" class="html-bibr">72</a>,<a href="#B73-diagnostics-13-03484" class="html-bibr">73</a>,<a href="#B76-diagnostics-13-03484" class="html-bibr">76</a>,<a href="#B78-diagnostics-13-03484" class="html-bibr">78</a>,<a href="#B79-diagnostics-13-03484" class="html-bibr">79</a>].</p>
Full article ">Figure 3
<p>Forest plot of the death rate for quaternary cytoreduction surgery [<a href="#B80-diagnostics-13-03484" class="html-bibr">80</a>,<a href="#B83-diagnostics-13-03484" class="html-bibr">83</a>].</p>
Full article ">
12 pages, 2075 KiB  
Review
Recent Advances in the Field of Artificial Intelligence for Precision Medicine in Patients with a Diagnosis of Metastatic Cutaneous Melanoma
by Hayley Higgins, Abanoub Nakhla, Andrew Lotfalla, David Khalil, Parth Doshi, Vandan Thakkar, Dorsa Shirini, Maria Bebawy, Samy Ammari, Egesta Lopci, Lawrence H. Schwartz, Michael Postow and Laurent Dercle
Diagnostics 2023, 13(22), 3483; https://doi.org/10.3390/diagnostics13223483 - 20 Nov 2023
Cited by 1 | Viewed by 2007
Abstract
Standard-of-care medical imaging techniques such as CT, MRI, and PET play a critical role in managing patients diagnosed with metastatic cutaneous melanoma. Advancements in artificial intelligence (AI) techniques, such as radiomics, machine learning, and deep learning, could revolutionize the use of medical imaging [...] Read more.
Standard-of-care medical imaging techniques such as CT, MRI, and PET play a critical role in managing patients diagnosed with metastatic cutaneous melanoma. Advancements in artificial intelligence (AI) techniques, such as radiomics, machine learning, and deep learning, could revolutionize the use of medical imaging by enhancing individualized image-guided precision medicine approaches. In the present article, we will decipher how AI/radiomics could mine information from medical images, such as tumor volume, heterogeneity, and shape, to provide insights into cancer biology that can be leveraged by clinicians to improve patient care both in the clinic and in clinical trials. More specifically, we will detail the potential role of AI in enhancing detection/diagnosis, staging, treatment planning, treatment delivery, response assessment, treatment toxicity assessment, and monitoring of patients diagnosed with metastatic cutaneous melanoma. Finally, we will explore how these proof-of-concept results can be translated from bench to bedside by describing how the implementation of AI techniques can be standardized for routine adoption in clinical settings worldwide to predict outcomes with great accuracy, reproducibility, and generalizability in patients diagnosed with metastatic cutaneous melanoma. Full article
(This article belongs to the Section Medical Imaging and Theranostics)
Show Figures

Figure 1

Figure 1
<p>Overview of imaging modalities and methods that can be used with AI. MRI, SPECT, PET, and CT are all primarily involved with the diagnosis of metastatic melanoma. Integrating AI into imaging allows clinicians to find a segment of interest and then extract features to draw correlations and identify the most important features. AI models are created with these data and can be used to diagnose, prognosticate, treat, and monitor metastatic melanoma [<a href="#B2-diagnostics-13-03483" class="html-bibr">2</a>,<a href="#B4-diagnostics-13-03483" class="html-bibr">4</a>,<a href="#B11-diagnostics-13-03483" class="html-bibr">11</a>,<a href="#B13-diagnostics-13-03483" class="html-bibr">13</a>,<a href="#B14-diagnostics-13-03483" class="html-bibr">14</a>].</p>
Full article ">
10 pages, 4013 KiB  
Article
Multi-Asymmetric Irradiation Method Using a Ring Array to Obtain an Emission-Capable LED Beam Power Effect to Observe Cancer Removal Status in a Surgical Microscope
by Seon Min Lee, Kicheol Yoon, Sangyun Lee, Seung Yeob Ryu and Kwang Gi Kim
Diagnostics 2023, 13(22), 3482; https://doi.org/10.3390/diagnostics13223482 - 20 Nov 2023
Cited by 2 | Viewed by 1094
Abstract
The light emitting diodes (LEDs) used in surgical fluorescence microscopes have weak power, to induce fluorescence emission. The LED induces fluorescence emission throughout a lesion due to its large beam width; however, the beam irradiation intensity is not uniform within the beam width, [...] Read more.
The light emitting diodes (LEDs) used in surgical fluorescence microscopes have weak power, to induce fluorescence emission. The LED induces fluorescence emission throughout a lesion due to its large beam width; however, the beam irradiation intensity is not uniform within the beam width, resulting in a fluorescence emission induction difference. To overcome this problem, this study proposes an asymmetric irradiation array for supplying power uniformly throughout the beam width of the LED and increasing the intensity of the LED. To increase the irradiation power of the LEDs, a multi-asymmetric irradiation method with a ring-type array structure was used. The LED consisted of eight rings, and the space between the LEDs, the placement position, and the placement angle were analyzed to devise an experimental method using 3D printing technology. To test the irradiation power of the LED, the working distance (WD) between the LED and target was 30 cm. The bias voltage of the LED for irradiating the light source was 5.0 V and the measured power was 4.63 mW. The brightness (lux) was 1153 lx. Consequently, the LED satisfied the fluorescence emission induction conditions. The diameter of the LED-irradiated area was 9.5 cm. Therefore, this LED could be used to observe fluorescent emission-guided lesions. This study maximized the advantages of LEDs with optimal conditions for fluorescence emission by increasing the beam width, irradiation area, and energy efficiency, using a small number of LEDs at the maximum WD. The proposed method, optimized for fluorescence expression-induced surgery, can be made available at clinical sites by mass producing them through semiconductor processes. Full article
(This article belongs to the Section Medical Imaging and Theranostics)
Show Figures

Figure 1

Figure 1
<p>Characteristics of LED beam irradiation: (<b>a</b>) the difference between symmetric and asymmetric LED irradiation; (<b>b</b>) LED beam power and width.</p>
Full article ">Figure 2
<p>Structure of a symmetrical ring-type array LED.</p>
Full article ">Figure 3
<p>Analysis of LED irradiation. (<b>a</b>) Longitudinal section of LED<sub>n</sub> and LED<sub>n+4</sub> (10° ≤ θ<sub>ext</sub> ≤ 30°), (<b>b</b>) bottom horizontal section of all LED irradiated (10° ≤ θ<sub>ext</sub> ≤ 30°).</p>
Full article ">Figure 4
<p>A schematic of the proposed light source: (<b>a</b>) structure, (<b>b</b>) beam shape during LED irradiation, (<b>c</b>) simulation results of P<sub>r</sub> (received power) and beam distribution.</p>
Full article ">Figure 5
<p>(<b>a</b>) Experiment environment, (<b>b</b>) image with light source on, (<b>c</b>) real irradiation pattern, and (<b>d</b>) image taken with phantom/syringe NIR camera.</p>
Full article ">Figure 6
<p>Comparison of the fluorescence emission of the proposed LED and a conventional LED.</p>
Full article ">
23 pages, 10288 KiB  
Article
Hyper-Dense_Lung_Seg: Multimodal-Fusion-Based Modified U-Net for Lung Tumour Segmentation Using Multimodality of CT-PET Scans
by Goram Mufarah Alshmrani, Qiang Ni, Richard Jiang and Nada Muhammed
Diagnostics 2023, 13(22), 3481; https://doi.org/10.3390/diagnostics13223481 - 20 Nov 2023
Cited by 2 | Viewed by 1520
Abstract
The majority of cancer-related deaths globally are due to lung cancer, which also has the second-highest mortality rate. The segmentation of lung tumours, treatment evaluation, and tumour stage classification have become significantly more accessible with the advent of PET/CT scans. With the advent [...] Read more.
The majority of cancer-related deaths globally are due to lung cancer, which also has the second-highest mortality rate. The segmentation of lung tumours, treatment evaluation, and tumour stage classification have become significantly more accessible with the advent of PET/CT scans. With the advent of PET/CT scans, it is possible to obtain both functioning and anatomic data during a single examination. However, integrating images from different modalities can indeed be time-consuming for medical professionals and remains a challenging task. This challenge arises from several factors, including differences in image acquisition techniques, image resolutions, and the inherent variations in the spectral and temporal data captured by different imaging modalities. Artificial Intelligence (AI) methodologies have shown potential in the automation of image integration and segmentation. To address these challenges, multimodal fusion approach-based U-Net architecture (early fusion, late fusion, dense fusion, hyper-dense fusion, and hyper-dense VGG16 U-Net) are proposed for lung tumour segmentation. Dice scores of 73% show that hyper-dense VGG16 U-Net is superior to the other four proposed models. The proposed method can potentially aid medical professionals in detecting lung cancer at an early stage. Full article
Show Figures

Figure 1

Figure 1
<p>Block diagram for the lung cancer segmentation framework.</p>
Full article ">Figure 2
<p>Some examples of the augmentation process of CT and PET images for STS: (<b>a</b>) the main CT-PET, (<b>b</b>) rotating the CT-PET by 90 degrees clockwise, (<b>c</b>) flipping the CT-PET upside down, and (<b>d</b>) left-mirroring the CT-PET. Red arrows indicate the tumour region.</p>
Full article ">Figure 3
<p>An example of the post-processing effect: (<b>a</b>) predicted mask and (<b>b</b>) image after mask post-processing.</p>
Full article ">Figure 4
<p>Early fusion architecture.</p>
Full article ">Figure 5
<p>Late fusion architecture.</p>
Full article ">Figure 6
<p>Dence fusion architecture.</p>
Full article ">Figure 7
<p>Hyper-dense fusion architecture.</p>
Full article ">Figure 8
<p>The proposed hyper-dense VGG16 U-Net model architecture.</p>
Full article ">Figure 9
<p>Binary cross-entropy function.</p>
Full article ">Figure 10
<p>Dice loss function.</p>
Full article ">Figure 11
<p>Focal loss function.</p>
Full article ">Figure 12
<p>Dice metric.</p>
Full article ">Figure 13
<p>IOU metric.</p>
Full article ">Figure 14
<p>Accuracy metric.</p>
Full article ">Figure 15
<p>Specificity metric.</p>
Full article ">Figure 16
<p>Sensitivity metric.</p>
Full article ">Figure 17
<p>The comparison of lung tumour segmentation results, along with the segmentation outcomes for corresponding enlarged tumour regions, using our proposed hyper-dense VGG16 model with various loss functions (“Binary”, “Dice”, and “Focal”). The green contours outline the “Ground Truth” segmentation, and the blue contours outline results from the proposed model.</p>
Full article ">Figure 18
<p>Dice [<a href="#B13-diagnostics-13-03481" class="html-bibr">13</a>,<a href="#B20-diagnostics-13-03481" class="html-bibr">20</a>].</p>
Full article ">Figure 19
<p>Accuracy [<a href="#B13-diagnostics-13-03481" class="html-bibr">13</a>,<a href="#B20-diagnostics-13-03481" class="html-bibr">20</a>].</p>
Full article ">Figure 20
<p>Specificity [<a href="#B13-diagnostics-13-03481" class="html-bibr">13</a>,<a href="#B20-diagnostics-13-03481" class="html-bibr">20</a>].</p>
Full article ">Figure 21
<p>IOU [<a href="#B13-diagnostics-13-03481" class="html-bibr">13</a>,<a href="#B20-diagnostics-13-03481" class="html-bibr">20</a>].</p>
Full article ">Figure 22
<p>Sensitivity [<a href="#B13-diagnostics-13-03481" class="html-bibr">13</a>,<a href="#B20-diagnostics-13-03481" class="html-bibr">20</a>].</p>
Full article ">Figure 23
<p>Dice [<a href="#B13-diagnostics-13-03481" class="html-bibr">13</a>,<a href="#B16-diagnostics-13-03481" class="html-bibr">16</a>].</p>
Full article ">Figure 24
<p>Accuracy [<a href="#B13-diagnostics-13-03481" class="html-bibr">13</a>,<a href="#B16-diagnostics-13-03481" class="html-bibr">16</a>].</p>
Full article ">Figure 25
<p>Specificity [<a href="#B13-diagnostics-13-03481" class="html-bibr">13</a>,<a href="#B16-diagnostics-13-03481" class="html-bibr">16</a>].</p>
Full article ">Figure 26
<p>IOU [<a href="#B13-diagnostics-13-03481" class="html-bibr">13</a>,<a href="#B16-diagnostics-13-03481" class="html-bibr">16</a>].</p>
Full article ">Figure 27
<p>Sensitivity [<a href="#B13-diagnostics-13-03481" class="html-bibr">13</a>,<a href="#B16-diagnostics-13-03481" class="html-bibr">16</a>].</p>
Full article ">
5 pages, 193 KiB  
Editorial
Editorial on the Special Issue Titled “Pathology and Diagnosis of Gynecologic Diseases”
by Cinzia Giacometti and Kathrin Ludwig
Diagnostics 2023, 13(22), 3480; https://doi.org/10.3390/diagnostics13223480 - 20 Nov 2023
Viewed by 776
Abstract
In the medical and diagnostic daily routine, gynecologic diseases present many different scenarios [...] Full article
(This article belongs to the Special Issue Pathology and Diagnosis of Gynecologic Diseases)
10 pages, 1107 KiB  
Brief Report
An Open-Source Graphical User Interface-Embedded Automated Electrocardiogram Quality Assessment: A Balanced Class Representation Approach
by Mohamed Elgendi, Kirina van der Bijl and Carlo Menon
Diagnostics 2023, 13(22), 3479; https://doi.org/10.3390/diagnostics13223479 - 20 Nov 2023
Viewed by 1332
Abstract
The rise in cardiovascular diseases necessitates accurate electrocardiogram (ECG) diagnostics, making high-quality ECG recordings essential. Our CNN-LSTM model, embedded in an open-access GUI and trained on balanced datasets collected in clinical settings, excels in automating ECG quality assessment. When tested across three datasets [...] Read more.
The rise in cardiovascular diseases necessitates accurate electrocardiogram (ECG) diagnostics, making high-quality ECG recordings essential. Our CNN-LSTM model, embedded in an open-access GUI and trained on balanced datasets collected in clinical settings, excels in automating ECG quality assessment. When tested across three datasets featuring varying ratios of acceptable to unacceptable ECG signals, it achieved an F1 score ranging from 95.87% to 98.40%. Training the model on real noise sources significantly enhances its applicability in real-life scenarios, compared to simulations. Integrated into a user-friendly toolbox, the model offers practical utility in clinical environments. Furthermore, our study underscores the importance of balanced class representation during training and testing phases. We observed a notable F1 score change from 98.09% to 95.87% when the class ratio shifted from 85:15 to 50:50 in the same testing dataset with equal representation. This finding is crucial for future ECG quality assessment research, highlighting the impact of class distribution on the reliability of model training outcomes. Full article
(This article belongs to the Section Machine Learning and Artificial Intelligence in Diagnostics)
Show Figures

Figure 1

Figure 1
<p>Schematic overview of the proposed CNN-LSTM network. The <span class="html-italic">Feature extraction</span> box outlines the CNN part of the model. The <span class="html-italic">Classification</span> box outlines the LSTM part of the model. The values under the input layer represent the input shape. The values under the Conv1D layers represent the filter and kernel size. The value under the dropout layers represents the dropout rate. The value under the LSTM and Dense layers represents the dimensionality of the output. The Sigmoid under the last Dense layer represents the activation function of the output.</p>
Full article ">Figure 2
<p>Examples of true positives and true negatives yielded by the proposed CNN-LSTM model, utilizing the BUT QDB dataset.</p>
Full article ">Figure 3
<p>Showcase of the new toolbox with an instance of an ECG signal with acceptable quality. The GUI marks it as bad quality due to automatic labeling based on the proposed CNN-LSTM algorithm. Other ECG signal quality indices in agreement. The displayed ECG corresponds to ‘Lead 1’, extracted from the CinC11 dataset, which includes 12-lead ECG data. By utilizing the scroll bar situated in the top left corner of the graphical user interface, we can load and examine each ECG lead within the dataset. Remarkably, all 12 ECG leads exhibit acceptable quality.</p>
Full article ">Figure 4
<p>Showcase of the new toolbox with an instance of an ECG signal with unacceptable quality. The GUI marks it as bad quality due to automatic labeling based on the proposed CNN-LSTM algorithm. Other ECG signal quality indices in disagreement. The displayed ECG corresponds to ‘Lead 8,’ extracted from the CinC11 dataset, which includes 12-lead ECG data. By utilizing the scroll bar situated in the top left corner of the graphical user interface, we can load and examine each ECG lead within the dataset. Remarkably, all 12 ECG leads, excluding ‘Lead 8,’ exhibit acceptable quality.</p>
Full article ">
9 pages, 1234 KiB  
Case Report
Refractory Bilateral Tubo-Ovarian Abscesses in a Patient with Iatrogenic Hypogammaglobulinemia
by Elizabeth J. Klein, Nouf K. Almaghlouth, Gabriela Weigel, Dimitrios Farmakiotis and Erica Hardy
Diagnostics 2023, 13(22), 3478; https://doi.org/10.3390/diagnostics13223478 - 19 Nov 2023
Viewed by 1601
Abstract
Genital mycoplasmas are sexually transmitted Mollicutes with a high prevalence of urogenital tract colonization among females of reproductive age. Current guidelines recommend against routine screening for these organisms, since their role in the pathogenesis of pelvic inflammatory disease and tubo-ovarian abscesses (TOAs) remains [...] Read more.
Genital mycoplasmas are sexually transmitted Mollicutes with a high prevalence of urogenital tract colonization among females of reproductive age. Current guidelines recommend against routine screening for these organisms, since their role in the pathogenesis of pelvic inflammatory disease and tubo-ovarian abscesses (TOAs) remains unclear. However, genital mycoplasmas harbor pathogenic potential in immunocompromised hosts, especially patients with hypogammaglobulinemia. It is important to identify such infections early, given their potential for invasive spread and the availability of easily accessible treatments. We present a young adult female with multiple sclerosis and iatrogenic hypogammaglobulinemia, with refractory, bilateral pelvic inflammatory disease and TOAs due to Ureaplasma urealyticum, identified as a single pathogen via three distinct molecular tests. To our knowledge, this is the second case of TOAs caused by U. urealyticum in the literature, and the first diagnosed by pathogen cell-free DNA metagenomic next-generation sequencing in plasma. Full article
(This article belongs to the Special Issue Advances in the Diagnosis of Infectious Diseases and Microorganisms)
Show Figures

Figure 1

Figure 1
<p>Clinical course. Antibiotic treatment was dictated by clinician judgement. Standard pelvic inflammatory disease regimens were started to target the most common causes, before coverage was broadened to include resistant enteric organisms. TMP-SMX, trimethoprim/sulfamethoxazole; AZM, azithromycin; CPFX, ciprofloxacin; FCZ, fluconazole; CTX, ceftriaxone; DOX, doxycycline; MTZ, metronidazole; PIP/TAZO, piperacillin/tazobactam; AMC, amoxicillin/clavulanate; ETP, ertapenem; VAN, vancomycin.</p>
Full article ">Figure 2
<p>CT images of the TOAs before and after treatment with doxycycline and drainage (scale: 32 cm, measured dimension 28.7 mm at this level). Cystic structures are denoted with black arrows; inflammatory stranding is denoted with white arrows. (<b>a</b>) Representative image from the patient’s CT scan upon admission in March. There are multi-cystic structures with rim enhancement and inflammatory stranding in the bilateral ovaries consistent with bilateral residual or recurrent TOAs. (<b>b</b>) Representative image from the patient’s CT scan after treatment in June. There is a 2.0 cm benign cyst in the right ovary as well as moderate inflammatory stranding in the pelvis, consistent with recent pelvic inflammatory disease.</p>
Full article ">Figure 3
<p>cfDNA mNGS (Karius) boxplot. The star indicates the molecules per milliliter (MPM) of <span class="html-italic">Ureaplasma urealyticum</span> identified in our patient’s specimen; the dots indicate the MPM of <span class="html-italic">Ureaplasma urealyticum</span> identified in the last 1000 specimens analyzed via Karius.</p>
Full article ">
15 pages, 1275 KiB  
Article
Inflammation and Venous Thromboembolism in Hospitalized Patients with COVID-19
by Angelos Liontos, Dimitrios Biros, Rafail Matzaras, Konstantina-Helen Tsarapatsani, Nikolaos-Gavriel Kolios, Athina Zarachi, Konstantinos Tatsis, Christiana Pappa, Maria Nasiou, Eleni Pargana, Ilias Tsiakas, Diamantina Lymperatou, Sempastien Filippas-Ntekouan, Lazaros Athanasiou, Valentini Samanidou, Revekka Konstantopoulou, Ioannis Vagias, Aikaterini Panteli, Haralampos Milionis and Eirini Christaki
Diagnostics 2023, 13(22), 3477; https://doi.org/10.3390/diagnostics13223477 - 19 Nov 2023
Cited by 1 | Viewed by 1328
Abstract
Background: A link between inflammation and venous thromboembolism (VTE) in COVID-19 disease has been suggested pathophysiologically and clinically. The aim of this study was to investigate the association between inflammation and disease outcomes in adult hospitalized COVID-19 patients with VTE. Methods: This was [...] Read more.
Background: A link between inflammation and venous thromboembolism (VTE) in COVID-19 disease has been suggested pathophysiologically and clinically. The aim of this study was to investigate the association between inflammation and disease outcomes in adult hospitalized COVID-19 patients with VTE. Methods: This was a retrospective observational study, including quantitative and qualitative data collected from COVID-19 patients hospitalized at the Infectious Diseases Unit (IDU) of the University Hospital of Ioannina, from 1 March 2020 to 31 May 2022. Venous thromboembolism was defined as a diagnosis of pulmonary embolism (PE) and/or vascular tree-in-bud in the lungs. The burden of disease, assessed by computed tomography of the lungs (CTBoD), was quantified as the percentage (%) of the affected lung parenchyma. The study outcomes were defined as death, intubation, and length of hospital stay (LoS). A chi-squared test and univariate logistic regression analyses were performed in IBM SPSS 28.0. Results: After propensity score matching, the final study cohort included 532 patients. VTE was found in 11.2% of the total population. In patients with VTE, we found that lymphocytopenia and a high neutrophil/lymphocyte ratio were associated with an increased risk of intubation and death, respectively. Similarly, CTBoD > 50% was associated with a higher risk of intubation and death in this group of patients. The triglyceride–glucose (TyG) index was also linked to worse outcomes. Conclusions: Inflammatory indices were associated with VTE. Lymphocytopenia and an increased neutrophil-to-lymphocyte ratio negatively impacted the disease’s prognosis and outcomes. Whether these indices unfavorably affect outcomes in COVID-19-associated VTE must be further evaluated. Full article
(This article belongs to the Special Issue Diagnosis of Viral Respiratory Infections)
Show Figures

Figure 1

Figure 1
<p>Flow diagram of the study.</p>
Full article ">Figure 2
<p>ROC curve of the ML models developed for the outcomes of death (<b>left</b>) and intubation (<b>right</b>).</p>
Full article ">
13 pages, 23546 KiB  
Article
The Contribution of Mediastinal Transbronchial Nodal Cryobiopsy to Morpho-Histological and Molecular Diagnosis
by Francisco Javier Velasco-Albendea, Juan José Cruz-Rueda, María Jesús Gil-Belmonte, Álvaro Pérez-Rodríguez, Andrés López-Pardo, Beatriz Agredano-Ávila, David Lozano-Paniagua and Bruno José Nievas-Soriano
Diagnostics 2023, 13(22), 3476; https://doi.org/10.3390/diagnostics13223476 - 19 Nov 2023
Cited by 2 | Viewed by 2118
Abstract
(1) Background: endobronchial ultrasound-guided mediastinal transbronchial cryo-node biopsy, previously assisted by fine-needle aspiration, is a novel technique of particular interest in the field of lung cancer diagnosis and is of great utility for extrathoracic tumor metastases, lymphomas, and granulomatous diseases. An integrated histological [...] Read more.
(1) Background: endobronchial ultrasound-guided mediastinal transbronchial cryo-node biopsy, previously assisted by fine-needle aspiration, is a novel technique of particular interest in the field of lung cancer diagnosis and is of great utility for extrathoracic tumor metastases, lymphomas, and granulomatous diseases. An integrated histological and molecular diagnosis of small samples implies additional difficulty for the pathologist. Additionally, emerging tumor biomarkers create the need to search for new approaches to better manage the tissue sample; (2) Methods: An analytical observational study of 32 mediastinal node cryobiopsies is carried out in 27 patients (n = 27). Statistical analysis using the t-student and Wilcoxon signed-rank tests for paired data is performed with SPSS 26 and R Statistical software. The significance level is established at p < 0.05; (3) Results: cryobiopsies were valid for diagnosis in 25 of 27 patients, with a maximum average size of 3.5 ± 0.7 mm. A total of 18 samples (66.67%) were positive for malignancy and 9 (33.33%) were benign. The tumor percentage measured in all neoplastic samples was greater than 30%. The average DNA and RNA extracted in nine non-small cell lung cancer cases was 97.2 ± 22.4 ng/µL and 26.6 ± 4.9 ng/µL, respectively; (4) Conclusions: the sample size obtained from an endobronchial ultrasound-guided mediastinal transbronchial cryo-node biopsy facilitates the morphological and histo-architectural assessment of inflammatory and neoplastic pathology. It optimizes molecular tests in the latter due to more tumor cells, DNA, and RNA. Full article
(This article belongs to the Section Pathology and Molecular Diagnostics)
Show Figures

Figure 1

Figure 1
<p>Images of the cryoprobe tip inside the lymph node (red arrows) in an endobronchial ultrasound-guided transbronchial mediastinal lymph node cryobiopsy procedure (EBUS-TBCNB). See the detail in the image of the circle of the cryoprobe entry through the preceding linear EBUS working channel (arrowhead) (<b>a</b>,<b>b</b>). The bleed point (black arrow) marks the puncture site of the linear EBUS and cryoprobe approach (<b>c</b>). Introduction of the cryoprobe with the sample attached to its tip into the buffer solution (<b>d</b>). Samples were collected using cryobiopsy (<b>e</b>).</p>
Full article ">Figure 2
<p>Chordonal material and small irregular fragments were obtained as cellblocks in linear EBUS (<b>a</b>,<b>b</b>). Macroscopic images of cryobiopsies composed of fragments ranging from 3 mm to 4 mm (<b>c</b>–<b>f</b>).</p>
Full article ">Figure 3
<p>Slight magnification histological details of mediastinal lymph node cryobiopsy specimens almost entirely replaced by lung adenocarcinoma metastases (H&amp;E ×2) (<b>a</b>). Representative lymph node fragments were obtained using cryobiopsy with the granulomatous histoarchitectural disorder (H&amp;E ×2) (<b>b</b>). Microscopic view of lymph node cryobiopsies with tumor characteristics (H&amp;E ×1) (<b>c</b>). Histology of linear EBUS cell blocks with neoplastic non-small cell lung carcinoma (NSCLC). Cells with no defined architectural pattern in a haematic background (asterisks and black arrow) (H&amp;E ×5) (<b>d</b>,<b>e</b>). H&amp;E: Hematoxylin–Eosin stain.</p>
Full article ">Figure 4
<p>Histoarchitectural patterns in neoplastic cryobiopsy specimens. Acinar adenocarcinoma of the lung with well-defined glands replacing part of the lymphoid nodal tissue (H&amp;E ×5) (<b>a</b>). Small cell lymphocytic lymphoma with diffuse pattern (H&amp;E ×4) (<b>b</b>). Nodal metastasis from melanoma is composed of discohesive epithelioid cells with marked anaplasia and diffuse growth (H&amp;E ×10) (<b>c</b>). Metastasis from adenocarcinoma of the lung with a papillary architectural pattern (H&amp;E ×5) (<b>d</b>). Metastasis from acinar adenocarcinoma with irregular and fused glands with associated fibrodesmoplastic stroma (H&amp;E ×7.5) (<b>e</b>). Pulmonary squamous cell carcinoma forms well-defined polygonal cell nests with dyskeratosis (H&amp;E ×8) (<b>f</b>). Poorly differentiated sarcomatous neoplasm with diffuse pattern (H&amp;E ×7.5) (<b>g</b>). H&amp;E: Hematoxylin–Eosin stain.</p>
Full article ">Figure 5
<p>Histoarchitectural patterns in non-tumor cryobiopsy samples. Microscopic view of the nodular granulomatous lesion (black diamonds) in a patient with silicosis (H&amp;E ×4) (<b>a</b>). Details of silicoid granulomatous nodule with lamellar fibrosis (H&amp;E ×5) (<b>b</b>). The well-defined architecture of granulomatous sarcoid pattern in lymph node (black arrows) (H&amp;E ×5) (<b>c</b>). Non-necrotizing granulomatous inflammation in pneumoconiosis with multinucleated giant cells (asterisks) is easily identified after cryobiopsy (H&amp;E ×10) (<b>d</b>,<b>e</b>). H&amp;E: Hematoxylin–Eosin stain.</p>
Full article ">Figure 6
<p>Graphical representation of sample size (mm). T block (cellblock size in EBUS-TBNA). T max (maximum cryobiopsy size). T min (minimum cryobiopsy size). Statistically significant differences (asterisks) versus cell block size in EBUS-TBNA (<span class="html-italic">p</span> &lt; 0.05) (<b>a</b>). Graphical representation of the amount of DNA and RNA (ng/µL) extracted in EBUS-TBNA cellblocks and cryobiopsies. Statistically significant differences (asterisks) versus the amount of DNA/RNA in EBUS-TBNA cellblocks (<span class="html-italic">p</span> &lt; 0.05) (<b>b</b>,<b>c</b>).</p>
Full article ">
11 pages, 3571 KiB  
Article
Perilipin1 Expression as a Prognostic Factor in Patients with Squamous Cell Carcinoma of the Lung
by Min Hye Kim, Jeong Hee Lee, Jong Sil Lee, Dong Chul Kim, Jung Wook Yang, Hyo Jung An, Ji Min Na, Wook Jae Jung and Dae Hyun Song
Diagnostics 2023, 13(22), 3475; https://doi.org/10.3390/diagnostics13223475 - 19 Nov 2023
Cited by 1 | Viewed by 1203
Abstract
Perilipin (PLIN) is a major structural protein located on the surface of lipid droplets. PLIN plays an important role in human metabolism and is associated with metabolic diseases, such as obesity, diabetes, hypertension, and endocrine disorders. The dysregulation of lipid metabolism is one [...] Read more.
Perilipin (PLIN) is a major structural protein located on the surface of lipid droplets. PLIN plays an important role in human metabolism and is associated with metabolic diseases, such as obesity, diabetes, hypertension, and endocrine disorders. The dysregulation of lipid metabolism is one of the most prominent metabolic changes observed in cancers. Therefore, the PLIN protein family has recently attracted attention owing to its role in lipid metabolism and cancer. To date, no studies have addressed the association between the prognosis of lung cancer and PLIN1 expression. For the first time, we found that high PLIN1 expression was significantly correlated with worse disease-free survival (DFS) in lung squamous cell carcinoma (SCC). We examined PLIN1 expression by the immunohistochemical analysis of surgical lung SCC specimens obtained from 94 patients. We analyzed the correlation between PLIN1 expression, clinicopathological data, and patient survival, using a chi-squared test, Kaplan–Meier analysis with log-rank tests, and the multivariate Cox proportional hazards regression test. High PLIN1 expression was significantly correlated with lower DFS in the Kaplan–Meier analysis and the multivariate Cox proportional hazards regression model. High PLIN1 expression was significantly correlated with worse prognosis in lung SCC. Full article
(This article belongs to the Special Issue Diagnosis and Management of Lung Cancer)
Show Figures

Figure 1

Figure 1
<p>Perilipin1 expression of pulmonary squamous cell carcinoma. (<b>A</b>) High expression group, expression of perilipin1 is higher in tumor cells compared to inflammatory cells (black arrow). (<b>B</b>) Low expression group, expression of perilipin1 is lower in tumor cells compared to inflammatory cells (white arrow).</p>
Full article ">Figure 2
<p>Kaplan–Meier survival analysis based on perilipin 1 expression in patients with pulmonary squamous cell carcinoma. The group with high Perilipin1 expression had significantly lower disease-free survival (<span class="html-italic">p</span> &lt; 0.008) and disease-specific survival (<span class="html-italic">p</span> &lt; 0.011).</p>
Full article ">
14 pages, 887 KiB  
Systematic Review
Ultrasound-Guided vs. Fluoroscopy-Guided Interventions for Back Pain Management: A Systematic Review and Meta-Analysis of Randomized Controlled Trials
by Dmitriy Viderman, Mina Aubakirova, Anuar Aryngazin, Dinara Yessimova, Dastan Kaldybayev, Ramil Tankacheyev and Yerkin G. Abdildin
Diagnostics 2023, 13(22), 3474; https://doi.org/10.3390/diagnostics13223474 - 18 Nov 2023
Cited by 2 | Viewed by 1630
Abstract
The objective of this study was to compare the outcomes of the ultrasound- and fluoroscopy-guided techniques in the management of back pain. Using PubMed, Scopus, and the Cochrane Library, we searched randomized controlled trials (RCTs) published before May 2023, which reported relevant data [...] Read more.
The objective of this study was to compare the outcomes of the ultrasound- and fluoroscopy-guided techniques in the management of back pain. Using PubMed, Scopus, and the Cochrane Library, we searched randomized controlled trials (RCTs) published before May 2023, which reported relevant data on the topic. The effectiveness of the ultrasound-guided (US-guided) and fluoroscopy-guided (FL-guided) approaches for back pain management was compared in terms of postoperative pain intensity, postoperative functional outcomes, and postoperative complications. Subgroup analyses were conducted for different postoperative periods. Eight studies were included in the analysis. There was no significant difference in post-procedural pain relief at one week, two weeks, one month, two months, and three months between the US-guided and FL-guided interventions for back pain management (SMD with 95% CI is −0.01 [−0.11, 0.10]), p = 0.91, I2 = 0%). In terms of the postoperative functional outcomes assessed by the “Oswestry Disability Index” (ODI) functionality score, the model tends to favor the FL-guided injections over the US-guided injections (SMD with 95% CI: 0.13 [−0.00, 0.25], p = 0.05, I2 = 0). Finally, the US-guided and FL-guided injections did not show significantly different results in terms of postoperative complications (RR with 95% CI is 0.99 [0.49, 1.99], p = 0.97, I2 = 0). The subgroup analysis also did not demonstrate differences between the US-guided and FL-guided techniques in the following outcomes: vasovagal reaction, transient headache, and facial flushing. There was no significant difference between the US-guided and FL-guided injections for treating back pain in terms of postoperative pain intensity and complications. Still, the model tends to favor the FL-guided injections over the US-guided injections in terms of functionality. Full article
(This article belongs to the Special Issue Ultrasound Imaging in Medicine 2023)
Show Figures

Figure 1

Figure 1
<p>PRISMA diagram.</p>
Full article ">Figure 2
<p>Pain intensity (VAS, VNS, NRS scale) [<a href="#B2-diagnostics-13-03474" class="html-bibr">2</a>,<a href="#B3-diagnostics-13-03474" class="html-bibr">3</a>,<a href="#B6-diagnostics-13-03474" class="html-bibr">6</a>,<a href="#B7-diagnostics-13-03474" class="html-bibr">7</a>,<a href="#B16-diagnostics-13-03474" class="html-bibr">16</a>,<a href="#B17-diagnostics-13-03474" class="html-bibr">17</a>,<a href="#B18-diagnostics-13-03474" class="html-bibr">18</a>,<a href="#B19-diagnostics-13-03474" class="html-bibr">19</a>].</p>
Full article ">Figure 3
<p>Postoperative functional outcomes (ODI index) [<a href="#B3-diagnostics-13-03474" class="html-bibr">3</a>,<a href="#B6-diagnostics-13-03474" class="html-bibr">6</a>,<a href="#B16-diagnostics-13-03474" class="html-bibr">16</a>,<a href="#B17-diagnostics-13-03474" class="html-bibr">17</a>,<a href="#B18-diagnostics-13-03474" class="html-bibr">18</a>,<a href="#B19-diagnostics-13-03474" class="html-bibr">19</a>].</p>
Full article ">Figure 4
<p>Postoperative complications [<a href="#B3-diagnostics-13-03474" class="html-bibr">3</a>,<a href="#B6-diagnostics-13-03474" class="html-bibr">6</a>,<a href="#B16-diagnostics-13-03474" class="html-bibr">16</a>,<a href="#B17-diagnostics-13-03474" class="html-bibr">17</a>,<a href="#B18-diagnostics-13-03474" class="html-bibr">18</a>].</p>
Full article ">
12 pages, 546 KiB  
Systematic Review
Postural Control Measurements to Predict Future Motor Impairment in Preterm Infants: A Systematic Review
by Jennifer Bosserman, Sonia Kelkar, Kristen D. LeBlond, Jessica Cassidy and Dana B. McCarty
Diagnostics 2023, 13(22), 3473; https://doi.org/10.3390/diagnostics13223473 - 18 Nov 2023
Cited by 1 | Viewed by 1930
Abstract
Preterm infants are more likely to demonstrate developmental delays than fullterm infants. Postural measurement tools may be effective in measuring the center of pressure (COP) and asymmetry, as well as predicting future motor impairment. The objective of this systematic review was to evaluate [...] Read more.
Preterm infants are more likely to demonstrate developmental delays than fullterm infants. Postural measurement tools may be effective in measuring the center of pressure (COP) and asymmetry, as well as predicting future motor impairment. The objective of this systematic review was to evaluate existing evidence regarding use of pressure mats or force plates for measuring COP and asymmetry in preterm infants, to determine how measures differ between preterm and fullterm infants and if these tools appropriately predict future motor impairment. The consulted databases included PubMed, Embase, Scopus, and CINAHL. The quality of the literature and the risk of bias were assessed utilizing the ROB2: revised Cochrane risk-of bias tool. Nine manuscripts met the criteria for review. The postural control tools included were FSA UltraThin seat mat, Conformat Pressure-Sensitive mat, Play and Neuro-Developmental Assessment, and standard force plates. Studies demonstrated that all tools were capable of COP assessment in preterm infants and support the association between the observation of reduced postural complexity prior to the observation of midline head control as an indicator of future motor delay. Postural measurement tools provide quick and objective measures of postural control and asymmetry. Based on the degree of impairment, these tools may provide an alternative to standardized assessments that may be taxing to the preterm infant, inaccessible to therapists, or not sensitive enough to capture motor delays. Full article
(This article belongs to the Special Issue The Use of Motion Analysis for Diagnostics)
Show Figures

Figure 1

Figure 1
<p>Study selection process.</p>
Full article ">
11 pages, 1590 KiB  
Article
A Novel Tool for Distinguishing Type A Acute Aortic Syndrome from Heart Failure and Acute Coronary Syndrome
by Min Joon Seo, Jae Hoon Lee and Yang-Weon Kim
Diagnostics 2023, 13(22), 3472; https://doi.org/10.3390/diagnostics13223472 - 18 Nov 2023
Cited by 1 | Viewed by 1103
Abstract
Type A acute aortic syndrome (urgent AAS, UAAS) has a low incidence and high mortality rate; however, it is often missed or diagnosed late. Our aim was to create a new tool for distinguishing UAAS by using multiple modalities to select patients for [...] Read more.
Type A acute aortic syndrome (urgent AAS, UAAS) has a low incidence and high mortality rate; however, it is often missed or diagnosed late. Our aim was to create a new tool for distinguishing UAAS by using multiple modalities to select patients for CT aortography. This study included 75 patients with UAAS, 77 with acute coronary syndrome (ACS), and 81 with heart failure (HF) who received urgent treatment after propensity matching. Specific symptoms, past medical history, mediastinal width, region of interest (ROI) ratio in the lung base/apex, D-dimers, and troponin I were investigated to differentiate UAAS from ACS and HF. The most significant variables were selected to create a new scoring system. The UAAS score exhibited a performance AUC of 0.982. A simple UAAS score >1, excluding ROI ratios in lung base/apex, showed an AUC of 0.977, a sensitivity of 96%, and specificity of 92.41%. The results were validated using an external data set of 292 patients (simple UAAS score > 1: AUC of 0.966, sensitivity 93.33%, and specificity 95.36%). The simple UAAS score may be a valuable tool for suspecting UAAS and may reduce the likelihood of misdiagnosis or performing unnecessary CT aortography. Full article
(This article belongs to the Special Issue Cardiovascular Diseases: Diagnosis and Management)
Show Figures

Figure 1

Figure 1
<p>Flow sheet.</p>
Full article ">Figure 2
<p>Diagnostic performance and risk assessment for distinguishing urgent acute aortic syndrome (UAAS) using various modalities. (<b>A</b>) D-dimer and troponin I. (<b>B</b>) Parameters in chest radiographs.</p>
Full article ">Figure 3
<p>Discrimination of urgent acute aortic syndrome (UAAS) from acute coronary syndrome (ACS) and from heart failure (HF). (<b>A</b>) Discrimination of UAAS from ACS. (<b>B</b>) Discrimination of UAAS from HF.</p>
Full article ">Figure 4
<p>Simple urgent acute aortic syndrome (UAAS) score and comparison of staple parameters.</p>
Full article ">Figure 5
<p>Diagnostic performance validation of simple urgent acute aortic syndrome (UAAS) score using external data set.</p>
Full article ">
15 pages, 3343 KiB  
Article
Evaluation of a Decision Support System Developed with Deep Learning Approach for Detecting Dental Caries with Cone-Beam Computed Tomography Imaging
by Hakan Amasya, Mustafa Alkhader, Gözde Serindere, Karolina Futyma-Gąbka, Ceren Aktuna Belgin, Maxim Gusarev, Matvey Ezhov, Ingrid Różyło-Kalinowska, Merve Önder, Alex Sanders, Andre Luiz Ferreira Costa, Sérgio Lúcio Pereira de Castro Lopes and Kaan Orhan
Diagnostics 2023, 13(22), 3471; https://doi.org/10.3390/diagnostics13223471 - 18 Nov 2023
Cited by 4 | Viewed by 1841
Abstract
This study aims to investigate the effect of using an artificial intelligence (AI) system (Diagnocat, Inc., San Francisco, CA, USA) for caries detection by comparing cone-beam computed tomography (CBCT) evaluation results with and without the software. 500 CBCT volumes are scored by three [...] Read more.
This study aims to investigate the effect of using an artificial intelligence (AI) system (Diagnocat, Inc., San Francisco, CA, USA) for caries detection by comparing cone-beam computed tomography (CBCT) evaluation results with and without the software. 500 CBCT volumes are scored by three dentomaxillofacial radiologists for the presence of caries separately on a five-point confidence scale without and with the aid of the AI system. After visual evaluation, the deep convolutional neural network (CNN) model generated a radiological report and observers scored again using AI interface. The ground truth was determined by a hybrid approach. Intra- and inter-observer agreements are evaluated with sensitivity, specificity, accuracy, and kappa statistics. A total of 6008 surfaces are determined as ‘presence of caries’ and 13,928 surfaces are determined as ‘absence of caries’ for ground truth. The area under the ROC curve of observer 1, 2, and 3 are found to be 0.855/0.920, 0.863/0.917, and 0.747/0.903, respectively (unaided/aided). Fleiss Kappa coefficients are changed from 0.325 to 0.468, and the best accuracy (0.939) is achieved with the aided results. The radiographic evaluations performed with aid of the AI system are found to be more compatible and accurate than unaided evaluations in the detection of dental caries with CBCT images. Full article
Show Figures

Figure 1

Figure 1
<p>Interface for unaided evaluations in the multiplanar reconstruction view (Sante DICOM Viewer Pro for macOS). In multiplanar (MPR) reconstruction mode, the purple frame indicates the active plane (axial in this case), while the blue frames represent other dimensions which follow the actions in the active plane. The green lines represent the intersection point in all three planes, which demonstrate an approximal dental caries in the distal surface of the tooth number 36. Thus, findings in the active frame are evaluated together with other axes.</p>
Full article ">Figure 2
<p>Interface for aided evaluation (Diagnocat). On the left side, at the top, the synthetic–panoramic image produced from the CBCT volume is provided for an overall view, while underneath, there is a dental chart that provides information about the condition of each tooth. The colors of white and purple represent a healthy and treated tooth, while the red means an unhealthy or missing tooth. On the right, the predictions of the system for the relevant tooth are provided by image slices in different axes.</p>
Full article ">Figure 3
<p>Diagnocat system model pipeline.</p>
Full article ">Figure 4
<p>Extended slice section of aided evaluations (Diagnocat) showing separate predicted caries lesion masks (red) in axial, mesiodistal, and buccolingual views of tooth 37.</p>
Full article ">Figure 5
<p>The ROC curves of aided and unaided evaluation of each observer.</p>
Full article ">
11 pages, 2554 KiB  
Article
Assessment of Cross-Reactivity of Chimeric Trypanosoma cruzi Antigens with Crithidia sp. LVH-60A: Implications for Accurate Diagnostics
by Emily F. Santos, Ramona T. Daltro, Carlos G. Regis-Silva, Tycha B. S. Pavan, Fabrícia A. de Oliveira, Ângela M. da Silva, Roque P. Almeida, Noilson L. S. Gonçalves, Daniel D. Sampaio, Faber N. Santos, Fabricio K. Marchini, Paola A. F. Celedon, Nilson I. T. Zanchin and Fred L. N. Santos
Diagnostics 2023, 13(22), 3470; https://doi.org/10.3390/diagnostics13223470 - 17 Nov 2023
Cited by 3 | Viewed by 1473
Abstract
This study focuses on developing accurate immunoassays for diagnosing Chagas disease (CD), a challenging task due to antigenic similarities between Trypanosoma cruzi and other parasites, leading to cross-reactivity. To address this challenge, chimeric recombinant T. cruzi antigens (IBMP-8.1, IBMP-8.2, IBMP-8.3, and IBMP-8.4) were [...] Read more.
This study focuses on developing accurate immunoassays for diagnosing Chagas disease (CD), a challenging task due to antigenic similarities between Trypanosoma cruzi and other parasites, leading to cross-reactivity. To address this challenge, chimeric recombinant T. cruzi antigens (IBMP-8.1, IBMP-8.2, IBMP-8.3, and IBMP-8.4) were synthesized to enhance specificity and reduce cross-reactivity in tests. While these antigens showed minimal cross-reactivity with leishmaniasis, their performance with other trypanosomatid infections was unclear. This study aimed to assess the diagnostic potential of these IBMP antigens for detecting CD in patients with Crithidia sp. LVH-60A, a parasite linked to visceral leishmaniasis-like symptoms in Brazil. This study involved seven Crithidia sp. LVH-60A patients and three Leishmania infantum patients. The results indicated that these IBMP antigens displayed 100% sensitivity, with specificity ranging from 87.5% to 100%, and accuracy values between 90% and 100%. No cross-reactivity was observed with Crithidia sp. LVH-60A, and only one L. infantum-positive sample showed limited cross-reactivity with IBMP-8.1. This study suggests that IBMP antigens offer promising diagnostic performance, with minimal cross-reactivity in regions where T. cruzi and other trypanosomatids are prevalent. However, further research with a larger number of Crithidia sp. LVH-60A-positive samples is needed to comprehensively evaluate antigen cross-reactivity. Full article
(This article belongs to the Special Issue Advances in the Diagnosis of Infectious Diseases and Microorganisms)
Show Figures

Figure 1

Figure 1
<p>Flowchart illustrating study design in conformity with the Standards for Reporting of Diagnostic Accuracy Studies (STARD) guidelines. Public domain digital map was freely obtained from the Brazilian Institute of Geography and Statistics (IBGE) cartographic database in shapefile format (.shp), which was subsequently reformatted and analyzed using QGIS version 3.22.16 (Geographic Information System, Open Source Geospatial Foundation Project. <a href="http://qgis.osgeo.org" target="_blank">http://qgis.osgeo.org</a> accessed on 27 September 2023).</p>
Full article ">Figure 2
<p>Reaction patterns of chimeric antigens in latent class analysis (LCA) used in anti-<span class="html-italic">T. cruzi</span> ELISA tests. LCS, latent class status; NR, nonreactive; PP, a posteriori probability; R, reactive; P1, P2, P3, P4, and P5, reaction response; N, number of samples.</p>
Full article ">Figure 3
<p>Reactivity index values from <span class="html-italic">Crithidia</span> sp. LVH-60A- and <span class="html-italic">Leishmania infantum</span>-positive serum samples assayed with four IBMP chimeric antigens. RI = 1.0, cutoff; RI = 1.0 ± 10% (shaded area), gray zone. Horizontal lines for each group of results: geometric means; GZ, gray zone; CR, cross-reactivity; RI, reactivity index.</p>
Full article ">
14 pages, 2490 KiB  
Article
HMGB1 Carried by Small Extracellular Vesicles Potentially Plays a Role in Promoting Acquired Middle Ear Cholesteatoma
by Michał W. Łuczak, Karolina Dżaman, Łukasz Zaręba, Katarzyna Czerwaty, Jacek Siewiera, Alicja Głuszko, Ewa Olszewska, Jacek Brzost, Ireneusz Kantor, Mirosław J. Szczepański and Nils Ludwig
Diagnostics 2023, 13(22), 3469; https://doi.org/10.3390/diagnostics13223469 - 17 Nov 2023
Viewed by 1108
Abstract
Cholesteatoma is a specific medical condition involving the abnormal, non-cancerous growth of skin-like tissue in the middle ear, potentially leading to a collection of debris and even infections. The receptor for advanced glycation (RAGE) and its ligand, high-mobility box 1 (HMGB1), are both [...] Read more.
Cholesteatoma is a specific medical condition involving the abnormal, non-cancerous growth of skin-like tissue in the middle ear, potentially leading to a collection of debris and even infections. The receptor for advanced glycation (RAGE) and its ligand, high-mobility box 1 (HMGB1), are both known to be overexpressed in cholesteatoma and play a potential role in the pathogenesis of the disease. In this study, we investigated the role of small extracellular vesicles (sEVs) in carrying HMGB1 and inducing disease-promoting effects in cholesteatoma. No significant differences in the concentration of isolated sEVs in the plasma of cholesteatoma patients (n = 17) and controls (n = 22) were found (p > 0.05); however, cholesteatoma-derived sEVs carried significantly higher levels of HMGB1 (p < 0.05). In comparison to sEVs isolated from the plasma of controls, cholesteatoma-derived sEVs significantly enhanced keratinocyte proliferation and IL-6 production (p < 0.05), potentially by engaging multiple activation pathways including MAPKp44/p42, STAT3, and the NF-κB pathway. Thus, HMGB1(+) sEVs emerge as a novel factor potentially promoting cholesteatoma progression. Full article
Show Figures

Figure 1

Figure 1
<p>Characterization of small extracellular vesicles (sEVs) from plasma of cholesteatoma patients. (<b>A</b>) Representative image of sEVs from Cryo-EM (arrows, bar indicates 200 nm); (<b>B</b>) Representative nanoparticle tracking analysis (NTA) plot of the concentration and size distribution of sEVsand particle visualization based on Brownian motion; (<b>C</b>) Particle concentration in the cholesteatoma patients and the control group. Results were obtained using NTA; (<b>D</b>) Particle diameter in the cholesteatoma patients and the control group. Results were obtained using NTA; (<b>E</b>) Representative immunoblotting of the sEV markers TSG101, CD9, and the negative marker Grp94 in sEVs; (no significant difference, n.s.).</p>
Full article ">Figure 2
<p>The levels of HMGB1 in plasma and in sEVs of cholesteatoma patients. (<b>A</b>) HMGB1 levels in plasma of cholesteatoma patients and controls (no significant difference, n.s.); (<b>B</b>) Representative western blots show HMGB1 enriched in plasma-derived sEVs from controls (C1–C7) compared to cholesteatoma patients (P1–P7); (<b>C</b>) Semiquantitative evaluation of Western blots using ImageJ 1.46r software; (<b>D</b>) HMGB1 levels in plasma-derived sEVs (1 μg) lysed with extraction buffer of cholesteatoma patients and controls, as described in <a href="#sec2-diagnostics-13-03469" class="html-sec">Section 2</a>, (* <span class="html-italic">p</span> &lt; 0.05, no significant difference, n.s.).</p>
Full article ">Figure 3
<p>RAGE and TLR4 expression in cultured keratinocytes. (<b>A</b>) RAGE expression at the mRNA and protein levels was determined in HaCaT and HEKA cells by RT-PCR and Western blotting; (<b>B</b>) Since HMGB1 is also a ligand for TLR4 in addition to activating RAGE, TLR4 was silenced in HaCaT and HEKA cells (as described in <a href="#sec2-diagnostics-13-03469" class="html-sec">Section 2</a>). TLR4 mRNA and protein levels in HaCaT and HEKA cells before and after stable silencing with the lentiviral vector or silencing with scrambled RNA (“missense”), (* <span class="html-italic">p</span> &lt; 0.05).</p>
Full article ">Figure 4
<p>The proliferation and cytokine production of HaCaT and HEKA cells in response to pooled samples of sEVs isolated from the plasma of cholesteatoma patients and controls. HaCaT cells (<b>A</b>) and HEKA cells (<b>B</b>) were incubated with 3 μg of sEVs at the concentration of 1 μg/μL from the plasma of cholesteatoma patients or from controls. Cell viability and proliferation was assessed after 72 h of culture using microscopy after trypan blue staining. (<b>C</b>) BrdU incorporation assay was used (as described in <a href="#sec2-diagnostics-13-03469" class="html-sec">Section 2</a>) in HaCaT and HEKA cells confirming significant differences in the induction of proliferation between normal sEVs and patient sEVs. Data represent mean ± SD from three independent experiments performed in triplicate. (<b>D</b>) Levels of IL-6 measured by ELISA assay in HaCaT and HEKA culture supernatants in the presence or absence of HMGB1, RAGE-specific antibodies, and sEVs isolated from the plasma of cholesteatoma patients and controls; IL-6 values were normalized to the 30 × 10<sup>3</sup> cell count of HaCaT and HEKA cells. All values in this figure represent means ± SD from three experiments with each sample run in triplicate. * <span class="html-italic">p</span> &lt; 0.05.</p>
Full article ">Figure 5
<p>Expression of signaling molecules in TLR4-silenced HaCaT and HEKA cells upon triggering with HMGB1(+)-sEVs as described in <a href="#sec2-diagnostics-13-03469" class="html-sec">Section 2</a>. Western blots of HaCaT or HEKA cells incubated with normal control (<b>A</b>,<b>C</b>) or cholesteatoma (<b>B</b>,<b>D</b>) sEVs show dramatic increase of phosphorylation of the MAPKp44/p42, STAT3, and NF-κB after stimulation with cholesteatoma-derived HMGB1(+)-sEVs.</p>
Full article ">Figure 6
<p>One of the hypothetical models for the progression of acquired cholesteatoma. In the tympanic cavity, there is a proliferation of keratinizing epithelial cells originating from the external auditory canal, which have penetrated the middle ear as a result of chronic perforation of the tympanic membrane (chronic otitis media). This causes local inflammation, uncontrolled development of microorganisms and activation of keratinizing epithelial cells, which, in turn, release enriched HMGB1(+) sEVs into the microenvironment and peripherally. HMGB1(+) sEVs cause, in a paracrine or autocrine mechanism, increased proliferation of keratinizing epithelial cells, as well as the production of the pro-inflammatory cytokine IL-6, which induces a whole cascade of inflammatory mechanisms in the microenvironment of acquired cholesteatoma (e.g., infiltration of pro-inflammatory cells, activation of endothelial cells and fibroblasts, etc.).</p>
Full article ">
11 pages, 1544 KiB  
Article
Unsolved Issues in Thymic Epithelial Tumour Stage Classification: The Role of Tumour Dimension
by Carolina Sassorossi, Pietro Bertoglio, Filippo Lococo, Gloria Santoro, Elisa Meacci, Dania Nachira, Maria Teresa Congedo, Jury Brandolini, Matteo Petroncini, Adriana Nocera, Diepriye Charles-Davies, Piergiorgio Solli, Stefano Margaritora and Marco Chiappetta
Diagnostics 2023, 13(22), 3468; https://doi.org/10.3390/diagnostics13223468 - 17 Nov 2023
Viewed by 1024
Abstract
According to the different classifications now in use, thymic tumours are staged by the extent of local invasiveness, and tumour size is not included as a major determinant for the T category. The aim of this double-site retrospective study is to analyse the [...] Read more.
According to the different classifications now in use, thymic tumours are staged by the extent of local invasiveness, and tumour size is not included as a major determinant for the T category. The aim of this double-site retrospective study is to analyse the correlation between tumour dimension and overall survival (OS) in patients who underwent surgical treatment. From January 2000 to December 2020, patients with thymic epithelial tumours who underwent surgical resection were included in this study. Data from a total of 332 patients were analysed. Five- and ten-year overall survival (5–10 YOS) was 89.26% and 87.08%, respectively, while five- and ten-year disease-free survival (DFS) was 88.12% and 84.2%, respectively. Univariate analysis showed a significant correlation between male sex (p-value 0.02), older age (p-value < 0.01), absence of myasthenia gravis (p-value < 0.01), increase in pTNM (pathological Tumor Node Metastasis) (p-value 0.03) and increase in the number of infiltrated organs (p-value 0.02) with an increase in tumour dimension. Tumour dimension alone was not effective in the prediction of DFS and OS, both when considered as a continuous variable and when considered with a cut-off of 3 and 5 cm. However, with multivariate analysis, it was effective in predicting OS in the aforementioned conditions (p-value < 0.01). Moreover, multivariate analysis was also used in the thymoma and Masaoka I subgroups. In our experience, the role of tumour dimension as a descriptor of the T parameter of the TNM (Tumor Node Metastasis) staging system seemed to be useful in improving this system. Full article
(This article belongs to the Section Pathology and Molecular Diagnostics)
Show Figures

Figure 1

Figure 1
<p>Disease-free survival (<b>A</b>) and overall survival (<b>B</b>) according to tumour dimension with 3 cm cut-off.</p>
Full article ">Figure 1 Cont.
<p>Disease-free survival (<b>A</b>) and overall survival (<b>B</b>) according to tumour dimension with 3 cm cut-off.</p>
Full article ">Figure 2
<p>Disease-free survival (<b>A</b>) and overall survival (<b>B</b>) according to tumour dimension with 5 cm cut-off.</p>
Full article ">
11 pages, 864 KiB  
Article
Multiplexed RT-qPCR Coupled with Whole-Genome Sequencing to Monitor a SARS-CoV-2 Omicron Variant of Concern in a Hospital Laboratory Setting in Latvia
by Baiba Niedre-Otomere, Inara Kampenusa, Julija Trofimova, Jevgenijs Bodrenko, Reinis Vangravs, Girts Skenders, Sergejs Nikisins and Oksana Savicka
Diagnostics 2023, 13(22), 3467; https://doi.org/10.3390/diagnostics13223467 - 17 Nov 2023
Viewed by 997
Abstract
At the end of 2021, the SARS-CoV-2 Omicron variant of concern (VOC) displaced the previously dominant Delta VOC and enhanced diagnostic and therapeutic challenges worldwide. Respiratory specimens submitted to the Riga East University Hospital Laboratory Service by the central and regional hospitals of [...] Read more.
At the end of 2021, the SARS-CoV-2 Omicron variant of concern (VOC) displaced the previously dominant Delta VOC and enhanced diagnostic and therapeutic challenges worldwide. Respiratory specimens submitted to the Riga East University Hospital Laboratory Service by the central and regional hospitals of Latvia from January to March 2022 that were positive for SARS-CoV-2 RNA were tested by commercial multiplexed RT-qPCR targeting three of the Omicron VOC signature mutations: ΔH69/V70, E484A, and N501Y. Of the specimens tested and analyzed in parallel by whole-genome sequencing (WGS), 964 passed the internal quality criteria (genome coverage ≥90%, read depth ≥400×) and the Nextstrain’s quality threshold for “good”. We validated the detection accuracy of RT-qPCR for each target individually by using WGS as a control. The results were concordant with both approaches for 938 specimens, with the correct classification rate exceeding 96% for each target (CI 95%); however, the presumptive WHO label was misassigned for 21 specimens. The RT-qPCR genotyping provided an acceptable means to pre-monitor the prevalence of the two presumptive Omicron VOC sublineages, BA.1 and BA.2. Full article
(This article belongs to the Collection Diagnostic Virology)
Show Figures

Figure 1

Figure 1
<p>Presence of multiplexed RT-qPCR-targeted mutations within 3900 SARS-CoV-2 RNA-positive respiratory specimens tested by multiplexed RT-qPCR plotted against the submission date.</p>
Full article ">Figure 2
<p>Presence of multiplexed RT-qPCR-targeted mutations in the genome sequences of 964 SARS-CoV-2 RNA-positive respiratory specimens plotted against the week of submission from January to March 2022.</p>
Full article ">
13 pages, 4630 KiB  
Article
Elucidating the Correlation between Bone Mineral Density and Multifidus Muscle Characteristics: A Cross-Modal Study with Dual-Energy X-ray Absorptiometry and Spinal Computed Tomography Texture Analysis
by Min-Woo Kim, Young-Min Noh, Yun-Sung Jung, Se-Yeong Jeon and Dong-Ha Lee
Diagnostics 2023, 13(22), 3466; https://doi.org/10.3390/diagnostics13223466 - 17 Nov 2023
Viewed by 1228
Abstract
Background: Recent research underscores the clinical relevance of muscle conditions such as sarcopenia and their links to bone mineral density (BMD), yet notable gaps persist in the understanding of their interconnections. Our study addresses this by introducing a novel approach to decipher the [...] Read more.
Background: Recent research underscores the clinical relevance of muscle conditions such as sarcopenia and their links to bone mineral density (BMD), yet notable gaps persist in the understanding of their interconnections. Our study addresses this by introducing a novel approach to decipher the correlation between BMD and the texture of the multifidus muscle, utilizing spinal computed tomography (CT) and dual-energy X-ray absorptiometry (DXA) to evaluate muscle texture, BMD, and bone mineral content (BMC) at the total lumbar vertebra and total hip. Methods: Our single-institution study examined 395 cases collected from 6 May 2012 to 30 November 2021. Each patient underwent a spinal CT scan and a DXA scan within a one-month interval. BMD and BMC at the total lumbar vertebra and total hip were measured. The texture features of the multifidus muscle from the axial cuts of T12 to S1 vertebrae were assessed via gray-level co-occurrence matrices. CT texture analysis values at angles of 45 + 45 and 90 degrees were calculated and correlated with BMD and BMC. A regression model was then constructed to predict BMD values, and the precision of these correlations was evaluated using mean square error (MSE) analysis. Results: Total lumbar BMC showed a correlation of 0.583–0.721 (MSE 1.568–1.842) and lumbar BMD of 0.632–0.756 (MSE 0.068–0.097). Total hip BMC had a correlation of 0.556–0.690 (MSE 0.448–0.495), while hip BMD ranged from 0.585 to 0.746 (MSE 0.072–0.092). Conclusions: The analysis of spinal CT texture alongside BMD and BMC measures provides a new approach to understanding the relationship between bone and muscle health. The strong correlations expected from our research affirm the importance of integrating bone and muscle measures in the prevention, diagnosis, and management of conditions such as sarcopenia and osteoporosis. Full article
(This article belongs to the Section Medical Imaging and Theranostics)
Show Figures

Figure 1

Figure 1
<p>Flowchart illustrating the selection process of patients undergoing concurrent spine CT and DXA scans.</p>
Full article ">Figure 2
<p>Schematic flow for BMC and BMD estimations from computed tomography. BMC, bone mineral content; BMD, bone mineral density.</p>
Full article ">Figure 3
<p>Correlation scatter plot: comparison of estimated multifidus muscle texture values from T12-S1 CT axial cuts vs. total lumbar DXA BMC.</p>
Full article ">Figure 4
<p>Correlation scatter plot: comparison of estimated multifidus muscle texture values from T12-S1 CT axial cuts vs. total lumbar DXA BMD.</p>
Full article ">Figure 5
<p>Correlation scatter plot: comparison of estimated multifidus muscle texture values from T12-S1 CT axial cuts vs. total hip DXA BMC.</p>
Full article ">Figure 6
<p>Correlation scatter plot: comparison of estimated multifidus muscle texture values from T12-S1 CT axial cuts vs. total hip DXA BMD.</p>
Full article ">
19 pages, 2363 KiB  
Article
Vein Wall Invasion Is a More Reliable Predictor of Oncological Outcomes than Vein-Related Margins after Pancreaticoduodenectomy for Early Stages of Pancreatic Ductal Adenocarcinoma
by Manish Ahuja, Rupaly Pandé, Shafiq Chugtai, Rachel M. Brown, Owen Cain, David C. Bartlett, Bobby V. M. Dasari, Ravi Marudanayagam, Keith J. Roberts, John Isaac, Robert P. Sutcliffe and Nikolaos Chatzizacharias
Diagnostics 2023, 13(22), 3465; https://doi.org/10.3390/diagnostics13223465 - 17 Nov 2023
Cited by 1 | Viewed by 1140
Abstract
Pancreaticoduodenectomy (PD) with vein resection is the only potentially curative option for patients with pancreatic ductal adenocarcinoma (PDAC) with venous involvement. The aim of our study was to assess the oncological prognostic significance of the different variables of venous involvement in patients undergoing [...] Read more.
Pancreaticoduodenectomy (PD) with vein resection is the only potentially curative option for patients with pancreatic ductal adenocarcinoma (PDAC) with venous involvement. The aim of our study was to assess the oncological prognostic significance of the different variables of venous involvement in patients undergoing PD for resectable and borderline-resectable with venous-only involvement (BR-V) PDAC. We performed a retrospective analysis of prospectively acquired data over a 10-year period. Of the 372 patients included, 105 (28%) required vein resection and vein wall involvement was identified in 37% of those. A multivariable analysis failed to identify the vein-related resection margins as independent predictors for OS, DFS or LR. Vein wall tumour involvement was an independent predictor of OS (risk x1.7–2) and DFS (risk x1.9–2.2) in all models, while it replaced overall surgical margin positivity as the only parameter independently predicting LR during an analysis of separate resection margins (risk x2.4). Vein wall tumour invasion may be a more reliable predictor of oncological outcomes compared to traditionally reported parameters. Future studies should focus on possible pre-operative investigations that could identify these cases and management pathways that could yield a survival benefit, such as the use of neoadjuvant treatments. Full article
(This article belongs to the Special Issue Diagnosis and Management of Pancreatic Cancer)
Show Figures

Figure 1

Figure 1
<p>Kaplan–Meier curves comparing overall survival (OS) for (<b>a</b>) the whole cohort with (<b>i</b>) vein resection or nota, (<b>ii</b>) resection margins and (<b>iii</b>) portomesenteric vein groove; (<b>b</b>) patients without a vein resection with (<b>i</b>) resection margins and (<b>ii</b>) portomesenteric vein groove; (<b>c</b>) patients with a vein resection with (<b>i</b>) resection margins, (<b>ii</b>) portomesenteric vein groove, (<b>iii</b>) vein resection margins and (<b>iv</b>) vein wall invasion.</p>
Full article ">Figure 2
<p>Kaplan–Meier curves comparing overall survival (DFS) for (<b>a</b>) the whole cohort with (<b>i</b>) vein resection or not, (<b>ii</b>) resection margins and (<b>iii</b>) portomesenteric vein groove; (<b>b</b>) patients without a vein resection with (<b>i</b>) resection margins and (<b>ii</b>) portomesenteric vein groove; (<b>c</b>) patients with a vein resection with (<b>i</b>) resection margins, (<b>ii</b>) portomesenteric vein groove, (<b>iii</b>) vein resection margins and (<b>iv</b>) vein wall invasion.</p>
Full article ">Figure 3
<p>Kaplan–Meier curves comparing local recurrence (LR) for (<b>a</b>) the whole cohort with (<b>i</b>) vein resection or not, (<b>ii</b>) resection margins and (<b>iii</b>) portomesenteric vein groove; (<b>b</b>) patients without a vein resection with (<b>i</b>) resection margins and (<b>ii</b>) portomesenteric vein groove; (<b>c</b>) patients with a vein resection with (<b>i</b>) resection margins, (<b>ii</b>) portomesenteric vein groove, (<b>iii</b>) vein resection margins and (<b>iv</b>) vein wall invasion.</p>
Full article ">Figure 3 Cont.
<p>Kaplan–Meier curves comparing local recurrence (LR) for (<b>a</b>) the whole cohort with (<b>i</b>) vein resection or not, (<b>ii</b>) resection margins and (<b>iii</b>) portomesenteric vein groove; (<b>b</b>) patients without a vein resection with (<b>i</b>) resection margins and (<b>ii</b>) portomesenteric vein groove; (<b>c</b>) patients with a vein resection with (<b>i</b>) resection margins, (<b>ii</b>) portomesenteric vein groove, (<b>iii</b>) vein resection margins and (<b>iv</b>) vein wall invasion.</p>
Full article ">
13 pages, 50931 KiB  
Article
Diagnostic Insights into Pediatric Pleomorphic Xanthoastrocytoma through DNA Methylation Class and Pathological Diagnosis Analysis
by Murad Alturkustani
Diagnostics 2023, 13(22), 3464; https://doi.org/10.3390/diagnostics13223464 - 17 Nov 2023
Cited by 1 | Viewed by 1170
Abstract
This study adopts an innovative approach to utilize the DNA methylation class (MC) by prioritizing the understanding of discrepancies over traditional direct comparisons with the pathological diagnosis (PD). The aim is to clarify the morphological criteria for pleomorphic xanthoastrocytoma (PXA). Using the Children’s [...] Read more.
This study adopts an innovative approach to utilize the DNA methylation class (MC) by prioritizing the understanding of discrepancies over traditional direct comparisons with the pathological diagnosis (PD). The aim is to clarify the morphological criteria for pleomorphic xanthoastrocytoma (PXA). Using the Children’s Brain Tumor Network online database, PXA-diagnosed cases were sourced. MCs and CDKN2A/B statuses were ascertained using the Heidelberg methylation brain tumor classifier v12.5 (v12.8 for selected cases). Three distinct groups emerged: Group 1 confirmed PXA through both PD and MC (7 cases); Group 2 identified PXA via PD alone (7 cases); and Group 3 diagnosed PXA using MC (5 cases). Key insights from the study include the frequent local infiltration of PXA into gray matter structures, mirroring infiltrative astrocytoma. The MC for PXA stands out for its sensitivity. Cases with a PXA morphological diagnosis diverging from the DNA class warrant attention to newer differential diagnoses such as high-grade astrocytoma with piloid features, pilocytic astrocytoma NF1-associated, and NET-PATZ1. Tumors with a MC indicative of PXA but lacking its typical features may, if high-grade, behave as grade 4 gliomas. In contrast, their low-grade counterparts could belong to the PXA morphological continuum. Further research is pivotal for cementing these findings. Full article
(This article belongs to the Special Issue Advances in the Diagnosis of Nervous System Diseases—2nd Edition)
Show Figures

Figure 1

Figure 1
<p>Infiltration in classical PXA cases. (<b>A</b>–<b>C</b>) Case 1 depicts the classical histological features of PXA: (<b>A</b>) a solid cellular region displaying both spindle and pleomorphic cells, accompanied by focal lymphocytic clusters, eosinophilic granular (upper inset), and pale bodies (lower inset); (<b>B</b>) an infiltrative component with entrapped neurons; and (<b>C</b>) a GFAP immunostain of the neoplastic cells accentuates lengthy, thick processes with pronounced staining. (<b>D</b>–<b>I</b>) Case 2 with prominent infiltrative component. (<b>D</b>–<b>F</b>) Initial resection presents features synonymous with infiltrative astrocytoma: (<b>D</b>) a broad view of the infiltrative glial neoplasm, highlighting a focal cellular zone; (<b>E</b>) the region with heightened cellular activity exhibits oval neoplastic cells against a fibrillary background; and (<b>F</b>) an infiltrative component is displaying similar neoplastic cells in less dense cellular regions. (<b>G</b>–<b>I</b>) Case 2 recurrence with classical PXA features: (<b>G</b>) a dense cellular region interspersed with sporadic pleomorphic cells, where the neoplastic cells exhibit large eosinophilic cytoplasm; (<b>H</b>) a section with focal lymphocytic infiltration; and (<b>I</b>) abundance of eosinophilic granular bodies at the infiltrative edge (higher magnification in the inset). Scale bars: 200 µm (<b>A</b>–<b>C</b>,<b>E</b>–<b>I</b>), 2 mm (<b>D</b>).</p>
Full article ">Figure 2
<p>Case of HGAP that progressed from low-grade astrocytoma and a case of NET-PATZ1. (<b>A</b>–<b>F</b>) Case 8 documents the progression from low-grade astrocytoma to HGAP. (<b>A</b>–<b>C</b>) the first resection was consistent with low-grade astrocytoma: (<b>A</b>) compact area with elongated cells but no convincing Rosenthal fibers; (<b>B</b>) microcystic area with myxoid background; and (<b>C</b>) occasional giant cells and EGBs. (<b>D</b>–<b>F</b>) Second resection shows progression to high-grade astrocytoma: (<b>D</b>) necrosis with pseudopalisading arrangement; (<b>E</b>) cellular areas with round hyperchromatic cells and multinucleated giant cells and EGBs; and (<b>F</b>) a Ki67 immunostain shows high proliferative activity. Case 10 (<b>G</b>–<b>I</b>) is a case of NET-PATZ1 with morphological features of PXA: (<b>G</b>) solid circumscribed cellular area with spindle neoplastic cells; (<b>H</b>) leptomeningeal infiltration with occasional pleomorphic neoplastic cells; and (<b>I</b>) CD34 highlights diffuse staining in the neoplastic cells. Scale bars: 100 µm (<b>A</b>–<b>C</b>), 200 µm (<b>D</b>–<b>I</b>).</p>
Full article ">Figure 3
<p>Two cases from the third group with high-grade histological features. (<b>A</b>–<b>D</b>) Case 15 epithelioid glioblastoma with PXA MC: (<b>A</b>) solid sheet of cellular epithelioid/rhabdoid cells (upper inset) with significant mitotic activity (lower inset); (<b>B</b>) round cells with fibrillary background and endothelial proliferation; (<b>C</b>) GFAP immunostaining shows variable staining ranging from round to elongated cellular processes, but a good proportion of neoplastic cells were immunonegative; and (<b>D</b>) SMARCB1 (INI1) immunostain is retained in the neoplastic cells. (<b>E</b>–<b>H</b>) Case 16 high-grade histology with focal area classic PXA morphological features: (<b>E</b>) circumscribed superficial cellular neoplasm; (<b>F</b>) high-cellular spindle cell glial neoplasm arranging in interlacing fascicles; (<b>G</b>) small focus with many eosinophilic granular and pale bodies; and (<b>H</b>) infiltrative component. Scale bars: 100 µm (<b>A</b>–<b>D</b>), 200 µm (<b>E</b>–<b>H</b>).</p>
Full article ">Figure 4
<p>Two cases from the third group with low-grade histological features. (<b>A</b>–<b>F</b>) Case 17 glial tumor with oligodendroglioma-like and astrocytic-like areas: (<b>A</b>) neoplastic cells with round nuclei arranged around multilayered blood vessels (inset show high magnification for the round cells with perinuclear halo); (<b>B</b>) GFAP highlights mainly background staining; (<b>C</b>) cellular spindle cells with focal lymphocytic aggregates and eosinophilic granular bodies (inset); (<b>D</b>) infiltrative component (higher magnification in the upper inset) and microcalcification (higher magnification in the lower inset); (<b>E</b>) leptomeningeal involvement with focal rhabdoid/epithelioid cells (inset shows higher magnification for these cells); and (<b>F</b>) GFAP is staining cellular processes in the leptomeningeal area. (<b>G</b>–<b>I</b>) Case 18 low-grade neuroepithelial tumor with histological features of histology of SEGA and <span class="html-italic">ST13-ROS1</span> fusion: (<b>G</b>) circumscribed tumor composed of neoplastic glial cells with large eosinophilic cytoplasm; (<b>H</b>) occasional pleomorphic cells; and (<b>I</b>) GFAP shows diffuse faint cytoplasmic staining in the neoplastic cells. Scale bars: 200 µm (<b>A</b>–<b>I</b>).</p>
Full article ">
2 pages, 181 KiB  
Comment
Comment on Roman-Filip et al. Non-Aneurysmal Perimesencephalic Subarachnoid Hemorrhage: A Literature Review. Diagnostics 2023, 13, 1195
by Ajay Malhotra
Diagnostics 2023, 13(22), 3463; https://doi.org/10.3390/diagnostics13223463 - 17 Nov 2023
Viewed by 709
Abstract
We would like to congratulate Roman-Filip et al. on their recent review on perimesencephalic hemorrhages [...] Full article
(This article belongs to the Special Issue Imaging of the Brain and Blood Vessels in Ischemic Stroke)
16 pages, 9059 KiB  
Article
Efficient Thorax Disease Classification and Localization Using DCNN and Chest X-ray Images
by Zeeshan Ahmad, Ahmad Kamran Malik, Nafees Qamar and Saif ul Islam
Diagnostics 2023, 13(22), 3462; https://doi.org/10.3390/diagnostics13223462 - 17 Nov 2023
Viewed by 1797
Abstract
Thorax disease is a life-threatening disease caused by bacterial infections that occur in the lungs. It could be deadly if not treated at the right time, so early diagnosis of thoracic diseases is vital. The suggested study can assist radiologists in more swiftly [...] Read more.
Thorax disease is a life-threatening disease caused by bacterial infections that occur in the lungs. It could be deadly if not treated at the right time, so early diagnosis of thoracic diseases is vital. The suggested study can assist radiologists in more swiftly diagnosing thorax disorders and in the rapid airport screening of patients with a thorax disease, such as pneumonia. This paper focuses on automatically detecting and localizing thorax disease using chest X-ray images. It provides accurate detection and localization using DenseNet-121 which is foundation of our proposed framework, called Z-Net. The proposed framework utilizes the weighted cross-entropy loss function (W-CEL) that manages class imbalance issue in the ChestX-ray14 dataset, which helped in achieving the highest performance as compared to the previous models. The 112,120 images contained in the ChestX-ray14 dataset (60,412 images are normal, and the rest contain thorax diseases) were preprocessed and then trained for classification and localization. This work uses computer-aided diagnosis (CAD) system that supports development of highly accurate and precise computer-aided systems. We aim to develop a CAD system using a deep learning approach. Our quantitative results show high AUC scores in comparison with the latest research works. The proposed approach achieved the highest mean AUC score of 85.8%. This is the highest accuracy documented in the literature for any related model. Full article
(This article belongs to the Special Issue Applications of Artificial Intelligence in Thoracic Imaging)
Show Figures

Figure 1

Figure 1
<p>Framework of the proposed Z-Net model.</p>
Full article ">Figure 2
<p>Dataset visualization.</p>
Full article ">Figure 3
<p>(<b>a</b>) Training/validation loss curve at epoch size = 100; (<b>b</b>) Training/validation loss curve at epoch size = 10.</p>
Full article ">Figure 4
<p>AUC comparison with other models.</p>
Full article ">Figure 5
<p>Comparison of localization results with latest research.</p>
Full article ">Figure 6
<p>CAM visualization results by the Z-Net model with bounding boxes around infected areas of the diseases: (<b>a</b>) Atelectasis, (<b>b</b>) Cardiomegaly, (<b>c</b>) Effusion, (<b>d</b>) Infiltration, (<b>e</b>) Mass, (<b>f</b>) Nodule, (<b>g</b>) Pneumonia, and (<b>h</b>) Pneumothorax.</p>
Full article ">
27 pages, 7994 KiB  
Article
A Deep Learning Framework with an Intermediate Layer Using the Swarm Intelligence Optimizer for Diagnosing Oral Squamous Cell Carcinoma
by Bharanidharan Nagarajan, Sannasi Chakravarthy, Vinoth Kumar Venkatesan, Mahesh Thyluru Ramakrishna, Surbhi Bhatia Khan, Shakila Basheer and Eid Albalawi
Diagnostics 2023, 13(22), 3461; https://doi.org/10.3390/diagnostics13223461 - 16 Nov 2023
Cited by 6 | Viewed by 1654
Abstract
One of the most prevalent cancers is oral squamous cell carcinoma, and preventing mortality from this disease primarily depends on early detection. Clinicians will greatly benefit from automated diagnostic techniques that analyze a patient’s histopathology images to identify abnormal oral lesions. A deep [...] Read more.
One of the most prevalent cancers is oral squamous cell carcinoma, and preventing mortality from this disease primarily depends on early detection. Clinicians will greatly benefit from automated diagnostic techniques that analyze a patient’s histopathology images to identify abnormal oral lesions. A deep learning framework was designed with an intermediate layer between feature extraction layers and classification layers for classifying the histopathological images into two categories, namely, normal and oral squamous cell carcinoma. The intermediate layer is constructed using the proposed swarm intelligence technique called the Modified Gorilla Troops Optimizer. While there are many optimization algorithms used in the literature for feature selection, weight updating, and optimal parameter identification in deep learning models, this work focuses on using optimization algorithms as an intermediate layer to convert extracted features into features that are better suited for classification. Three datasets comprising 2784 normal and 3632 oral squamous cell carcinoma subjects are considered in this work. Three popular CNN architectures, namely, InceptionV2, MobileNetV3, and EfficientNetB3, are investigated as feature extraction layers. Two fully connected Neural Network layers, batch normalization, and dropout are used as classification layers. With the best accuracy of 0.89 among the examined feature extraction models, MobileNetV3 exhibits good performance. This accuracy is increased to 0.95 when the suggested Modified Gorilla Troops Optimizer is used as an intermediary layer. Full article
(This article belongs to the Section Machine Learning and Artificial Intelligence in Diagnostics)
Show Figures

Figure 1

Figure 1
<p>Sample oral histopathological images belonging to the Normal class.</p>
Full article ">Figure 2
<p>Sample oral histopathological images belonging to OSCC class.</p>
Full article ">Figure 3
<p>Typical approach for OSCC detection using transfer learning-based feature extraction.</p>
Full article ">Figure 4
<p>Typical deep learning architecture with a functional layer depicting the transfer learning model for feature extraction and the remaining layers depicting the classification layers.</p>
Full article ">Figure 5
<p>Overview of the proposed approach for OSCC detection.</p>
Full article ">Figure 6
<p>Proposed deep learning architecture where MGTO is used as an intermediate layer between the feature extraction (functional) layer and the classification layer.</p>
Full article ">Figure 7
<p>Ideal value computation for <math display="inline"><semantics> <mrow> <mi>Max</mi> <mo>_</mo> <mi>Iter</mi> </mrow> </semantics></math>.</p>
Full article ">Figure 8
<p>Ideal value computation of the <math display="inline"><semantics> <mi>p</mi> </semantics></math> and <math display="inline"><semantics> <mi>β</mi> </semantics></math> parameters.</p>
Full article ">Figure 9
<p>Confusion matrix of deep learning models without an intermediate layer.</p>
Full article ">Figure 10
<p>Confusion matrix of deep learning models with MGTO as an intermediate layer.</p>
Full article ">Figure 11
<p>Training and validation accuracy and loss of deep learning models without an intermediate layer on the first dataset.</p>
Full article ">Figure 12
<p>Training and validation accuracy and loss of deep learning models with MGTO as an intermediate layer on the first dataset.</p>
Full article ">Figure 12 Cont.
<p>Training and validation accuracy and loss of deep learning models with MGTO as an intermediate layer on the first dataset.</p>
Full article ">Figure 13
<p>Percentage accuracy increase due to the usage of intermediate layers in DL models when compared with the accuracy offered by DL models without intermediate layer.</p>
Full article ">Figure 14
<p>Scatter plot of features extracted with MobileNetV3.</p>
Full article ">Figure 15
<p>Scatter plot of features extracted with InceptioNetV2.</p>
Full article ">Figure 16
<p>Scatter plot of features extracted by EfficientNetB3.</p>
Full article ">Figure 17
<p>Precision, recall, and F1-score of various OSCC classification models.</p>
Full article ">Figure 18
<p>Pie-chart representing the percentage of training time taken by each DL model with respect to total training time taken by all DL models.</p>
Full article ">
11 pages, 1717 KiB  
Article
Antibody Response to SARS-CoV-2 Vaccination in Heart Failure Patients: Retrospective Single-Center Cohort Study
by Defne Güneş Ergi, Ümit Kahraman, Gözde Akkuş, Seyfi Durmaz, Özlem Balcıoğlu, Çağatay Engin, Burcu Yağmur, Sanem Nalbantgil, Candan Çiçek, Mustafa Özbaran and Tahir Yağdı
Diagnostics 2023, 13(22), 3460; https://doi.org/10.3390/diagnostics13223460 - 16 Nov 2023
Cited by 1 | Viewed by 1103
Abstract
We sought to investigate the impact of heart failure on anti-spike antibody positivity following SARS-CoV-2 vaccination. Our study included 103 heart failure (HF) patients, including those with and without left ventricular assist devices (LVAD) selected from our institutional transplant waiting list as well [...] Read more.
We sought to investigate the impact of heart failure on anti-spike antibody positivity following SARS-CoV-2 vaccination. Our study included 103 heart failure (HF) patients, including those with and without left ventricular assist devices (LVAD) selected from our institutional transplant waiting list as well as 104 non-heart failure (NHF) patients who underwent open heart surgery at our institution from 2021 to 2022. All the patients received either heterologous or homologous doses of BNT162b2 and CoronaVac. The median age of the HF group was 56.0 (interquartile range (IQR): 48.0–62.5) and the NHF group was 63.0 (IQR: 56.0–70.2) years, and the majority were males in both groups (n = 78; 75.7% and n = 80; 76.9%, respectively). The majority of the patients in both the HF and NHF groups received heterologous vaccinations (n = 43; 41.7% and n = 52; 50.3%, respectively; p = 0.002). There was no difference in the anti-spike antibody positivity between the patients with and without heart failure (p = 0.725). Vaccination with BNT162b2 led to significantly higher antibody levels compared to CoronaVac alone (OR: 11.0; 95% CI: 3.8–31.5). With each passing day after the last vaccine dose, there was a significant decrease in anti-spike antibody positivity, with an OR of 0.9 (95% CI: 0.9–0.9). Furthermore, hyperlipidemia was associated with increased antibody positivity (p = 0.004). Full article
Show Figures

Figure 1

Figure 1
<p>Flowchart of the study.</p>
Full article ">Figure 2
<p>Distribution of anti-spike antibody levels over time according to vaccine type and heart failure status.</p>
Full article ">Figure 3
<p>Distribution of anti-spike antibody levels for different vaccine types over time.</p>
Full article ">
12 pages, 2643 KiB  
Article
Preoperative Prediction of New Vertebral Fractures after Vertebral Augmentation with a Radiomics Nomogram
by Yang Jiang, Wei Zhang, Shihao Huang, Qing Huang, Haoyi Ye, Yurong Zeng, Xin Hua, Jinhui Cai, Zhifeng Liu and Qingyu Liu
Diagnostics 2023, 13(22), 3459; https://doi.org/10.3390/diagnostics13223459 - 16 Nov 2023
Cited by 2 | Viewed by 1108
Abstract
The occurrence of new vertebral fractures (NVFs) after vertebral augmentation (VA) procedures is common in patients with osteoporotic vertebral compression fractures (OVCFs), leading to painful experiences and financial burdens. We aim to develop a radiomics nomogram for the preoperative prediction of NVFs after [...] Read more.
The occurrence of new vertebral fractures (NVFs) after vertebral augmentation (VA) procedures is common in patients with osteoporotic vertebral compression fractures (OVCFs), leading to painful experiences and financial burdens. We aim to develop a radiomics nomogram for the preoperative prediction of NVFs after VA. Data from center 1 (training set: n = 153; internal validation set: n = 66) and center 2 (external validation set: n = 44) were retrospectively collected. Radiomics features were extracted from MRI images and radiomics scores (radscores) were constructed for each level-specific vertebra based on least absolute shrinkage and selection operator (LASSO). The radiomics nomogram, integrating radiomics signature with presence of intravertebral cleft and number of previous vertebral fractures, was developed by multivariable logistic regression analysis. The predictive performance of the vertebrae was level-specific based on radscores and was generally superior to clinical variables. RadscoreL2 had the optimal discrimination (AUC ≥ 0.751). The nomogram provided good predictive performance (AUC ≥ 0.834), favorable calibration, and large clinical net benefits in each set. It was used successfully to categorize patients into high- or low-risk subgroups. As a noninvasive preoperative prediction tool, the MRI-based radiomics nomogram holds great promise for individualized prediction of NVFs following VA. Full article
(This article belongs to the Special Issue Musculoskeletal Imaging 2023)
Show Figures

Figure 1

Figure 1
<p>Flowchart of patient recruitment. Center 1, The Fourth Affiliated Hospital of Guangzhou Medical University; Center 2, Huizhou Central People’s Hospital.</p>
Full article ">Figure 2
<p>The MRI-based radiomics nomogram for NVFs prediction.</p>
Full article ">Figure 3
<p>Receiver operating characteristic curves of the radiomics nomogram. (<b>A</b>) Training set, (<b>B</b>) internal validation set, (<b>C</b>) external validation set.</p>
Full article ">Figure 4
<p>Calibration curves of the radiomics nomogram. (<b>A</b>) Training set, (<b>B</b>) internal validation set, (<b>C</b>) external validation set.</p>
Full article ">Figure 5
<p>Decision curve analyses for the radiomics nomogram. The blue line represents the radiomics nomogram. The gray line represents the hypothesis that all patients had NVFs. The black line represents the hypothesis that no patients had NVFs. (<b>A</b>) Training set, (<b>B</b>) internal validation set, (<b>C</b>) external validation set.</p>
Full article ">Figure 6
<p>Graphs show cumulative incidence of NVFs according to two risk strata defined by the radiomics nomogram in the training (<b>A</b>), internal validation (<b>B</b>), and external validation (<b>C</b>) sets.</p>
Full article ">
Previous Issue
Back to TopTop