[go: up one dir, main page]

Next Issue
Volume 12, December
Previous Issue
Volume 12, October


Diagnostics, Volume 12, Issue 11 (November 2022) – 330 articles

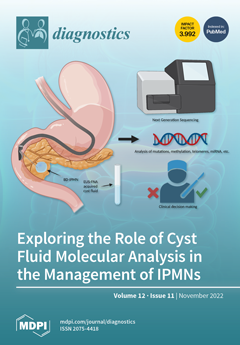
Cover Story (view full-size image): Pancreatic cysts are being discovered at increasing rates with the advancement of imaging technology. Intraductal papillary mucinous neoplasms are among the most frequently diagnosed premalignant pancreatic cysts. EUS-FNA can be used to obtain cyst fluid for molecular analyses via next-generation sequencing. Detecting mutations in KRAS and GNAS can accurately differentiate between cyst types. Mutational analyses, telomere fusion, microRNAs, long non-coding RNA, and DNA methylation have all been identified as targets for stratifying malignant potential. Classifying lesions into either low-grade or advanced neoplasia (high-grade dysplasia or adenocarcinoma) can help clinicians decide between surgical and conservative management. View this paper
  • Issues are regarded as officially published after their release is announced to the table of contents alert mailing list.
  • You may sign up for e-mail alerts to receive table of contents of newly released issues.
  • PDF is the official format for papers published in both, html and pdf forms. To view the papers in pdf format, click on the "PDF Full-text" link, and use the free Adobe Reader to open them.
Order results
Result details
Section
Select all
Export citation of selected articles as:
11 pages, 2131 KiB  
Article
Correlation between CT Value on Lung Subtraction CT and Radioactive Count on Perfusion Lung Single Photon Emission CT in Chronic Thromboembolic Pulmonary Hypertension
by Toshiya Kariyasu, Haruhiko Machida, Tsuneo Yamashiro, Keita Fukushima, Masamichi Koyanagi, Kenichi Yokoyama, Makiko Nishikawa and Toru Satoh
Diagnostics 2022, 12(11), 2895; https://doi.org/10.3390/diagnostics12112895 - 21 Nov 2022
Cited by 1 | Viewed by 1827
Abstract
Background: Lung subtraction CT (LSCT), the subtraction of noncontrast CT from CT pulmonary angiography (CTPA) without spatial misregistration, is easily applicable by utilizing a software-based deformable image registration technique without additional hardware and permits the evaluation of lung perfusion as iodine accumulation, similar [...] Read more.
Background: Lung subtraction CT (LSCT), the subtraction of noncontrast CT from CT pulmonary angiography (CTPA) without spatial misregistration, is easily applicable by utilizing a software-based deformable image registration technique without additional hardware and permits the evaluation of lung perfusion as iodine accumulation, similar to that observed in perfusion lung single photon emission CT (PL-SPECT). The aim of this study was to use LSCT to newly assess the quantitative correlation between the CT value on LSCT and radioactive count on PL-SPECT as a reference and validate the quantification of lung perfusion by measuring the CT value in chronic thromboembolic pulmonary hypertension (CTEPH). Methods: We prospectively enrolled 47 consecutive patients with CTEPH undergoing both LSCT and PL-SPECT; we used noncontrast CT, CTPA, and LSCT to measure CT values and PL-SPECT to measure radioactive counts in areas representing three different perfusion classes—no perfusion defect, subsegmental perfusion defect, and segmental perfusion defect; we compared CT values on noncontrast CT, CTPA, and LSCT and radioactive counts on PL-SPECT among the three classes, then assessed the correlation between them. Results: Both the CT values and radioactive counts differed significantly among the three classes (p < 0.01 for all) and showed weak correlation (ρ = 0.38) by noncontrast CT, moderate correlation (ρ = 0.61) by CTPA, and strong correlation (ρ = 0.76) by LSCT. Conclusions: The CT value measurement on LSCT is a novel quantitative approach to assess lung perfusion in CTEPH and only correlates strongly with radioactive count measurement on PL-SPECT. Full article
(This article belongs to the Section Medical Imaging and Theranostics)
Show Figures

Figure 1

Figure 1
<p>Flowchart of patient selection. CTEPH, chronic thromboembolic pulmonary hypertension; SPECT, single photon emission CT.</p>
Full article ">Figure 2
<p>Lung subtraction CT generation process. Noncontrast chest CT axial image (<b>a</b>) and CTPA axial image (<b>b</b>) can be spatially matched based on deformable image registration by subtracting the noncontrast image from the contrast-enhanced image to generate a lung subtraction CT axial image (<b>c</b>). CTPA, CT pulmonary angiography.</p>
Full article ">Figure 3
<p>Fusion of lung subtraction CT and perfusion lung SPECT images at various blending ratios with and without ROIs placed in the three different classes of lung perfusion. Both a lung subtraction CT axial image at lung window display and a perfusion lung SPECT axial image can be fused by pixel-shift manual registration to eliminate spatial misregistration using the lung margin as the anatomical reference at various blending ratios, which can be arbitrarily determined from 0% ((<b>a</b>): perfusion lung SPECT only) to 100% ((<b>e</b>): lung subtraction CT only), including 25% (<b>b</b>), 50% (<b>c</b>), and 75% (<b>d</b>). Three circular ROIs of 1 cm<sup>2</sup> can be manually placed in areas representing the three different classes of lung perfusion (Class 1, no perfusion defect; Class 2, subsegmental perfusion defect; and Class 3, segmental perfusion defect) on the axial fusion image at various blending ratios, such as 50% (<b>f</b>), for simultaneous (within each ROI) measurement of the CT value on lung subtraction CT and radioactive count on perfusion lung SPECT. ROI, region of interest; SPECT, single photon emission CT.</p>
Full article ">Figure 4
<p>Box-and-whisker plots to compare CT value and radioactive count among different lung perfusion classes. CT values on noncontrast CT (<b>a</b>), CTPA (<b>b</b>), and lung subtraction CT (<b>c</b>) and radioactive count on perfusion lung SPECT (<b>d</b>) significantly decrease from Class 1 (blue: no perfusion defect) to Class 2 (orange: subsegmental perfusion defect) to Class 3 (gray: segmental perfusion defect) (<span class="html-italic">p</span> &lt; 0.01 for all). The overlap of CT values among the three classes decreases from noncontrast CT to CTPA to lung subtraction CT (<b>a</b>–<b>c</b>). CTPA, CT pulmonary angiography; SPECT, single photon emission CT.</p>
Full article ">Figure 5
<p>Correlations between CT value and radioactive count. Weak correlation is shown between CT value on noncontrast CT and radioactive count on perfusion lung SPECT (ρ = 0.38, <span class="html-italic">p</span> &lt; 0.0001) (<b>a</b>); moderate correlation between CT value on CTPA and radioactive count (ρ = 0.61, <span class="html-italic">p</span> &lt; 0.0001) (<b>b</b>); and strong correlation between CT value on lung subtraction CT and radioactive count (ρ = 0.76, <span class="html-italic">p</span> &lt; 0.0001) (<b>c</b>). Blue plots represent Class 1 (no perfusion defect); orange, Class 2 (subsegmental perfusion defect); and gray, Class 3 (segmental perfusion defect). CTPA, CT pulmonary angiography; SPECT, single photon emission CT.</p>
Full article ">
16 pages, 4161 KiB  
Article
Deep Learning-Based Glaucoma Screening Using Regional RNFL Thickness in Fundus Photography
by Hyunmo Yang, Yujin Ahn, Sanzhar Askaruly, Joon S. You, Sang Woo Kim and Woonggyu Jung
Diagnostics 2022, 12(11), 2894; https://doi.org/10.3390/diagnostics12112894 - 21 Nov 2022
Cited by 4 | Viewed by 2393
Abstract
Since glaucoma is a progressive and irreversible optic neuropathy, accurate screening and/or early diagnosis is critical in preventing permanent vision loss. Recently, optical coherence tomography (OCT) has become an accurate diagnostic tool to observe and extract the thickness of the retinal nerve fiber [...] Read more.
Since glaucoma is a progressive and irreversible optic neuropathy, accurate screening and/or early diagnosis is critical in preventing permanent vision loss. Recently, optical coherence tomography (OCT) has become an accurate diagnostic tool to observe and extract the thickness of the retinal nerve fiber layer (RNFL), which closely reflects the nerve damage caused by glaucoma. However, OCT is less accessible than fundus photography due to higher cost and expertise required for operation. Though widely used, fundus photography is effective for early glaucoma detection only when used by experts with extensive training. Here, we introduce a deep learning-based approach to predict the RNFL thickness around optic disc regions in fundus photography for glaucoma screening. The proposed deep learning model is based on a convolutional neural network (CNN) and utilizes images taken with fundus photography and with RNFL thickness measured with OCT for model training and validation. Using a dataset acquired from normal tension glaucoma (NTG) patients, the trained model can estimate RNFL thicknesses in 12 optic disc regions from fundus photos. Using intuitive thickness labels to identify localized damage of the optic nerve head and then estimating regional RNFL thicknesses from fundus images, we determine that screening for glaucoma could achieve 92% sensitivity and 86.9% specificity. Receiver operating characteristic (ROC) analysis results for specificity of 80% demonstrate that use of the localized mean over superior and inferior regions reaches 90.7% sensitivity, whereas 71.2% sensitivity is reached using the global RNFL thicknesses for specificity at 80%. This demonstrates that the new approach of using regional RNFL thicknesses in fundus images holds good promise as a potential screening technique for early stage of glaucoma. Full article
(This article belongs to the Special Issue Deep Learning Applications in Ophthalmology)
Show Figures

Figure 1

Figure 1
<p>Overview of the proposed study. (<b>a</b>) Fundus images and OCT images were segmented into 12 subsections and then the segmented images were paired with the RNFL thickness measurements from OCT to train the model. The trained CNN model can predict RNFL thickness from a subdivided retinal image. The label of the thinning level for an estimated RNFL of a given region is determined by comparison with the normative reference data. (<b>b</b>) The details of CNN architecture for RNFL thickness estimation from segmented retinal fundus images are presented. Note that the model for estimation of global RNFL has the input size as 320 × 320 × 3 and thus sizes of the following convolution blocks were adjusted.</p>
Full article ">Figure 2
<p>Summary of research workflow. (<b>a</b>) Data acquired from NTG patients were utilized for model training and evaluation. (<b>b</b>) Screening test and ROC analysis performed with test set plus data from normal patients.</p>
Full article ">Figure 3
<p>Scatterplots representing the relationship between predicted RNFL by trained CNN from optic disc photographs and actual OCT-measurements. (<b>a</b>) The results of global RNFL estimation from the whole optic disc image; (<b>b</b>) the results of regional RNFL estimation from the parted optic disc images along 12 directions. Data is based on the test set.</p>
Full article ">Figure 4
<p>Evaluation of the labeling results of RNFL thinning level with representative examples. (<b>a</b>) Representation format. The inner color label indicates the true thinning level from OCT measurement and the outer color label is the predicted level from CNN estimation. (<b>b</b>) All normal, (<b>c</b>) partially damaged, and (<b>d</b>) severe cases. Data is based on the test set.</p>
Full article ">Figure 5
<p>Prediction and categorization of RNFL for different patient groups; (<b>a</b>) glaucoma (N = 61, 210 cases), (<b>b</b>) suspicious (N = 93, 103 cases), and (<b>c</b>) healthy (N = 124, 167 cases) patients. The colored tiles showing the categorization of RNFL thinning level from a randomly selected 30 eyes and scatters on the right side represent all estimated RNFL values in <math display="inline"><semantics> <mrow> <mo stretchy="false">(</mo> <mrow> <mi mathvariant="sans-serif">μ</mi> <mi mathvariant="normal">m</mi> </mrow> </mrow> </semantics></math>) with categorized color. Each row indicates regions from the global (G) and 12 regional subsections (from ST to TS).</p>
Full article ">Figure 6
<p>Screening performance comparison. The confusion matrix of glaucoma screening is based on the thickness level of (<b>a1</b>) the global and (<b>a2</b>) superior and inferior regions among the 12 regions. Numbers in angle bracket indicates the cases. (<b>b</b>) The sensitivity and specificity of screening results using two subsections for all possible combinations are represented as a colormap.</p>
Full article ">Figure 7
<p>ROC analysis using (<b>a</b>) global RNFL predictions and (<b>b</b>) local mean of predicted RNFL thicknesses over superior plus inferior (ST, SS, SN, IN, II, IT) regions, which has the best score of AUC and sensitivity for specificity at 80%.</p>
Full article ">Figure 8
<p>Examples of prediction failure. Model fails to estimate RNFL thickness accurately when the quality of fundus photograph is bad in terms of contrast, brightness, and blurriness and arrives at an incorrect thinning level prediction consequently. Data is based on rejected samples.</p>
Full article ">
12 pages, 554 KiB  
Article
Clinical and Genetic Characterisation of Cystic Fibrosis Patients in Latvia: A Twenty-Five-Year Experience
by Madara Auzenbaha, Elina Aleksejeva, Gita Taurina, Liene Kornejeva, Inga Kempa, Vija Svabe and Linda Gailite
Diagnostics 2022, 12(11), 2893; https://doi.org/10.3390/diagnostics12112893 - 21 Nov 2022
Cited by 2 | Viewed by 1936
Abstract
Cystic fibrosis (CF) is the most common life-limiting genetic disorder in European descent populations. It is caused by pathogenic variants in the CFTR gene, and inheritance is autosomal recessive. This study provides an up-to-date, comprehensive estimation of the distribution of CFTR pathogenic variants [...] Read more.
Cystic fibrosis (CF) is the most common life-limiting genetic disorder in European descent populations. It is caused by pathogenic variants in the CFTR gene, and inheritance is autosomal recessive. This study provides an up-to-date, comprehensive estimation of the distribution of CFTR pathogenic variants in Latvia and their phenotypic characteristics. It also reports the first results of the CF newborn screening programme following its implementation in 2019. We analysed the clinical and molecular data of CF patients treated at the only tertiary hospital in Latvia providing specialised healthcare for the disorder. Between 1997 and 2022, 66 CF patients from 62 families were diagnosed based on symptoms or a molecular confirmation (six patients were diagnosed through the CF newborn screening programme). F508del was identified in 70.5% of all CF chromosomes. Known variants were identified in more than one family: dele2,3, R1006H, L1335P, W57R, R553X, 2143delT and 3849+10kb C>T (legacy names used). Furthermore, two novel variants were identified, namely, c.503C>A p.(Ser168Ter) and c.(743+1_744-1)_(1584+1_1585-1)del p.(?). The available follow-up results indicated that Latvian CF patients demonstrated similar tendencies to CF patients worldwide. The oldest age at diagnosis prior to the implementation of the CF newborn screening programme was 14 years. We provide here, for the first time, a comprehensive description of Latvian CF patients. An improvement in the healthcare of CF patients over time, including access to diagnosis, is evident. Two novel CF-causing variants are reported, and F508del is the most frequently occurring variant in the population, thus suggesting that F508del screening should be followed by the testing of the full CFTR gene. Full article
(This article belongs to the Section Pathology and Molecular Diagnostics)
Show Figures

Figure 1

Figure 1
<p>Pedigree for Case 3 (II-1) and Case 4 (II-2). III-2 has genotype c.[1521_1523delCTT];[1521_1523delCTT] p.[(Phe508del)];[(Phe508del)], legacy nomenclature dF508/dF508.</p>
Full article ">
22 pages, 1655 KiB  
Article
An Al-Biruni Earth Radius Optimization-Based Deep Convolutional Neural Network for Classifying Monkeypox Disease
by Doaa Sami Khafaga, Abdelhameed Ibrahim, El-Sayed M. El-Kenawy, Abdelaziz A. Abdelhamid, Faten Khalid Karim, Seyedali Mirjalili, Nima Khodadadi, Wei Hong Lim, Marwa M. Eid and Mohamed E. Ghoneim
Diagnostics 2022, 12(11), 2892; https://doi.org/10.3390/diagnostics12112892 - 21 Nov 2022
Cited by 31 | Viewed by 3247
Abstract
Human skin diseases have become increasingly prevalent in recent decades, with millions of individuals in developed countries experiencing monkeypox. Such conditions often carry less obvious but no less devastating risks, including increased vulnerability to monkeypox, cancer, and low self-esteem. Due to the low [...] Read more.
Human skin diseases have become increasingly prevalent in recent decades, with millions of individuals in developed countries experiencing monkeypox. Such conditions often carry less obvious but no less devastating risks, including increased vulnerability to monkeypox, cancer, and low self-esteem. Due to the low visual resolution of monkeypox disease images, medical specialists with high-level tools are typically required for a proper diagnosis. The manual diagnosis of monkeypox disease is subjective, time-consuming, and labor-intensive. Therefore, it is necessary to create a computer-aided approach for the automated diagnosis of monkeypox disease. Most research articles on monkeypox disease relied on convolutional neural networks (CNNs) and using classical loss functions, allowing them to pick up discriminative elements in monkeypox images. To enhance this, a novel framework using Al-Biruni Earth radius (BER) optimization-based stochastic fractal search (BERSFS) is proposed to fine-tune the deep CNN layers for classifying monkeypox disease from images. As a first step in the proposed approach, we use deep CNN-based models to learn the embedding of input images in Euclidean space. In the second step, we use an optimized classification model based on the triplet loss function to calculate the distance between pairs of images in Euclidean space and learn features that may be used to distinguish between different cases, including monkeypox cases. The proposed approach uses images of human skin diseases obtained from an African hospital. The experimental results of the study demonstrate the proposed framework’s efficacy, as it outperforms numerous examples of prior research on skin disease problems. On the other hand, statistical experiments with Wilcoxon and analysis of variance (ANOVA) tests are conducted to evaluate the proposed approach in terms of effectiveness and stability. The recorded results confirm the superiority of the proposed method when compared with other optimization algorithms and machine learning models. Full article
Show Figures

Figure 1

Figure 1
<p>Samples from the Monkeypox Skin Images Dataset (MSID) [<a href="#B63-diagnostics-12-02892" class="html-bibr">63</a>]: (<b>a</b>) monkeypox cases, (<b>b</b>) chickenpox cases, (<b>c</b>) measles cases, and (<b>d</b>) normal cases.</p>
Full article ">Figure 2
<p>The homoscedasticity graphs, heat maps, residual plots, and QQ plots of the BERSFS and other basic models.</p>
Full article ">Figure 3
<p>The homoscedasticity graphs, heat maps, residual plots, and QQ plots of the BERSFS-CNN and other deep learning models.</p>
Full article ">Figure 4
<p>The homoscedasticity graphs, heat maps, residual plots, and QQ plots of the BERSFS-CNN and other optimization-based models.</p>
Full article ">Figure 5
<p>The box plot of the accuracy of the proposed BERSFS-CNN and comparison approaches.</p>
Full article ">Figure 6
<p>The accuracy histogram for the algorithms presented and compared with number of values in the bin center range 0.938–0.968.</p>
Full article ">Figure 7
<p>ROC curve of the proposed BERSFS-CNN algorithm versus the BER-CNN algorithm.</p>
Full article ">Figure 8
<p>ROC curve of the proposed BERSFS-CNN algorithm versus the WOA-CNN algorithm.</p>
Full article ">
14 pages, 4678 KiB  
Article
Identification and Application of a Novel Immune-Related lncRNA Signature on the Prognosis and Immunotherapy for Lung Adenocarcinoma
by Zhimin Zeng, Yuxia Liang, Jia Shi, Lisha Xiao, Lu Tang, Yubiao Guo, Fengjia Chen and Gengpeng Lin
Diagnostics 2022, 12(11), 2891; https://doi.org/10.3390/diagnostics12112891 - 21 Nov 2022
Cited by 5 | Viewed by 1764
Abstract
Background: Long non-coding RNA (lncRNA) participates in the immune regulation of lung cancer. However, limited studies showed the potential roles of immune-related lncRNAs (IRLs) in predicting survival and immunotherapy response of lung adenocarcinoma (LUAD). Methods: Based on The Cancer Genome Atlas (TCGA) and [...] Read more.
Background: Long non-coding RNA (lncRNA) participates in the immune regulation of lung cancer. However, limited studies showed the potential roles of immune-related lncRNAs (IRLs) in predicting survival and immunotherapy response of lung adenocarcinoma (LUAD). Methods: Based on The Cancer Genome Atlas (TCGA) and ImmLnc databases, IRLs were identified through weighted gene coexpression network analysis (WGCNA), Cox regression, and Lasso regression analyses. The predictive ability was validated by Kaplan–Meier (KM) and receiver operating characteristic (ROC) curves in the internal dataset, external dataset, and clinical study. The immunophenoscore (IPS)-PD1/PD-L1 blocker and IPS-CTLA4 blocker data of LUAD were obtained in TCIA to predict the response to immune checkpoint inhibitors (ICIs). The expression levels of immune checkpoint molecules and markers for hyperprogressive disease were analyzed. Results: A six-IRL signature was identified, and patients were stratified into high- and low-risk groups. The low-risk had improved survival outcome (p = 0.006 in the training dataset, p = 0.010 in the testing dataset, p < 0.001 in the entire dataset), a stronger response to ICI (p < 0.001 in response to anti-PD-1/PD-L1, p < 0.001 in response to anti-CTLA4), and higher expression levels of immune checkpoint molecules (p < 0.001 in PD-1, p < 0.001 in PD-L1, p < 0.001 in CTLA4) but expressed more biomarkers of hyperprogression in immunotherapy (p = 0.002 in MDM2, p < 0.001 in MDM4). Conclusion: The six-IRL signature exhibits a promising prediction value of clinical prognosis and ICI efficacy in LUAD. Patients with low risk might gain benefits from ICI, although some have a risk of hyperprogressive disease. Full article
(This article belongs to the Special Issue Clinical Prognostic and Predictive Biomarkers)
Show Figures

Figure 1

Figure 1
<p>Six identified immune-related lncRNAs (IRLs) after weighted gene coexpression network analysis (WGCNA) and regression analyses. (<b>A</b>) Hierarchical clustering tree on IRL’s coexpression network. (<b>B</b>) A heatmap of modules and clinical traits, including age, M stage, N stage, T stage, gender, TNM stage, clinical event, and survival time. The numbers in each box and parenthesis represented correlation coefficient and <span class="html-italic">p</span> value. (<b>C</b>) Eighteen prognosis-related IRLs screened by univariate Cox regression. (<b>D</b>) Coefficients of six prognostic IRLs identified by the Lasso model.</p>
Full article ">Figure 2
<p>Survival prognosis of the risk score model. Kaplan–Meier (KM) survival curves of patients with LUAD in high- and low-risk groups from (<b>A</b>) TCGA training dataset, (<b>B</b>) TCGA testing dataset, (<b>C</b>) TCGA entire dataset, and (<b>D</b>) GSE120622.</p>
Full article ">Figure 3
<p>Stability and independence of the prognostic risk model. Survival times of patients among different (<b>A</b>,<b>B</b>) age, (<b>C</b>,<b>D</b>) gender, and (<b>E</b>,<b>F</b>) TNM stage subgroups. (<b>G</b>) Univariate and (<b>H</b>) multivariate Cox regression analyses on risk score, age, gender, M, N, T, and TNM stages.</p>
Full article ">Figure 4
<p>Nomogram integrating risk score and clinical features. (<b>A</b>) Nomogram for predicting 1-, 3-, and 5-year overall survival rates of patients with LUAD. (<b>B</b>) ROC curves of the risk score, TNM stage, and nomogram. AUC, areas under the ROC curve. FPR, false positive rate. TPR, true positive rate.</p>
Full article ">Figure 5
<p>Immune microenvironment in the whole TCGA–LUAD set. Comparison of (<b>A</b>) 22 immune cell proportion, (<b>B</b>) stromal score, (<b>C</b>) immune score, (<b>D</b>) ESTIMATE score, and (<b>E</b>) tumor purity. Note: **** means <span class="html-italic">p</span> &lt; 0.0001. *** means <span class="html-italic">p</span> &lt;0.001. ** means <span class="html-italic">p</span> &lt; 0.01. * means <span class="html-italic">p</span> &lt; 0.05. - means no significant.</p>
Full article ">Figure 6
<p>Predictive response to immune checkpoint inhibitor (ICI) treatment in patients with LUAD. Relative probabilities of responding to (<b>A</b>) anti-PD-1/PD-L1 and (<b>B</b>) anti-CTLA4 treatments. The mRNA levels of (<b>C</b>) PD-1, (<b>D</b>) PD-L1, and (<b>E</b>) CTLA4.</p>
Full article ">
12 pages, 1576 KiB  
Article
Ultrasound Versus Computed Tomography for Diaphragmatic Thickness and Skeletal Muscle Index during Mechanical Ventilation
by Stefano Gatti, Chiara Abbruzzese, Davide Ippolito, Sophie Lombardi, Andrea De Vito, Davide Gandola, Veronica Meroni, Vittoria Ludovica Sala, Sandro Sironi, Antonio Pesenti, Giuseppe Foti, Emanuele Rezoagli and Giacomo Bellani
Diagnostics 2022, 12(11), 2890; https://doi.org/10.3390/diagnostics12112890 - 21 Nov 2022
Cited by 4 | Viewed by 2097
Abstract
Background: Diaphragmatic alterations occurring during mechanical ventilation (MV) can be monitored using ultrasound (US). The performance of computed tomography (CT) to evaluate diaphragmatic thickness is limited. Further, the association between muscle mass and outcome is increasingly recognized. However, no data are available on [...] Read more.
Background: Diaphragmatic alterations occurring during mechanical ventilation (MV) can be monitored using ultrasound (US). The performance of computed tomography (CT) to evaluate diaphragmatic thickness is limited. Further, the association between muscle mass and outcome is increasingly recognized. However, no data are available on its correlation with diaphragmatic thickness. We aimed to determine correlation and agreement of diaphragmatic thickness between CT and US; and its association with muscle mass and MV parameters. Methods: Prospective observational study. US measurements of the diaphragmatic thickness were collected in patients undergoing MV within 12 h before or after performing a CT scan of the thorax and/or upper abdomen. Data on skeletal muscle index (SMI), baseline, and ventilatory data were recorded and correlated with US and CT measures of diaphragmatic thickness. Agreement was explored between US and CT data. Results: Twenty-nine patients were enrolled and the diaphragm measured by CT resulted overall thicker than US-based measurement of the right hemidiaphragm. The US thickness showed the strongest correlation with the left posterior pillar at CT (r = 0.49, p = 0.008). The duration of the controlled MV was negatively correlated with US thickness (r = −0.45, p = 0.017), the thickness of the right anterior pillar (r = −0.41, p = 0.029), and splenic dome by CT (r = −0.43, p = 0.023). SMI was positively correlated with US diaphragmatic thickness (r = 0.50, p = 0.007) and inversely correlated with the duration of MV before enrollment (r = −0.426, p = 0.027). Conclusions: CT scan of the left posterior pillar can estimate diaphragmatic thickness and is moderately correlated with US measurements. Both techniques show that diaphragm thickness decreases with MV duration. The diaphragmatic thickness by US showed a good correlation with SMI. Full article
(This article belongs to the Special Issue Critical Care Imaging)
Show Figures

Figure 1

Figure 1
<p>Normal appearance of the diaphragm. The computed tomography scan clearly shows the crura in the direct coronal (<b>A</b>) and axial planes (<b>B</b>). The normal appearance of the diaphragm, both in the posterior region (crura) at the liver dome level and the left anterior diaphragm (arrows).</p>
Full article ">Figure 2
<p>The mean diaphragmatic thickness measured using ultrasound (US right hemidiaphragm) and computed tomography (CT, at the level of different areas of the diaphragm). CT scan diaphragmatic thickness at the level of left anterior, right posterior, left posterior pillars, and splenic dome is significantly thicker than US-based thickness. * <span class="html-italic">p</span> &lt; 0.05 (two-tailed) versus US-based thickness.</p>
Full article ">Figure 3
<p>Bland–Altman plot exploring the agreement between the right hemidiaphragm thickness evaluated by US and the mean diaphragmatic thickness assessed by CT scan. Data are expressed in mm. UCL = upper confidence limit; LCL = lower confidence limit. Definition of abbreviation: US = ultrasound; CT scan = computerized tomographic scan.</p>
Full article ">Figure 4
<p>Correlation between days of mechanical ventilation (MV) before imaging and Skeletal Muscle Index (SMI) (<b>A</b>); between SMI and US right diaphragmatic thickness (<b>B</b>); and days of MV before imaging and US right diaphragmatic thickness (<b>C</b>). Definition of abbreviation: SMI = skeletal muscle index; TMA = total muscle area; US = ultrasound.</p>
Full article ">
10 pages, 3205 KiB  
Article
Comparison of Conventional Imaging and 18F-Fluorodeoxyglucose Positron Emission Tomography/Computed Tomography in the Diagnostic Accuracy of Staging in Patients with Intrahepatic Cholangiocarcinoma
by Eiko Nishioka, Masakatsu Tsurusaki, Ryohei Kozuki, Sung-Woon Im, Atsushi Kono, Kazuhiro Kitajima, Takamichi Murakami and Kazunari Ishii
Diagnostics 2022, 12(11), 2889; https://doi.org/10.3390/diagnostics12112889 - 21 Nov 2022
Cited by 7 | Viewed by 1595
Abstract
We aimed to examine the accuracy of tumor staging of intrahepatic cholangiocarcinoma (ICC) by using 18F-fluorodeoxyglucose positron emission tomography/computed tomography (18F-FDG PET-CT). From January 2001 to December 2021, 202 patients underwent PET-CT, CT, and MRI for the initial staging of ICC in two [...] Read more.
We aimed to examine the accuracy of tumor staging of intrahepatic cholangiocarcinoma (ICC) by using 18F-fluorodeoxyglucose positron emission tomography/computed tomography (18F-FDG PET-CT). From January 2001 to December 2021, 202 patients underwent PET-CT, CT, and MRI for the initial staging of ICC in two institutions. Among them, 102 patients had undergone surgical treatment. Ninety patients who had a histopathological diagnosis of ICC were retrospectively reviewed. The sensitivity and specificity of 18F-FDG PET-CT, CT, and magnetic resonance imaging (MRI) in detecting tumors, satellite focus, vascular invasion, and lymph node metastases were analyzed. Ninety patients with histologically diagnosed ICC were included. PET-CT demonstrated no statistically significant advantage over CT and MR in the diagnosis of multiple tumors and macrovascular invasion, and bile duct invasion. The overall sensitivity, specificity, positive predictive value (PPV), negative predictive value (NPV), and accuracy of PET-CT in lymph node metastases were 84%, 86%, 91%, 84%, and 86%, respectively. PET-CT revealed a significantly higher accuracy compared to CT or MRI (86%, 67%, and 76%, p < 0.01, respectively) in the diagnosis of regional lymph node metastases. The accuracy of tumor staging by PET-CT was higher than that by CT/MRI (PET-CT vs. CT vs. MRI: 68/90 vs. 47/90 vs. 51/90, p < 0.05). 18F-FDG PET-CT had sensitivity and specificity values for diagnosing satellite focus and vascular and bile duct invasion similar to those of CT or MRI; however, PET-CT showed higher accuracy in diagnosing regional lymph node metastases. 18F-FDG PET-CT exhibited higher tumor staging accuracy than that of CT/MRI. Thus, 18FDG PET-CT may support tumor staging in ICC. Full article
(This article belongs to the Special Issue The Role of Imaging in Liver Surgery)
Show Figures

Figure 1

Figure 1
<p>MRI (<b>a</b>,<b>b</b>) showed a satellite nodule (white arrow) separated from the main tumor, which was confirmed by histopathology ((<b>f</b>); black arrow) but was not detected on CT (<b>c</b>) or PET-CT (<b>d</b>,<b>e</b>). (<b>a</b>) T2-weighted MR image, (<b>b</b>) Diffusion-weighted MR image (b factor = 800), (<b>c</b>) Contrast-enhanced CT, (<b>d</b>) PET-CT, (<b>e</b>) PET-CT showing main tumor, (<b>f</b>) Gross specimen.</p>
Full article ">Figure 2
<p>Contrast-enhanced CT showed bile duct ((<b>b</b>); arrow) and vascular emboli ((<b>c</b>); arrow), which were not detected on MRI (<b>a</b>) or PET-CT (<b>d</b>,<b>e</b>). (<b>a</b>) T2-weighted MR image, (<b>b</b>) Axial section of contrast-enhanced CT, (<b>c</b>) Coronal section of contrast-enhanced CT (<b>d</b>,<b>e</b>) PET-CT, (<b>f</b>) Gross specimen (vascular emboli; arrow).</p>
Full article ">
23 pages, 6415 KiB  
Article
DeepTumor: Framework for Brain MR Image Classification, Segmentation and Tumor Detection
by Ghazanfar Latif
Diagnostics 2022, 12(11), 2888; https://doi.org/10.3390/diagnostics12112888 - 21 Nov 2022
Cited by 18 | Viewed by 2759
Abstract
The proper segmentation of the brain tumor from the image is important for both patients and medical personnel due to the sensitivity of the human brain. Operation intervention would require doctors to be extremely cautious and precise to target the brain’s required portion. [...] Read more.
The proper segmentation of the brain tumor from the image is important for both patients and medical personnel due to the sensitivity of the human brain. Operation intervention would require doctors to be extremely cautious and precise to target the brain’s required portion. Furthermore, the segmentation process is also important for multi-class tumor classification. This work primarily concentrated on making a contribution in three main areas of brain MR Image processing for classification and segmentation which are: Brain MR image classification, tumor region segmentation and tumor classification. A framework named DeepTumor is presented for the multistage-multiclass Glioma Tumor classification into four classes; Edema, Necrosis, Enhancing and Non-enhancing. For the brain MR image binary classification (Tumorous and Non-tumorous), two deep Convolutional Neural Network) CNN models were proposed for brain MR image classification; 9-layer model with a total of 217,954 trainable parameters and an improved 10-layer model with a total of 80,243 trainable parameters. In the second stage, an enhanced Fuzzy C-means (FCM) based technique is proposed for the tumor segmentation in brain MR images. In the final stage, an enhanced CNN model 3 with 11 hidden layers and a total of 241,624 trainable parameters was proposed for the classification of the segmented tumor region into four Glioma Tumor classes. The experiments are performed using the BraTS MRI dataset. The experimental results of the proposed CNN models for binary classification and multiclass tumor classification are compared with the existing CNN models such as LeNet, AlexNet and GoogleNet as well as with the latest literature. Full article
(This article belongs to the Special Issue AI as a Tool to Improve Hybrid Imaging in Cancer—2nd Edition)
Show Figures

Figure 1

Figure 1
<p>Brain imaging using different modalities: (<b>a</b>) CT, (<b>b</b>) PET, (<b>c</b>) MRI.</p>
Full article ">Figure 2
<p>MR image capturing process from MRI Scanner.</p>
Full article ">Figure 3
<p>Pictorial view of brain MR Image modalities.</p>
Full article ">Figure 4
<p>Brain MRI Tissues Types.</p>
Full article ">Figure 5
<p>Workflow diagram of the proposed methodology (Green highlighted sections represent contributions in this work).</p>
Full article ">Figure 6
<p>Sample MR images of T1, T2, T1c and Flair modalities.</p>
Full article ">Figure 7
<p>Sample of Multiclass Glioma labels with different modalities. The image label shows: (<b>A</b>). Whole tumor, (<b>B</b>). Tumor core, (<b>C</b>). Enhancing Tumor and (<b>D</b>). Combined all tumor types [<a href="#B22-diagnostics-12-02888" class="html-bibr">22</a>].</p>
Full article ">Figure 8
<p>Typical CNN Architecture MR Image Classification.</p>
Full article ">Figure 9
<p>Proposed Algorithm 1 for tumor segmentation using Neighboring FCM.</p>
Full article ">Figure 10
<p>Visual comparison of the original image and intensity enhanced image.</p>
Full article ">Figure 11
<p>Black and White (BW) binary image generated based on the neighboring FCM threshold applied to intensity enhanced image.</p>
Full article ">Figure 12
<p>Visual results after removing the small regions from the binary image and applying the morphological operations.</p>
Full article ">Figure 13
<p>Object shape roundness calculation and generating the initial tumor segment.</p>
Full article ">Figure 14
<p>Enhancement in the initial brain tumor segment by applying region growing method and visual comparison with the actual tumor segment.</p>
Full article ">Figure 15
<p>Visual Comparison of the Standard FCM based tumor segment with the Neighboring FCM based tumor segment and the actual tumor segment.</p>
Full article ">
4 pages, 1026 KiB  
Interesting Images
Microduplication 3p26.3p24.3 and 4q34.3q35.2 Microdeletion Identified in a Patient with Developmental Delay Associated with Brain Malformation
by Georgeta Cardos, Nicolae Gica, Corina Gica, Anca Maria Panaitescu, Mariana Predescu, Gheorghe Peltecu and Florina Mihaela Nedelea
Diagnostics 2022, 12(11), 2887; https://doi.org/10.3390/diagnostics12112887 - 21 Nov 2022
Viewed by 1700
Abstract
Microdeletions and microduplications are involved in many of prenatal and postnatal cases of multiple congenital malformations (MCM), developmental delay/intellectual disability (DD/ID), and autism spectrum disorders (ASD). Molecular karyotyping analysis (MCA), performed by DNA microarray technology, is a valuable method used to elucidate the [...] Read more.
Microdeletions and microduplications are involved in many of prenatal and postnatal cases of multiple congenital malformations (MCM), developmental delay/intellectual disability (DD/ID), and autism spectrum disorders (ASD). Molecular karyotyping analysis (MCA), performed by DNA microarray technology, is a valuable method used to elucidate the ethology of these clinical expressions, essentially contributing to the diagnosis of rare genetic diseases produced by DNA copy number variations (CNVs). MCA is frequently used as the first-tier cytogenetic diagnostic test for patients with MCM, DD/ID, or ASD due to its much higher resolution (≥10×) for detecting microdeletions and microduplications than classic cytogenetic analysis by G-banded karyotyping. Therefore, MCA can detect about 10% pathogenic genomic imbalances more than G-banded karyotyping alone. In addition, MCA using the Single Nucleotide Polymorphism-array (SNP-array) method also allows highlighting the regions of loss of heterozygosity and uniparental disomy, which are the basis of some genetic syndromes. We presented a case of a five-year-old patient, with global development delay, bilateral fronto-parietal lysencephaly, and pachygyria, for which MCA through SNP-Array led to the detection of the genetic changes, such as 3p26.3p24.3 microduplication and 4q34.3q35.2 microdeletion, which were the basis of the patient’s phenotype and to the precise establishment of the diagnosis. Full article
(This article belongs to the Section Medical Imaging and Theranostics)
Show Figures

Figure 1

Figure 1
<p>Pathogenic duplication of 22.5 Mb in 3p26.3p24.3 region detected by SNP-Array (green lines in “(<b>A</b>,<b>B</b>)” in a five-year-old patient, with delay of psycho-motor development, bilateral fronto-parietal lysencephaly, and pachygyria. SNP-Array methodology: the DNA sample isolated from peripheral blood was analyzed with the HumanCytoSNP-12 v2.1 Analysis BeadChip Kit (Illumina). The scanning was performed with the NextSeq550 equipment and the software related to the equipment (Illumina). Data analysis was performed with BlueFuse Multi 4.5 Software (32178) (Illumina), using the databases: UCSC Genome Browser, DECIPHER, OMIM, ISCA, DGV, ClinGen and ClinVar. The patient is a female child of healthy non-consanguineous parents. There is no family history of developmental delay. Molecular karyotype formula (according to ISCN 2016): arr[GRCh37]3p26.3p24.3(316417-22827129)x3,4q34.3q35.2(182338549-190880409)x1; “(<b>C</b>)”Schematic representation of genes localized in the duplicated region 3p26.3p24.3, located in the red rectangle on the schematized chromosome 3 (from UCSC browser). Each rectangle represents an OMIM gene, those colored in green are genes with known involvement in pathogenesis. The 22.5 Mb duplication detected in the 3p26.3p24.3 region contains 80 OMIM genes, many of them being candidate or associated with pathogenesis, such as the <span class="html-italic">SETD5</span> gene (OMIM 615743, associated with intellectual disability, autosomal dominant AD 23, OMIM 615761), <span class="html-italic">CRBN</span> gene (OMIM 609262, associated with intellectual disability, autosomal recessive, AR, 2, OMIM 607417), <span class="html-italic">CCDC174</span> gene (OMIM 616735, associated with Hypotonia, infantile syndrome, with psychomotor inhibition, autosomal recessive AR, OMIM 616816), <span class="html-italic">BRPF1</span> gene (OMIM 602410, associated with Intellectual developmental disorder syndrome with dysmorphic facies and ptosis, AD, OMIM 61733), <span class="html-italic">CHL1</span> and <span class="html-italic">CNTN6</span>, those being ASD candidate genes, playing an important role in language and cognitive development [<a href="#B1-diagnostics-12-02887" class="html-bibr">1</a>,<a href="#B2-diagnostics-12-02887" class="html-bibr">2</a>]. More other microduplications of comparable size, with (likely) pathogenic significance, were reported in clinical databases, such as ClinVar (Variation ID: 155700, 148876, 57977) and Decipher (ID patients: 400840, 292119) in case of patients with intelectual disability, MCM (such as: tetralogy of Fallot, abnormality of the genitourinary, digestive, and/or musculoscheletal system). Additionally, 3q26 microduplication syndrome is described in Orphanet database as a syndromic form associated with prenatal and postnatal growth inhibition, developmental delay, intellectual impairment, dysmorphic signs, and variable combination of congenital anomalies, including cardiovascular, genitourinary, and skeletal anomalies and spectrum of caudal malformations (ORPHA:96095).</p>
Full article ">Figure 2
<p>Deletion of 8.5 Mb (in chromosomal regions marked with red lines), with pathogenic significance, detected in the 4q34.3q35.2 region, containing 21 OMIM genes. The deletions comprising the 4q31q35 region have been known and reported in clinical databases and scientific literature as being responsible for phenotypic manifestations corresponding to the 4q terminal deletion syndrome (or distal monosomy 4q), including craniofacial anomalies, dysmorphic features, intellectual disabilities, developmental delay, ocular, cardiac, genitourinary malformations, and pelvic/limb dysmorphism (ORPHA:96145) [<a href="#B4-diagnostics-12-02887" class="html-bibr">4</a>,<a href="#B5-diagnostics-12-02887" class="html-bibr">5</a>]. Based on all this evidence, both 3p26.3p24.3 duplication and 4q34.3q35.2 deletion detected in the patient’s sample were classified as pathogenic CNVs [<a href="#B4-diagnostics-12-02887" class="html-bibr">4</a>], and contributed to the patient’s phenotypic expression; their simultaneous presence in the case of a single patient has not been reported until now, to our knowledge. The two detected genomic changes could be associated with an unbalanced translocation with a possible parental origin.</p>
Full article ">
14 pages, 10355 KiB  
Article
Classification of Blood Pressure Levels Based on Photoplethysmogram and Electrocardiogram Signals with a Concatenated Convolutional Neural Network
by Yunendah Nur Fuadah and Ki Moo Lim
Diagnostics 2022, 12(11), 2886; https://doi.org/10.3390/diagnostics12112886 - 21 Nov 2022
Cited by 4 | Viewed by 2402
Abstract
Hypertension is a severe public health issue worldwide that significantly increases the risk of cardiac vascular disease, stroke, brain hemorrhage, and renal dysfunction. Early screening of blood pressure (BP) levels is essential to prevent the dangerous complication associated with hypertension as the leading [...] Read more.
Hypertension is a severe public health issue worldwide that significantly increases the risk of cardiac vascular disease, stroke, brain hemorrhage, and renal dysfunction. Early screening of blood pressure (BP) levels is essential to prevent the dangerous complication associated with hypertension as the leading cause of death. Recent studies have focused on employing photoplethysmograms (PPG) with machine learning to classify BP levels. However, several studies claimed that electrocardiograms (ECG) also strongly correlate with blood pressure. Therefore, we proposed a concatenated convolutional neural network which integrated the features extracted from PPG and ECG signals. This study used the MIMIC III dataset, which provided PPG, ECG, and arterial blood pressure (ABP) signals. A total of 14,298 signal segments were obtained from 221 patients, which were divided into 9150 signals of train data, 2288 signals of validation data, and 2860 signals of test data. In the training process, five-fold cross-validation was applied to select the best model with the highest classification performance. The proposed concatenated CNN architecture using PPG and ECG obtained the highest test accuracy of 94.56–95.15% with a 95% confidence interval in classifying BP levels into hypotension, normotension, prehypertension, hypertension stage 1, and hypertension stage 2. The result shows that the proposed method is a promising solution to categorize BP levels effectively, assisting medical personnel in making a clinical diagnosis. Full article
(This article belongs to the Section Machine Learning and Artificial Intelligence in Diagnostics)
Show Figures

Figure 1

Figure 1
<p>(<b>a</b>) The proposed preprocessing steps. (<b>b</b>) Preprocessing results.</p>
Full article ">Figure 2
<p>The proposed concatenated 1D CNN architecture.</p>
Full article ">Figure 3
<p>The performance results of test data. (<b>a</b>) Confusion matrix. (<b>b</b>) AUC score.</p>
Full article ">
9 pages, 543 KiB  
Article
From Death Triad to Death Tetrad—The Addition of a Hypotension Component to the Death Triad Improves Mortality Risk Stratification in Trauma Patients: A Retrospective Cohort Study
by Wei-Juo Tzeng, Hsiang-Yu Tseng, Teng-Yuan Hou, Sheng-En Chou, Wei-Ti Su, Shiun-Yuan Hsu and Ching-Hua Hsieh
Diagnostics 2022, 12(11), 2885; https://doi.org/10.3390/diagnostics12112885 - 21 Nov 2022
Cited by 2 | Viewed by 4839
Abstract
The death triad, including coagulopathy, hypothermia, and acidosis, is shown to be a strong predictor of mortality in trauma patients. We aimed to investigate whether the inclusion of hypotension, defined as systolic blood pressure (SBP) < 60 mmHg, as a fourth factor in [...] Read more.
The death triad, including coagulopathy, hypothermia, and acidosis, is shown to be a strong predictor of mortality in trauma patients. We aimed to investigate whether the inclusion of hypotension, defined as systolic blood pressure (SBP) < 60 mmHg, as a fourth factor in the death triad would comprise a death tetrad to help stratify mortality risk in trauma patients. A total of 3361 adult trauma patients between 1 January 2009 and 31 December 2019 were allocated into groups to investigate whether hypotension matters in determining the mortality outcome of trauma patients who possess 1–3 death triad components compared to those without any component. Hypotension was added to the death tetrad, and the adjusted mortality outcome was compared among groups with 0–4 death tetrad components. Herein, we showed that SBP < 60 mmHg could be used to identify patients at risk of mortality among patients with one or two death triad components. Patients with one, two, and three death tetrad components had respective adjusted mortality rates of 3.69-, 10.10-, and 40.18-fold, determined by sex, age, and comorbidities. The mortality rate of trauma patients with all the four death tetrad components was 100%. The study suggested that hypotension, defined as an SBP < 60 mmHg, may act as a proper death tetrad component to stratify the mortality risk of trauma patients. Full article
(This article belongs to the Section Pathology and Molecular Diagnostics)
Show Figures

Figure 1

Figure 1
<p>Flowchart illustrating the included hospitalized adult trauma patients from the registered trauma database, and the assignment of the study patient populations into three or four groups according to the number fit in the components of death triad or tetrad, respectively. In comparison with the death triad, the death tetrad has an additional component, hypotension, defined as systolic blood pressure &lt; 60 mmHg. PH, potential of hydrogen; INR, international normalized ratio.</p>
Full article ">
11 pages, 1556 KiB  
Review
Patient Self-Performed Point-of-Care Ultrasound: Using Communication Technologies to Empower Patient Self-Care
by Andrew W. Kirkpatrick, Jessica L. McKee, Kyle Couperus and Christopher J. Colombo
Diagnostics 2022, 12(11), 2884; https://doi.org/10.3390/diagnostics12112884 - 21 Nov 2022
Cited by 5 | Viewed by 2168
Abstract
Point-of-Care ultrasound (POCUS) is an invaluable tool permitting the understanding of critical physiologic and anatomic details wherever and whenever a patient has a medical need. Thus the application of POCUS has dramatically expanded beyond hospitals to become a portable user-friendly technology in a [...] Read more.
Point-of-Care ultrasound (POCUS) is an invaluable tool permitting the understanding of critical physiologic and anatomic details wherever and whenever a patient has a medical need. Thus the application of POCUS has dramatically expanded beyond hospitals to become a portable user-friendly technology in a variety of prehospital settings. Traditional thinking holds that a trained user is required to obtain images, greatly handicapping the scale of potential improvements in individual health assessments. However, as the interpretation of ultrasound images can be accomplished remotely by experts, the paradigm wherein experts guide novices to obtain meaningful images that facilitate remote care is being embraced worldwide. The ultimate extension of this concept is for experts to guide patients to image themselves, enabling secondary disease prevention, home-focused care, and self-empowerment of the individual to manage their own health. This paradigm of remotely telementored self-performed ultrasound (RTMSPUS) was first described for supporting health care on the International Space Station. The TeleMentored Ultrasound Supported Medical Interventions (TMUSMI) Research Group has been investigating the utility of this paradigm for terrestrial use. The technique has particular attractiveness in enabling surveillance of lung health during pandemic scenarios. However, the paradigm has tremendous potential to empower and support nearly any medical question poised in a conscious individual with internet connectivity able to follow the directions of a remote expert. Further studies and development are recommended in all areas of acute and chronic health care. Full article
(This article belongs to the Special Issue Lung Ultrasound: A Leading Diagnostic Tool)
Show Figures

Figure 1

Figure 1
<p>Example of Ultrasound Naïve Volunteer being guided to image their own chest. Figure Legend: Screenshot of the Mentors computer in Calgary viewing the completely novice self-isolating volunteer image their upper right anterior lung field depicting the visceral and parietal pleural interface with movement emphasized with Color Power-Doppler the “Power-Slide” Sign (seen in <a href="#app1-diagnostics-12-02884" class="html-app">Supplementary Materials</a>). Note: Lung ultrasound is a dynamic science much better appreciated with real time imaging. The videorecording of the entire mentored Lung examination ca be viewed in <a href="#app1-diagnostics-12-02884" class="html-app">Supplementary File S1</a>.</p>
Full article ">Figure 2
<p>Example of the “Spleen Point” Sign confirming imaging of the Lung Base. Legend: When the ultrasound probe is correctly positioned at the bung base, the image will review the visceral-parietal interface (left) alternating with the parenchyma of the spleen on the left or liver on the right with no probe movement due to the respiratory movement of the diaphragm. Note: Lung ultrasound is a dynamic science much better appreciated with real time imaging. The videorecording of the entire mentored Lung examination ca be viewed in <a href="#app1-diagnostics-12-02884" class="html-app">Supplementary File S2</a>.</p>
Full article ">Figure 3
<p>(<b>a</b>) Sanitized Home Ultrasound Delivery Package. Legendz: Sanitized package for home-delivery to patients containing a Philips Lumify Ultrasound probe and dedicated smart phone to support the ultrasound, gloves, masks, and ultrasound jelly. (<b>b</b>) Sanitized Home Ultrasound Delivery Package. Figure Legend: Sanitized package ready for home-delivery to self-isolating patients.</p>
Full article ">
9 pages, 1131 KiB  
Article
Comparative Analysis of In-House RT-qPCR Detection of SARS-CoV-2 for Resource-Constrained Settings
by Yesit Bello-Lemus, Marco Anaya-Romero, Janni Gómez-Montoya, Moisés Árquez, Henry J. González-Torres, Elkin Navarro-Quiroz, Leonardo Pacheco-Londoño, Lisandro Pacheco-Lugo and Antonio J. Acosta-Hoyos
Diagnostics 2022, 12(11), 2883; https://doi.org/10.3390/diagnostics12112883 - 21 Nov 2022
Cited by 3 | Viewed by 2886
Abstract
We developed and standardized an efficient and cost-effective in-house RT-PCR method to detect severe acute respiratory syndrome coronavirus 2 (SARS-CoV-2). We evaluated sensitivity, specificity, and other statistical parameters by different RT-qPCR methods including triplex, duplex, and simplex assays adapted from the initial World [...] Read more.
We developed and standardized an efficient and cost-effective in-house RT-PCR method to detect severe acute respiratory syndrome coronavirus 2 (SARS-CoV-2). We evaluated sensitivity, specificity, and other statistical parameters by different RT-qPCR methods including triplex, duplex, and simplex assays adapted from the initial World Health Organization- (WHO) recommended protocol. This protocol included the identification of the E envelope gene (E gene; specific to the Sarvecovirus genus), RdRp gene of the RNA-dependent RNA polymerase (specific for SARS-CoV-2), and RNase P gene as endogenous control. The detection limit of the E and the RdRp genes were 3.8 copies and 33.8 copies per 1 µL of RNA, respectively, in both triplex and duplex reactions. The sensitivity for the RdRp gene in the triplex and duplex RT-qPCR tests were 98.3% and 83.1%, respectively. We showed a decrease in sensitivity for the RdRp gene by 60% when the E gene acquired Ct values > 31 in the diagnostic tests. This is associated with the specific detection limit of each gene and possible interferences in the protocol. Hence, developing efficient and cost-effective methodologies that can be adapted to various health emergency scenarios is important, especially in developing countries or settings where resources are limited. Full article
Show Figures

Figure 1

Figure 1
<p>Amplification curves of RT-qPCR for the different assays. (<b>A</b>) E marker in triplex RT-qPCR, (<b>B</b>) RdRp marker in triplex RT-qPCR, (<b>C</b>) RdRp marker in duplex RT-qPCR, and (<b>D</b>) E marker in duplex RT-qPCR, all for different dilutions of viral RNA from a SARS-CoV-2 positive sample.</p>
Full article ">Figure 2
<p>Limit of detection of RdRp and E genes in (<b>A</b>) duplex RT-PCR or (<b>B</b>) triplex RT-PCR. The E gene shows more sensitivity than the RdRp gene, both in the duplex and triplex assays. Average Ct values and SD from triplicate reactions are shown.</p>
Full article ">Figure 3
<p>Whisker plot showing the distribution of the median and quartile values distributed between the triplex and duplex RT-qPCR treatments in the detection of the E and RdRp genes. * <span class="html-italic">p</span> &lt; 0.05 between the Ct of both genes.</p>
Full article ">
16 pages, 4654 KiB  
Article
The Analysis of Relevant Gene Networks Based on Driver Genes in Breast Cancer
by Luxuan Qu, Zhiqiong Wang, Hao Zhang, Zhongyang Wang, Caigang Liu, Wei Qian and Junchang Xin
Diagnostics 2022, 12(11), 2882; https://doi.org/10.3390/diagnostics12112882 - 21 Nov 2022
Cited by 2 | Viewed by 1637
Abstract
Background: The occurrence and development of breast cancer has a strong correlation with a person’s genetics. Therefore, it is important to analyze the genetic factors of breast cancer for future development of potential targeted therapies from the genetic level. Methods: In this study, [...] Read more.
Background: The occurrence and development of breast cancer has a strong correlation with a person’s genetics. Therefore, it is important to analyze the genetic factors of breast cancer for future development of potential targeted therapies from the genetic level. Methods: In this study, we complete an analysis of the relevant protein–protein interaction network relating to breast cancer. This includes three steps, which are breast cancer-relevant genes selection using mutual information method, protein–protein interaction network reconstruction based on the STRING database, and vital genes calculating by nodes centrality analysis. Results: The 230 breast cancer-relevant genes were chosen in gene selection to reconstruct the protein–protein interaction network and some vital genes were calculated by node centrality analyses. Node centrality analyses conducted with the top 10 and top 20 values of each metric found 19 and 39 statistically vital genes, respectively. In order to prove the biological significance of these vital genes, we carried out the survival analysis and DNA methylation analysis, inquired about the prognosis in other cancer tissues and the RNA expression level in breast cancer. The results all proved the validity of the selected genes. Conclusions: These genes could provide a valuable reference in clinical treatment among breast cancer patients. Full article
(This article belongs to the Special Issue Breast Cancer Biomarkers)
Show Figures

Figure 1

Figure 1
<p>The process of the method. The three steps of the process are breast cancer gene selection, protein–protein interaction network modeling, and network analysis.</p>
Full article ">Figure 2
<p>The results of gene selection step. (<b>a</b>) Mutual information values. The calculated values of all other remaining genes and driver genes, which, in function <span class="html-italic">y</span>, is the fitting curve equation, and R<math display="inline"><semantics> <msup> <mrow/> <mn>2</mn> </msup> </semantics></math> is the coefficient of determination, meaning the higher the fitting degree, the closer to 1. (<b>b</b>) Threshold. All values are derived based on the obtained fitting curve function <span class="html-italic">y</span> in (<b>a</b>) and sorted according to the resulting values.</p>
Full article ">Figure 3
<p>The protein–protein interaction network of breast cancer-relevant genes. Node represents gene, and edge represents the interaction between two genes.</p>
Full article ">Figure 4
<p>Node centrality analysis of 230 genes. The abscissa is a gene, which is represented by a number, and the ordinate is the result value of a gene calculated by the corresponding node centrality metric. (<b>a</b>) Degree centrality; (<b>b</b>) Closeness centrality; (<b>c</b>) Betweenness centrality; (<b>d</b>) Eigenvector centrality.</p>
Full article ">Figure 5
<p>The gene survival curves of the top 10 genes. The blue line indicates that the expression value is higher than the median, and the red line indicates that the expression value is lower than the median. P-value is the result of log-rank test (<span class="html-italic">p</span> &lt; 0.05 means the result has the significant). (<b>a</b>) CDK1; (<b>b</b>) CCNB1; (<b>c</b>) BUB1; (<b>d</b>) BUB1B; (<b>e</b>) KIF20A.</p>
Full article ">Figure 6
<p>The remaining 7 genes’ survival curves of the top 20 genes. (<b>a</b>) KIF23; (<b>b</b>) CCNB2; (<b>c</b>) KIF4A; (<b>d</b>) MELK; (<b>e</b>) RAD51; (<b>f</b>) HRAS; (<b>g</b>) CEP55.</p>
Full article ">Figure 7
<p>Heatmap of DNA methylation expression levels of top 10 genes in breast cancer using the MethSurv platform. Methylation levels (1 = fully methylated; 0 = fully unmethylated) are shown as a continuous variable from a blue to red color. Rows correspond to the CpGs, and the columns correspond to the patients. (<b>a</b>) CCNA2; (<b>b</b>) CCNB1; (<b>c</b>) TP53; (<b>d</b>) BRCA1; (<b>e</b>) TOP2A; (<b>f</b>) CCND1; (<b>g</b>) AKT1; (<b>h</b>) CREBBP; (<b>i</b>) SMAD4; (<b>j</b>) ESR1; (<b>k</b>) CENPE.</p>
Full article ">
17 pages, 1209 KiB  
Article
A Study of the Metabolic Pathways Affected by Gestational Diabetes Mellitus: Comparison with Type 2 Diabetes
by Loukia Spanou, Aikaterini Dimou, Christina E. Kostara, Eleni Bairaktari, Eleni Anastasiou and Vasilis Tsimihodimos
Diagnostics 2022, 12(11), 2881; https://doi.org/10.3390/diagnostics12112881 - 21 Nov 2022
Cited by 4 | Viewed by 2489
Abstract
Background: Gestational diabetes mellitus (GDM) remains incompletely understood and increases the risk of developing Diabetes mellitus type 2 (DM2). Metabolomics provides insights etiology and pathogenesis of disease and discovery biomarkers for accurate detection. Nuclear magnetic resonance (NMR) spectroscopy is a key platform defining [...] Read more.
Background: Gestational diabetes mellitus (GDM) remains incompletely understood and increases the risk of developing Diabetes mellitus type 2 (DM2). Metabolomics provides insights etiology and pathogenesis of disease and discovery biomarkers for accurate detection. Nuclear magnetic resonance (NMR) spectroscopy is a key platform defining metabolic signatures in intact serum/plasma. In the present study, we used NMR-based analysis of macromolecules free-serum to accurately characterize the altered metabolic pathways of GDM and assessing their similarities to DM2. Our findings could contribute to the understanding of the pathophysiology of GDM and help in the identification of metabolomic markers of the disease. Methods: Sixty-two women with GDM matched with seventy-seven women without GDM (control group). 1H NMR serum spectra were acquired on an 11.7 T Bruker Avance DRX NMR spectrometer. Results: We identified 55 metabolites in both groups, 25 of which were significantly altered in the GDM group. GDM group showed elevated levels of ketone bodies, 2-hydroxybutyrate and of some metabolic intermediates of branched-chain amino acids (BCAAs) and significantly lower levels of metabolites of one-carbon metabolism, energy production, purine metabolism, certain amino acids, 3-methyl-2-oxovalerate, ornithine, 2-aminobutyrate, taurine and trimethylamine N-oxide. Conclusion: Metabolic pathways affected in GDM were beta-oxidation, ketone bodies metabolism, one-carbon metabolism, arginine and ornithine metabolism likewise in DM2, whereas BCAAs catabolism and aromatic amino acids metabolism were affected, but otherwise than in DM2. Full article
(This article belongs to the Special Issue Recent Advances in the Diagnosis of Metabolic Disorders)
Show Figures

Figure 1

Figure 1
<p>The PLS-DA multivariate analysis obtained for the 62 women with GDM and 77 healthy pregnant women: (<b>a</b>) Scores plot; (<b>b</b>) cross validation; (<b>c</b>) permutation test and; (<b>d</b>) the top 20 most discriminating metabolite GDM cases from control ranked by variable importance in projection (VIP) scores of PLS-DA model. VIP scores ≥ 1 were considered significant.</p>
Full article ">Figure 2
<p>Affected metabolic pathways in GDM (pyruvate metabolism, beta-oxidation, ketone bodies metabolism).</p>
Full article ">Figure 3
<p>Choline, threonine and one-carbon metabolism; 5,10-meTHF:5,10-Methylenetetrahydrofolate.</p>
Full article ">
12 pages, 1119 KiB  
Review
The Role of Cytokinome in the HNSCC Tumor Microenvironment: A Narrative Review and Our Experience
by Nerina Denaro, Cinzia Solinas, Ornella Garrone, Carolina Cauchi, Fiorella Ruatta, Demi Wekking, Andrea Abbona, Matteo Paccagnella, Marco Carlo Merlano and Cristiana Lo Nigro
Diagnostics 2022, 12(11), 2880; https://doi.org/10.3390/diagnostics12112880 - 21 Nov 2022
Cited by 3 | Viewed by 2123
Abstract
Head and neck squamous cell carcinoma (HNSCC) is the sixth most common cancer. In locally advanced (LA) HNSCC, a multidisciplinary approach consisting of surgery followed by chemoradiation (CRT) or definitive CRT is the mainstay of treatment. In recurrent metastatic (R/M), HNSCC immune checkpoint [...] Read more.
Head and neck squamous cell carcinoma (HNSCC) is the sixth most common cancer. In locally advanced (LA) HNSCC, a multidisciplinary approach consisting of surgery followed by chemoradiation (CRT) or definitive CRT is the mainstay of treatment. In recurrent metastatic (R/M), HNSCC immune checkpoint inhibitors (ICIs) with or without chemotherapy represent the new first-line option. However, cancer will recur in about two out of five patients with LA HNSCC. If progression occurs within six months from platin-radiotherapy treatment, anti-programmed cell death-1 (PD-1) may be prescribed. Otherwise, immunotherapy with or without chemotherapy might be considered if PD-L1 is expressed. Despite several improvements in the outcome of patients with R/M HNSCC, overall survival (OS) remains dismal, equaling a median of 14 months. In-depth knowledge of the tumor microenvironment (TME) would be required to change the course of this complex disease. In recent years, many predictive and prognostic biomarkers have been studied in the HNSCC TME, but none of them alone can select the best candidates for response to ICIs or targeted therapy (e.g., Cetuximab). The presence of cytokines indicates an immune response that might occur, among other things, after tumor antigen recognition, viral and bacterial infection, and physic damage. An immune response against HNSCC results in the production of some cytokines that induce a pro-inflammatory response and attract cells, such as neutrophils, macrophages, and T cell effectors, to enhance the innate and adaptive anti-tumor response. We revised the role of a group of cytokines as biomarkers for treatment response in HNSCC. Full article
(This article belongs to the Special Issue Head and Neck Cancers: Diagnosis and Management)
Show Figures

Figure 1

Figure 1
<p>Most relevant cytokines in HNSCC. Th1 produces IL-2 and IFN-γ and recruits macrophages; Th2 produces IL-4, IL-5, and IL-13 and recruits eosinophils and basophils; Th17 produces IL-17, IL-21, and IL-22 and recruits neutrophils; cytotoxic T cells produce IFN-γ and perforins and recruits NK cells; macrophages produce TNF, IFNa/b, IL-6, and IL-1b and recruits Tregs and MDSCs; neutrophils produce MMPs, ROS, peroxidase, IL-1, IFNg and TNF and recruits Tregs and MDSCs.</p>
Full article ">Figure 2
<p>PFS and OS in pts with baseline cytokines levels lower or higher than cut-off point. Cut-off points for each cytokine were calculated using ROC analysis. OS and PFS were expressed in months.</p>
Full article ">Figure 3
<p>Cluster analysis. (<b>A</b>) Tridimensional PCA plot [pts with PFS &lt;= median (red); pts with PFS &gt; median (green)]. (<b>B</b>) Tridimensional PCA plot [pts with OS &lt;= median (red); pts with OS &gt; median (green)]. (<b>C</b>) Factor map of K-means cluster and (<b>D</b>) HCPC 3D dendrogram showing the 4 clusters of pts (cluster 1: black; cluster 2: red; cluster 3: green; cluster 4: blue).</p>
Full article ">
26 pages, 4345 KiB  
Article
Application of Machine Learning in Epileptic Seizure Detection
by Ly V. Tran, Hieu M. Tran, Tuan M. Le, Tri T. M. Huynh, Hung T. Tran and Son V. T. Dao
Diagnostics 2022, 12(11), 2879; https://doi.org/10.3390/diagnostics12112879 - 21 Nov 2022
Cited by 19 | Viewed by 3335
Abstract
Epileptic seizure is a neurological condition caused by short and unexpectedly occurring electrical disruptions in the brain. It is estimated that roughly 60 million individuals worldwide have had an epileptic seizure. Experiencing an epileptic seizure can have serious consequences for the patient. Automatic [...] Read more.
Epileptic seizure is a neurological condition caused by short and unexpectedly occurring electrical disruptions in the brain. It is estimated that roughly 60 million individuals worldwide have had an epileptic seizure. Experiencing an epileptic seizure can have serious consequences for the patient. Automatic seizure detection on electroencephalogram (EEG) recordings is essential due to the irregular and unpredictable nature of seizures. By thoroughly analyzing EEG records, neurophysiologists can discover important information and patterns, and proper and timely treatments can be provided for the patients. This research presents a novel machine learning-based approach for detecting epileptic seizures in EEG signals. A public EEG dataset from the University of Bonn was used to validate the approach. Meaningful statistical features were extracted from the original data using discrete wavelet transform analysis, then the relevant features were selected using feature selection based on the binary particle swarm optimizer. This facilitated the reduction of 75% data dimensionality and 47% computational time, which eventually sped up the classification process. After having been selected, relevant features were used to train different machine learning models, then hyperparameter optimization was utilized to further enhance the models’ performance. The results achieved up to 98.4% accuracy and showed that the proposed method was very effective and practical in detecting seizure presence in EEG signals. In clinical applications, this method could help relieve the suffering of epilepsy patients and alleviate the workload of neurologists. Full article
(This article belongs to the Special Issue Advances in the Diagnosis of Nervous System Diseases)
Show Figures

Figure 1

Figure 1
<p>Feature selection flowchart.</p>
Full article ">Figure 2
<p>Grid search and random search comparison.</p>
Full article ">Figure 3
<p>Flowchart of the proposed approach.</p>
Full article ">Figure 4
<p>Visualization of EEG signals from Sets (<b>A</b>–<b>E</b>).</p>
Full article ">Figure 5
<p>Visualization of ‘non-seizure’ and ‘seizure’ EEG signal.</p>
Full article ">Figure 6
<p>Table view of the first 400 segments.</p>
Full article ">Figure 7
<p>Table view of the last 400 segments.</p>
Full article ">Figure 8
<p>Visualization of D3, D4, D5, and A5 coefficients.</p>
Full article ">Figure 9
<p>Visualization of D3, D4, D5, and A5 coefficients.</p>
Full article ">Figure 10
<p>Correlation heat map of feature subset.</p>
Full article ">Figure 11
<p>Results heatmap of all classifiers.</p>
Full article ">Figure 12
<p>Confusion matrices of all classifiers.</p>
Full article ">Figure 13
<p>Results comparison of all classifiers.</p>
Full article ">Figure 14
<p>ROC curve of all classifiers.</p>
Full article ">Figure 15
<p>Score difference between the proposed model and baseline results.</p>
Full article ">Figure 16
<p>The standard deviation of classifiers over 10 trials.</p>
Full article ">
8 pages, 2066 KiB  
Case Report
Hyaline Vascular Type of Unicentric Castleman Disease in a Kidney with End-Stage Renal Disease: A Case Report of a Rare Entity at an Unusual Location and a Special Clinical Setting
by Chuan-Han Chen and Hsin-Ni Li
Diagnostics 2022, 12(11), 2878; https://doi.org/10.3390/diagnostics12112878 - 21 Nov 2022
Cited by 2 | Viewed by 1759
Abstract
Castleman disease (CD) is an unusual heterogeneous lymphoproliferative disorder that has been classified based on either clinical presentation and disease course or histologic features. Clinically, CD is divided into a unicentric CD (UCD) type and multicentric CD (MCD) type according to the extent [...] Read more.
Castleman disease (CD) is an unusual heterogeneous lymphoproliferative disorder that has been classified based on either clinical presentation and disease course or histologic features. Clinically, CD is divided into a unicentric CD (UCD) type and multicentric CD (MCD) type according to the extent of lymph node region involvement and the absence or presence of systemic symptoms. Histologically, it can be categorized into hyaline vascular (HV) type, plasma cell (PC) type and mixed type. The majority of HV-type CD involves a solitary lymph node, and excision surgery is often curative. On the contrary, MCD is a progressive and often fatal disease with lymphadenopathy in multiple nodes, and systemic therapy is needed. Herein we report a unique case of HV-type CD presenting as a single renal mass in a patient with end-stage renal disease (ESRD). Despite the rarity, CD should be included in the differential diagnosis of solitary renal mass lesions. An accurate diagnosis is important to avoid unnecessarily risky or extensive operations. Full article
(This article belongs to the Special Issue Kidney Disease: Biomarkers, Diagnosis, and Prognosis: 2nd Edition)
Show Figures

Figure 1

Figure 1
<p>Ultrasonography of this case. (<bold>A</bold>) Ultrasonography reveals a hypoechoic nodule in the renal parenchyma of the right kidney (arrow). (<bold>B</bold>) Color Doppler imaging shows increased peripheral vascularity of the lesion (arrow).</p>
Full article ">Figure 2
<p>Non-contrast enhanced magnetic resonance imaging (MRI) of this case. The lesion (arrow) shows relatively isointense on both T1-weighted imaging with fat saturation (<bold>A</bold>) and T2-weighted imaging (<bold>B</bold>), with high signal intensity on diffusion-weighted imaging (<bold>C</bold>) and low-value appearance on apparent diffusion coefficient imaging (<bold>D</bold>).</p>
Full article ">Figure 3
<p>Axial computed tomography (CT) with dynamic contrast enhancement of the case. The lesion (arrow) is relatively isodense on pre-contrast CT imaging (<bold>A</bold>), relatively early enhancement on arterial phase (<bold>B</bold>), and equivocal washout enhancement pattern with similar Hounsfield units on venous phase (<bold>C</bold>) as those on arterial phase. Neither abnormal enlargement of regional lymph nodes nor invasion of the adjacent structures is found.</p>
Full article ">Figure 4
<p>Pathological features of this case. (<bold>A</bold>) A well-delineated lesion composed of hyperplastic lymphoid follicles distinct from underlying renal parenchyma (H&amp;E stain, ×20). (<bold>B</bold>,<bold>F</bold>) Thickened mantle zone and atrophic germinal centers, forming an “onion skin-like” structure (H&amp;E stain, ×100 and ×400, respectively). (<bold>C</bold>) Twinning feature (H&amp;E stain, ×100). (<bold>D</bold>) The follicle is penetrated by hyalinized capillaries (H&amp;E stain, ×200). (<bold>E</bold>) The extensive vascular proliferation of high endothelial venules with perivascular hyalinization in the interfollicular regions (H&amp;E stain, ×400). (<bold>G</bold>) Immunohistochemistry of CD20 highlights the mantle zones and germinal centers (×100). (<bold>H</bold>) Immunohistochemistry of IgD highlights the mantle zone (×100). (<bold>I</bold>) Immunohistochemistry of CD3 highlights the T lymphocytes (×100). (<bold>J</bold>) Immunohistochemistry of Bcl-2 is expressed in T cells and mantle cells but not germinal centers (×100). (<bold>K</bold>) Immunohistochemistry of cyclin D1 shows negative staining (×100). (<bold>L</bold>) Immunohistochemistry of CD21 highlights the proliferation of follicular dendritic cells (×100).</p>
Full article ">
14 pages, 1097 KiB  
Article
Analysis of Factors Determining Patient Survival after Receiving Free-Flap Reconstruction at a Single Center—A Retrospective Cohort Study
by Nicholas Moellhoff, Sara Taha, Nikolaus Wachtel, Maximilian Hirschmann, Marc Hellweg, Riccardo E. Giunta and Denis Ehrl
Diagnostics 2022, 12(11), 2877; https://doi.org/10.3390/diagnostics12112877 - 21 Nov 2022
Cited by 2 | Viewed by 1958
Abstract
Background: Microsurgical tissue transfer revolutionized reconstructive surgery after extensive trauma, oncological resections, and severe infections. Complex soft tissue reconstructions are increasingly performed in multimorbid and elderly patients. Therefore, it is crucial to investigate whether these patients benefit from these complex procedures. Objective: To [...] Read more.
Background: Microsurgical tissue transfer revolutionized reconstructive surgery after extensive trauma, oncological resections, and severe infections. Complex soft tissue reconstructions are increasingly performed in multimorbid and elderly patients. Therefore, it is crucial to investigate whether these patients benefit from these complex procedures. Objective: To evaluate the outcome for multimorbid patients who underwent microsurgical soft tissue reconstruction and to identify potential risk factors that may increase mortality. Methods: This single-center study retrospectively analyzed prospectively collected data of patients receiving free gracilis (GM) or latissimus dorsi muscle (LDM) flap reconstruction between September 2017 and December 2021. Cases were divided into two groups (dead vs. alive), depending on patient survival. Patient demographics, comorbidities and medication, perioperative details, free flap outcome, as well as microcirculation were determined. Results: A total of 151 flaps (LDM, n = 67; GM, n = 84) performed in 147 patients with a mean age of 61.15 ± 17.5 (range 19–94) years were included. A total of 33 patients (22.45%) passed away during the study period. Deceased patients were significantly older (Alive: 58.28 ± 17.91 vs. Dead: 71.39 ± 11.13; p = 0.001), were hospitalized significantly longer (Alive: 29.66 ± 26.97 vs. Dead: 36.88 ± 15.04 days; p = 0.046) and suffered from cardiovascular (Alive: 36.40% vs. Dead: 66.70%; p = 0.002) and metabolic diseases (Alive: 33.90% vs. Dead: 54.50%; p = 0.031) more frequently, which corresponded to a significantly higher ASA Score (p = 0.004). Revision rates (Alive: 11.00% vs. Dead: 18.20%; p = 0.371) and flap loss (Alive: 3.39% vs. Dead: 12.12%; p = 0.069) were higher in patients that died by the end of the study period. Conclusions: Free flap transfer is safe and effective, even in multimorbid patients. However, patient age, comorbidities, preoperative ASA status, and medication significantly impact postoperative patient survival in the short- and mid-term and must, therefore, be taken into account in preoperative decision-making and informed consent. Full article
(This article belongs to the Collection Vascular Diseases Diagnostics)
Show Figures

Figure 1

Figure 1
<p>Kaplan–Meier survival analysis for LDM and GM cohort.</p>
Full article ">Figure 2
<p>Analysis of microcirculation in viable GM flaps (Alive <span class="html-italic">n</span> = 26; Dead <span class="html-italic">n</span> = 9). Data are depicted for flow, SO<sub>2</sub>, and rHb over the 72 h time period investigated.</p>
Full article ">Figure 3
<p>Analysis of microcirculation in viable LDM flaps (Alive <span class="html-italic">n</span> = 28; Dead <span class="html-italic">n</span> = 4). Data are depicted for flow, SO<sub>2</sub>, and rHb over the 72 h time period investigated.</p>
Full article ">
10 pages, 3005 KiB  
Case Report
A Novel Deletion Mutation of the F8 Gene for Hemophilia A
by Jingwei Wang, Jian Gu, Hongbing Chen, Qian Wu, Liang Xiong, Bin Qiao, Yan Zhang, Hongjun Xiao and Yongqing Tong
Diagnostics 2022, 12(11), 2876; https://doi.org/10.3390/diagnostics12112876 - 21 Nov 2022
Cited by 3 | Viewed by 3004
Abstract
Background: Hemophilia A (HA) is an X-linked recessive blood coagulation disorder caused by a variety of abnormalities in F8 gene, resulting in the absence of impaired molecule production of factor VIII (FVIII) in the plasma. The genetic testing of the F8 gene encoding [...] Read more.
Background: Hemophilia A (HA) is an X-linked recessive blood coagulation disorder caused by a variety of abnormalities in F8 gene, resulting in the absence of impaired molecule production of factor VIII (FVIII) in the plasma. The genetic testing of the F8 gene encoding FVIII is used for confirmation of HA diagnosis, which significantly reduced serious complications of this disease and, ultimately, increased life expectancy. Methods: Sanger sequencing was performed in F8 gene exons of the suspected patients with blood coagulation-related indicators. Results: A novel F8 indel variant c.6343delC, p.Leu2115SerfsTer28 in exon 22 of the F8 gene was identified in the suspected families. The infant with this novel variant appeared the symptom of minor bleeding and oral cavity bleeding, and decreased activity of FVIII, which is consistent with that of F8 deleterious variants. The 3’D protein structural analysis of the novel variant shows a change in FVIII protein stability, which may be responsible for the pathogenesis of HA. Conclusions: A novel deleterious variant was identified in our case, which expands the F8 variants spectrum. Our result is helpful for HA diagnosis and benefits carrier detection and prenatal diagnosis. Our study also reveals that mutation screening of the F8 gene should be necessary for HA suspected patients. Full article
(This article belongs to the Section Pathology and Molecular Diagnostics)
Show Figures

Figure 1

Figure 1
<p>A pedigree for the hemophilia A family. The three-generation family pedigree of the proband was drawn. The inheritance patterns of the family were X-linked, as indicated by the familial pedigrees. Squares and circles indicate males and females, respectively. Darkened Squares represent the affected male members. The black dotted circles represent female carrier. Proband are denoted by the slanted arrow.</p>
Full article ">Figure 2
<p>The F8 gene mutation detected in this family. The proband (III-1) carries the possible pathogenic hemizygous variant, the proband’s mother and maternal grandmother (II-2 and I-2) is a carrier of the variant. The other family members do not carry the mutation at this locus.</p>
Full article ">Figure 3
<p>Multiple Sequence alignment of the F8 peptide sequences with affected residue (red frame) across 34 different species. The conservation of p.Leu2115 residue of F8 peptide sequences was examined across 34 different species by using the multiple-sequence alignment as shown in figure it note that the p.Leu2115 residue locates at C1 domain represented by red arrow, and is highly conserved across different species.</p>
Full article ">Figure 4
<p>The cDNA amplification and crystal structure prediction of c.6343delC (p.Leu2115SerfsTer28) mutation. (<b>A</b>) Exon and domain structure of the F8 C-terminal encoding region. The NM_000132.4_c.6343delC (p.Leu2115SerfsTer28) mutation locating at exon 22 is indicated with a red down arrow and pentagram symbol. (<b>B</b>) RT-PCR was performed using primers located in exon 21 (RT_F) and exon 22 (RT_MUT_R and RT_WT_R) as shown. Two different products are present in the patient sample (lane 3). The upper band corresponds to the wild type product, the lower band corresponds to the product with deletion region from exon 23 to exon 26. (<b>C</b>,<b>D</b>) showed the wild-type (left) and mutant(right)structure of C-Terminal of human FVIII light chain (containing two FVIII domains: C1-C2) was predicted by Swiss PDB viewer using pdb entry 7kwo.1 taken from the Protein Data Bank. C showed the c.6343delC (p.Leu2115SerfsTer28) mutation of F8 lead to premature termination of translation and result in a truncated protein as a result of nonsense-mediated mRNA decay. The truncating mutation c.6343delC result in a truncated F8 protein from 2352 amino acids (6.95PI/267.05kDa, C) to 2142 amino acids (2.53PI/242.82kDa, D). The clustered residues under investigation (HGVS numbering) locating at C1 domain are represented by stick.</p>
Full article ">
15 pages, 4967 KiB  
Article
Detection and Morphological Analysis of Micro-Ruptured Cortical Arteries in Subdural Hematoma: Three-Dimensional Visualization Using the Tissue-Clearing Clear, Unobstructed, Brain/Body Imaging Cocktails and Computational Analysis Method
by Kazuhisa Funayama, Kazuki Tainaka, Akihide Koyama, Rieka Katsuragi-Go, Natsumi Nishikawa-Harada, Ryoko Higuchi, Takashi Aoyama, Hiraku Watanabe, Naoya Takahashi and Hisakazu Takatsuka
Diagnostics 2022, 12(11), 2875; https://doi.org/10.3390/diagnostics12112875 - 20 Nov 2022
Cited by 2 | Viewed by 1785
Abstract
One of the causes of bleeding in subdural hematoma is cortical artery rupture, which is difficult to detect at autopsy. Therefore, reports of autopsy cases with this condition are limited and hence, the pathogenesis of subdural hematoma remains unclear. Herein, for the detection [...] Read more.
One of the causes of bleeding in subdural hematoma is cortical artery rupture, which is difficult to detect at autopsy. Therefore, reports of autopsy cases with this condition are limited and hence, the pathogenesis of subdural hematoma remains unclear. Herein, for the detection and morphological analysis of cortical artery ruptures as the bleeding sources of subdural hematoma, we used the tissue-clearing CUBIC (clear, unobstructed, brain/body imaging cocktails and computational analysis) method with light-sheet fluorescence microscopy and reconstructed the two-dimensional and three-dimensional images. Using the CUBIC method, we could clearly visualize and detect cortical artery ruptures that were missed by conventional methods. Indeed, the CUBIC method enables three-dimensional morphological analysis of cortical arteries including the ruptured area, and the creation of cross-sectional two-dimensional images in any direction, which are similar to histopathological images. This highlights the effectiveness of the CUBIC method for subdural hematoma analysis. Full article
(This article belongs to the Section Pathology and Molecular Diagnostics)
Show Figures

Figure 1

Figure 1
<p>The procedural flow from tissue-clearing to histopathological analysis using the CUBIC method. <sup>1</sup> Phosphate-buffered saline, <sup>2</sup> Light-sheet fluorescence microscopy and <sup>3</sup> Elastica van Gieson.</p>
Full article ">Figure 2
<p>Comparison of macroscopic and histopathological images with CUBIC images in case 1. The enlarged macroscopic (formalin-fixed) image (<b>a</b>) showed the cortical artery with a small depression (arrow) and fine arterial branch (arrowhead). The 3D-CUBIC image (<b>b</b>) clearly showed the cortical artery ruptured at the base of a fine branch (arrow). The histopathological (Elastica van Gieson staining) image (<b>c</b>) showed a tear of the arterial wall (arrow) at the base of a fine arterial branch (arrowhead). The cross-sectional CUBIC image (<b>d</b>) reconstructed the morphology of the rupture as well as the histopathological image. The bar (on the lower right side of (<b>a</b>)) is equal to 2 mm for (<b>a</b>) and (<b>b</b>), 500 μm for (<b>c</b>), and 700 μm for (<b>d</b>). The panels (<b>a</b>,<b>c</b>) are modified from the study by Funayama et al. [<a href="#B52-diagnostics-12-02875" class="html-bibr">52</a>].</p>
Full article ">Figure 3
<p>Comparison of macroscopic and histopathological images with CUBIC images in case 2. The enlarged macroscopic (formalin-fixed) image (<b>a</b>) shows the cortical artery with a small hole (arrow) and fine arterial branch (arrowhead), which was reconstructed and visualized in the 3D-CUBIC image (<b>b</b>). The histopathological (Elastica van Gieson staining) image (<b>c</b>) shows a wall defect in the cortical artery, which was reconstructed and visualized in the cross-sectional CUBIC image (<b>d</b>). Another histopathological (Elastica van Gieson staining) image (<b>e</b>) detected a torn end of a fine arterial branch (arrow), but this torn end is unclear in the cross-sectional CUBIC image (<b>f</b>). The bar (on the lower right side of (<b>a</b>)) is equal to 1 mm for (<b>a</b>,<b>b</b>) and 500 μm for (<b>c</b>–<b>f</b>).</p>
Full article ">Figure 4
<p>Comparison of macroscopic and histopathological images with CUBIC images in case 3. The enlarged macroscopic (formalin-fixed) image (<b>a</b>) could not reveal the presence of arterial ruptures or “twigs” due to bleeding on the surface (dotted circle). The 3D-CUBIC image (<b>b</b>) detected two small branches (arrows) at the bleeding site (dotted circle), neither of which was continuous with the cortical artery. The magnified lateral view of the 3D-CUBIC image (<b>c</b>) and the cross-sectional CUBIC images (<b>d</b>,<b>e</b>) of the bleeding area showed the proximal (arrowheads) and distal (arrows) ruptured ends of the two different arterial branches. These images indicated that one rupture occurred at the bifurcation of the cortical artery (green) and the other approximately 7 mm from the bifurcation (red) immediately after further branching. The histopathological (Elastica van Gieson staining) images (<b>f</b>–<b>i</b>) detected the four corresponding ruptures shown in the CUBIC images, but they could not display their positional relationship to each other. Each marker (arrow or arrowhead, green or red) in Figures (<b>b</b>–<b>i</b>) corresponds to each rupture part. The bar (on the lower right side of (<b>a</b>)) is equal to 2 mm for (<b>a</b>,<b>b</b>), 500 μm for (<b>c</b>), 400 μm for (<b>d</b>,<b>e</b>) and 200 μm for (<b>f</b>–<b>i</b>).</p>
Full article ">Figure 5
<p>Comparison of macroscopic and histopathological images with CUBIC images in case 4. The enlarged macroscopic (formalin-fixed) image (<b>a</b>) did not reveal the presence of arterial rupture or a small arterial branch. The 3D-CUBIC image (<b>b</b>) clearly showed an arterial wall defect (arrow) at the base of a fine branch (arrowhead). The histopathological (Elastica van Gieson staining) image (<b>c</b>) showed the arterial rupture (red arrows) at the base of a fine arterial branch (red arrowhead) as well as a tear of the arachnoid (blue arrow) and a small nodule (blue arrowhead) near the rupture. The cross-sectional CUBIC image (<b>d</b>) reconstructed the morphology of the rupture, arachnoid tear and small nodule as shown by the histopathological image. The bar (on the lower right side of (<b>a</b>)) is equal to 0.5 mm for (<b>a</b>,<b>b</b>) and 300 μm for (<b>c</b>,<b>d</b>). The panel (<b>a</b>) is modified from the study by Funayama et al. [<a href="#B52-diagnostics-12-02875" class="html-bibr">52</a>].</p>
Full article ">Figure 6
<p>Comparison of macroscopic and the cross-sectional CUBIC image with histopathological image in case 6. The macroscopic image after CUBIC processing (<b>a</b>) showed an internal black hemorrhage (arrow) through the transparent brain parenchyma. The cross-sectional CUBIC image (<b>b</b>) showed the contusion of the cerebral cortex containing the subcortical hematoma (dotted circle). An inadequately clarified hematoma interfered with the CUBIC imaging of the ruptured artery, but there was a small torn artery at the margins of the hematoma ((<b>b</b>), arrow), which was detected in the histopathological (Elastica van Gieson staining) image (<b>c</b>). The bar (on the lower right side of (<b>a</b>)) is equal to 10 mm for (<b>a</b>,<b>b</b>) and 100 μm for (<b>c</b>).</p>
Full article ">Figure 7
<p>Comparison of histopathological images with/without CUBIC processing. Between the histopathological (Elastica van Gieson staining) images with (<b>a</b>) and without (<b>b</b>) CUBIC processing, there was little effect of CUBIC processing on the arteries, but the brain parenchyma was cracked (red arrow). This cracking was likely due to the weakening caused by CUBIC processing. The bar (on the lower right side of (<b>a</b>)) is equal to 300 μm for (<b>a</b>,<b>b</b>).</p>
Full article ">
19 pages, 5977 KiB  
Review
Hypersensitivity Pneumonitis: A Pictorial Review Based on the New ATS/JRS/ALAT Clinical Practice Guideline for Radiologists and Pulmonologists
by Mona Dabiri, Maham Jehangir, Pegah Khoshpouri and Hamid Chalian
Diagnostics 2022, 12(11), 2874; https://doi.org/10.3390/diagnostics12112874 - 20 Nov 2022
Cited by 4 | Viewed by 9747
Abstract
Hypersensitivity pneumonitis (HP) is a complicated and heterogeneous interstitial lung disease (ILD) caused by an excessive immune response to an inhaled antigen in susceptible individuals. Accurate diagnosis of HP is difficult and necessitates a detailed exposure history, as well as a multidisciplinary discussion [...] Read more.
Hypersensitivity pneumonitis (HP) is a complicated and heterogeneous interstitial lung disease (ILD) caused by an excessive immune response to an inhaled antigen in susceptible individuals. Accurate diagnosis of HP is difficult and necessitates a detailed exposure history, as well as a multidisciplinary discussion of clinical, histopathologic, and radiologic data. We provide a pictorial review based on the latest American Thoracic Society (ATS)/Japanese Respiratory Society (JRS)/Asociación Latinoamericana del Tórax (ALAT) guidelines for diagnosing HP through demonstrating new radiologic terms, features, and a new classification of HP which will benefit radiologists and pulmonologists. Full article
(This article belongs to the Section Medical Imaging and Theranostics)
Show Figures

Figure 1

Figure 1
<p>Immunopathogenesis of HP. Inhaled antigens interact with antigen-presenting cells (APCs, i.e., macrophages, dendritic cells) via pattern recognition receptors including toll-like receptors (1). APCs stimulate a T-helper 1 cell (Th1) response. Neutrophils are present in early disease. Stimulated plasma cells (B cells) (2) produce IgG antibodies (humoral response) which triggers the complement cascade (3) and enhances macrophages which fuse to multinucleated giant cells and epithelioid cells to form granulomas, mediated by Th1 cytokines. Granulomas produce chemotactic factors which, in combination with dysregulated T cell function, promotes fibroblast proliferation (4). Fibroblasts differentiate into myofibroblasts, produce collagen and extracellular matrix, causing fibrosis.</p>
Full article ">Figure 2
<p>Flow diagram showing the heterogeneous lung attenuation patterns. Mosaic attenuation is a terminology reserved for inspiratory phase imaging and can be seen in vascular diseases, small airway disease or infiltrative diseases such as hypersensitivity pneumonitis. Mosaic perfusion is a feature of primary vascular disease but can also be seen with small airway disease due to hypoxic vasoconstriction.</p>
Full article ">Figure 3
<p>Pictorial representation of heterogeneous lung attenuation patterns at the level of the secondary pulmonary lobule. Top panel shows expected appearance on inspiratory images and the bottom panel shows changes in lung parenchymal density on expiratory images. Notice that mosaic perfusion can be seen with primary vascular disease and small airway disease, with change in lobule size being the differentiating feature.</p>
Full article ">Figure 4
<p>Air trapping (<b>A</b>,<b>B</b>). Axial inspiratory (<b>A</b>,<b>C</b>,<b>E</b>,<b>G</b>) and expiratory phase (<b>B</b>,<b>D</b>,<b>F</b>,<b>H</b>) CTs. On expiratory images the normal lung shows increase in the parenchymal density and decrease in volume. Interspersed geographic areas of air trapping lack the expected increase in density and volume reduction. Accentuated attenuation difference between areas of low and high density (32 versus 98 HU on image (<b>C</b>) and (<b>D</b>) respectively) indicates airway disease.</p>
Full article ">Figure 4 Cont.
<p>Air trapping (<b>A</b>,<b>B</b>). Axial inspiratory (<b>A</b>,<b>C</b>,<b>E</b>,<b>G</b>) and expiratory phase (<b>B</b>,<b>D</b>,<b>F</b>,<b>H</b>) CTs. On expiratory images the normal lung shows increase in the parenchymal density and decrease in volume. Interspersed geographic areas of air trapping lack the expected increase in density and volume reduction. Accentuated attenuation difference between areas of low and high density (32 versus 98 HU on image (<b>C</b>) and (<b>D</b>) respectively) indicates airway disease.</p>
Full article ">Figure 5
<p>Mosaic perfusion (<b>C</b>). Axial (<b>A</b>) and coronal (<b>B</b>) inspiratory phase CTs show sharply demarcated regions of low attenuation (asterisk) interspersed in a background of normal (high) lung attenuation. Small caliber of vessels (short arrow) in the lucent areas relative to the normal lung vasculature (long arrow). Similar gradient of attenuation between low and high attenuation areas measuring 64 HU during inspiration (<b>D</b>) and 69 HU during expiration (<b>E</b>) indicating small vessel disease. Notice the expected decrease in volume of both hypo- and hyper-attenuating areas (<b>E</b>).</p>
Full article ">Figure 6
<p>Axial inspiratory phase CT image shows sharply demarcated regions of three attenuations (three-density pattern): (<b>a</b>) Normal-appearing lung; (<b>b</b>) Lucent lung (i.e., regions of decreased attenuation and decreased vascularity; (<b>c</b>) High attenuation GGO.</p>
Full article ">Figure 7
<p>Three density pattern depicts simultaneous obstructive and infiltrative processes manifesting as air trapping (low density) and ground glass attenuation (high density), respectively, with areas of intervening normal lung parenchyma of intermediate density. Normal lung parenchyma (<b>A</b>) shows expected increased attenuation on expiration (<b>B</b>). Obstructive airway disease (air trapping) with decreased attenuation and vascularity on inspiration and expiration (<b>C</b>,<b>D</b>). GGO (<b>E</b>) with further increased attenuation on expiration (<b>F</b>).</p>
Full article ">Figure 8
<p>Typical non-fibrotic HP. Inspiratory phase CT (top row) shows ground glass opacities (red arrows) and expiratory phase CT (bottom row) shows air trapping (yellow arrows). Note the diffuse axial and craniocaudal distribution.</p>
Full article ">Figure 9
<p>Typical fibrotic HP. Baseline CT (<b>A</b>) shows patchy GGOs. Follow up CT 3 years later (<b>B</b>–<b>D</b>) shows traction bronchiectasis (curved arrow), reticulations, patchy GGOs, and consolidations. Random axial and craniocaudal distribution of fibrosis. Axial inspiratory (<b>C</b>) and expiratory phase (<b>D</b>) shows three-density sign with expected increased attenuation of normal lung (short arrows) and GGOs (black asterisk). Lucent areas of decreased attenuation and vascularity depict air trapping (long arrow).</p>
Full article ">Figure 10
<p>Compatible with fibrotic HP. Axial and coronal expiratory phase CT (<b>A</b>,<b>B</b>) shows coarse reticulations and minimal traction bronchiectasis superimposed on extensive upper lung predominant GGOs with peribronchovascular and subpleural distribution. Air trapping (arrows) is evident.</p>
Full article ">Figure 11
<p>Compatible with fibrotic HP. Inspiratory phase CT (<b>top row</b>) shows ground glass opacities and subtle fibrosis. Note the variant upper lung predominant distribution. Expiratory phase CT (<b>bottom row</b>) shows air trapping (arrows).</p>
Full article ">Figure 12
<p>Compatible with fibrotic HP. Axial inspiratory phase CT shows (<b>A</b>) variant pattern of lung fibrosis with diffuse reticulations superimposed on a background of GGO and (<b>B</b>) lobular air trapping (arrow).</p>
Full article ">
9 pages, 1793 KiB  
Article
Extremely Precise Blood–Plasma Separation from Whole Blood on a Centrifugal Microfluidic Disk (Lab-on-a-Disk) Using Separator Gel
by Ali Hatami and Maryam Saadatmand
Diagnostics 2022, 12(11), 2873; https://doi.org/10.3390/diagnostics12112873 - 20 Nov 2022
Cited by 9 | Viewed by 3452
Abstract
Due to the expansion of point-of-care devices, proposing a convenient and efficient method for blood–plasma separation would help with the use of point-of-care devices. Commercial microfluidic chips are only able to separate a limited amount of plasma, and the majority of these chips [...] Read more.
Due to the expansion of point-of-care devices, proposing a convenient and efficient method for blood–plasma separation would help with the use of point-of-care devices. Commercial microfluidic chips are only able to separate a limited amount of plasma, and the majority of these chips need an active valve system, which leads to increase manufacturing cost and complexity. In this research study, we designed a centrifugal microfluidic disk with a passive valve for ultra-accurate and efficient blood–plasma separation on a large scale (2–3 mL). The disk contained a separator gel, which, after applying the centrifugal force, separated the plasma and red blood cells. The passive valve worked based on the inertial force and was able to transfer more than 90% of the separated plasma to the next chamber. The results demonstrated that the separated plasma was 99.992% pure. This study compared the efficiency of the disk containing separating gel with the common lab-on-a-disk design for plasma separation. A comparison of the results showed that although the common lab-on-a-disk design could separate almost pure plasma as the disk contained separator gel, it could only transfer 60% of plasma to the next chamber. Full article
(This article belongs to the Special Issue Low-Cost Diagnostic Devices)
Show Figures

Figure 1

Figure 1
<p>Schematics of the layers of the Gel-Disk. (<b>a</b>) Disk PMMA layer order. (<b>b</b>) Schematic of blood chambers and passive siphon valves.</p>
Full article ">Figure 2
<p>Schematics of the NoGel-Disk layers. (<b>a</b>) Disk layer order including PMMA (M) and double-sided adhesive (A). (<b>b</b>) Schematic of blood chambers and passive siphon valves.</p>
Full article ">Figure 3
<p>The relationship between CF force, time, and gel displacement. The blank circles, half-filled blue circles, full green circles, and red cross circles represent no plasma separation/no gel displacement, plasma separation/no gel displacement, plasma separation/gel displacement, and erythrocyte rupture, respectively.</p>
Full article ">Figure 4
<p>Speed protocol of the Gel-Disk as well as NoGel-Disk.</p>
Full article ">Figure 5
<p>(<b>a</b>) Effect of time on the hemoglobin concentration at 4000 rpm for Gel-Disk. (<b>b</b>) Effect of time on the white blood cells concentration for Gel-Disk.</p>
Full article ">Figure 6
<p>Photograph of Gel-Disk at the initial and at the end of plasma separation. Scale bar is 1 cm.</p>
Full article ">Figure 7
<p>(<b>a</b>) Effect of time on the hemoglobin concentration at 3000 rpm for NoGel-Disk. (<b>b</b>) Effect on time on the white blood cells concentration for NoGel-Disk.</p>
Full article ">Figure 8
<p>(<b>a</b>,<b>b</b>,<b>c</b>) show images of the plasma separation from 3 mL of blood on NoGel-Disk at 100, 200, and 300 s respectively. Scale bar is 1 cm.</p>
Full article ">
15 pages, 3815 KiB  
Article
Bone-Metabolism-Related Serum microRNAs to Diagnose Osteoporosis in Middle-Aged and Elderly Women
by Sheng-Li Zhao, Zhen-Xing Wen, Xiao-Yi Mo, Xiao-Yan Zhang, Hao-Nan Li, Wing-Hoi Cheung, Dan Fu, Shi-Hong Zhang, Yong Wan and Bai-Ling Chen
Diagnostics 2022, 12(11), 2872; https://doi.org/10.3390/diagnostics12112872 - 19 Nov 2022
Cited by 8 | Viewed by 1787
Abstract
Objective: Postmenopausal osteoporosis (PMOP), a chronic systemic metabolic disease prevalent in middle-aged and elderly women, heavily relies on bone mineral density (BMD) measurement as the diagnostic indicator. In this study, we investigated serum microRNAs (miRNAs) as a possible screening tool for PMOP. [...] Read more.
Objective: Postmenopausal osteoporosis (PMOP), a chronic systemic metabolic disease prevalent in middle-aged and elderly women, heavily relies on bone mineral density (BMD) measurement as the diagnostic indicator. In this study, we investigated serum microRNAs (miRNAs) as a possible screening tool for PMOP. Methods: This investigation recruited 83 eligible participants from 795 community-dwelling postmenopausal women between June 2020 and August 2021. The miRNA expression profiles in the serum of PMOP patients were evaluated via miRNA microarray (six PMOP patients and four postmenopausal women without osteoporosis (n-PMOP) as controls). Subsequently, results were verified in independent sample sets (47 PMOP patients and 26 n-PMOP controls) using quantitative real-time PCR. In addition, the target genes and main functions of the differentially expressed miRNAs were explored by bioinformatics analysis. Results: Four highly expressed miRNAs in the serum of patients (hsa-miR-144-5p, hsa-miR-506-3p, hsa-miR-8068, and hsa-miR-6851-3p) showed acceptable disease-independent discrimination performance (area under the curve range: 0.747–0.902) in the training set and verification set, outperforming traditional bone turnover markers. Among four key miRNAs, hsa-miR-144-5p is the only one that can simultaneously predict changes in BMD in lumbar spine 1–4, total hip, and femoral neck (β = −0.265, p = 0.022; β = −0.301, p = 0.005; and β = −0.324, p = 0.003, respectively). Bioinformatics analysis suggested that the differentially expressed miRNAs were targeted mainly to YY1, VIM, and YWHAE genes, which are extensively involved in bone metabolism processes. Conclusions: Bone-metabolism-related serum miRNAs, such as hsa-miR-144-5p, hsa-miR-506-3p, hsa-miR-8068, and hsa-miR-6851-3p, can be used as novel biomarkers for PMOP diagnosis independent of radiological findings and traditional bone turnover markers. Further study of these miRNAs and their target genes may provide new insights into the epigenetic regulatory mechanisms of the onset and progression of the disease. Full article
(This article belongs to the Special Issue Epigenetic Biomarkers and Diagnostics)
Show Figures

Figure 1

Figure 1
<p>Flowchart of the study. PMOP, postmenopausal osteoporosis; n-PMOP, postmenopausal without osteoporosis; DEmiRNAs, differentially expressed miRNAs; qRT–PCR, quantitative real-time PCR; GO, Gene Ontology; KEGG, Kyoto Encyclopedia of Genes and Genomes; PPI, protein–protein interaction; and ROC, receiver operating characteristic.</p>
Full article ">Figure 2
<p>Screening of key miRNAs. (<b>A</b>) Volcano plot for visualization of DEmiRNAs. (<b>B</b>) Heatmap for visualization of the top 50 upregulated and downregulated DEmiRNAs. (<b>C</b>) Five candidate key miRNAs were obtained according to the screening criteria |Log2FC| ≥ 2 and <span class="html-italic">p</span> &lt; 0.05. (<b>D</b>) Relative expression levels of candidate key miRNAs in the training set. DEmiRNAs, differentially expressed miRNAs.</p>
Full article ">Figure 3
<p>ROC curve of key miRNAs for PMOP diagnosis. (<b>A</b>) Independent diagnostic performance of individual miRNAs in the training set. (<b>B</b>) Combined diagnosis using 4 key miRNAs showed the highest accuracy in the training set. (<b>C</b>) Independent diagnostic performance of individual miRNAs in the validation set. (<b>D</b>) Combined diagnosis using 3 key miRNAs (hsa-miR-144-5p, hsa-miR-506-3p, and hsa-miR-6851-3p) showed the highest accuracy in the validation set. ROC, receiver operating characteristic; PMOP, postmenopausal osteoporosis; and AUC, area under the curve.</p>
Full article ">Figure 4
<p>Comparison of the relative expression levels of key miRNAs among the 4 groups.</p>
Full article ">Figure 5
<p>Bioinformatics analysis based on DEmiRNA target genes. (<b>A</b>) The top 10 significant terms in GO analysis (BP/CC/MF). (<b>B</b>) The top 20 significant terms in KEGG enrichment analysis. (<b>C</b>) The regulatory network of candidate key miRNA target genes. (<b>D</b>) GO analysis of targeted genes of candidate key miRNAs. (<b>E</b>) PPI network of candidate key miRNA target genes. DEmiRNAs, differentially expressed miRNAs; GO, Gene Ontology; BP, biological process; CC, cellular component; MF, molecular function; KEGG, Kyoto Encyclopedia of Genes and Genomes; and PPI, protein–protein interaction.</p>
Full article ">
7 pages, 1327 KiB  
Article
Safety of Bedside Portable Low-Field Brain MRI in ECMO Patients Supported on Intra-Aortic Balloon Pump
by Christopher Wilcox, Matthew Acton, Hannah Rando, Steven Keller, Haris I. Sair, Ifeanyi Chinedozi, John Pitts, Bo Soo Kim, Glenn Whitman and Sung Min Cho
Diagnostics 2022, 12(11), 2871; https://doi.org/10.3390/diagnostics12112871 - 19 Nov 2022
Cited by 7 | Viewed by 4179
Abstract
(1) Background: Fifty percent of patients supported on veno-arterial extracorporeal membrane oxygenation (VA-ECMO) are concurrently supported with an intra-aortic balloon pump (IABP). Acute brain injury (ABI) is a devastating complication related to ECMO and IABP use. The standard of care for ABI diagnosis [...] Read more.
(1) Background: Fifty percent of patients supported on veno-arterial extracorporeal membrane oxygenation (VA-ECMO) are concurrently supported with an intra-aortic balloon pump (IABP). Acute brain injury (ABI) is a devastating complication related to ECMO and IABP use. The standard of care for ABI diagnosis requires transport to a head CT (HCT) scanner. Recent data suggest that point-of-care (POC) magnetic resonance imaging (MRI) is safe and may be effective in diagnosing ABI in ECMO patients; however, no data exist in patients supported on ECMO with an IABP. We report pre-clinical safety data and a case series to evaluate the safety and feasibility of POC brain MRI in ECMO patients supported with IABP. (2) Methods: Prior to patient use, ex vivo testing with an IABP catheter within the Swoop® Portable MRI (0.064 T) System™ was conducted. After IRB approval, clinical testing was performed for the safety and feasibility of early ABI detection. (3) Results: No deflection force was measured with a 7.5 French Maquet Linear IABP within the 0.064 T field. Three adult ECMO patients (average age: 40 years; 67% female) supported with IABP completed four POC brain MRI exams (median exam time: 30 min). Multiple signal abnormalities were detected on the POC brain MRI, corresponding to HCT results. (4) Conclusions: Our preliminary results suggest that adult VA-ECMO patients with IABP support can be safely imaged with low-field POC brain MRI in the intensive care unit, allowing for the early and bedside imaging of patients. Full article
(This article belongs to the Special Issue Critical Care Imaging)
Show Figures

Figure 1

Figure 1
<p>Patient with ECMO support within the Swoop<sup>®</sup> scanner. ECMO and IABP console were kept outside the scanner 5-Gauss line. * ECMO: extracorporeal membrane oxygenation, IABP: intra-aortic balloon pump, 5-Gauss: typical safety line around a magnetic resonance imaging device outside of which functioning of medical and other electronic devices is tested.</p>
Full article ">Figure 2
<p>The 7.5 Fr Maquet IABP catheter in the patient opening of the low-field POC MRI system. IABP: intra-aortic balloon pump, MRI: magnetic resonance imaging, POC: point-of-care.</p>
Full article ">Figure 3
<p>Point-of-care MRI and comparative HCT images. Representative point-of-care MRI images of three critically ill patients with an intra-aortic balloon pump (IABP). Panel (<b>A</b>) represents flair images, (<b>B</b>) and (<b>C</b>) are T2 sequences, and (<b>D</b>) represents comparative head computed tomography (CT) image when available. Patient 1 demonstrated periventricular white matter hypo-intensity concerning for chronic ischemic changes. Patient 2 demonstrated left focal cerebellar encephalomalacia with a right sided artifact from an ultrasound probe. No abnormalities were discovered in Patient 3.</p>
Full article ">
19 pages, 3579 KiB  
Article
Optimized Intelligent Classifier for Early Breast Cancer Detection Using Ultra-Wide Band Transceiver
by Ahmad Ashraf Abdul Halim, Allan Melvin Andrew, Wan Azani Mustafa, Mohd Najib Mohd Yasin, Muzammil Jusoh, Vijayasarveswari Veeraperumal, Mohd Amiruddin Abd Rahman, Norshuhani Zamin, Mervin Retnadhas Mary and Sabira Khatun
Diagnostics 2022, 12(11), 2870; https://doi.org/10.3390/diagnostics12112870 - 19 Nov 2022
Cited by 5 | Viewed by 1826
Abstract
Breast cancer is the most common cancer diagnosed in women and the leading cause of cancer-related deaths among women worldwide. The death rate is high because of the lack of early signs. Due to the absence of a cure, immediate treatment is necessary [...] Read more.
Breast cancer is the most common cancer diagnosed in women and the leading cause of cancer-related deaths among women worldwide. The death rate is high because of the lack of early signs. Due to the absence of a cure, immediate treatment is necessary to remove the cancerous cells and prolong life. For early breast cancer detection, it is crucial to propose a robust intelligent classifier with statistical feature analysis that considers parameter existence, size, and location. This paper proposes a novel Multi-Stage Feature Selection with Binary Particle Swarm Optimization (MSFS–BPSO) using Ultra-Wideband (UWB). A collection of 39,000 data samples from non-tumor and with tumor sizes ranging from 2 to 7 mm was created using realistic tissue-like dielectric materials. Subsequently, the tumor models were inserted into the heterogeneous breast phantom. The breast phantom with tumors was imaged and represented in both time and frequency domains using the UWB signal. Consequently, the dataset was fed into the MSFS–BPSO framework and started with feature normalization before it was reduced using feature dimension reduction. Then, the feature selection (based on time/frequency domain) using seven different classifiers selected the frequency domain compared to the time domain and continued to perform feature extraction. Feature selection using Analysis of Variance (ANOVA) is able to distinguish between class-correlated data. Finally, the optimum feature subset was selected using a Probabilistic Neural Network (PNN) classifier with the Binary Particle Swarm Optimization (BPSO) method. The research findings found that the MSFS–BPSO method has increased classification accuracy up to 96.3% and given good dependability even when employing an enormous data sample. Full article
(This article belongs to the Section Machine Learning and Artificial Intelligence in Diagnostics)
Show Figures

Figure 1

Figure 1
<p>Breast cancer screening technology [<a href="#B18-diagnostics-12-02870" class="html-bibr">18</a>].</p>
Full article ">Figure 2
<p>(<b>a</b>) The breast phantom; (<b>b</b>) The tumor. Figure shows the developed breast phantom and tumor for the experiments.</p>
Full article ">Figure 3
<p>Experimental setup for breast cancer detection: (<b>a</b>) Transmitter; (<b>b</b>) Receiver; (<b>c</b>) Breast Phantom; (<b>d</b>) computer; (<b>e</b>) router.</p>
Full article ">Figure 4
<p>MSFS–BPSO flowchart of overall experimental process.</p>
Full article ">Figure 5
<p>Singular value decomposition process for feature dimension reduction.</p>
Full article ">Figure 6
<p>The BPSO process is represented by a particle.</p>
Full article ">Figure 7
<p>MSFS–BPSO framework.</p>
Full article ">Figure 8
<p>Comparison results between the time and frequency domain after feature normalization and feature dimension reduction.</p>
Full article ">Figure 9
<p>Convergence characteristic for BPSO in the global model.</p>
Full article ">
13 pages, 257 KiB  
Article
Investigation of SARS-CoV-2 Variants and Their Effect on SARS-CoV-2 Monoclonal Antibodies, Convalescent and Vaccine Plasma by a Novel Web Tool
by Ayse Arikan and Murat Sayan
Diagnostics 2022, 12(11), 2869; https://doi.org/10.3390/diagnostics12112869 - 19 Nov 2022
Cited by 1 | Viewed by 1690
Abstract
(1) Background: SARS-CoV-2 variants possess specific mutations throughout their genome; however, the effect of these mutations on pathogenesis is little known. The study aimed to identify SARS-CoV-2 variants and their susceptibility rate against monoclonal antibodies, convalescent, and vaccine plasma. (2) Methods: Strains isolated [...] Read more.
(1) Background: SARS-CoV-2 variants possess specific mutations throughout their genome; however, the effect of these mutations on pathogenesis is little known. The study aimed to identify SARS-CoV-2 variants and their susceptibility rate against monoclonal antibodies, convalescent, and vaccine plasma. (2) Methods: Strains isolated from COVID-19 cases in Turkey in April and September 2021 were involved. Illuma Nextera XT was processed for NGS, followed by virtual phenotyping (Coronavirus Antiviral and Resistance Database (CoV-RDB) by Stanford University). (3) Results: Among 211 strains, 79% were SARS-CoV-2 variants. B.1.1.7 (Alpha) was the most dominant, followed by B.1.617.2 (Delta), B.1.351 (Beta), and B.1.525 (Eta). Alpha and Delta were less susceptible to Etesevimab—Sotrovimab and Bamlanivimab—Etesevimab, respectively. Reduced efficacy was observed for convalescent plasma in Beta and Delta; AstraZeneca, Comirnaty plus AstraZeneca in Alpha; Comirnaty, Moderna, Novovax in Beta; Comirnaty in Delta. (4) Conclusion: CoV-RDB analysis is an efficient, rapid, and helpful web tool for SARS-CoV-2 variant detection and susceptibility analysis. Full article
(This article belongs to the Special Issue Monitoring and Detection for SARS-CoV-2 and Its Variants)
13 pages, 2741 KiB  
Review
Behçet’s Disease: A Radiological Review of Vascular and Parenchymal Pulmonary Involvement
by Caterina Giannessi, Olga Smorchkova, Diletta Cozzi, Giulia Zantonelli, Elena Bertelli, Chiara Moroni, Edoardo Cavigli and Vittorio Miele
Diagnostics 2022, 12(11), 2868; https://doi.org/10.3390/diagnostics12112868 - 19 Nov 2022
Cited by 12 | Viewed by 2662
Abstract
Behcet’s disease (BD) is a chronic systemic inflammatory disorder characterized by underlying chronic vasculitis of both large- and small-caliber vessels. Thoracic involvement in BD can occur with various types of manifestations, which can be detected with contrast-enhanced MSCT scanning. In addition, MR can [...] Read more.
Behcet’s disease (BD) is a chronic systemic inflammatory disorder characterized by underlying chronic vasculitis of both large- and small-caliber vessels. Thoracic involvement in BD can occur with various types of manifestations, which can be detected with contrast-enhanced MSCT scanning. In addition, MR can be useful in diagnosis. Characteristic features are aneurysms of the pulmonary arteries that can cause severe hemoptysis and SVC thrombosis that manifests as SVC syndrome. Other manifestations are aortic and bronchial artery aneurysms, alveolar hemorrhage, pulmonary infarction, and rarely pleural effusion. Achieving the right diagnosis of these manifestations is important for setting the correct therapy and improving the patient’s outcome. Full article
(This article belongs to the Special Issue Imaging of Pulmonary Vascular Disease)
Show Figures

Figure 1

Figure 1
<p>(<b>A</b>,<b>B</b>) Angio-MRI MIP reconstructions in BD patient that show aneurysm of thoracic aorta.</p>
Full article ">Figure 2
<p>(<b>A</b>,<b>B</b>) Angio-MRI MIP reconstructions in BD patient that show aneurysm of left subclavian artery.</p>
Full article ">Figure 3
<p>PAAs in BD patient: (<b>A</b>) Aneurysm of the middle lobar branch of the right pulmonary artery; (<b>B</b>,<b>C</b>) aneurysm of lower lobar branch of both pulmonary arteries; (<b>D</b>) parenchymal ground glass opacities beside the aneurysmatic artery branch.</p>
Full article ">Figure 4
<p>(<b>A</b>,<b>B</b>) Aneurysm of the middle lobar branch of the right pulmonary artery. MPR CT reconstructions in coronal and sagittal scans.</p>
Full article ">Figure 5
<p>SVC thrombosis (red arrows): (<b>A</b>) minimum SVC thrombosis in BD patient; (<b>B</b>) SVC and azygos vein thrombosis in BD patient with CVC.</p>
Full article ">Figure 6
<p>ICT in BD. The red arrow shows right-ventricle thrombosis.</p>
Full article ">Figure 7
<p>Parenchymal involvement in BD: (<b>A</b>) apical-site consolidation with cavitation associated with multiple ground-glass thickening indicating alveolar hemorrhage, a rare presentation of BD; (<b>B</b>,<b>C</b>) perivascular and sub-pleural consolidations and diffuse ground-glass opacities.</p>
Full article ">
9 pages, 655 KiB  
Article
Predictive Factors of Adequate Bowel Cleansing for Colonoscopy in the Elderly: A Retrospective Analysis of a Prospective Cohort
by Marcello Maida, Antonio Facciorusso, Emanuele Sinagra, Gaetano Morreale, Sandro Sferrazza, Giuseppe Scalisi, Socrate Pallio and Salvatore Camilleri
Diagnostics 2022, 12(11), 2867; https://doi.org/10.3390/diagnostics12112867 - 19 Nov 2022
Cited by 6 | Viewed by 1337
Abstract
Factors affecting the quality of bowel preparation for colonoscopy in the elderly are not fully known, and current guidelines provide no specific recommendations. This study aimed to assess the difference in bowel cleansing in young and elderly patients and evaluate predictors of bowel [...] Read more.
Factors affecting the quality of bowel preparation for colonoscopy in the elderly are not fully known, and current guidelines provide no specific recommendations. This study aimed to assess the difference in bowel cleansing in young and elderly patients and evaluate predictors of bowel cleansing in the elderly. We retrospectively reviewed a prospective cohort of 1289 patients performing colonoscopy after a 1-, 2-, or 4-L PEG-based preparation. All 1289 were included in the analysis. Overall, 44.6% of patients were aged ≥65 years. Cleansing success (CS) was achieved in 77.3% and 70.3% of patients aged <65 years and ≥65 years, respectively. At multivariable analysis, split regimen (OR = 2.43, 95% CI = 1.34–4.38; p = 0.003), adequate cleansing at previous colonoscopy (OR = 2.29, 95% CI = 1.14–4.73; p = 0.02), tolerability score (OR = 1.29, 95% CI = 1.16–1.44; p < 0.001), a low-fiber diet for at least 3 days (OR = 2.45, 95% CI = 1.42–4.24; p = 0.001), and colonoscopy within 5 h after the end of preparation (OR = 2.67, 95% CI = 1.28–5.56; p = 0.008) were independently associated with CS in the elderly. Combining a low-fiber diet for at least 3 days, split preparation, and colonoscopy within 5 h allowed a CS rate above 90% and should always be encouraged. A 1-L PEG-ASC preparation was also associated with greater high-quality cleansing of the right colon and may be preferred. Full article
(This article belongs to the Section Medical Imaging and Theranostics)
Show Figures

Figure 1

Figure 1
<p>Cleansing success rate by type of bowel preparation in patients &lt;65 years (<b>a</b>) and ≥65 years (<b>b</b>), and high-quality cleansing of the right colon in patients &lt;65 years (<b>c</b>) and ≥65 years (<b>d</b>).</p>
Full article ">Figure 2
<p>Cleansing success rates in patients ≥ 65 years by combination of different predictive factors.</p>
Full article ">
8 pages, 438 KiB  
Case Report
Molecular Characterization of Hepatitis B Virus Infection in a Patient with Cutaneous Lupus Erythematosus
by Umbertina Villano, Elida Mataj, Maria Dorrucci, Francesca Farchi, Carmelo Pirone, Catia Valdarchi, Michele Equestre, Elisabetta Madonna, Roberto Bruni, Giulio Pisani, Antonio Martina, Matteo Simeoni, Giancarlo Iaiani, Massimo Ciccozzi, Anna Rita Ciccaglione, Fabrizio Conti, Fulvia Ceccarelli and Alessandra Lo Presti
Diagnostics 2022, 12(11), 2866; https://doi.org/10.3390/diagnostics12112866 - 19 Nov 2022
Viewed by 1809
Abstract
Hepatitis B virus (HBV) infection is a serious global health problem. Patients with autoimmune diseases, such as Lupus Erythematosus, are exposed to a higher risk of acquiring infections. In this study, a molecular characterization, genomic investigation of the Hepatitis B virus, polymerase (P) [...] Read more.
Hepatitis B virus (HBV) infection is a serious global health problem. Patients with autoimmune diseases, such as Lupus Erythematosus, are exposed to a higher risk of acquiring infections. In this study, a molecular characterization, genomic investigation of the Hepatitis B virus, polymerase (P) and surface (S) genes, from a patient affected by Cutaneous Lupus Erythematosus (CLE), was presented. Viral DNA was extracted from 200 μL of serum, and the HBV-DNA was amplified by real-time polymerase chain reaction (PCR) with the Platinum Taq DNA Polymerase. The PCR products were purified and sequencing reactions were performed. A phylogenetic analysis was performed through maximum likelihood and Bayesian approaches. The HBV CLE isolate was classified as sub-genotype D3 and related to other Italian HBV D3 genomes, and some from foreign countries. No drug resistant mutations were identified. One mutation (a.a. 168 M) was located in the last part of the major hydrophilic region (MHR) of the surface antigen (HBsAg). Moreover, three sites (351G, 526Y, 578C) in the polymerase were exclusively present in the CLE patient. The mutations identified exclusively in the HBsAg of our CLE patient may have been selected because of the Lupus autoantibodies, which are characteristic in the Lupus autoimmune disease, using a possible molecular mimicry mechanism. Full article
(This article belongs to the Section Diagnostic Microbiology and Infectious Disease)
Show Figures

Figure 1

Figure 1
<p>The maximum likelihood phylogenetic tree built on the first (<b>a</b>) and second dataset of HBV (<b>b</b>). The trees were rooted using the midpoint rooting method. The scale bar at the bottom of the tree represents 0.03 and 0.02 nucleotide substitutions per site respectively for the first and second dataset. An asterisk along the branches represents a SH-aLRT ≥ 80% and UFboot ≥ 95%. Accession numbers of the sequences are indicated in the first part of the tip names followed by HBV genotype/sub-genotype. The accession number for isolate 104 is: OP572234. The HBV sub-genotype D3 cluster was highlighted by brackets.</p>
Full article ">Figure 2
<p>Bayesian phylogenetic analysis on the third (<b>a</b>) and fourth dataset of HBV (<b>b</b>). Branch lengths were estimated with the best fitting nucleotide substitution model according to a hierarchical likelihood ratio test and were drawn to scale with the bar at the bottom indicating 0.08 (<b>a</b>,<b>b</b>) nucleotide substitutions per site. The trees were rooted using the midpoint rooting method. One * along the branches represent significant statistical support for the clade subtending that branch (posterior probability &gt; 90%). The accession number for isolate 104 is OP572234. The accession numbers of the sequences of the third and fourth dataset are reported in <a href="#app1-diagnostics-12-02866" class="html-app">Table S1</a>.</p>
Full article ">
Previous Issue
Next Issue
Back to TopTop