[go: up one dir, main page]

Next Issue
Volume 12, June
Previous Issue
Volume 12, April


Minerals, Volume 12, Issue 5 (May 2022) – 163 articles

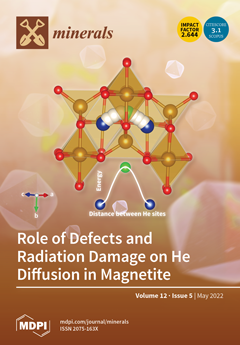
Cover Story (view full-size image): Magnetite (Fe2+Fe3+2O4) crystal cells contain Fe atoms in tetrahedral and octahedral sites and crystallize in the spinel structure with a face-centered cubic cell. Under geological conditions, the structure is modified by natural defects formed during crystallization, and those produced during the alpha decay of U, Th, and Sm isotopes present naturally. The produced radiogenic 4He atoms are incorporated into different atomic interstitial sites and defect sites and diffuse by hopping between those sites depending on the temperature. To quantify the natural and radiation defect on He diffusion, a theoretical investigation of energy mapping along the diffusion paths has been conducted using the energy density functional theory, which allows calculating the migration energy as shown in the figure. View this paper
  • Issues are regarded as officially published after their release is announced to the table of contents alert mailing list.
  • You may sign up for e-mail alerts to receive table of contents of newly released issues.
  • PDF is the official format for papers published in both, html and pdf forms. To view the papers in pdf format, click on the "PDF Full-text" link, and use the free Adobe Reader to open them.
Order results
Result details
Section
Select all
Export citation of selected articles as:
17 pages, 5587 KiB  
Article
Geochemistry of Mudstones/Silty Mudstones from the Qigequan Formation and Shizigou Formation in Yuejin-II Area, Southwestern Area of the Qaidam Basin: Implications for Sedimentary Environment and Sandstone-Type Uranium Mineralization
by Cong Ao, Xue-Ming Teng, Xue-Bin Wei, Tao Lei, Duo Wang and Jun Yang
Minerals 2022, 12(5), 658; https://doi.org/10.3390/min12050658 - 23 May 2022
Cited by 2 | Viewed by 2142
Abstract
The Qaidam Basin has been the focus of sandstone-type uranium prospecting since the 1950s. In recent years, relying on the uranium geological survey project supported by the China Geological Survey, and the cooperation with the Qinhai oil company, drilling work at the Yuejin-II [...] Read more.
The Qaidam Basin has been the focus of sandstone-type uranium prospecting since the 1950s. In recent years, relying on the uranium geological survey project supported by the China Geological Survey, and the cooperation with the Qinhai oil company, drilling work at the Yuejin-II area in this basin has achieved breakthroughs on industrial-level sandstone-type uranium exploration. In this study, we present major, trace and REE geochemical analysis of the Qigequan Formation and the Shizigou Formation mudstones/silty mudstones collected from an industrial uranium ore drillholes in the Yuejin-II area. The Shizigou and Qigequan Formations exhibit signatures of non-intense alteration, low rock maturity and proximal provenance. The overall arid paleoclimatic conditions controlled the sedimentation of large volume of uranium rich materials. The period of relative humidity prompted the sedimentation of reduced agents. Aided by the neotectonic-induced slopes and tectonic windows, oxygenated fluids migrated along permeable layers and extracted the hexavalent uranium, transported in the form of uranyl ion (UO22+). When the oxygen–uranium-rich fluids finally infiltrated into the reductive sand body, the hexavalent uranium was reduced to tetravalent uranium and deposited in the form of uranium compounds. Large-scale and centrally distributed reductive sand bodies provided favorable ore storage space for the sandstone-type uranium mineralization in the Yuejin-II area. Full article
Show Figures

Figure 1

Figure 1
<p>(<b>a</b>) Satellite map showing the location of the Qaidam Basin and (<b>b</b>) geological sketch map of the Altun-Qilian-Kunlun (AQK) orogenic system in the northern Tibet (modified after [<a href="#B32-minerals-12-00658" class="html-bibr">32</a>,<a href="#B33-minerals-12-00658" class="html-bibr">33</a>]).</p>
Full article ">Figure 2
<p>(<b>a</b>) Regional geological sketch of southwestern area of the Qaidam Basin and its adjacent orogenic areas (modified after [<a href="#B69-minerals-12-00658" class="html-bibr">69</a>]) and (<b>b</b>) schematic geological map of the Yuejin area to the main controlled faults and representative oilfield holes (modified after [<a href="#B70-minerals-12-00658" class="html-bibr">70</a>]).</p>
Full article ">Figure 3
<p>Cenozoic stratigraphical framework and seismic reflectors of the southwestern area of the Qaidam Basin (modified after [<a href="#B69-minerals-12-00658" class="html-bibr">69</a>,<a href="#B71-minerals-12-00658" class="html-bibr">71</a>,<a href="#B72-minerals-12-00658" class="html-bibr">72</a>]). Detailed regional tectonic events see [<a href="#B9-minerals-12-00658" class="html-bibr">9</a>].</p>
Full article ">Figure 4
<p>The well-tie profile to illustrate uranium ore horizons among industrial sandstone-hosted uranium boreholes in the Yuejin-II area (the contour-filled color was based on the Natural Gamma Logging Values (GR), with high values representing the uranium horizons). Q<sub>3</sub><span class="html-italic"><sup>pl-al</sup></span>-Quaternary pluvial-alluvial sediments, Q<sub>1-2</sub><span class="html-italic">q</span>-Quaternary Qigequan Formation, N<sub>2</sub><span class="html-italic">s</span>-Neogene Shizigou Formation.</p>
Full article ">Figure 5
<p>The comprehensive columns of ZKII-05 to illustrate the strata, lithologies, facies, sub-facies and variation trend of representative elements and elemental ratios. The filled color of the lithology column represents its respective catalog color.</p>
Full article ">Figure 6
<p>Upper continental crust-normalized variation diagrams for rocks samples from Qigequan Formation (<b>a</b>) and Shizigou Formation (<b>b</b>) in this study. Upper continental crust values are from [<a href="#B78-minerals-12-00658" class="html-bibr">78</a>].</p>
Full article ">Figure 7
<p>A–CN–K ternary diagrams for rock samples in this study. Abbreviations: Ka—kaolinite; Chl—chlorite; Gi—Gibbsite; Sm—smectite; Mu-muscovite; Pl—plagioclase; Kfs—K-feldspar.</p>
Full article ">Figure 8
<p>Discrimination binary diagrams of La/Th vs. Hf (<b>a</b>) and Th/Sc vs. Zr/Sc (<b>b</b>) illustrating sedimentary provenance of the mudstones/silty mudstones collected from the Shizigou Formation and the Qigequan Formation in the Yuejin-II area.</p>
Full article ">
27 pages, 7101 KiB  
Article
Petrochronological Evidence for a Three-Stage Magmatic Evolution of the Youngest Nepheline Syenites from the Ditrău Alkaline Massif, Romania
by Urs Klötzli, Jolanta Burda, Qiu-Li Li, Yu Liu, Gyula Jakab, Lucian Ionescu and Paul Tibuleac
Minerals 2022, 12(5), 657; https://doi.org/10.3390/min12050657 - 23 May 2022
Cited by 3 | Viewed by 2301
Abstract
The Ditrău Alkaline Massif (DAM) is an igneous massif in the Eastern Carpathian Mountains of Romania. Numerous geochronological and geochemical studies have proposed a long formation history (ca. 70 m.y.) of the DAM from Middle Triassic to Cretaceous times, which is hardly reconcilable [...] Read more.
The Ditrău Alkaline Massif (DAM) is an igneous massif in the Eastern Carpathian Mountains of Romania. Numerous geochronological and geochemical studies have proposed a long formation history (ca. 70 m.y.) of the DAM from Middle Triassic to Cretaceous times, which is hardly reconcilable with geochemical evolutionary models and the geotectonic environment during the Mesozoic in this part of the Eastern Carpathian Mountains. In order to put tighter age constraints on the igneous processes forming the DAM, two nepheline syenites from the so-called Ghiduţ and Lăzarea suites were investigated. Based on field and geochemical evidence, the two rock suites represent the younger part of the DAM intrusives. Detailed zircon characterization, in situ zircon SIMS U-Pb dating, and geochemical modelling were used to establish the timing of zircon crystallization and thus to set time constraints on the igneous formation of these parts of the DAM. The intrusion of the dated Ghiduţ suite sample took place at 232 ± 1 Ma in the Karnium, whereas the Lăzarea suite nepheline syenite sample was intruded at 225 ± 1 Ma in the Norium. Together with published geochemical and geochronological data, three different magmatic events can thus be identified: Ghiduţ suite at 231.1 ± 0.8 Ma, Ditrău suite at 230.7 ± 0.2 Ma, and Lăzarea suite at 224.9 ± 1.1 Ma. Although the ages of the events 1 and 2 are statistically indistinguishable, the combination of geochemical and petrochronological data certainly favor independent intrusion events. Thus, the igneous events forming the younger parts of the DAM encompassed a time span of ca. 13 m.y. Additionally, each igneous event can tentatively be divided in an older syenitic stage and a younger nepheline syenitic one, each with an age difference of some 100,000 years. No indication of any post 215 Ma igneous or hydrothermal activity was found. The new data and interpretation significantly improve our understanding of the temporal and geochemical evolution of the DAM and of alkaline complexes as such, demonstrating that the underlying igneous processes (melt generation, assimilation, fractionation, and the duration of plumbing systems) work on the same time scale for both sorts of magmatic rock suites. Full article
Show Figures

Graphical abstract

Graphical abstract
Full article ">Figure 1
<p>Geological map of the Ditrău Alkaline Massif (DAM) after [<a href="#B17-minerals-12-00657" class="html-bibr">17</a>,<a href="#B18-minerals-12-00657" class="html-bibr">18</a>]. The location of samples Ditrǎu 1 (Lăzarea suite) and Ditrău 2 (Ghiduţ suite) are indicated by the yellow star. The inset shows the position of the Ditrău Alkaline Massif within the Eastern Carpathians of Romania.</p>
Full article ">Figure 2
<p>Macro- and microphotographs of the investigated samples from the DAM. (Ditrău 1) Hand specimen of the Lăzarea suite nepheline syenite and thin section images. Upper image in plane polarized light, lower image in double polarized light. (Ditrău 2) Hand specimen of the Ghiduţ suite nepheline syenite and thin section images. Upper image in plane polarized light, lower image in double polarized light. In all images the major mineral phases are labelled; Bio = biotite, Cc = calcite, Cn = cancrinite, Hbl = hornblende, Kfsp = potassium feldspar, Lieb = liebernite, Mag = magnetite, Ne = nepheline, Plag = plagioclase, Tnt = titanite.</p>
Full article ">Figure 3
<p>Geochemistry plots. The data are given in <a href="#minerals-12-00657-t001" class="html-table">Table 1</a>. (<b>a</b>) TAS classification after [<a href="#B45-minerals-12-00657" class="html-bibr">45</a>]. Blue dot: Ditrău 1, Lăzarea suite nepheline syenite; green dot: Ditrău 2, Ghiduţ suite nepheline syenite. Literature data shown in light shading are from [<a href="#B17-minerals-12-00657" class="html-bibr">17</a>]. (<b>b</b>) Chondrite-normalized REE concentrations using the values of [<a href="#B48-minerals-12-00657" class="html-bibr">48</a>]. Blue field: literature data of the Lăzarea suite; green field: literature data of the Ghiduţ suite. The respective thick gray lines are the data from this study. Literature data are from [<a href="#B17-minerals-12-00657" class="html-bibr">17</a>] and [<a href="#B23-minerals-12-00657" class="html-bibr">23</a>]. (<b>c</b>) Trace element spider diagrams with values normalized to the average upper continental crust of [<a href="#B48-minerals-12-00657" class="html-bibr">48</a>]. Blue field: literature data of the Lăzarea suite; green field: literature data of the Ghiduţ suite. The respective thick gray lines are the data from this study. Literature data are from [<a href="#B17-minerals-12-00657" class="html-bibr">17</a>]. (<b>d</b>) Tectonic discrimination diagrams after [<a href="#B49-minerals-12-00657" class="html-bibr">49</a>]. Blue dot: Ditrău 1, Lăzarea suite nepheline syenite; green dot: Ditrău 2, Ghiduţ suite nepheline syenite. Literature data shown in light shading are from [<a href="#B17-minerals-12-00657" class="html-bibr">17</a>]. Symbols are as in subfigure (<b>a</b>).</p>
Full article ">Figure 4
<p>Zr-Hf whole-rock systematics of the DAM intrusives. The red dashed line refers to the average Zr/Hf ratio of the DAM syenites and nepheline syenites showing different degrees of metasomatic/hydrothermal alteration. The two samples Ditrău 1 and 2 evidently lie off this reference line, indicating a metasomatic/hydrothermal agent relatively enriched in Zr, resulting in a model Zr/Hf ratio of ca. 80 (black arrow). The dashed and full black arrows indicate endmember Zr and Hf concentrations derived from different petrogenetic models. The inset shows the Na<sub>2</sub>O versus Zr systematics of the DAM alkaline rocks, demonstrating that there is no correlation of Na<sub>2</sub>O with Zr. See text for further discussion. Symbols are as in <a href="#minerals-12-00657-f003" class="html-fig">Figure 3</a>a with the exception of "others" which designates literature data from hornblendites, the Sărmaș gabbro, the Bear Valley mafic syenite, and the Hagota quartz syenite. Literature data are from [<a href="#B17-minerals-12-00657" class="html-bibr">17</a>,<a href="#B23-minerals-12-00657" class="html-bibr">23</a>].</p>
Full article ">Figure 5
<p>Zircon CL images with SIMS spots indicated as yellow dots (true size 5 × 7 µm). Zircon labels refer to the numbering in <a href="#minerals-12-00657-t002" class="html-table">Table 2</a>. Numbers in brackets refer to the spot numbers on the individual crystals. Ages are <sup>238</sup>U/<sup>206</sup>Pb ages ± 2 standard deviations. The spots circled in blue (<sup>238</sup>U/<sup>206</sup>Pb &gt; 25 and Th/U &gt; 15, CL-dark domains, weakly visible oscillatory zonation) and green (<sup>238</sup>U/<sup>206</sup>Pb &gt; 25 and Th/U &lt; 5, intermediate bright CL domains, well-developed oscillatory zonation) correspond to the spots used to calculate the igneous zircon growth ages (see <a href="#minerals-12-00657-f007" class="html-fig">Figure 7</a>).</p>
Full article ">Figure 6
<p>Zircon CL images showing crystal with a moderate (crystals 1, 6) to complete metasomatic/hydrothermal overprinting or new growth (crystals 5, 10).</p>
Full article ">Figure 7
<p>Zircon U-Pb Tera–Wasserburg concordia plots. (<b>a</b>) Ditrău 1 (Lăzarea suite), all data points. A forced regression through <sup>207</sup>Pb/<sup>206</sup>Pb = 0.851 results in a lower intercept age of 224.60 ± 3.54 Ma. (<b>b</b>) Ditrău 1 (Lăzarea suite), 5 data points with <sup>238</sup>U/<sup>206</sup>Pb &gt; 25, <sup>206</sup>Pb/<sup>204</sup>Pb &gt; 200, and <sup>207</sup>Pb corrected define a concordia age of 224.50 ± 3.48 Ma. (<b>c</b>) Ditrău 2 (Ghiduţ suite), all data points. A forced regression through <sup>207</sup>Pb/<sup>206</sup>Pb = 0.851 results in a lower intercept age of 230.28 ± 2.81 Ma. (<b>d</b>) Ditrău 2 (Ghiduţ suite), 5 data points with <sup>238</sup>U/<sup>206</sup>Pb &gt; 25 and <sup>206</sup>Pb/<sup>204</sup>Pb &gt; 400; (<b>e</b>,<b>f</b>) as above but combining the data from Ditrău 1 and Ditrău 2. A forced regression through <sup>207</sup>Pb/<sup>206</sup>Pb = 0.851 results in a lower intercept age of 235.15 ± 6.36 Ma. All data points with <sup>238</sup>U/<sup>206</sup>Pb &gt; 25, <sup>206</sup>Pb/<sup>204</sup>Pb &gt; 400, and <sup>207</sup>Pb corrected define a concordia age of 231.07 ± 2.13 Ma. See text for detailed discussion.</p>
Full article ">Figure 8
<p>Plot of U versus Th showing the chemically different zircon domains relevant to the age interpretation (see <a href="#minerals-12-00657-f005" class="html-fig">Figure 5</a>). Three trends can be identified: (1) SIMS pots from Ditrău 1 with <sup>238</sup>U/<sup>206</sup>Pb &gt; 25, Th/U &gt; 15, and <sup>206</sup>Pb/<sup>204</sup>Pb &gt; 200 define a U-Pb concordia age of 224.5 ± 3.5 Ma (blue array). These spots are related to intermediate bright CL zircon domains with well-developed oscillatory zonation. (2) SIMS spots from Ditrău 2 with <sup>238</sup>U/<sup>206</sup>Pb &gt; 25, Th/U &lt; 5, and <sup>206</sup>Pb/<sup>204</sup>Pb &gt; 400 define a U-Pb age of 231.8 ± 2.8 Ma (green array). These spots are related to CL-dark zircon domains showing only a weakly visible oscillatory zonation. (3) The remaining SIMS spots from both samples with <sup>238</sup>U/<sup>206</sup>Pb &lt; 25 and <sup>206</sup>Pb/<sup>204</sup>Pb &lt; 200 (small, not colored) are attributed to strong U and Th loss during metasomatic/hydrothermal overprinting.</p>
Full article ">Figure 9
<p>Schematic conceptual model of the Ditrău Alkaline Massif (modified from [<a href="#B17-minerals-12-00657" class="html-bibr">17</a>]) showing the inferred mean intrusion ages for the Ghiduţ suite (this work and [<a href="#B6-minerals-12-00657" class="html-bibr">6</a>]), the Lăzarea suite (this work and [<a href="#B6-minerals-12-00657" class="html-bibr">6</a>]), the Ditrău syenite [<a href="#B6-minerals-12-00657" class="html-bibr">6</a>,<a href="#B31-minerals-12-00657" class="html-bibr">31</a>], and the Belcina carbonate mineralized veins [<a href="#B56-minerals-12-00657" class="html-bibr">56</a>]. Color coding follows <a href="#minerals-12-00657-f001" class="html-fig">Figure 1</a>.</p>
Full article ">Figure 10
<p>Compilation of inferred mean intrusion ages for the alkaline rocks of the DAM, the formation age of the Belcina carbonate mineralized veins, and the age ranges for metasomatic/hydrothermal overprinting and mineral cooling ages. Data are from (1) [<a href="#B31-minerals-12-00657" class="html-bibr">31</a>]; (2) [<a href="#B6-minerals-12-00657" class="html-bibr">6</a>]; (3) this work; (4) [<a href="#B56-minerals-12-00657" class="html-bibr">56</a>]. Color coding as in <a href="#minerals-12-00657-f001" class="html-fig">Figure 1</a> and <a href="#minerals-12-00657-f009" class="html-fig">Figure 9</a>.</p>
Full article ">
19 pages, 6260 KiB  
Article
Zircon U-Pb-Hf Isotopes, Biotite 40Ar/39Ar Geochronology, and Whole-Rock Geochemistry of the Baogeqi Gabbro in the Northern Alxa, Southernmost Central Asian Orogenic Belt
by Shaohua Zhang, Chiyang Liu, Jianqiang Wang, Jianke Bai, Xiaochen Zhao, Long Zhang, Nan Jia, Lijun Song and Heng Peng
Minerals 2022, 12(5), 656; https://doi.org/10.3390/min12050656 - 23 May 2022
Cited by 2 | Viewed by 1767
Abstract
The final closure time of the Paleo-Asian Ocean and the Permo-Carboniferous tectonic settings in the northern Alxa are very important but controversial tectonic issues. The geochronology and petrogenesis of mafic igneous rocks are superior in clarifying regional tectonic settings. Here, we report on [...] Read more.
The final closure time of the Paleo-Asian Ocean and the Permo-Carboniferous tectonic settings in the northern Alxa are very important but controversial tectonic issues. The geochronology and petrogenesis of mafic igneous rocks are superior in clarifying regional tectonic settings. Here, we report on zircon U-Pb-Hf isotopes, biotite 40Ar/39Ar geochronology and whole-rock geochemical data of the hornblende gabbro from the Baogeqi gabbro pluton in the northern Alxa. The LA-ICP MS U-Pb analysis of zircon grains from the hornblende gabbro yield a weighted mean age of 262.7 ± 2.3 Ma (2σ, MSWD = 0.74), manifesting that the Baogeqi gabbro pluton emplacement was during the late Middle Permian (Capitanian). The 40Ar/39Ar dating of biotite grains from the hornblende gabbro yields a plateau age of 231.3 ± 1.6 Ma (2σ, MSWD = 0.55), indicating that the Baogeqi gabbro pluton cooled to below 300 ℃ in the Triassic. The hornblende gabbro samples are calc-alkaline with metaluminous character, and show enrichment in large ion lithophile elements (e.g., Rb, Ba, Sr, and K) but depletion in Nb, Ta, P, Th, and Ti relative to primitive mantle. Combined with the positive zircon εHf(t) values (+4.9–+9.4), we suggest that the magmas formed from the partial melting of depleted mantle were metasomatized by slab-derived fluids. Together with regional geology, these geochemical data suggest that the Baogeqi gabbro pluton was formed in an intracontinental extension setting, further indicating that the Paleo-Asian Ocean in the northern Alxa was closed prior to the late Middle Permian (Capitanian), and this region was in a post-collision extensional setting during the Capitanian-Late Permian. In addition, the Triassic cooling of the gabbro pluton may be a record of the decline of the Capitanian-Late Permian post-collisional extension basin due to the far-field effect of subduction-collision during the closure of the Paleo-Tethys Ocean. Full article
Show Figures

Figure 1

Figure 1
<p>(<b>a</b>) Simplified tectonic sketch map of the Central Asian orogenic belt (CAOB) with the location of the studied area. Modified after [<a href="#B24-minerals-12-00656" class="html-bibr">24</a>]; (<b>b</b>) Geological map of the northern Alxa. Modified after [<a href="#B20-minerals-12-00656" class="html-bibr">20</a>].</p>
Full article ">Figure 2
<p>Geological map of the study area showing the distribution of the Baogeqi gabbro pluton.</p>
Full article ">Figure 3
<p>Field photographs and photomicrographs showing petrographic features of the hornblende gabbro from the Baogeqi gabbro plutonthe Baogeqi gabbro: (<b>a</b>) The intrusive contact relationship between the Baogeqi gabbro plutonthe Baogeqi gabbro and Amushan Formation sedimentary rocks; (<b>b</b>) Outcrop of the Baogeqi gabbro plutonthe Baogeqi gabbro; (<b>c</b>) The photomicrograph of the hornblende gabbrothe Baogeqi gabbro in plane polarized light, and (<b>d</b>) The photomicrograph of the hornblende gabbrothe Baogeqi gabbro under cross polarized light. Mineral abbreviations: Pl—plagioclase; Qtz—quartz; Hb—hornblende; Px—Pyroxene; Bt—biotite; Afs—Alkali feldspar.</p>
Full article ">Figure 4
<p>The diagrams for zircon U-Pb-Hf isotopes of the hornblende gabbro from the Baogeqi gabbro pluton: (<b>a</b>) Representative zircon cathodoluminescence images and U-Pb concordia diagram; (<b>b</b>) Weight mean plot of the concordant ages; (<b>c</b>) Plot of zircon εHf(t) values vs. U-Pb ages; (<b>d</b>) Histograms of T<sub>DM1</sub> model ages of zircons.</p>
Full article ">Figure 5
<p>(<b>a</b>) Apparent age spectra and (<b>b</b>) inverse isochron diagram for biotite from the hornblende gabbro of the Baogeqi gabbro pluton obtained from <sup>40</sup>Ar/<sup>39</sup>Ar step heating analyses.</p>
Full article ">Figure 6
<p>Geochemical diagrams for the hornblende gabbro samples from the Baogeqi gabbro pluton: (<b>a</b>) Na<sub>2</sub>O + K<sub>2</sub>O vs. SiO<sub>2</sub> [<a href="#B44-minerals-12-00656" class="html-bibr">44</a>]; (<b>b</b>) K<sub>2</sub>O vs. SiO<sub>2</sub> [<a href="#B45-minerals-12-00656" class="html-bibr">45</a>]; (<b>c</b>) A.R vs. SiO<sub>2</sub> [<a href="#B46-minerals-12-00656" class="html-bibr">46</a>]<sub>,</sub> and (<b>d</b>) A/CNK vs. A/NK [<a href="#B47-minerals-12-00656" class="html-bibr">47</a>].</p>
Full article ">Figure 7
<p>(<b>a</b>) Chondrite-normalized REE patterns and (<b>b</b>) primitive mantle-normalized trace element patterns for the hornblende gabbro samples from the Baogeqi gabbro pluton. The normalization values of chondrite are from [<a href="#B48-minerals-12-00656" class="html-bibr">48</a>] and data for primitive mantle are from [<a href="#B49-minerals-12-00656" class="html-bibr">49</a>].</p>
Full article ">Figure 8
<p>Binary plots of the hornblende gabbro samples from the Baogeqi gabbro pluton: (<b>a</b>) La/Ba vs. La/Nb [<a href="#B58-minerals-12-00656" class="html-bibr">58</a>]; (<b>b</b>) Th/Yb vs. Nb/Yb [<a href="#B59-minerals-12-00656" class="html-bibr">59</a>]; (<b>c</b>) Nb/Zr vs. Th/Zr [<a href="#B60-minerals-12-00656" class="html-bibr">60</a>]; (<b>d</b>) Nb/Zr vs. Ce/Y [<a href="#B56-minerals-12-00656" class="html-bibr">56</a>].</p>
Full article ">Figure 9
<p>Tectonic environment discrimination diagrams for the hornblende gabbro samples of the Baogeqi gabbro pluton: (<b>a</b>) Zr/Y vs. Zr [<a href="#B62-minerals-12-00656" class="html-bibr">62</a>] and (<b>b</b>) Nb×2−Zr/4−Y [<a href="#B63-minerals-12-00656" class="html-bibr">63</a>].</p>
Full article ">
12 pages, 2966 KiB  
Article
Potential Use of Municipal Waste Incineration Ash as a Hardening Slurry Ingredient
by Paweł Falaciński and Łukasz Szarek
Minerals 2022, 12(5), 655; https://doi.org/10.3390/min12050655 - 23 May 2022
Cited by 1 | Viewed by 1811
Abstract
In recent years, there has been a marked increase in the amount of municipal waste generated in Poland. In the context of circular economy assumptions, the key is the availability of technologies that would make it possible to safely process and reuse waste, [...] Read more.
In recent years, there has been a marked increase in the amount of municipal waste generated in Poland. In the context of circular economy assumptions, the key is the availability of technologies that would make it possible to safely process and reuse waste, especially when it is difficult to manage. One such direction is thermal waste treatment. In 2020, 21.6% of all municipal waste was subjected to this process. Consequently, the amount of ash generated is significant (approximately 2,823,000 tons annually). One of the uses of waste materials is the sealing of earth hydrotechnical facilities, such as flood embankments, water dams, and embankments of waste landfills. For this purpose, cut-off screens made of hardening slurries are used. In order to improve the tightness and corrosion resistance of hardening suspensions, combustion by-products are added to their composition. The article presents an assessment of the possibility of using ashes from municipal waste incineration as an additive to hardening slurries. It also discusses the technological and operational parameters of hardening slurries with the addition of the ashes in question. Binding requirements for hardening slurries used for the construction of cut-off walls is also defined. The experiment showed that the tested hardening slurries meet most of the suitability criteria. Further research directions are proposed to fully identify other properties of hardening slurries in terms of their environmental impact. Full article
(This article belongs to the Special Issue Fly Ashes: Characterization, Processing and Utilization)
Show Figures

Figure 1

Figure 1
<p>Ash designated as 19 01 07* (<b>a</b>) and 19 01 13* (<b>b</b>).</p>
Full article ">Figure 2
<p>SEM photo with EDS analysis involving ashes 19 01 07* (<b>a</b>) and 19 01 13* (<b>b</b>).</p>
Full article ">Figure 3
<p>Hardening slurry filtration coefficient test bench diagram.</p>
Full article ">Figure 4
<p>Conventional viscosity of the tested hardening slurry samples.</p>
Full article ">Figure 5
<p>Daily water loss in tested hardening slurry recipes.</p>
Full article ">Figure 6
<p>Compressive strength <span class="html-italic">f<sub>c</sub></span> of the tested hardening slurries depending on the cement/ash (c/a) ratio.</p>
Full article ">Figure 7
<p>Hydraulic conductivity <span class="html-italic">k</span><sub>10</sub> of the tested hardening slurries, depending on the cement/ash (c/a) ratio.</p>
Full article ">
19 pages, 8319 KiB  
Article
Evolution Characteristics of Overlying Strata Fractures in Paste Composite Filling Stope
by Wenyu Lv, Kai Guo, Haijin Wang, Kun Feng and Dongdong Jia
Minerals 2022, 12(5), 654; https://doi.org/10.3390/min12050654 - 22 May 2022
Cited by 8 | Viewed by 1845
Abstract
Paste composite filling mining (PCFM) is one of the effective ways to achieve water-preserved mining (preservation of the waterproof strata). To investigate the laws of fracture propagation of the overlying strata in the PCFM stope, a kinematic model of overlying strata in the [...] Read more.
Paste composite filling mining (PCFM) is one of the effective ways to achieve water-preserved mining (preservation of the waterproof strata). To investigate the laws of fracture propagation of the overlying strata in the PCFM stope, a kinematic model of overlying strata in the PCFM was established, which identified the major determinants to the development of overlying strata fractures. Taking the 112,201 working face of the test mine as the research background, the physical similar simulation, numerical computation, and theoretical analysis were combined to analyze the development characteristics of overlying strata fractures in the PCFM under the reaction between many factors (mining height, filling ratio, burial depth). The results show that the larger the mining height of the working face, the larger the development degree of overlying strata fractures. When the mining height is smaller, fractures are mostly distributed on both sides of the coal wall; when the mining height is larger, overlying strata fractures are mostly distributed on both sides of the coal wall and the upper part of overlying strata. The larger the paste filling ratio of the working face, the smaller the development degree of overlying strata fractures. Overlying strata fractures are mostly distributed in overlying strata on both sides of the coal wall. When the filling ratio of the working face increases, it is possible to effectively control the development of overlying strata fractures. The shallower the burial depth of the working face is, the faster the fractures are developed. With the increase of the burial depth, the development of overlying strata fractures is reduced, and overlying strata fractures will finally tend to be a stable value. The research results provide an important theoretical foundation for the application of the localized paste filling mining technique in the water-preserved mining, and also complement the theories of filling mining. Full article
(This article belongs to the Special Issue Backfilling Materials for Underground Mining, Volume III)
Show Figures

Figure 1

Figure 1
<p>Schematic diagram of PCFM.</p>
Full article ">Figure 2
<p>Mechanical model diagram for PCFM.</p>
Full article ">Figure 3
<p>Monitoring equipment. (<b>a</b>) Optical total station, (<b>b</b>) high-speed camera.</p>
Full article ">Figure 4
<p>Layout of physical model displacement measuring line.</p>
Full article ">Figure 5
<p>The numerical computation model.</p>
Full article ">Figure 6
<p>Development characteristics of overlying strata fractures. (<b>a</b>) PCFM; (<b>b</b>) Caving mining.</p>
Full article ">Figure 7
<p>Overlying strata fracture development height. (<b>a</b>) PCFM; (<b>b</b>) Caving mining.</p>
Full article ">Figure 8
<p>Development characteristics of overlying strata fractures under different mining height conditions. (<b>a</b>) Mining Height 4 m; (<b>b</b>) Mining Height 5 m; (<b>c</b>) Mining Height 6 m; (<b>d</b>) Mining Height 7 m; (<b>e</b>) Mining Height 8 m.</p>
Full article ">Figure 8 Cont.
<p>Development characteristics of overlying strata fractures under different mining height conditions. (<b>a</b>) Mining Height 4 m; (<b>b</b>) Mining Height 5 m; (<b>c</b>) Mining Height 6 m; (<b>d</b>) Mining Height 7 m; (<b>e</b>) Mining Height 8 m.</p>
Full article ">Figure 9
<p>The fit curve of the development height of overlying strata fractures under different mining height conditions.</p>
Full article ">Figure 10
<p>The development characteristics of overlying strata fractures under different filling ratio conditions. (<b>a</b>) Un-filling; (<b>b</b>) Filling 1/5; (<b>c</b>) Filling 1/3; (<b>d</b>) Filling 1/2; (<b>e</b>) Filling 2/3; (<b>f</b>) Filling 3/4; (<b>g</b>) Filling 100%.</p>
Full article ">Figure 10 Cont.
<p>The development characteristics of overlying strata fractures under different filling ratio conditions. (<b>a</b>) Un-filling; (<b>b</b>) Filling 1/5; (<b>c</b>) Filling 1/3; (<b>d</b>) Filling 1/2; (<b>e</b>) Filling 2/3; (<b>f</b>) Filling 3/4; (<b>g</b>) Filling 100%.</p>
Full article ">Figure 11
<p>The fit curve of the development height of overlying strata fractures under different filling ratio conditions.</p>
Full article ">Figure 12
<p>The development characteristics of overlying strata fractures under different buried depth conditions. (<b>a</b>) Buried depth 200 m; (<b>b</b>) Buried depth 250 m; (<b>c</b>) Buried depth 300 m; (<b>d</b>) Buried depth 350 m; (<b>e</b>) Buried depth 400 m.</p>
Full article ">Figure 13
<p>The fit curve of the development height of overlying strata fractures under different buried depth conditions.</p>
Full article ">
13 pages, 4199 KiB  
Article
Geophysical Implications for Prospective Prediction of Copper Polymetallic Ore Bodies: Northern Margin of Alxa Block, China
by Yinsheng Meng, Xiaoqiang Chen, Wenguo Wang, Ruihong Li and Gang Wang
Minerals 2022, 12(5), 653; https://doi.org/10.3390/min12050653 - 22 May 2022
Cited by 1 | Viewed by 1803
Abstract
The Alxa Block is located in the middle part of the Central Asian orogenic belt, which is the coupling belt of the North China, Tarim, and Kazakhstan Plates. The east–west-trending deep faults control stratigraphic distribution and magmatic activity in the region. To detect [...] Read more.
The Alxa Block is located in the middle part of the Central Asian orogenic belt, which is the coupling belt of the North China, Tarim, and Kazakhstan Plates. The east–west-trending deep faults control stratigraphic distribution and magmatic activity in the region. To detect the EW-trending ore-controlling deep structures, a 440 km NS section of magnetotelluric sounding was conducted from Minle to Ejinaqi. The phase tensor and electrical principal axis were analyzed based on the measured data to build the exploration model. The electrical structure model along the section was obtained using nonlinear conjugate gradient (NLCG) 2D inversion. Combined with the geological, geophysical, and deposit distribution characteristics in the area, the comprehensive study of magnetotelluric sounding profile shows that the resistivity presents as zoned along the profile. The Engelwusu ophiolite mélange belt is stacked in clumps with high and low resistivity, indicating that the northern margin of the Engelwusu Belt subducts below the high-resistivity zone, representing the passive continental margin. The southern end of the Engelwusu ophiolite belt is primarily the prospecting potential area for copper–gold deposits, whereas the northern end of the Engelwusu ophiolite belt corresponds to copper polymetallic deposits. Full article
Show Figures

Figure 1

Figure 1
<p>Tectonic sketch and magnetotelluric sounding profile location in the study area (Digital Elevation Model, from <a href="https://e4ftl01.cr.usgs.gov/ASTT/ASTGTM.003" target="_blank">https://e4ftl01.cr.usgs.gov/ASTT/ASTGTM.003</a> (accessed on 15 September 2021); L1–L4 measurement positions come from the work of [<a href="#B11-minerals-12-00653" class="html-bibr">11</a>]). (<b>a</b>). The tectonic background of the study area; (<b>b</b>). Location map of magnetotelluric survey point and digital elevation model of study area.</p>
Full article ">Figure 2
<p>Sounding curve of typical magnetotelluric survey stations.</p>
Full article ">Figure 3
<p>Phase tensor ellipses of each frequency phase tensor.</p>
Full article ">Figure 4
<p>Electrical spindle analysis of all measuring points in the full-frequency band.</p>
Full article ">Figure 5
<p>L curve of inverse fitting difference in different regularization factors.</p>
Full article ">Figure 6
<p>Two-dimensional inversion electrical structure model and error of L27.</p>
Full article ">Figure 7
<p>Comprehensive analytical diagram of electrical structure of Minle–Ejinaqi section in the northern edge of the Alxa Block (gravity data are from [<a href="#B21-minerals-12-00653" class="html-bibr">21</a>]).</p>
Full article ">
21 pages, 4890 KiB  
Article
Geological Significance of Late Permian Magmatic Rocks in the Middle Section of the Ailaoshan Orogenic Belt, SW China: Constraints from Petrology, Geochemistry and Geochronology
by Yaoyao Zhang, Kai Liu, Ye Wang, Da Zhang, Xuanxue Mo, Yuefei Deng, Tingxi Yu and Zenan Zhao
Minerals 2022, 12(5), 652; https://doi.org/10.3390/min12050652 - 21 May 2022
Cited by 3 | Viewed by 1984
Abstract
The Ailaoshan orogenic belt, located in the SE margin of the Qinghai–Tibet Plateau, is an important Paleo-Tethys suture zone in the eastern margin of the Sanjiang Tethys tectonic domain. The areas of Mojiang and Zhenyuan, located in the middle part of the Ailaoshan [...] Read more.
The Ailaoshan orogenic belt, located in the SE margin of the Qinghai–Tibet Plateau, is an important Paleo-Tethys suture zone in the eastern margin of the Sanjiang Tethys tectonic domain. The areas of Mojiang and Zhenyuan, located in the middle part of the Ailaoshan orogenic belt, are the key parts of the Ailaoshan Paleo-Tethys Ocean closure and collision orogeny. The rhyolites outcropped in the Mojiang area, and the granite porphyries outcropped in Zhenyuan area, are systematically studied for petrology, isotope geochemistry and geochronology. The Zircon U-Pb geochronology of rhyolites and granite porphyries give weighted average ages of 253.4 ± 4.2 Ma and 253.3 ± 2.0 Ma, respectively, both of which were formed in the late Permian period. The rhyolites belong to potassic calc-alkaline to subalkaline series. The patterns of the rare earth elements (REE) show a right-inclined seagull-type distribution, and the trace elements plot is right-inclined. The granite porphyries are high potassic calc-alkaline to subalkaline. The REE patterns show a right-inclined distribution, and the trace elements plot is right-inclined, which is consistent with the typical patterns observed in the crust. The peraluminous, highly differentiated and high ASI values suggest that rhyolites and granite porphyries are S-type granites. The zircon εHf(t) of the rhyolites range from −7.22 to −0.72, and two-stage Hf zircon model ages are (TDMC) 1771–2352 Ma, indicating that the magma source area is mainly crust-derived. The zircon εHf(t) of the granite porphyries range from −0.97 to 4.08, and two-stage Hf zircon model ages are (TDMC) 1336–1795 Ma, indicating that the magma is derived from a depleted mantle source and the partial melting of ancient crustal materials. The rhyolites and granite porphyries were possibly formed in the syn-collisional tectonic setting during the late Permian, and their ages limited the time of the final closure of the Ailaoshan Ocean and the initiation of collisional orogeny. Full article
(This article belongs to the Special Issue Petrology, Mineralogy, Geochemistry and Geochronology of Granites)
Show Figures

Figure 1

Figure 1
<p>Temporal–spatial distribution of the magmatic rocks along the Ailaoshan orogenic belt (<b>a</b>) and the location of the study area in China’s tectonic map showing Precambrian blocks surrounded by Phanerozoic orogenic belts ((<b>b</b>); modified from [<a href="#B28-minerals-12-00652" class="html-bibr">28</a>]).</p>
Full article ">Figure 2
<p>Geological sketch map of mining area (modified from [<a href="#B16-minerals-12-00652" class="html-bibr">16</a>]).</p>
Full article ">Figure 3
<p>Field photos, hand specimens, and micrograph of the rhyolite in Mojiang gold deposits and the granite porphyry in Zhenyuan gold deposits. (<b>a</b>) Angular unconformity contact between rhyolite and Silurian strata; (<b>b</b>) Granite porphyry dike in Laowangzhai Mine; (<b>c</b>) Photograph of hand specimen of rhyolite (MJ-26) used for zircon U-Pb dating; (<b>d</b>) Photograph of hand specimen of granite porphyry (LWZ-02) used for zircon U-Pb dating; (<b>e</b>) Rhyolite phenocrysts are subrounded corroded quartz crystals; (<b>f</b>) Granite porphyry phenocrysts are sericitized feldspar and corroded quartz crystals. Q—quartz; Pl—plagioclase.</p>
Full article ">Figure 4
<p>Classification and discriminant diagrams of magmatic rock. (<b>a</b>) SiO<sub>2</sub> vs. K<sub>2</sub>O + Na<sub>2</sub>O plot of volcanic rocks [<a href="#B56-minerals-12-00652" class="html-bibr">56</a>]; (<b>b</b>) SiO<sub>2</sub> vs. K<sub>2</sub>O + Na<sub>2</sub>O plot of intrusive rocks [<a href="#B56-minerals-12-00652" class="html-bibr">56</a>]; (<b>c</b>) K<sub>2</sub>O vs. SiO<sub>2</sub> plot [<a href="#B56-minerals-12-00652" class="html-bibr">56</a>]; (<b>d</b>) A/NK-A/CNK plot [<a href="#B57-minerals-12-00652" class="html-bibr">57</a>]. The samples of He et al. [<a href="#B30-minerals-12-00652" class="html-bibr">30</a>] are from the Zhenyuan gold deposits. The location and lithology of other samples from the references are shown in <a href="#minerals-12-00652-f001" class="html-fig">Figure 1</a>.</p>
Full article ">Figure 5
<p>Chondrite-normalized REE and E-MORB-normalized trace-element spider patterns. (<b>a</b>) Chondrite-normalized REE patterns of volcanic rocks; (<b>b</b>) E-MORB-normalized trace-element spider patterns of volcanic rocks; (<b>c</b>) Chondrite-normalized REE patterns of intrusive rocks; (<b>d</b>) E-MORB-normalized trace-element spider patterns of intrusive rocks (normalizing factors are from [<a href="#B58-minerals-12-00652" class="html-bibr">58</a>]; Chondrite and E-MORB compositions are from [<a href="#B59-minerals-12-00652" class="html-bibr">59</a>]).</p>
Full article ">Figure 6
<p>(<b>a</b>) Cathodoluminescence (CL) images of zircons of the rhyolite (MJ-26); (<b>b</b>) LA-ICP-MS zircon U-Pb concordia diagram of the rhyolite (MJ-26); (<b>c</b>) Cathodoluminescence (CL) images of zircons of the granite porphyry (LWZ-02); (<b>d</b>) LA-ICP-MS zircon U-Pb concordia diagram of the granite porphyry (LWZ-02).</p>
Full article ">Figure 7
<p>εHf(<span class="html-italic">t</span>) versus age diagram (<b>a</b>,<b>b</b>) (Base image according to [<a href="#B64-minerals-12-00652" class="html-bibr">64</a>]). The samples from Liu et al. [<a href="#B65-minerals-12-00652" class="html-bibr">65</a>] are volcanic rocks along the Ailaoshan orogenic belt.</p>
Full article ">Figure 8
<p>εHf(<span class="html-italic">t</span>) versus age diagram (<b>a</b>,<b>b</b>) (Base image according to [<a href="#B64-minerals-12-00652" class="html-bibr">64</a>]). The samples from Li et al. [<a href="#B17-minerals-12-00652" class="html-bibr">17</a>] and Sun et al. [<a href="#B44-minerals-12-00652" class="html-bibr">44</a>] are granite porphyries not far from the study area along the Ailaoshan orogenic belt.</p>
Full article ">Figure 9
<p>Rb/Ba vs. Rb/Sr diagram for magmatic rocks (base image according to [<a href="#B76-minerals-12-00652" class="html-bibr">76</a>]). The samples from Li et al. [<a href="#B17-minerals-12-00652" class="html-bibr">17</a>] and Sun et al. [<a href="#B44-minerals-12-00652" class="html-bibr">44</a>] are granite porphyries not far from the study area along the Ailaoshan orogenic belt. The samples from Liu et al. [<a href="#B54-minerals-12-00652" class="html-bibr">54</a>] and Sun et al. [<a href="#B43-minerals-12-00652" class="html-bibr">43</a>] are volcanic rocks not far from the study area along the Ailaoshan orogenic belt.</p>
Full article ">Figure 10
<p>Tectonic discrimination diagrams for magmatic rocks (base image according to [<a href="#B82-minerals-12-00652" class="html-bibr">82</a>]). (<b>a</b>) Rb vs. (Y + Nb) diagram; (<b>b</b>) Rb vs. (Yb + Ta) diagram; (<b>c</b>) Nb vs. Y diagram; (<b>d</b>) Ta vs. Yb diagram. Syn-COLG, syn-collision granite; VAG, volcanic arc granite; WPG, within plate granite; ORG, ocean ridge granite; post-COLG, post-collision granite. The samples from Li et al. [<a href="#B17-minerals-12-00652" class="html-bibr">17</a>] and Sun et al. [<a href="#B44-minerals-12-00652" class="html-bibr">44</a>] are granite porphyries not far from the study area along the Ailaoshan orogenic belt. The samples from Liu et al. [<a href="#B54-minerals-12-00652" class="html-bibr">54</a>] and Sun et al. [<a href="#B43-minerals-12-00652" class="html-bibr">43</a>] are volcanic rocks not far from the study area along the Ailaoshan orogenic belt.</p>
Full article ">Figure 11
<p>Schematic evolution diagram showing the collision time of the Ailaoshan orogenic belt based on magmatic ages (<b>a</b>) (modified by [<a href="#B17-minerals-12-00652" class="html-bibr">17</a>]) and a conceptual tectonic model of the Ailaoshan orogenic belt during the late Permian (<b>b</b>).</p>
Full article ">
13 pages, 3777 KiB  
Article
Boron Impurity Deposition on a Si(100) Surface in a SiHCl3-BCl3-H2 System for Electronic-Grade Polysilicon Production
by Qinghong Yang, Fengyang Chen, Lin Tian, Jianguo Wang, Ni Yang, Yanqing Hou, Lingyun Huang and Gang Xie
Minerals 2022, 12(5), 651; https://doi.org/10.3390/min12050651 - 21 May 2022
Cited by 3 | Viewed by 2133
Abstract
A study of boron impurities deposited on a Si(100) surface in a SiHCl3-BCl3-H2 system is reported in this paper, using periodic density functional theory with generalized gradient approximation (GGA). The results show that the discrete distances of BCl [...] Read more.
A study of boron impurities deposited on a Si(100) surface in a SiHCl3-BCl3-H2 system is reported in this paper, using periodic density functional theory with generalized gradient approximation (GGA). The results show that the discrete distances of BCl3 and SiHCl3 from the surface of the Si(100) unit cell are 1.873 Å and 2.340 Å, respectively, and the separation energies are −35.2549 kcal/mol and −10.64 kcal/mol, respectively. BCl3 and SiHCl3 are mainly adsorbed on the surface of the Si(100) unit cell in particular molecular orientations: the positive position and the hydrogen bottom-two-front position from the analysis of the bond length change and adsorption energy. The adsorption of SiHCl3 and BCl3 is accompanied by a charge transfer from the molecule to the surface of the unit cell of 0.24 and 0.29 eV, respectively. BCl3 reacts more readily than SiHCl3 with the Si(100) surface, resulting in the deposition of boron impurities on the polysilicon surface. Full article
Show Figures

Figure 1

Figure 1
<p>Model geometry and optimization curve of Si(100) surface. (<b>a</b>) is the Si(100) model geometry; (<b>b</b>) is the model optimization convergence curve.</p>
Full article ">Figure 2
<p>Diagrams of the molecular structure and distance of BCl<sub>3</sub> before and after adsorption on the Si(100) surface. Diagrams (<b>a</b>–<b>c</b>) show the adsorption structure before reaction, (<b>a’</b>–<b>c’</b>) the adsorption structure after the reaction, ((<b>a</b>,<b>a’</b>) show side position of the molecule, (<b>b</b>,<b>b’</b>), lateral position of the molecule, and (<b>c</b>,<b>c’</b>) positive position of the molecule).</p>
Full article ">Figure 3
<p>Differential charge density (<b>a</b>) and charge distribution (<b>b</b>) of BCl<sub>3</sub> adsorbed on the Si(100) surface of the unit cell.</p>
Full article ">Figure 4
<p>Diagram of molecular structures and distances of SiHCl<sub>3</sub> before and after adsorption on the Si(100) surface. Diagrams (<b>a</b>–<b>f</b>) show the adsorption structures before reaction, (<b>a’</b>–<b>f’</b>) those after reaction ((<b>a</b>–<b>f</b>,<b>a’</b>–<b>f’</b>) show hydrogen in the top-one-positive, bottom-one-front, top-two-front, side-one-front, side-two-front, and bottom-two-front positions, respectively).</p>
Full article ">Figure 5
<p>Differential charge density (<b>a</b>) and charge distribution (<b>b</b>) after SiHCl<sub>3</sub> is adsorbed on the Si(100) surface.</p>
Full article ">Figure 6
<p>Structure changes before (<b>a</b>) and after (<b>b</b>) the co-adsorption of BCl<sub>3</sub> and SiHCl<sub>3</sub>.</p>
Full article ">Figure 7
<p>Differential charge density (<b>a</b>) and charge distribution (<b>b</b>) before and after the co-adsorption of BCl<sub>3</sub> and SiHCl<sub>3</sub> on the surface.</p>
Full article ">Figure 8
<p>State density changes of BCl<sub>3</sub> and SiHCl<sub>3</sub> molecules after the adsorption on the Si(100) cell surface. (<b>a</b>) is the density of states of Si(100); (<b>b</b>) is the density of states for the BCl<sub>3</sub> adsorption model; (<b>c</b>) is the density of states for the SiHCl<sub>3</sub> adsorption model; (<b>d</b>) is the density of states for the co-adsorption of BCl<sub>3</sub> and SiHCl<sub>3</sub>.</p>
Full article ">
19 pages, 6546 KiB  
Article
Peculiarities of Dynamics of Hypergenic Mineral Transformation of Nickel Weathering Crusts of Ultramafic Rocks of the Kempirsay Group of Deposits in Western Kazakhstan
by Valeriy Korobkin, Iskander Samatov, Akhan Chaklikov and Zhamal Tulemissova
Minerals 2022, 12(5), 650; https://doi.org/10.3390/min12050650 - 20 May 2022
Cited by 3 | Viewed by 2098
Abstract
Nickel weathering ores are used to produce metallic nickel, stainless steels, and nickel sulfate, the main component of batteries. The global production of nickel from weathering ores is increasing and has surpassed production from sulfide magmatic deposits. The efficiency of the mining and [...] Read more.
Nickel weathering ores are used to produce metallic nickel, stainless steels, and nickel sulfate, the main component of batteries. The global production of nickel from weathering ores is increasing and has surpassed production from sulfide magmatic deposits. The efficiency of the mining and processing of nickel ores from weathering rocks is determined by their mineralogical composition. The weathering crust profile of the Kempirsay ultramafite massif is divided into three zones—leached (kerolitized) serpentinites, nontronites, and final hydrolysis minerals (later referred to as “ochers”). The kerolitized zone consists of a mixture of Ni-bearing talc and saponites (later referred to as “kerolite”). During the geological mapping of the Donskoye, Buranovskoye, and Shelektinskoye deposits, the products of ultramafite hypergenic transformation into disintegrated and leached serpentinites, kerolites, nontronites, and ochers were selected and studied. For this purpose, 44 rock samples were studied via X-ray diffractometric and thermal analyses, supplemented with data from chemical, microscopic, and granulometric determinations. Based on the obtained numerical parameters of the crystalline structure of the weathering products, the thermochemical values were obtained. The hypergenic transformation of the initial minerals and their subsequent transformation were traced. The trace element distribution along the profile of the serpentinite weathering ores is related to the initial material composition of the ultramafites. The accumulation of nickel in industrial concentrations is associated with the nontronite–kerolite zone. X-ray diffractometric analysis can be used as a fast and reliable method for controlling the nickel content of ores and monitoring their mineralogical composition. Full article
Show Figures

Figure 1

Figure 1
<p>Scheme of the geological structure of the Kempirsay massif of ultramafic rocks [<a href="#B5-minerals-12-00650" class="html-bibr">5</a>,<a href="#B6-minerals-12-00650" class="html-bibr">6</a>,<a href="#B13-minerals-12-00650" class="html-bibr">13</a>].</p>
Full article ">Figure 2
<p>Diagram of the geological structure of the Buranovskoye deposit. Upper (hypergenic) stage—weathering crust. Lower stage—altered ultramafic rocks.</p>
Full article ">Figure 3
<p>Scheme of the geological structure of the Shelektinskoye deposit. Upper hypergene layer—weathering crust. Lower tier—altered ultramafic rocks.</p>
Full article ">Figure 4
<p>Zones of hypergenic transformation of the weathering rocks of ultramafic rocks Donskoye, Buranovskoye, and Shelektinskoye deposits. Note—symbols in <a href="#minerals-12-00650-f003" class="html-fig">Figure 3</a>.</p>
Full article ">Figure 5
<p>Granulometric spectrum of samples from well 2250 (Buranovskoye deposit, Kempirsay massif, and the lower and middle horizons). (<b>I</b>)—variations of the granulometric composition of the products of hypergenesis, depending on the depth of occurrence of rocks. (<b>II</b>)—diagrams of the dependence of the distribution of nontronites and kerolites along the weathering profile, regarding the depth of rock sampling and number of fractions.</p>
Full article ">Figure 6
<p>Derivatograms of serpentines of the Donskoye deposit. Exo—exothermic effect, Endo—endothermic effect, ∆T—change in the enthalpy of the system during the thermal transformation of the tested samples.</p>
Full article ">Figure 7
<p>Buranovskoye deposit—serpentine-to-kerolite transformation zone, samples 84–89. Derivatograms of hypergenesis products from weathering crusts of the full profile. DTA—250 µV, DTG—500 µV, TG—100 vu (500 µV), and sample—500 mg. Exo—exothermic effect, Endo—endothermic effect, ∆T—change in the enthalpy of the system during the thermal transformation of the tested samples.</p>
Full article ">Figure 8
<p>Diffractograms of unmodified, disintegrated, and weathered serpentinites of the Kempirsay massif, Donskoye deposit.</p>
Full article ">Figure 9
<p>Diagram of changes in the free energy of the system during the transformation of hypergenic minerals in weathering crusts (Ostwald’s rule).</p>
Full article ">Figure 10
<p>Diagram of Ni, MgO, and Fe<sub>2</sub>O<sub>3</sub> distribution in the section of the weathering crust of ultramafic rocks of Buranovskoye and Shelektinskoye deposits, according to thermal and chemical analyses.</p>
Full article ">
25 pages, 16108 KiB  
Article
Using Process Mineralogy as a Tool to Investigate Blending Potential of the Pentlandite-Bearing Ores at the Nkomati Ni Mine in South Africa
by Thomas Dzvinamurungu, Derek Hugh Rose, Ngonidzashe Chimwani and Fanus Viljoen
Minerals 2022, 12(5), 649; https://doi.org/10.3390/min12050649 - 20 May 2022
Cited by 2 | Viewed by 2463
Abstract
The mineralogy and texture of Ni-sulfide ores at the Nkomati nickel mine are highly variable, and this results in often erratic nickel recovery at the mine. The variability of the ore presents an opportunity to study the influence of grind size on the [...] Read more.
The mineralogy and texture of Ni-sulfide ores at the Nkomati nickel mine are highly variable, and this results in often erratic nickel recovery at the mine. The variability of the ore presents an opportunity to study the influence of grind size on the flotation-based recovery of Ni in highly heterogeneous sulfide ores, which would be applicable to this ore type at many other mines worldwide. In view of this, a process mineralogy investigation was conducted on thirteen mineralogically and texturally different nickel-sulfide ores from the Nkomati Nickel Mine, with a view on the influence of grind size on the flotation performance of pentlandite. Ore types presented include medium- and high-grade variants of the bleb, disseminated, massive, semi-massive, and net-textured sulfide ores of the Main Mineralized Zone (MMZ), as well as disseminated chromite-rich nickel sulfide ore and massive chromitite ore of the Peridotitic Chromitite Mineralized Zone (PCMZ). Laboratory scale metallurgical test work, comprising of sequential grinding and bench-top flotation testing of the ores, was conducted in combination with quantitative mineralogical investigation of the flotation feed and associated flotation products, using a FEI 600F Mineral Liberation Analyzer. The ore types under consideration require a variety of grind sizes (i.e., milling times) in order to attain optimal recovery of nickel through flotation. This is predominantly controlled by ore texture, and also partly by the abundance of the major constituent minerals in the ore, being pyroxenes, base metal sulfides, and chromite. Liberation of pentlandite is directly correlated with grind size (milling time), which is also positively correlated with the level of nickel recovery through flotation. A grind size of P80 at 75 µm results in the highest concentrate nickel grades of 7.5–8.1% in the PCMZ ores’ types which is the current grind for the PCMZ ores at Nkomati. A grind size of P77 at 75 µm yields the best overall pentlandite liberation, Ni recoveries of 84–88% and grades of 5.3–5.6% in the MMZ ores. This holds the potential to produce the best overall pentlandite liberation, nickel grades, recoveries from blending the MMZ and PCMZ ore types, and milling the composite ore at a target grind of P80 at 75 µm. Full article
(This article belongs to the Special Issue Comminution and Comminution Circuits Optimisation)
Show Figures

Figure 1

Figure 1
<p>Macroscopic images of the distribution of sulfides (i.e., rock textures) of hand-sized polished rock slabs of ore samples collected from the MMZ (<b>A</b>–<b>E</b>), as well as the PCMZ (<b>F</b>,<b>G</b>) ore horizons. Scale bar bottom right = 1 cm.</p>
Full article ">Figure 2
<p>Photomicrographs of the medium-grade and high-grade bleb textured sulfide ores ((<b>A–D</b>) transmitted plane polarized light; (<b>E</b>,<b>F</b>) reflected light). The mineral abbreviations are as follows: amphibole (Amp); chlorite (Chl); clinopyroxene (Cpx); chromite (Chr); glaucophane (Gln); hornblende (Hbl); orthopyroxene (Opx); oxide (Ox); plagioclase (Pl); chalcopyrite (Ccp); pentlandite (Pn); pyrrhotite (Po); pyrite (Py); serpentine (Srp); and talc (Tlc). The scale bar at the bottom right of the images represents 500 µm. BMS = base metal sulfides.</p>
Full article ">Figure 3
<p>Photomicrographs of the high-grade and medium-grade disseminated sulfide ores showing various silicate (<b>A</b>,<b>D</b>,<b>E</b>) and sulfide (<b>B</b>,<b>C</b>,<b>F</b>) minerals. The scale bar at the bottom right corner of the images represents 500 µm. Refer to <a href="#minerals-12-00649-f002" class="html-fig">Figure 2</a> for explanation of the mineral abbreviations.</p>
Full article ">Figure 4
<p>Photomicrographs of the high-grade massive sulfide ores (<b>A</b>–<b>C</b>) as well as the medium-grade massive sulfide ores (<b>D</b>–<b>F</b>) show various silicates and composite sulfides. The scale bar at the bottom right corner of the images represents 500 µm. Refer to <a href="#minerals-12-00649-f002" class="html-fig">Figure 2</a> for explanation of the mineral abbreviations.</p>
Full article ">Figure 5
<p>Photomicrographs of the high-grade semi-massive (<b>A</b>–<b>C</b>) and medium-grade semi-massive (<b>D</b>–<b>F</b>) sulfide ores show various silicates and sulfides. The scale bar at the bottom right corner of the images represents 500 µm. Refer to <a href="#minerals-12-00649-f002" class="html-fig">Figure 2</a> for explanation of the mineral abbreviations.</p>
Full article ">Figure 6
<p>Photomicrographs of the high-grade net-texture ore (<b>A</b>–<b>C</b>) and medium-grade net-texture ore (<b>D</b>–<b>F</b>) showing various silicate and sulfide minerals. The scale bar at the bottom right corner of the images represents 500 µm. Refer to <a href="#minerals-12-00649-f002" class="html-fig">Figure 2</a> for explanation of the mineral abbreviations.</p>
Full article ">Figure 7
<p>Photomicrographs of disseminated chromite-rich sulfide ore from the Peridotitic Chromitite Mineralized Zone showing various silicates (<b>A</b>,<b>B</b>,<b>D</b>,<b>E</b>), sulfides, and chromite (<b>C</b>,<b>F</b>,<b>G</b>). The scale bar at the bottom right corner of the images represents 500 µm. Refer to <a href="#minerals-12-00649-f002" class="html-fig">Figure 2</a> for explanation of the mineral abbreviations.</p>
Full article ">Figure 8
<p>Photomicrographs of massive chromite ore from the Peridotitic Chromitite Mineralized Zone showing various silicate minerals and chromite. (<b>A</b>) Chlorite and serpentine forming networks around chromite grains; (<b>B</b>) Olivine, serpentine, and chlorite forming networks around chromite grains. The scale bar at the bottom right corner of the image represents 500 µm. Refer to <a href="#minerals-12-00649-f002" class="html-fig">Figure 2</a> for explanation of the mineral abbreviations.</p>
Full article ">Figure 9
<p>Pentlandite grain size distributions (equivalent circle diameter) for the samples of the various ore types collected from the MMZ and the PCMZ (crushed to −2 mm).</p>
Full article ">Figure 10
<p>Cumulative mass % passing 75 µm sieve as a function of milling time for samples of the different ore textures collected from the MMZ and the PCMZ.</p>
Full article ">Figure 11
<p>Cumulative liberation yield of pentlandite (weight %) in the −75 + 38 fractions of feed in the different grind sizes for high- and medium-grade variants of the sulfide ores from the MMZ and the PCMZ.</p>
Full article ">Figure 12
<p>Cumulative Ni recovery as a function of flotation time for the flotation of the various ore types at the Nkomati Ni mine, milled to a grind of P57, P67, and P77 at 75 micron ((<b>A</b>–<b>J</b>) MMZ ore horizon)) as well as a grind of P70, P80, and P90 of 75 micron ((<b>K</b>–<b>M</b>) PCMZ ore horizon).</p>
Full article ">Figure 12 Cont.
<p>Cumulative Ni recovery as a function of flotation time for the flotation of the various ore types at the Nkomati Ni mine, milled to a grind of P57, P67, and P77 at 75 micron ((<b>A</b>–<b>J</b>) MMZ ore horizon)) as well as a grind of P70, P80, and P90 of 75 micron ((<b>K</b>–<b>M</b>) PCMZ ore horizon).</p>
Full article ">Figure 13
<p>Cumulative concentrate grade vs. cumulative Ni recovery for the flotation of the various ore types at the Nkomati Ni mine, milled to a grind of P57, P67, and P77 at 75 micron ((<b>A</b>–<b>J</b>) MMZ ore horizon) as well as a grind of P70, P80, and P90 at 75 micron ((<b>K</b>–<b>M</b>) PCMZ ore horizon).</p>
Full article ">Figure 13 Cont.
<p>Cumulative concentrate grade vs. cumulative Ni recovery for the flotation of the various ore types at the Nkomati Ni mine, milled to a grind of P57, P67, and P77 at 75 micron ((<b>A</b>–<b>J</b>) MMZ ore horizon) as well as a grind of P70, P80, and P90 at 75 micron ((<b>K</b>–<b>M</b>) PCMZ ore horizon).</p>
Full article ">
30 pages, 8609 KiB  
Article
Microwave Dewatering of Gibbsite-Type Bauxite Ores: Permittivities, Heating Behavior and Strength Indices
by Christopher Pickles and Ting Lu
Minerals 2022, 12(5), 648; https://doi.org/10.3390/min12050648 - 20 May 2022
Cited by 2 | Viewed by 1907
Abstract
Microwave radiation is a relatively new energy source that is being considered for several applications in mineral processing and extractive metallurgy. In the present research, various gibbsite-type bauxite ores were subjected to microwave radiation. The main objective was to assess the effect of [...] Read more.
Microwave radiation is a relatively new energy source that is being considered for several applications in mineral processing and extractive metallurgy. In the present research, various gibbsite-type bauxite ores were subjected to microwave radiation. The main objective was to assess the effect of microwave dewatering on the compressive strength indices of the ores and to compare the results obtained to those for conventional heating. Firstly, the fundamental interactions of the microwaves with the ores were evaluated by determining both the real and the imaginary permittivities as a function of temperature, and these were related to the water content. Secondly, the microwave heating behavior was modeled using a 24 factorial statistical analysis. Thirdly, the effect of dewatering by microwave heating on the compressive strength indices of roughly spherical bauxite ore pisoids was studied, and these results were compared to those obtained using conventional heating. Fourthly, the effect of particle size on the compressive strengths of irregular-shaped single particles of bauxite ore was investigated using both heating techniques. Finally, the energy requirements for dewatering of the ores, and hence reducing their compressive strengths, were compared for both processes. On the laboratory scale, the results showed that in comparison to conventional dewatering, microwave dewatering resulted in lower strength indices at both lower moisture removals and energy inputs. Full article
(This article belongs to the Section Mineral Processing and Extractive Metallurgy)
Show Figures

Figure 1

Figure 1
<p>Scanning electron microscope image of the fractured surface of an as-received bauxite (2) particle (×300). The highlighted area was analyzed by energy dispersive X-ray spectroscopy (EDS) and consisted of mainly aluminum with some iron.</p>
Full article ">Figure 2
<p>Particle size distribution of bauxite (1), which was used in the TGA, permittivity and heating behavior studies.</p>
Full article ">Figure 3
<p>Microwave system.</p>
Full article ">Figure 4
<p>Schematic diagram of the Chatillon compression tester with two loading platens. Platen-1 was used for the bauxite (2) spherical pisoid samples, and platen-2 was used for the bauxite (3) irregular-shaped single particle studies.</p>
Full article ">Figure 5
<p>TGA and DTGA of bauxite ore (1).</p>
Full article ">Figure 6
<p>Real and imaginary permitivities of bauxite ore (1) as a function of temperature at 2460 MHz. The density was 1.50 gm/cc before processing and 1.07 gm/cc after.</p>
Full article ">Figure 7
<p>Loss tangent of bauxite ore (1) as a function of temperature at 2460 MHz. The density was 1.50 gm/cc before processing and 1.07 gm/cc after.</p>
Full article ">Figure 8
<p>(<b>a</b>): Real permittivity of bauxite (1-Fe) as a function of temperature at various frequencies. The density was 2.09 gm/cc before processing and 1.67 gm/cc after. (<b>b</b>): Imaginary permittivity of bauxite (1-Fe) as a function of temperature at various frequencies. The density was 2.09 gm/cc before processing and 1.67 gm/cc after.</p>
Full article ">Figure 9
<p>Calculated sample temperature as function of time for a sample mass of 27.5 g and 990 W. The bulk density was 0.6048 g/cm<sup>3</sup>.</p>
Full article ">Figure 10
<p>Measured strength indices of the as-received bauxite (2) pisoids.</p>
Full article ">Figure 11
<p>Percent moisture removal and average strength index versus sample temperature for conventionally heated bauxite (2) pisoid samples.</p>
Full article ">Figure 12
<p>Distribution of the average strength indices for conventionally heated bauxite (2) pisoid samples at 500 °C.</p>
Full article ">Figure 13
<p>Effect of moisture removal on the average strength index for the as-received sample and for microwave-heated bauxite (2) pisoid samples at 850 W, 1000 W and 1200 W for 2 min.</p>
Full article ">Figure 14
<p>Distribution of the average strength indices for microwave-heated bauxite (2) pisoid samples at 825 W, 1000 W and 1200 W for 2 min.</p>
Full article ">Figure 15
<p>Modified five-parameter Gaussian distribution plots for conventional and microwaved bauxite (2) pisoid samples.</p>
Full article ">Figure 16
<p>Typical microstructure of a microwaved sample of bauxite ore (2) showing the cracks (×450).</p>
Full article ">Figure 17
<p>Time to microwave sintering for the three different particle size ranges.</p>
Full article ">Figure 18
<p>Strength index as a function of moisture content for the three particle size ranges: (<b>a</b>) −3.0 + 2.5 cm, (<b>b</b>) −3.5 + 3.0 cm and (<b>c</b>) −4.5 + 3.5 cm.</p>
Full article ">Figure 19
<p>Strength index of the as-received, conventional and microwaved samples for the three particle size ranges: −3.0 + 2.5 cm, −3.5 + 3.0 cm and −4.5 + 3.5 cm.</p>
Full article ">Figure 20
<p>Number of samples that failed due to heating only for both conventional and microwave heating.</p>
Full article ">Figure 21
<p>Scanning electron microscope image of fracture surface of (<b>a</b>) conventionally heated bauxite (2) for 2 min at 900 °C in air (×500) and (<b>b</b>) microwave heated for 2 min at 1200 W in air (×1500). The highlighted areas were analyzed by energy dispersive X-ray spectroscopy (EDS) and consisted of mainly aluminum.</p>
Full article ">Figure 21 Cont.
<p>Scanning electron microscope image of fracture surface of (<b>a</b>) conventionally heated bauxite (2) for 2 min at 900 °C in air (×500) and (<b>b</b>) microwave heated for 2 min at 1200 W in air (×1500). The highlighted areas were analyzed by energy dispersive X-ray spectroscopy (EDS) and consisted of mainly aluminum.</p>
Full article ">
14 pages, 1248 KiB  
Article
Assessment of Materials and Rare Earth Metals Demand for Sustainable Wind Energy Growth in India
by Shalini Verma, Akshoy Ranjan Paul and Nawshad Haque
Minerals 2022, 12(5), 647; https://doi.org/10.3390/min12050647 - 20 May 2022
Cited by 15 | Viewed by 5893
Abstract
Wind energy is an alternative energy generation from non-renewable energy resources. The turbine is used to exploit wind energy. Different components of a wind turbine necessitate different materials and metals. There is a dependency of the materials on foreign countries. To avoid future [...] Read more.
Wind energy is an alternative energy generation from non-renewable energy resources. The turbine is used to exploit wind energy. Different components of a wind turbine necessitate different materials and metals. There is a dependency of the materials on foreign countries. To avoid future problems regarding the availability of these materials in India, it is necessary to forecast the quantity and the price of the materials and metals. Thus, this study mainly focuses on the estimation of the raw materials, rare earth, and critical metals used in manufacturing the wind turbine. Two wind turbines of 1.65 MW and 3.45 MW capacity, 78 m and 94 m hub height are considered for the study. The major raw materials are steel, aluminum, copper, cast iron, fiber glass with epoxy resin, and ceramic/glass. The requirement of rare earth elements (Nd) depends on the type of wind turbine direct drive or geared, and the type of generator used in the direct-drive wind turbine. The results estimated the requirement of materials and rare earth elements and the expected price in the future for 100% wind energy production in India. Full article
Show Figures

Figure 1

Figure 1
<p>Cumulative wind power capacity trend in India between 2011 and 2021 [<a href="#B32-minerals-12-00647" class="html-bibr">32</a>,<a href="#B33-minerals-12-00647" class="html-bibr">33</a>].</p>
Full article ">Figure 2
<p>Potential of wind energy in India at 120 m AGL [<a href="#B35-minerals-12-00647" class="html-bibr">35</a>].</p>
Full article ">Figure 3
<p>Rare earth and special metal demand for wind turbine technology estimated in kg/MW [<a href="#B30-minerals-12-00647" class="html-bibr">30</a>,<a href="#B31-minerals-12-00647" class="html-bibr">31</a>].</p>
Full article ">Figure 4
<p>Variation in demand of Nd.</p>
Full article ">
31 pages, 5297 KiB  
Article
Mineral Paragenesis Precipitating in Salt Flat Pools of Continental Environments Replicated in Microbial Mat Microcosms without Evaporation
by Óscar Cabestrero, Cinthya Tebes-Cayo, Nancy W. Hinman and Cecilia Demergasso
Minerals 2022, 12(5), 646; https://doi.org/10.3390/min12050646 - 20 May 2022
Cited by 1 | Viewed by 2601
Abstract
Mineral precipitation can be observed in natural environments, such as lagoons, rivers, springs, and soils. The primary precipitation process has long been believed to be abiotic due to evaporation, leading to phase supersaturation. However, biotic interactions of microbial metabolism, organic compounds, and dissolved [...] Read more.
Mineral precipitation can be observed in natural environments, such as lagoons, rivers, springs, and soils. The primary precipitation process has long been believed to be abiotic due to evaporation, leading to phase supersaturation. However, biotic interactions of microbial metabolism, organic compounds, and dissolved ions leading to mineral precipitation has been shown in laboratory studies using single-organism culture. The increase in pH inducing calcium carbonate precipitation due to oxygenic photosynthesis by Cyanobacteria and the release of ions due to organic matter decomposition by Firmicutes-inducing magnesium carbonate precipitation are recognized examples. As microbes do not live as pure cultures in natural environments but form complex communities, such pure culture lab studies do not reflect natural conditions. In this study, we grew natural complex microbial communities in microcosm conditions using filtered brine as water column and two types of natural gypsum substrates, and we replenished incubations to avoid evaporation. We monitored microbial communities through optical microscopy and analyzed mineral paragenesis in association with and without microbes, using different analytical techniques, such X-ray diffraction, and optical and field emission scanning electron microscopies. To detect changes throughout the experiment, small amounts of water column brine were extracted for physicochemial determinations. We were able to detect mineral paragenesis, avoiding evaporation, including major phases of chemical sedimentary rocks, such as gypsum, calcium carbonate, and some silicates in association to microbes. In addition, we evidenced that the use of natural substrates positively impacts growth of microbial communities, promoting the development of more biomass. This study can be seen as the first attempt and proof of concept of differentiating biotic and abiotic participation in evaporitic deposits, as they can form mineral paragenesis without evaporation. Future studies with microcosm experiments using microbial mats will be needed to establish mineral precipitation induced by micro-organisms and their extracellular polymeric substances (EPS), specifically to replicate mineral paragenesis sedimented from natural brines. Full article
Show Figures

Figure 1

Figure 1
<p>(<b>A</b>) Location of the sampling sites in Chile. Overview images of the salt flat ponds in Salar de Pajonales (<b>B</b>) and Salar de Gorbea (<b>C</b>). Note: white and yellow mineral crusts are comprised mainly by gypsum and halite in (<b>B</b>) [<a href="#B23-minerals-12-00646" class="html-bibr">23</a>,<a href="#B37-minerals-12-00646" class="html-bibr">37</a>,<a href="#B40-minerals-12-00646" class="html-bibr">40</a>] and gypsum mixed with Al-Mg and K-Fe sulphates in (<b>C</b>) [<a href="#B38-minerals-12-00646" class="html-bibr">38</a>].</p>
Full article ">Figure 2
<p>Flow chart of the experimental design. (<b>A</b>) Sampling collection from pond edges (selected areas of the salt flats). (<b>B</b>) Two types of samples collected: water samples (blue flask) and microbial mats (green flask and green bottle). (<b>C</b>) Incubations using microbial mats (green) and controls (blue) evolving through time and growing biomass (green). (<b>D</b>) Subsampling of water from incubations and controls (Eppendorf) and microbial mats/minerals (fragment). (<b>E</b>) Observations of microbial mats/minerals under optical microscopy (<b>upper</b>) and electron microscopy (middle), as well as salinity/pH determinations (<b>lower</b>).</p>
Full article ">Figure 3
<p>Field photographs showing a representative sample area surrounding the ponds (darker blue zones in the map) of Salar de Pajonales (<b>A</b>), a detailed view of sediments in the sampled area (<b>B</b>), and a view showing the location of sampling points (red dots) in QGIS 3.12.3 (<b>C</b>). Imagery from Google Satellite. The same type of photographs and a map for Salar de Gorbea (<b>D</b>–<b>F</b>). Note the slimy appearance of dark green microbial mats in the surface of the sediments (<b>A</b>,<b>B</b>,<b>D</b>,<b>E</b>). The salar area is overlayed in purple, and grey lines correspond to drainage networks in (<b>C</b>,<b>F</b>). Dark areas inside the purple layer are water bodies, whereas the other parts are mainly sediments.</p>
Full article ">Figure 4
<p>Physicochemistry of Salar de Pajonales (PAJ) (<b>A</b>,<b>B</b>) and Salar de Gorbea (GOR) incubations (<b>C</b>,<b>D</b>). Salinity (<b>A</b>,<b>C</b>) and pH (<b>B</b>,<b>D</b>) of controls (Ctr) and microbial mat samples with and without substrates (NS) over &gt;500 days. The substrates used were fine gypsum (FG) and coarse gypsum (CG). Dashed red lines indicate delimitations of incubation stabilization and stabilized brines after the red lines. Note that different pH and salinity scales were used for PAJ and GOR incubations to maximize the visualization of stabilization fluctuations.</p>
Full article ">Figure 5
<p>Principal coordinates analysis (PCO) the Euclidian distance matrix of normalized data (pH and salinity from the beginning of the experiment) between samples: no substrate (NS), fine gypsum (FG), coarse gypsum (CG); and controls: control with no substrate (CNS), control with coarse gypsum (CCG) from Salar de Pajonales (PAJ) and Salar de Gorbea (GOR) during the incubation time. The graph shows the meaningful relationship (distance) between samples as close (1.3), intermediate (2.6), and distant (3.8). Samples with high salinity and pH values loaded positively on the PCO1, whereas low-salinity and low-pH values loaded negatively on PCO1.</p>
Full article ">Figure 6
<p>Set of representative macromorphological and microscopic checkups for Salar de Pajonales (PAJ) and Salar de Gorbea (GOR) microbial mat containers from the beginning of the experiment to &gt;500 days. (<b>A</b>) Side view of PAJ-11 container with a cloudy water column 7 days after starting the experiment. Bright-light microphotographs showing that clouds were due to 4 µm diatoms in cell division, such as <span class="html-italic">Amphora</span> genus morphotypes, from the PAJ-16 incubation (<b>B</b>) and compatible with <span class="html-italic">Dactylococcopsis</span> genus colonies from the PAJ-17 incubation (<b>C</b>). (<b>D</b>) Field emission scanning electron microscope (FE-SEM) photomicrograph of <span class="html-italic">Bacillariophyceae</span> distinctly shaped diatoms (mat crowded predominantly by <span class="html-italic">Amphora</span>, <span class="html-italic">Navicula</span>, and <span class="html-italic">Cocconeis</span> genera) without mineral precipitates in the PAJ-14 incubation. (<b>E</b>) Side view of whitish-to-yellowish PAJ-16 mat incubated with fine gypsum substrate after 30 days. The mat was firmly attached to the substrate, retaining gas bubbles under the gels below a clear water column. (<b>F</b>) Spherical, unicellular cyanobacterial cells (10–15 µm) compatible with <span class="html-italic">Chroococcidiopsis</span> genus shown in a bright-light microphotograph in the PAJ-12 incubation. Two filaments compatible with <span class="html-italic">Oscillatoria</span> genus and algae individuals are also shown. (<b>G</b>) The same view as (<b>F</b>) under an HBO 100W Hg lamp burner in which photosynthetic pigments were excited, showing autofluorescence of the cells. (<b>H</b>) FE-SEM microphotograph displaying a similar view as (<b>F</b>,<b>G</b>) of coccoid cells agglutinated in extracellular polymeric substances (EPS) in the PAJ-12 incubation. (<b>I</b>) Side view of orange detached/floating mat of PAJ-17, packed with gas bubbles, incubated without substrate after 60 days. (<b>J</b>) The orange gel contained many micro-organisms. Among the observable micro-organisms, long cyanobacterial filaments, diatoms, and sulfur-oxidizing bacteria (black arrow) with visible intracellular sulfur globules compatible with <span class="html-italic">Oscillatoria, Navicula, and Chromatium</span> genera, respectively, stand out, as seen by bright light. (<b>K</b>) The same view as in (<b>J</b>) under an HBO 100W Hg lamp burner. (<b>L</b>) FE-SEM microphotograph of nanometric oval-shaped and bacillar micro-organisms from the GOR-2 incubation. (<b>M</b>) Overhead view of the layered PAJ-11 mat, which developed pinnacle structures (white arrow) after 300 days of incubation. Bright-light (<b>N</b>) and fluorescence microphotographs (<b>O</b>) of unknown 2–5 µm spherical, fluorescent cells and diatom cells compatible with the <span class="html-italic">Nitzschia</span> genus in the GOR-16 incubation. (<b>P</b>) FE-SEM microphotograph of 20 µm diatoms resembling the <span class="html-italic">Amphora</span> genus embedded within a sticky EPS (white arrow) in the PAJ-12 incubation.</p>
Full article ">Figure 7
<p>Representative X-ray diffractions of microbial mat samples. (<b>A</b>) Semi-quantification of crystalline phases showed 95% gypsum and 5% calcite (Cc) in a Salar de Pajonales microbial mat (PAJ-10). (<b>B</b>) A second microbial mat from Salar de Gorbea (GOR-16) showed 49% halite (Hl), 25% gypsum (Gp), 13% polyhalite (PHl), 11% clay minerals, and 2% sylvite (Sy). Am = amorphous phases (not semi-quantified). Reflection peaks surpass 1200 counts in the GOR mat in contrast with PAJ mat, which shows a lower crystallinity. Note that sylvite, polyhalite, and part of the halite present may be a consequence of the sample preparation. These minerals may have precipitated during the dehydration of interstitial brine contained in the sample.</p>
Full article ">Figure 8
<p>FE-SEM images of (<b>A</b>) coarse-grained and (<b>B</b>) fine-grained substrates. Note the exfoliation planes in the parallel lines of gypsum grains in (<b>A</b>) (red arrows) and imperfect fractures in (<b>A</b>,<b>B</b>) (black arrows).</p>
Full article ">Figure 9
<p>FE-SEM microphotographs of minerals seen in the incubations up to 60 days from the start of the experiment. (<b>A</b>) Hemibipyramidal gypsum (Gp) crystal that precipitated within the first month over granular extracellular polymeric substances (EPS) in a Salar de Gorbea incubation (GOR-2). This granulated morphology was attributed to the numerous coccoid and bacillar cells agglutinated inside the EPS. Energy-dispersive x-ray spectra (EDX) of the red circle point of analyses are displayed as an insert in the upper right corner. (<b>B</b>) Prismatic gypsum crystals with sharp faces protruding from the extracellular matrix (EPS) beside a <span class="html-italic">Navicula</span> sp. frustule (Dia) from a Salar de Pajonales incubation (PAJ-11). (<b>C</b>) Prismatic gypsum crystals over EPS from the PAJ-17 incubation. Lenticular gypsum crystals surrounded by large and small diatoms (Dia) of <span class="html-italic">Amphora</span> (<b>D</b>,<b>E</b>) in PAJ-12 and <span class="html-italic">Entomoneis</span> (<b>E</b>) in PAJ-11 incubations, and small diatoms compatible with <span class="html-italic">Cocconeis</span> genus (<b>E</b>), all of which were embedded within EPS. (<b>F</b>) Elongated gypsum crystals diverging from a common nucleating point over a frustule layer (Dia) in a GOR-16 incubation. Note the circular shape of the crystal group resembling filaments. Groups of halite (Hl) nodules (<b>G</b>) and euhedral halite cubes (<b>H</b>) embedded within EPS in a PAJ-17 incubation. Note the EDX spectra in (<b>G</b>). (<b>I</b>) Sawtooth-shaped octahedral halite crystals grown from an EPS matrix in a GOR-16 incubation.</p>
Full article ">Figure 10
<p>New minerals identified in the following field emission scanning electron microscope (FE-SEM) checkups after two months of running microcosms. All of them correspond to Salar de Pajonales incubations. (<b>A</b>) Highly porous calcite crystals (Cc) surrounded by dispersed <span class="html-italic">Amphora</span> frustules (Dia) from the PAJ-10 incubation. Zoomed view of a single crystal at the right side. (<b>B</b>) Calcitic grains emerging from denatured extracellular polymeric substances (EPS) enclosed by partially dissolved diatom frustules (Dia) from the PAJ-15 incubation. Spot (red circle) EDX shows Si enrichment. (<b>C</b>) Botryoidal opal aggregates (Op) near <span class="html-italic">Amphora</span> frustules (Dia) from the PAJ-2.1 incubation. Spot (red circle) EDX spectra in the upper right. (<b>D</b>) PAJ-15 incubation showing similar grains as in (<b>B</b>) emerging from a glutinous EPS. In contrast to (<b>B</b>), spot (red circle) EDX confirmed magnesium silicate composition of proto-phyllosilicate minerals (protoclay-pCl). Note the internal nanometric fiber-like structure.</p>
Full article ">Figure 11
<p>A photograph (<b>A</b>) and two photomicrographs (<b>B</b>,<b>C</b>) of abiotic crystals obtained from the evaporation control (CGOR-1) at different scales: (<b>A</b>) macro view of the transparent gypsum crystals in its precipitation solution under glass and micro views of optical microscopy (<b>B</b>) and FE-SEM (<b>C</b>). Crystals are c-axis-elongated with very sharp edges. Some of them are fishtail-twinned in (<b>C</b>).</p>
Full article ">
22 pages, 6609 KiB  
Review
The Gel Growth Technique—A Neglected Yet Effective Tool to Prepare Crystals of Oxysalts and Supergene Minerals
by Dominik Talla and Andreas Wagner
Minerals 2022, 12(5), 645; https://doi.org/10.3390/min12050645 - 20 May 2022
Cited by 2 | Viewed by 2327
Abstract
The technique of crystal growth in gels has nowadays become somewhat neglected in the scope of earth sciences, to the disadvantage of the experimental mineralogist. Even preparing an inorganic silica gel can prove a challenge to many, let alone successfully configure the entire [...] Read more.
The technique of crystal growth in gels has nowadays become somewhat neglected in the scope of earth sciences, to the disadvantage of the experimental mineralogist. Even preparing an inorganic silica gel can prove a challenge to many, let alone successfully configure the entire experiment. Based not only on previous literature but also on our extensive experience, crystals of many substances, including supergene minerals as reference standards, can be successfully grown in gel, aiding in accomplishing various research goals in earth sciences. Instead of providing the reader with an overwhelming compendium of historical information and theoretical knowledge of the subject which can be found elsewhere, we presented herein a comprehensive, practically oriented guide to the understanding and successful use of the technique of crystal growth in gels, mentioning, in addition to the general principle, the numerous pitfalls which we encountered during our own use of the method, and the ways to overcome them. Despite that the procedure is nowadays used mainly for the laboratory synthesis of organic or metal-organic compounds, we believe it to be a valuable asset to any mineralogist, and often, the only way to obtain inorganic reference material of a particular mineral of interest. Full article
(This article belongs to the Special Issue Mineral-Related Oxo-Salts: Synthesis and Structural Crystallography)
Show Figures

Figure 1

Figure 1
<p>Examples of ‘Liesegang rings’: (<b>a</b>) Rings composed of Na<sub>2</sub>Cu(OH)<sub>4</sub> colloid precipitate; (<b>b</b>) Rings composed of fine metallic Cu crystals. The diameter of the test tube is 1 cm in both frames. For other details regarding the experimental setup, the reader is referred to <a href="#minerals-12-00645-t0A1" class="html-table">Table A1</a>.</p>
Full article ">Figure 2
<p>A rounded crystal of calcite, CaCO<sub>3</sub>, containing a radial spherulite at its core due to too strong a gel.</p>
Full article ">Figure 3
<p>Basic setups of a gel growth experiment: (<b>a</b>) Single-diffusion setup; (<b>b</b>) Double-diffusion (counter-diffusion) setup.</p>
Full article ">Figure 4
<p>Gypsum crystals obtained using the single-diffusion setup with equal concentration (1 mol/L) of both reagents—CaCl<sub>2</sub> and Na<sub>2</sub>SO<sub>4</sub>: (<b>a</b>) Twinned crystals form in silica gel; (<b>b</b>) The use of 1% agar gel yields untwinned better crystals.</p>
Full article ">Figure 5
<p>A clear untwinned gypsum crystal grown in the supernatant section (arrow) in comparison with crystal aggregates from the gel.</p>
Full article ">Figure 6
<p>Crystals of chalcomenite, CuSeO<sub>3</sub>∙2H<sub>2</sub>O, grown by a reaction between 0.3 m CuCl<sub>2</sub> in gel and 1 m H<sub>2</sub>SeO<sub>3</sub> supernatant solution in both cases: (<b>a</b>) Finer crystals formed on top of silica gel; (<b>b</b>) Coarse well-developed crystals formed within a 1% agar gel.</p>
Full article ">Figure 7
<p>Types of reaction product: (<b>a</b>) Colloid of metallic Ag; (<b>b</b>) Spherulites of Cu-oxalate dihydrate; (<b>c</b>) Crystals of Ag-oxalate; (<b>d</b>) ‘Salt lid’ composed of bayerite and minor Cu(OH)<sub>2</sub>. The diameter of the test tubes in (<b>a</b>,<b>c</b>,<b>d</b>) is 1 cm.</p>
Full article ">Figure 8
<p>Influence of reagent concentration on the character of the product: (<b>a</b>) Crystals of calcite with CaCl<sub>2</sub> and Na<sub>2</sub>CO<sub>3</sub> concentrations set to 0.25 mol/L; (<b>b</b>) Radial spherulites (cross-section, crossed polars) are the only product with 0.05 mol/L reagent concentration in use.</p>
Full article ">Figure 9
<p>Due to its higher crystallization pressure, brushite, CaHPO<sub>4</sub>∙2H<sub>2</sub>O, grows as centimeter-sized laths, cross-cutting Liesegang rings of hydroxylapatite, Ca<sub>5</sub>(PO<sub>4</sub>)<sub>3</sub>(OH).</p>
Full article ">Figure 10
<p>Influence of reagent position on the character of the product: (<b>a</b>) Macroscopic crystals of copper formed with 0.3 m CuSO<sub>4</sub> in gel and 1 m L-ascorbic acid as supernatant; (<b>b</b>) the opposite configuration (L-ascorbic acid used for gelling of the silica gel and CuSO<sub>4</sub> in supernatant) yielded only very fine metallic powder and colloid. The diameter of the test tube is 1 cm in both cases.</p>
Full article ">Figure 11
<p>Influence of reducing agent on the shape of the resulting Cu crystals: (<b>a</b>) Spindles, cubes and polygonal individuals with L-ascorbic acid in use; (<b>b</b>) Cu octahedra obtained with hydrazine in use.</p>
Full article ">Figure 12
<p>Clear untwinned crystals of gypsum, CaSO<sub>4</sub>∙2H<sub>2</sub>O, grown in silica gel with AlCl<sub>3</sub> additive.</p>
Full article ">Figure 13
<p>Failed extraction of CuCl crystals from gel: (<b>a</b>) Undamaged product, extracted mechanically; (<b>b</b>) Cu-coated and partly dissolved crystals after thermal treatment of the gel with addition of NaOH.</p>
Full article ">Figure 14
<p>‘Cusps’, cracks in gel which have been pushed away by the growing crystal, can sometimes be seen macroscopically, such as in this example of sodium hydrogenoxalate dihydrate, NaH(OOC)<sub>2</sub>∙2H<sub>2</sub>O, grown in a HCl-acidified silica gel, acted upon by 1 m oxalic acid.</p>
Full article ">Figure 15
<p>Hybrid gel setups: (<b>a</b>) Single-diffusion variant [<a href="#B43-minerals-12-00645" class="html-bibr">43</a>]; (<b>b</b>) Double-diffusion variant. The void initially contains the heavy NH<sub>4</sub>NO<sub>3</sub> or (NH<sub>4</sub>)<sub>2</sub>SO<sub>4</sub> solution.</p>
Full article ">Figure 16
<p>Hybrid gel setup to obtain PbCrO<sub>4</sub> (krokoite) crystals. (<b>a</b>) Schematic representation of the experiment; (<b>b</b>) Detail of the reaction alcove with the orange PbCrO<sub>4</sub> product. Note the white layer of the insoluble Pb(OH)<sub>2</sub> reagent on the bottom of the test tube.</p>
Full article ">Figure 17
<p>Various crystals obtained by the hybrid gel technique with a sparingly soluble reagent. (<b>a</b>) Crystals of churchite-(Y); (<b>b</b>) Crystals of anglesite; (<b>c</b>) Fibrous crystals of rhabdophane-(Ce).</p>
Full article ">Figure 18
<p>Single crystal of erythrite formed after primary erythrite lumps due to a secondary pH increase in gel by the use of a 2.5% NH<sub>4</sub>OH supernatant.</p>
Full article ">Figure 19
<p>Single crystals of teineite grown by direct contact of a 0.3 m CuCl<sub>2</sub> solution and TeO<sub>2</sub> powder.</p>
Full article ">
9 pages, 1546 KiB  
Article
A Chemical Separation and Measuring Technique for Titanium Isotopes for Titanium Ores and Iron-Rich Minerals
by Ryan Mathur, Christopher Emproto, Adam C. Simon, Linda Godfrey, Charles Knaack and Jeffery D. Vervoort
Minerals 2022, 12(5), 644; https://doi.org/10.3390/min12050644 - 20 May 2022
Cited by 3 | Viewed by 1828
Abstract
Ti-isotope fractionation on the most Ti-rich minerals on Earth has not been reported. Therefore, we present a chemical preparation and separation technique for Ti-rich minerals for mineralogic, petrologic, and economic geologic studies. A two-stage ion-exchange column procedure modified from the previous literature is [...] Read more.
Ti-isotope fractionation on the most Ti-rich minerals on Earth has not been reported. Therefore, we present a chemical preparation and separation technique for Ti-rich minerals for mineralogic, petrologic, and economic geologic studies. A two-stage ion-exchange column procedure modified from the previous literature is used in the current study to separate Ti from Fe-rich samples, while α-TiO2 does not require chemical separation. Purified solutions in conjunction with solution standards were measured on two different instruments with dry plasma and medium-resolution mode providing mass-dependent results with the lowest errors. 49/47TiOL-Ti for the solution and solids analyzed here demonstrate a range of >5 far greater than the whole procedural 1 error of 0.10 for a synthetic compound and 0.07 for the mineral magnetite; thus, the procedure produces results is resolvable within the current range of measured Ti-isotope fractionation in these minerals. Full article
Show Figures

Figure 1

Figure 1
<p>Plot showing the elution flux as a percentage of the cumulative solute at each elution step for the MP-1 resin.</p>
Full article ">Figure 2
<p>Plot showing the elution flux as a percentage of the cumulative solute at each elution step for the MP-1 resin. The changing colors indicate different acids eluted from the resin to purify the samples (from right to left, 12 molar nitric acid +sample, 12 molar nitric acid rinse, 12 molar nitric acid with 0.1%H<sub>2</sub>O<sub>2</sub>, and 2 molar nitric acid).</p>
Full article ">Figure 3
<p>Plot showing Ti-mass dependence for samples with a slope of c. 1.5 and a high coefficient of determination, indicating that the matrix was successfully removed. Black squares represent materials analyzed.</p>
Full article ">Figure 4
<p>Linearity of the Ti-isotope measurements demonstrating that Ti-isotope values at twice the concentration of the bracketing standard still produce similar values. The black squares are the measured values of the sample at different voltages.</p>
Full article ">
19 pages, 7523 KiB  
Article
Temperature Variation Characteristics and Model Optimization of Flocculation Sedimentation of Overflow Ultra-Fine Iron Tailings
by Fusheng Niu, Hongmei Zhang, Jinxia Zhang and Xiaodong Yu
Minerals 2022, 12(5), 643; https://doi.org/10.3390/min12050643 - 20 May 2022
Cited by 2 | Viewed by 1986
Abstract
In order to study the effect of temperature on the settling characteristics of overflow ultra-fine iron tailings, the settling velocity of overflow ultra-fine iron tailings at eight different temperatures at 10–80 °C was experimentally studied. The results show that, with the increase in [...] Read more.
In order to study the effect of temperature on the settling characteristics of overflow ultra-fine iron tailings, the settling velocity of overflow ultra-fine iron tailings at eight different temperatures at 10–80 °C was experimentally studied. The results show that, with the increase in slurry temperature, the flocculation settling velocity of overflow ultra-fine iron tailings increases first and then decreases. That is, when the temperature is less than 60 °C, the settling velocity of flocs increases with the increase in temperature. When the temperature is 60 °C, the settling velocity reaches the maximum 5.66 mm/s. When the temperature is more than 60 °C, the settling velocity of tailings flocs gradually decreases. In addition, with the increase in the test temperature, when the temperature is less than 60 °C, the particle size, fractal dimension, and density of tailings flocculant gradually increase, the gap of flocculant structure gradually decreases, and the floc structure becomes denser. When the temperature is higher than 60 °C, the particle size, fractal dimension, and density of flocs gradually decrease, and the gap between flocs is larger than that at 60 °C. On this basis, the temperature model of overflow ultra-fine iron tailings is established according to the analysis of particle settling process, and the settling model was optimized according to different settling areas. The mean absolute error between the optimized settling velocity and the actual velocity is 0.007, the root mean square error is 0.002, and the error is small. The theoretical calculation results are in good agreement with the experimental data, and the optimized flocculation settling model has an important role in promoting the theoretical study of the flocculation settling of such ultra-fine iron mineral particles, and can be used to guide the sedimentation and separation system to achieve good sedimentation treatment effect under the best working conditions as required. Full article
(This article belongs to the Section Mineral Processing and Extractive Metallurgy)
Show Figures

Figure 1

Figure 1
<p>Particle size distribution of overflow ultra-fine iron tailings.</p>
Full article ">Figure 2
<p>XRD analysis of overflow ultra-fine iron tailings.</p>
Full article ">Figure 3
<p>Image of flocs processed by Image-Pro Plus 6.0.</p>
Full article ">Figure 4
<p>Particle settling process and forces <math display="inline"><semantics> <mrow> <msub> <mi mathvariant="normal">F</mi> <mi mathvariant="normal">g</mi> </msub> </mrow> </semantics></math>, <math display="inline"><semantics> <mrow> <msub> <mi mathvariant="normal">F</mi> <mi mathvariant="normal">b</mi> </msub> </mrow> </semantics></math>, and <math display="inline"><semantics> <mrow> <msub> <mi mathvariant="normal">F</mi> <mi mathvariant="normal">d</mi> </msub> </mrow> </semantics></math>.</p>
Full article ">Figure 5
<p>Relationship between tailings settling velocity and time at different temperatures.</p>
Full article ">Figure 6
<p>Relationship between tailings settling velocity and temperature at different times.</p>
Full article ">Figure 7
<p>Average particle size and fractal dimension of floc at different temperatures: (<b>a</b>) 10 °C, (<b>b</b>) 20 °C, (<b>c</b>) 30 °C, (<b>d</b>) 40 °C, (<b>e</b>) 50 °C, (<b>f</b>) 60 °C, (<b>g</b>) 70 °C, (<b>h</b>) 80 °C.</p>
Full article ">Figure 7 Cont.
<p>Average particle size and fractal dimension of floc at different temperatures: (<b>a</b>) 10 °C, (<b>b</b>) 20 °C, (<b>c</b>) 30 °C, (<b>d</b>) 40 °C, (<b>e</b>) 50 °C, (<b>f</b>) 60 °C, (<b>g</b>) 70 °C, (<b>h</b>) 80 °C.</p>
Full article ">Figure 8
<p>Microstructure and morphology of floc sedimentation at different temperatures: (<b>a</b>) 10 °C, (<b>b</b>) 20 °C, (<b>c</b>) 30 °C, (<b>d</b>) 40 °C, (<b>e</b>) 50 °C, (<b>f</b>) 60 °C, (<b>g</b>) 70 °C, (<b>h</b>) 80 °C.</p>
Full article ">Figure 9
<p>Comparison between model and actual settling velocity.</p>
Full article ">
23 pages, 699 KiB  
Review
Vanadium: A Review of Different Extraction Methods to Evaluate Bioavailability and Speciation
by Jie Yang, Yunlong Wang, Xiaohui Gao, Rui Zuo, Liuting Song, Chenhui Jin, Jinsheng Wang and Yanguo Teng
Minerals 2022, 12(5), 642; https://doi.org/10.3390/min12050642 - 20 May 2022
Cited by 11 | Viewed by 3720
Abstract
The excessive input of heavy metals such as vanadium (V) into the environment has been one of the consequences of global industrial development. Excessive exposure to V can pose a potential threat to ecological safety and human health. Due to the heterogeneous composition [...] Read more.
The excessive input of heavy metals such as vanadium (V) into the environment has been one of the consequences of global industrial development. Excessive exposure to V can pose a potential threat to ecological safety and human health. Due to the heterogeneous composition and reactivity of the various elements in soils and sediments, quantitative analysis of the chemical speciation of V in different environmental samples is very complicated. The analysis of V chemical speciation can further reveal the bioavailability of V and accurately quantify its ecotoxicity. This is essential for assessing for exposure and for controlling ecological risks of V. Although the current investigation technologies for the chemical speciation of V have grown rapidly, the lack of comprehensive comparisons and systematic analyses of these types of technologies impedes a more comprehensive understanding of ecosystem safety and human health risks. In this review, we studied the chemical and physical extraction methods for V from multiple perspectives, such as technological, principle-based, and efficiency-based, and their application to the evaluation of V bioavailability. By sorting out the advantages and disadvantages of the current technologies, the future demand for the in situ detection of trace heavy metals such as V can be met and the accuracy of heavy metal bioavailability prediction can be improved, which will be conducive to development in the fields of environmental protection policy and risk management. Full article
(This article belongs to the Special Issue Concentration and Distribution of Heavy Metals in Soils)
Show Figures

Figure 1

Figure 1
<p>The absorption and transformation of V in plants.</p>
Full article ">
20 pages, 6993 KiB  
Article
Fluid Inclusion and Chemical Composition Characteristics of Emeralds from Rajasthan Area, India
by Li-Jie Qin, Xiao-Yan Yu and Hong-Shu Guo
Minerals 2022, 12(5), 641; https://doi.org/10.3390/min12050641 - 20 May 2022
Cited by 8 | Viewed by 3260
Abstract
Emerald is among the most valuable gems in the world. Over the past decade, its commercial value and geographic origin have been the focus of gemological and geological research. In this study, emerald samples from India were examined by UV-Vis-NIR, FTIR, Raman spectra [...] Read more.
Emerald is among the most valuable gems in the world. Over the past decade, its commercial value and geographic origin have been the focus of gemological and geological research. In this study, emerald samples from India were examined by UV-Vis-NIR, FTIR, Raman spectra analysis, EPMA, and LA-ICP-MS. Hexagonal three- and multi-phase inclusions are first reported in Indian emeralds, containing gas bubbles (CO2 or CO2 + CH4), water or liquid mixtures of H2O + CO2, and solid phases inclusions (rounded crystals of siderite and dolomite, platelets of phlogopite, and magnesite). Mineral inclusions in Indian emeralds typically included phlogopite, quartz, talc, aragonite, and albite. The representative UV-Vis-NIR spectra show a distinct Fe absorption band, and one of the more typical characteristics of Indian emeralds is that the absorption strength of Fe3+ (369 nm) and Fe2+ (851 nm) is greater than that of Cr3+ (426, 606, 635, and 680 nm). Infrared spectra show that the absorption of type II H2O is stronger than that of type I H2O. LA-ICP-MS results show that Indian emeralds contain high alkali metals (10,503–16,964 ppmw; avg. 13,942 ppmw), moderate Fe (2451–4153 ppmw; avg. 3468 ppmw), low V (37–122 ppmw; avg. 90 ppmw), and the content of Cr (106–6310 ppmw) varies in a wide range. From a greenish-white core to a medium-green rim, the content of Fe, V, Cr, Sc, Cs, Rb, and Ga gradually increases in emerald with color band. Full article
Show Figures

Figure 1

Figure 1
<p>Simplified geological map of the Rajasthan Emerald Belt, NW India, situated approximately at the contact between the Delhi System, to the NW (calc-silicate rocks, limestones, sandstones, schists, and gneisses), and the Aravalli System, to the SE (mostly schists and gneisses). Modified from [<a href="#B15-minerals-12-00641" class="html-bibr">15</a>,<a href="#B20-minerals-12-00641" class="html-bibr">20</a>,<a href="#B32-minerals-12-00641" class="html-bibr">32</a>].</p>
Full article ">Figure 2
<p>Indian emerald crystals (weight ranging from 2.59 to 13.31 ct in this photo) for this study.</p>
Full article ">Figure 3
<p>(<b>a</b>) Sample 94-5: White albite at one end of the surface of the hexagonal column and platelets of phlogopite; (<b>b</b>) Sample 94-4: Phlogopite and aragonite on emerald surfaces.</p>
Full article ">Figure 4
<p>(<b>a</b>) Sample 94-5: Hexagonal color zones with green, white, and light green from the middle to the rim; (<b>b</b>) Sample 94-6: Hexagonal color zones with a white core and green at the rim. Field of view 20 mm.</p>
Full article ">Figure 5
<p>(<b>a</b>) Platelets of phlogopite were widespread in the Indian emerald samples; (<b>b</b>) Long columnar black quartz was observed in sample 94-6; (<b>c</b>) Short columnar black mineral was present in sample 94-8; (<b>d</b>) White cloud solid inclusion was observed in sample 127-9; (<b>e</b>) Sample 127-2 contains black inclusions and disorderly distributed acicular inclusions; (<b>f</b>) Talc mineral was identified in sample 94-5; (<b>g</b>) Cloud of tubes form a rain-like inclusion parallel to the c-axis in sample 94-8; and (<b>h</b>) A group of parallel needle-like inclusions were seen in sample 127-10.</p>
Full article ">Figure 6
<p>(<b>a</b>,<b>b</b>) Irregularly shaped two- and three-phase inclusions in Indian emerald; (<b>c</b>) Two-phase rectangular inclusions contained an elliptical gas bubble; and (<b>d</b>) Groups of Irregular fluid inclusion.</p>
Full article ">Figure 7
<p>Three- and multi-phase inclusions showed a hexagonal outline in Indian emeralds.</p>
Full article ">Figure 8
<p>This hexagonal inclusion in Indian emerald clearly displays a gas bubble and a colorless crystal. Raman spectroscopy was used to identify the host emerald (green), the liquid phase: water (red), the CO<sub>2</sub> gas bubble (blue), and the siderite crystal (purple). The spectra are stacked for clarity.</p>
Full article ">Figure 9
<p>This multi-phase inclusion in Indian emerald clearly displays a gas bubble and some solid crystal inclusions. Raman spectroscopy was used to identify the host emerald (green), the liquid mixtures of H<sub>2</sub>O + CO<sub>2</sub> phase (red), the CO<sub>2</sub> + CH<sub>4</sub> gas bubble (blue), and the dolomite crystal (purple). The spectra are stacked for clarity.</p>
Full article ">Figure 10
<p>This multi-phase inclusion in Indian emerald clearly displays a gas bubble and some solid crystal inclusions. Raman spectroscopy was used to identify the host emerald (green), the liquid phase: water (red), the CO<sub>2</sub> + CH<sub>4</sub> gas bubble (blue), the phlogopite crystal (purple), and the magnesite crystal (yellow). The spectra are stacked for clarity.</p>
Full article ">Figure 11
<p>Representative UV-Vis-NIR spectra of samples 94-6 Indian emeralds.</p>
Full article ">Figure 12
<p>The representative FTIR spectrum of the two directions in the range of 4000–2000 cm<sup>−1</sup>.</p>
Full article ">Figure 13
<p>The representative FTIR spectrum in the range of 7200–4000 cm<sup>−1</sup> (E⊥C) illustrating type I and type II H<sub>2</sub>O observed in Indian emeralds.</p>
Full article ">Figure 14
<p>Plot of lithium (Li) versus cesium (Cs) concentrations from LA-ICP-MS analyses. Data are expressed in ppmw. Other sources are from [<a href="#B1-minerals-12-00641" class="html-bibr">1</a>,<a href="#B4-minerals-12-00641" class="html-bibr">4</a>,<a href="#B53-minerals-12-00641" class="html-bibr">53</a>,<a href="#B56-minerals-12-00641" class="html-bibr">56</a>].</p>
Full article ">Figure 15
<p>A log plot of lithium (Li) versus scandium (Sc) concentrations in emeralds from sixteen deposits. Data are expressed in ppmw. Sources of data are the same as <a href="#minerals-12-00641-f014" class="html-fig">Figure 14</a>.</p>
Full article ">Figure 16
<p>A log-log plot of chromium (Cr) versus vanadium (V) concentrations in emeralds from sixteen deposits. Data are expressed in ppmw. Sources of data are the same as in <a href="#minerals-12-00641-f014" class="html-fig">Figure 14</a>.</p>
Full article ">Figure 17
<p>Representative photomicrograph of color zoned emerald crystal 94-6 with a greenish-white core and a medium-green rim. The red circles indicate the positions of analysis points corresponding to analyses 94-6-1 to 94-6-6. LA-ICP-MS data for selected trace element analysis from 94-6-1 to 94-6-6. Plots of V, Cr, Fe, Sc, Ga, Rb, and Cs are used to highlight compositional changes, with uneven ordinate scales for clearer display.</p>
Full article ">
17 pages, 4581 KiB  
Article
Analytical and Numerical Solution for Better Positioning in Mines with Potential Extending Application in Space Mining
by Danijela Ignjatović Stupar, Vukan Ogrizović, Janez Rošer and Goran Vižintin
Minerals 2022, 12(5), 640; https://doi.org/10.3390/min12050640 - 19 May 2022
Cited by 6 | Viewed by 2414
Abstract
Application of new technologies and operational methodologies in mining sector targets to obtain a beneficial outcome in the long term. Instrumentation and monitoring systems for shafts, underground tunneling, storing faculties, etc. are often automated. Implemented systems provide data of mines state, integrated enhanced [...] Read more.
Application of new technologies and operational methodologies in mining sector targets to obtain a beneficial outcome in the long term. Instrumentation and monitoring systems for shafts, underground tunneling, storing faculties, etc. are often automated. Implemented systems provide data of mines state, integrated enhanced protection, and early warning solutions. Navigation and positioning in mines are deemed to be unstable in parts of mining tunnels when the external reference points are very far apart, thus significantly increasing the error of the internal network. This paper demonstrates a simulation of an innovative analytical and numerical solution for better positioning in the mines, yielding to increased accuracy of the control points, while reducing the time needed for performing measurements. Based on real tunnel dimensions, different control network configurations are tested. Statistical analysis of simulated environments and virtual measurements, created by combining various instrumentation, confirms cm-level positioning accuracy. The innovative approach to a mine control network design is based on involving fixed-length bars in the network design, gaining in shorter measurements sessions, but keeping homogeneous accuracy throughout the network. The concept is tested on 27 simulated network configurations, combining network points distribution and measurement accuracy of distances and angles. Obtained results and statistical analysis prove that consistent cm-level accuracy can be expected within the network. Extending the concept to space mining, which is becoming an attractive destination for chasing the rare-earth elements (REEs), this methodology will be a spin-off for space exploration mainly applicable in the Lunar lava tube positioning, which are the most secure place to settle the new human life. Full article
Show Figures

Figure 1

Figure 1
<p>Traversing through underground tunnels in Velenje Coal Mine. (<b>a</b>) Straight segment, (<b>b</b>) retro-reflector and total station.</p>
Full article ">Figure 2
<p>Six-points control network segment.</p>
Full article ">Figure 3
<p>Fixed-length bar.</p>
Full article ">Figure 4
<p>Location of the bar.</p>
Full article ">Figure 5
<p>Network connection via a vertical shaft. (<b>a</b>) Vertical projection, (<b>b</b>) horizontal projection.</p>
Full article ">Figure 6
<p>Point cloud of a mine segment. (<b>a</b>) Whole cloud (outside view), (<b>b</b>) view from inside, along the tunnel.</p>
Full article ">Figure 7
<p>Adjustment quality parameters.</p>
Full article ">Figure 8
<p>Eccentricity of error ellipses.</p>
Full article ">Figure 9
<p>Confidence intervals for dispersion factors.</p>
Full article ">
15 pages, 3977 KiB  
Article
A Kinetic Monte Carlo Approach to Model Barite Dissolution: The Role of Reactive Site Geometry
by Inna Kurganskaya, Nikolay Trofimov and Andreas Luttge
Minerals 2022, 12(5), 639; https://doi.org/10.3390/min12050639 - 18 May 2022
Cited by 6 | Viewed by 2133
Abstract
Barite (Ba[SO4]) is one of the promising candidates for sequestration of radioactive waste. Barite can incorporate radium (Ra) and form ideal solid solutions, i.e., (Ba,Ra)[SO4]. Together with isostructural celestite (Sr[SO4]), ternary solid solutions, (Ba,Sr,Ra)[SO4], may [...] Read more.
Barite (Ba[SO4]) is one of the promising candidates for sequestration of radioactive waste. Barite can incorporate radium (Ra) and form ideal solid solutions, i.e., (Ba,Ra)[SO4]. Together with isostructural celestite (Sr[SO4]), ternary solid solutions, (Ba,Sr,Ra)[SO4], may exist in natural conditions. Our fundamental understanding of the dissolution kinetics of isostructural sulfates is critically important for a better risk assessment of nuclear waste repositories utilizing this mineral for sequestration. So far, the barite-water interface has been studied with experimental methods and atomistic computer simulations. The direct connection between the molecular scale details of the interface structure and experimental observations at the microscopic scale is not yet well understood. Here, we began to investigate this connection by using a kinetic Monte Carlo approach to simulate the barite dissolution process. We constructed a microkinetic model for the dissolution process and identified the reactive sites. Identification of these sites is important for an improved understanding of the dissolution, adsorption, and crystal growth mechanisms at the barite–water interface. We parameterized the molecular detachment rates by using the experimentally observed etch pit morphologies and atomic step velocities. Our parameterization attempts demonstrated that local lattice coordination is not sufficient to differentiate between the kinetically important sites and estimate their detachment rates. We suggest that the water structure and dynamics at identified sites should substantially influence the detachment rates. However, it will require more work to improve the parameterization of the model by means of Molecular Dynamics and ab initio calculations. Full article
(This article belongs to the Special Issue Ion Adsorption at Mineral–Water Interfaces)
Show Figures

Figure 1

Figure 1
<p>A schematic drawing for elementary processes on crystalline surface, Kossel crystal model, first introduced in [<a href="#B29-minerals-12-00639" class="html-bibr">29</a>,<a href="#B30-minerals-12-00639" class="html-bibr">30</a>]. (<b>A</b>): Atomic step retreat during crystal dissolution; (<b>B</b>) Atomic step advancement during crystal growth. The letters “R” and “L” denote right and left kinks, that may have non-equivalent propagation rates in non-Kossel structures.</p>
Full article ">Figure 2
<p>Barite unit cell, ball, and stick model. (<b>A</b>): Side view; (<b>B</b>): top (001) view. The figure is produced by using XtalDraw 1.0 program [<a href="#B37-minerals-12-00639" class="html-bibr">37</a>].</p>
Full article ">Figure 3
<p>Workflow chart for the kinetic Monte Carlo program.</p>
Full article ">Figure 4
<p>Morphologies of simulated monolayer pits on barite (001) face by using different parameter sets and a schematic explanation for step velocities calculations. (<b>A</b>): Parameter set I excluding <span class="html-italic">Ba-O-Ba</span> coordination sphere, (<b>B</b>): Parameter set II including <span class="html-italic">Ba-O-Ba</span> coordination sphere, (<b>C</b>): Parameter set III including steric factors <math display="inline"><semantics> <mrow> <msubsup> <mi>w</mi> <mi>s</mi> <mi>i</mi> </msubsup> </mrow> </semantics></math>. White lines here are used as auxiliary lines perpendicular to the [010], <math display="inline"><semantics> <mrow> <mrow> <mo>[</mo> <mrow> <mover accent="true"> <mn>2</mn> <mo>¯</mo> </mover> <mn>10</mn> </mrow> <mo>]</mo> </mrow> <mo>,</mo> </mrow> </semantics></math> and <math display="inline"><semantics> <mrow> <mrow> <mo>[</mo> <mrow> <mover accent="true"> <mn>2</mn> <mo>¯</mo> </mover> <mn>10</mn> </mrow> <mo>]</mo> </mrow> </mrow> </semantics></math>-oriented atomic steps. Intersection points of those lines with step edges at two consecutive times steps were used to calculate step propagation increments <math display="inline"><semantics> <mrow> <mo>∆</mo> <msub> <mi>l</mi> <mi>i</mi> </msub> </mrow> </semantics></math>.</p>
Full article ">Figure 5
<p>Morphology of monolayer pits on barite surface. (<b>A</b>): Experimental data [<a href="#B14-minerals-12-00639" class="html-bibr">14</a>] (Kuwahara, Y, In situ hot-stage AFM study of the dissolution of the barite (001) surface in water at 30–55 °C, (2012), Am. Min., 97, 1564–1573, Copyright (2012), MSA, reproduced with the permission of the Mineralogical Society of America); (<b>B</b>): KMC simulations (this work, the parameter Set IV in the <a href="#minerals-12-00639-t001" class="html-table">Table 1</a>); (<b>C</b>): Primary crystallographic directions on the barite (001) face, white atoms in SO<sub>4</sub> groups correspond to 6-coordinated sites, while cyan atoms correspond to the 5-coordinated sites.</p>
Full article ">Figure 6
<p>Structure of steps and coordination of SO<sub>4</sub> step sites, number colors denote step type: red for step sites, yellow for kink sites. (<b>A</b>): [010] left step (slow); (<b>B</b>): [010] right step (fast); (<b>C</b>): <math display="inline"><semantics> <mrow> <mrow> <mo>[</mo> <mrow> <mover accent="true"> <mn>2</mn> <mo>¯</mo> </mover> <mn>10</mn> </mrow> <mo>]</mo> </mrow> </mrow> </semantics></math> straight step; (<b>D</b>): <math display="inline"><semantics> <mrow> <mrow> <mo>[</mo> <mrow> <mover accent="true"> <mn>2</mn> <mo>¯</mo> </mover> <mn>10</mn> </mrow> <mo>]</mo> </mrow> </mrow> </semantics></math> segmented step.</p>
Full article ">Figure 7
<p>Coordination of Ba step sites. (<b>A</b>): left (slow) [010] step; (<b>B</b>): right (fast) [010] step; (<b>C</b>): segmented [120] step; (<b>D</b>): straight <math display="inline"><semantics> <mrow> <mrow> <mo>[</mo> <mrow> <mover accent="true"> <mn>2</mn> <mo>¯</mo> </mover> <mn>10</mn> </mrow> <mo>]</mo> </mrow> </mrow> </semantics></math> step. “T” denotes here neighbors belonging to the uppermost terrace, the number before “T” denotes the number of those neighbors; N,M notation refers to the number of <span class="html-italic">Ba-O-S</span> and <span class="html-italic">Ba-O-Ba</span> bonds.</p>
Full article ">Figure 8
<p>Coordination of kink sites on barite (001) face. Yellow numbers show coordination of kink sites. Red numbers show coordination of terrace and step sites. (<b>A</b>): SO<sub>4</sub> sites at the left (slow) [010] step; (<b>B</b>): SO<sub>4</sub> sites at the right “fast” [010] step; (<b>C</b>): SO<sub>4</sub> sites at the segmented [120] step; (<b>D</b>): Ba kink site at the left (slow) [010] step; (<b>E</b>): Ba kink sites at the right (fast) [010] step; (<b>F</b>): overhanging Ba kink sites at the [120] step.</p>
Full article ">Figure 9
<p>Morphology of multilayer pits on barite (001) face forming in pure water. (<b>A</b>): Experimental data [<a href="#B14-minerals-12-00639" class="html-bibr">14</a>] (Kuwahara, Y, In situ hot-stage AFM study of the dissolution of the barite (001) surface in water at 30–55 °C, (2012), Am. Min., 97, 1564–1573, Copyright (2012), MSA, reproduced with the permission of the Mineralogical Society of America); (<b>B</b>): KMC simulations (this work).</p>
Full article ">
12 pages, 6430 KiB  
Article
A Feasibility Study of CSEM in Geological Advance Forecast with Horizontal Casing Well
by Jintai Li, Jianxin Liu, Jianqiang Xue, Rongwen Guo, Hang Chen and Rong Liu
Minerals 2022, 12(5), 638; https://doi.org/10.3390/min12050638 - 18 May 2022
Cited by 2 | Viewed by 1800
Abstract
With the rapid exploitation of deep mines by digging new tunnels, the advance forecast of water inrush has become increasingly important. The land-based controlled source electromagnetic method (CSEM) is commonly used to detect water-bearing structures. To increase its sensitivity, we propose a new [...] Read more.
With the rapid exploitation of deep mines by digging new tunnels, the advance forecast of water inrush has become increasingly important. The land-based controlled source electromagnetic method (CSEM) is commonly used to detect water-bearing structures. To increase its sensitivity, we propose a new measuring configuration for CSEM by placing EM sensors in an underground steel-cased well. The numerical modeling is conducted by COMSOL to overcome the difficulties of investigating the feasibility of the measuring configuration. The current distribution and electromagnetic field along an in-seam horizontal casing are investigated based on a synthesis three-layered model. The results illustrate that the casing can be treated as antennas that enhance the electric fields at large depths. The water-bearing structures can be observed by a magnetic field (with a perpendicularly horizontal electric dipole (HED) source) rather than an electric field (with a parallelly HED source). Numerical simulations demonstrate that the proposed method is a feasible and effective technique for the detection of water-bearing structures during deep mineral exploration. Full article
(This article belongs to the Special Issue Electromagnetic Exploration: Theory, Methods and Applications)
Show Figures

Figure 1

Figure 1
<p>Cross section of the thin conductive casing.</p>
Full article ">Figure 2
<p>(<b>a</b>) A model with two vertical steel-cased wells. The wells w1 (red solid line) and w2 (blue solid line) are placed 50 and 500 m away from the 1000 m length grounded HED source (green solid line), respectively. The wells are assumed as solid cylinders with a 1 m radius and a 1000 m length which have a conductivity of 5×10<math display="inline"><semantics> <msup> <mrow/> <mn>4</mn> </msup> </semantics></math> S/m. (<b>b</b>) The relative current strength along two wells, which are normalized by the transmitter. The results of this work and the analytical solution in Patzer et al. are indicated by solid lines and dashed lines, respectively [<a href="#B21-minerals-12-00638" class="html-bibr">21</a>].</p>
Full article ">Figure 3
<p>Measurement configuration for a grounded HED parallel to a horizontal casing. The ‘L’ shape casing consists of a 310 m long vertical part and a 1000 m long horizontal part. The HED source is 1000 m long carrying a 10 A current at a frequency of 32 Hz. Four different water-bearing structures, represented by A (at (0, 0, −270) m), B (at (0, 0, −290) m), C (at (0, −20, −310) m) and D (at (0, −40, −310) m), are considered separately.</p>
Full article ">Figure 4
<p>(<b>a</b>) Amplitude relative difference of the electric field along the horizontal casing for each cube, normalized by the background field; (<b>b</b>) Phase relative difference of the electric field along the horizontal casing for each cube, normalized by the background field.</p>
Full article ">Figure 5
<p>(<b>a</b>) Amplitude of the electric field along the horizontal casing to show the effect of the anisotropy and casing; (<b>b</b>) Phase of the electric field along the horizontal casing to show the effect of the anisotropy and casing.</p>
Full article ">Figure 6
<p>The current distribution (represented as log base 10) at a section view at y=0 m of the layer model in <a href="#minerals-12-00638-f003" class="html-fig">Figure 3</a>: (<b>a</b>) current distribution with casing; (<b>b</b>) current distribution without casing.</p>
Full article ">Figure 7
<p>(<b>a</b>) The x-component current distribution (represented as log base 10) at a section view at y = 0 m of the layer model in <a href="#minerals-12-00638-f003" class="html-fig">Figure 3</a>; (<b>b</b>) The z-component current distribution (represented as log base 10) at a section view at y = 0 m of the layer model in <a href="#minerals-12-00638-f003" class="html-fig">Figure 3</a>.</p>
Full article ">Figure 8
<p>Measurement configuration for a grounded HED perpendicular to a horizontal casing. The ‘L’ shape casing consists of a 310 m long vertical part and a 1000 m long horizontal part. The HED source is 1000 m long carrying 10 A current at a frequency of 128 Hz. Four different water-bearing structures, represented by A (at (0, 0, −270) m), B (at (0, 0, −290) m), C (at (0, −20, −310) m) and D (at (0, −40, −310) m), are considered, respectively.</p>
Full article ">Figure 9
<p>(<b>a</b>) Amplitude relative difference of the magnetic field along the horizontal casing for each cube, normalized by the background field; (<b>b</b>) Phase relative difference of the magnetic field along the horizontal casing for each cube, normalized by the background field.</p>
Full article ">Figure 10
<p>(<b>a</b>) Amplitude of the magnetic field along the horizontal casing to show the effect of the anisotropy and casing; (<b>b</b>) Phase of the electric field along the horizontal casing to show the effect of the anisotropy and casing.</p>
Full article ">
16 pages, 4871 KiB  
Article
Chemical Composition and Strontium Isotope Characteristics of Scheelite from the Doranasai Gold Deposit, NW China: Implications for Ore Genesis
by Xun Li, Abulimiti Aibai, Xiheng He, Rongzhen Tang and Yanjing Chen
Minerals 2022, 12(5), 637; https://doi.org/10.3390/min12050637 - 18 May 2022
Viewed by 2013
Abstract
Scheelite, as a common accessory mineral found in hydrothermal deposits, is an indicator that allows the study of the ore-forming hydrothermal process and the tracing of fluid sources. The Doranasai gold deposit is a large-sized orogenic gold deposit in the South Altai, and [...] Read more.
Scheelite, as a common accessory mineral found in hydrothermal deposits, is an indicator that allows the study of the ore-forming hydrothermal process and the tracing of fluid sources. The Doranasai gold deposit is a large-sized orogenic gold deposit in the South Altai, and orebodies occur as veins in the Devonian Tuokesalei Formation and Permian albite granite dykes. The ores are quartz veins and altered tectonites (rocks). Here, scheelite can be observed in the early-stage milky quartz veins, the middle-stage smoky quartz-polymetallic sulfide veins, and the altered albite granite dykes. In this study, the scheelites of these three types were carefully investigated in terms of texture, element, and isotope geochemistry to understand their ore-forming processes and fluid sources. The results showed that all types of scheelite were rich in Sr and poor in Mo, indicating that their ore-forming fluids had no genetic relation to magmatic–hydrothermal activities. The scheelites were characterized by the enrichment of medium rare earth element (MREE) and positive Eu anomaly in the chondrite-standardized REE patterns. This indicated the REE differentiation between scheelite and fluid, i.e., REE3+ and Na+ were in the form of valence compensation, preferentially replacing Ca2+ and selectively entering the scheelite lattice. The trace element composition of scheelite showed that the ore-forming fluid system was relatively closed, mesothermal, Na-rich, and reductive. The Sr isotope ratio of the scheelite (0.704819–0.70860, average 0.706372) was higher than that of the ore-bearing albite granite dyke (0.704654–0.704735), indicating that the Tuokesalei Formation is the main source for the fluids forming the Doranasai deposit. Full article
(This article belongs to the Special Issue Mineral Resources in North China Craton)
Show Figures

Figure 1

Figure 1
<p>Geological map of the Chinese Altai Orogen, showing the distribution of ore deposits ((<b>a</b>), modified after [<a href="#B29-minerals-12-00637" class="html-bibr">29</a>]; (<b>b</b>), modified after [<a href="#B30-minerals-12-00637" class="html-bibr">30</a>], reproduction with permission from F.Q. Yang).</p>
Full article ">Figure 2
<p>Simplified geological map of the Doranasai gold deposit (reprinted with permission from Ref. [<a href="#B1-minerals-12-00637" class="html-bibr">1</a>]). (<b>a</b>) Map showing the spatial relationship of orebodies with syncline, shear zone and granitic rocks; (<b>b</b>) profile showing orebody occurrence in Prospect II; (<b>c</b>) profile showing orebody occurrence in Prospect I.</p>
Full article ">Figure 3
<p>Characteristics of scheelites from different ores of the Doranasai gold deposit. (<b>a</b>–<b>c</b>) scheelite in early-stage milky quartz veins; (<b>d</b>–<b>f</b>) scheelite in middle-stage quartz–polymetallic sulfide veins; (<b>g</b>–<b>i</b>) scheelite in altered albite veins; Py—pyrite; Sch—scheelite; Qz—quartz; Chl—chlorite; Ser—sericite; Cal—calcite.</p>
Full article ">Figure 4
<p>Chondrite-normalized REE patterns of scheelite from the Doranasai gold deposit. (<b>a</b>–<b>c</b>): three types of scheelite. Note: Scheelite from Archean gold deposits, Western Australia is adopted from [<a href="#B11-minerals-12-00637" class="html-bibr">11</a>]. The data of Donggele granodiorite and ore-bearing albite granite dyke in Doranasai area are cited from [<a href="#B4-minerals-12-00637" class="html-bibr">4</a>]. The values of Chondrite are from [<a href="#B44-minerals-12-00637" class="html-bibr">44</a>].</p>
Full article ">Figure 5
<p>The <span class="html-italic">I</span><sub>Sr (t)</sub> plot for the Doranasai gold deposit and related lithologies.</p>
Full article ">
16 pages, 7895 KiB  
Article
Alkali Recovery of Bauxite Residue by Calcification
by Wanzhang Yang, Wenhui Ma, Pengfei Li, Zhanwei Liu and Hengwei Yan
Minerals 2022, 12(5), 636; https://doi.org/10.3390/min12050636 - 17 May 2022
Cited by 6 | Viewed by 1904
Abstract
Bauxite residue (red mud) generated during alumina production is a highly alkaline solid waste. The red mud is mainly stored on land, but it can cause harm to the surrounding environment and human health. The transformation of red mud into soil is a [...] Read more.
Bauxite residue (red mud) generated during alumina production is a highly alkaline solid waste. The red mud is mainly stored on land, but it can cause harm to the surrounding environment and human health. The transformation of red mud into soil is a feasible method for the large-scale disposal of red mud, but alkali removal is the key process that controls the transformation of red mud into soil. In this study, the calcification dealkalization of red mud with a small particle size was carried out below 100 °C. The results show that the sodium in red mud is predominately distributed in small particles, mainly because the lattice alkali and alkali present between the crystals are exposed to the surface of red mud particles by ball milling. The dealkalization process was controlled by the internal diffusion of the shrinking-core model (SCM), and the apparent activation energy was 23.55 kJ/mol. The dealkalization rate and the Na2O content of dealkalized red mud reached 92.44% and 0.61%, respectively. The dealkalization rate increased with increasing reaction time, reactant concentration, and leaching temperature, and this result was consistent with the results of the kinetic study. In addition, calcification enhances the flocculation of particles, so the filtration performance of red mud improved. Full article
(This article belongs to the Section Mineral Processing and Extractive Metallurgy)
Show Figures

Figure 1

Figure 1
<p>XRD pattern of the red-mud sample.</p>
Full article ">Figure 2
<p>SEM–EDS analysis of the red-mud sample.</p>
Full article ">Figure 3
<p>Experimental procedure.</p>
Full article ">Figure 4
<p>XRD pattern of the red-mud sample with different particle sizes (1—Ca<sub>3</sub>Al<sub>2</sub>(SiO<sub>4</sub>)(OH)<sub>8</sub>; 2—Na<sub>6</sub>Ca<sub>2</sub>Al<sub>6</sub>Si<sub>6</sub>O<sub>24</sub>(CO<sub>3</sub>)<sub>2</sub> 2H<sub>2</sub>O; 3—(K,Na)(Al,Mg,Fe)<sub>2</sub>(Si<sub>3.1</sub>Al<sub>0.9</sub>)O<sub>10</sub>(OH)<sub>2</sub>; 4—Fe<sub>7</sub>Si<sub>8</sub>O<sub>22</sub>(OH)<sub>2</sub>; 5—Fe<sub>2</sub>O<sub>3</sub>; 6—CaTiO<sub>3</sub>).</p>
Full article ">Figure 5
<p>SEM-EDS analysis of red mud with different particle size.</p>
Full article ">Figure 6
<p>Plots of α versus time at different temperatures.</p>
Full article ">Figure 7
<p>Plots of 1 − (1 − α)<sup>1/3</sup> versus time at different temperatures.</p>
Full article ">Figure 8
<p>Plots of 1 − 2α/3 − (1 − α)<sup>2/3</sup> versus time at different temperatures.</p>
Full article ">Figure 9
<p>Plots of ln(Ka) versus temperature of leaching process.</p>
Full article ">Figure 10
<p>Effect of reaction temperature on dealkalization rate.</p>
Full article ">Figure 11
<p>Effect of reaction time on dealkalization rate.</p>
Full article ">Figure 12
<p>Effect of CaO on dealkalization rate.</p>
Full article ">Figure 13
<p>Effect of liquid to solid ratio on dealkalization rate.</p>
Full article ">Figure 14
<p>The XRD pattern of the slag after dealkalization.</p>
Full article ">Figure 15
<p>Effect of CaO addition on the filtration performance of red mud. (<b>A</b>) without adding calcium oxide, (<b>B</b>) with adding calcium oxide.</p>
Full article ">Figure 16
<p>Effect of CaO addition on the sedimentation rate of red mud.</p>
Full article ">Figure 17
<p>Effect of CaO addition on the moisture content of red-mud filter cake.</p>
Full article ">Figure 18
<p>SEM analysis of red mud. (<b>A</b>) red mud before dealkalization, (<b>B</b>) red mud after dealkalization.</p>
Full article ">
17 pages, 6302 KiB  
Article
CO2-Water-Rock Interactions in Carbonate Formations at the Tazhong Uplift, Tarim Basin, China
by Kaisar Ahmat, Jianmei Cheng, Ying Yu, Ruirui Zhao and Jie Li
Minerals 2022, 12(5), 635; https://doi.org/10.3390/min12050635 - 17 May 2022
Cited by 7 | Viewed by 2590
Abstract
The effects of CO2-water-rock interactions on the injectivity and safety of CO2 geological storage have drawn wide attention. The geochemical reaction mechanisms in carbonate formations after CO2 injection are still controversial. To better understand the transformation of injected CO [...] Read more.
The effects of CO2-water-rock interactions on the injectivity and safety of CO2 geological storage have drawn wide attention. The geochemical reaction mechanisms in carbonate formations after CO2 injection are still controversial. To better understand the transformation of injected CO2 in carbonates and the involved geochemical reactions, we first conducted autoclave experiments reproducing the in-situ conditions of the Lianglitage Formation, Yingshan Formation, and Qiulitage Formation at the Tazhong Uplift in the Tarim Basin. We then established a batch model using TOUGHREACT-ECO2H, validated with the experimental results, to simulate the long-term CO2-water-rock interactions. It was found that the initial mineral compositions and water chemistry have important effects on the CO2-water-rock interactions in carbonate formations. The experiment results show that the dissolution of calcite and dolomite dominates in the early reaction period. However, we still observed some secondary minerals, such as ankerite, montmorillonite, calcite, and dolomite. The CO2-water-rock reactions can be more dramatic when the contents of calcite and dolomite in carbonates are closer. Moreover, the long-term simulation results show that calcite, magnesite, and hematite are the main formed secondary minerals, whereas dolomite is the major dissolved mineral. This study is helpful for a better understanding of the CO2 mineral trapping mechanism in carbonate formations. Full article
Show Figures

Figure 1

Figure 1
<p>Geological structures of the Tarim Basin and the location of wells TC1 and TZ1 (modified from Gao, et al. (2018) [<a href="#B38-minerals-12-00635" class="html-bibr">38</a>]).</p>
Full article ">Figure 2
<p>Stratigraphic column of the Tazhong Uplift in the Tarim Basin(modified from He, et al. (2016) [<a href="#B39-minerals-12-00635" class="html-bibr">39</a>]).</p>
Full article ">Figure 3
<p>A schematic representation of the work sequence followed in this study.</p>
Full article ">Figure 4
<p>Conceptual model representation, including the initial and boundary conditions.</p>
Full article ">Figure 5
<p>Evolution of the pH and electrical conductivity in brine during the experiments (<b>a</b>,<b>b</b>). Concentration changes of the major ions Mg<sup>2+</sup> and Ca<sup>2+</sup> (<b>c</b>,<b>d</b>).</p>
Full article ">Figure 6
<p>The increase in Ca<sup>2+</sup> and Mg<sup>2+</sup> concentrations for Case 6 and Case 6 DI (<b>a</b>). Change of Ca<sup>2+</sup>/Mg<sup>2+</sup> concentration ratio for Case 6 and Case 6 DI (<b>b</b>).</p>
Full article ">Figure 7
<p>Scanning electron photomicrographs of rock samples: (<b>a1</b>) Case 1 before experiment; (<b>a2</b>) Case 1 after experiment; (<b>b1</b>) Case 3 before experiment; (<b>b2</b>) Case 3 after experiment.</p>
Full article ">Figure 8
<p>Scanning electron photomicrographs of rock samples: (<b>a1</b>) Case 4 before experiment; (<b>a2</b>) Case 4 after experiment; (<b>b1</b>) Case 6 before experiment; (<b>b2</b>) Case 6 after experiment.</p>
Full article ">Figure 9
<p>Fittings of the experimental and simulation results for the major ion concentrations: (<b>a</b>) Case 6 DI; (<b>b</b>) Case 6.</p>
Full article ">Figure 10
<p>Comparison of XRD results and predicted results: (<b>a</b>) Case 6; (<b>b</b>) Case 6 DI.</p>
Full article ">Figure 11
<p>Variations of mineral saturation indexes in the first 15 days: (<b>a</b>) Case 6 DI; (<b>b</b>) Case 6.</p>
Full article ">Figure 12
<p>The variations of pH (<b>a</b>), Ca<sup>2+</sup> and Mg<sup>2+</sup> concentrations (<b>b</b>,<b>c</b>). The abundance changes of dolomite (<b>d</b>), calcite (<b>e</b>), and magnesite (<b>f</b>).</p>
Full article ">
15 pages, 5171 KiB  
Article
Assessment of Operational Effectiveness of Innovative Circuit for Production of Crushed Regular Aggregates in Particle Size Fraction 8–16 mm
by Tomasz Gawenda, Agata Stempkowska, Daniel Saramak, Dariusz Foszcz, Aldona Krawczykowska and Agnieszka Surowiak
Minerals 2022, 12(5), 634; https://doi.org/10.3390/min12050634 - 17 May 2022
Cited by 3 | Viewed by 1615
Abstract
The purpose of this paper is to analyze a modern and unique technological system producing common aggregates at the Imielin Dolomite Mine. The installation was built on the basis of inventions of AGH UST and consists of an impact crusher, innovative screens WSR [...] Read more.
The purpose of this paper is to analyze a modern and unique technological system producing common aggregates at the Imielin Dolomite Mine. The installation was built on the basis of inventions of AGH UST and consists of an impact crusher, innovative screens WSR and WSL, light fraction separator SEL and hard fraction separator SET, low-pressure hydrocyclone NHC and infrastructure. The study was carried out on the crusher and screen on the example of production of aggregates with grain size 8–16 mm from dolomite, granite, limestone, sandstone, and gravel. The results showed that cubic aggregates with a low content of irregular grains of less than 1% can be produced in this technological system. Full article
Show Figures

Figure 1

Figure 1
<p>Technological line in the Imielin Dolomite Mine, image from a drone.</p>
Full article ">Figure 2
<p>A simplified flow diagram of the installation for the mineral aggregates refinement in the Imielin Dolomite Mine.</p>
Full article ">Figure 3
<p>View of the KU 80/120 crusher and the WSR 3-2.0/6.0 screen.</p>
Full article ">Figure 4
<p>Particle size distribution curves of five feeds sent to the impact crusher.</p>
Full article ">Figure 5
<p>Particle size distribution curves of five comminution products in an impact crusher directed to the WSR screen.</p>
Full article ">Figure 6
<p>Limestone tests 8–16 mm regular and irregular particles.</p>
Full article ">Figure 7
<p>Sandstone tests 8–16 mm regular and irregular particles.</p>
Full article ">Figure 8
<p>Final product: Limestone 8–16 mm regular (<b>left</b>), irregular (<b>right</b>).</p>
Full article ">Figure 9
<p>Particle size distribution curves of five screening products in the fraction 8–16 mm (WSR screen).</p>
Full article ">Figure 10
<p>Difficult grains blocking slot screen decks (toss index 4.4).</p>
Full article ">Figure 11
<p>Change of unbalanced masses on the eccentric shaft of the screen.</p>
Full article ">Figure 12
<p>Photographs showing the condition of sieve blockage with difficult grains: At a toss index of 5.5 (<b>left</b>), at a toss index of 6.6 (<b>right</b>).</p>
Full article ">
31 pages, 15471 KiB  
Article
Geochemical and Geochronological Constraints of Permian-Triassic Magmatism on Oceanic Subduction and Continental Collision during the Eastern Paleo-Tethyan Evolution
by Wentao Xu, Fulai Liu, Wang Xu, Huining Wang, Lei Ji, Fang Wang and Dan Wang
Minerals 2022, 12(5), 633; https://doi.org/10.3390/min12050633 - 17 May 2022
Cited by 5 | Viewed by 2278
Abstract
The Jinshajiang–Ailaoshan–Song Ma orogenic belt (JASB), as a vital segment of the eastern Paleo-Tethyan tectonic zone, is one of the most important zones in which to study the Paleo-Tethyan tectonic evolution. We have undertaken an integrated geochronological, petrological, and geochemical study of mafic [...] Read more.
The Jinshajiang–Ailaoshan–Song Ma orogenic belt (JASB), as a vital segment of the eastern Paleo-Tethyan tectonic zone, is one of the most important zones in which to study the Paleo-Tethyan tectonic evolution. We have undertaken an integrated geochronological, petrological, and geochemical study of mafic rocks from the JASB to reveal the subduction and closure processes of the eastern Paleo-Tethyan Ocean during the Permian to Triassic. In conjunction with previous magmatic and metamorphic records in the JASB, three important tectonic stages are identified: (1) Early Permian to Early Triassic (ca. 288–248 Ma). Most of the Early Permian to Early Triassic mafic rocks have normal mid-ocean ridge basalt (N-MORB)- or enriched MORB (E-MORB)-like rare earth elements (REE) and trace element-normalized patterns with positive εNd(t) and εHf(t) values and negative Nb and Ta anomalies. Their La/Nb ratios and εNd(t) values show that approximately 3%–15% of slab-derived fluid accounts for the generation of these rocks. These characteristics suggest that the mafic rocks formed in an arc/back-arc basin setting at this stage. Additionally, the Early Permian mafic rocks are mainly exposed in the Jomda–Weixi–Yaxuanqiao–Truong Son magmatic rock belt (JYTB) on the western side of the JASB, indicating that the westward subduction of the Jinshajiang–Ailaoshan–Song Ma Paleo-Tethys Ocean (JASO) began in the Early Permian. Middle Permian mafic rocks are exposed in the Ailaoshan-Day Nui Con Voi metamorphic complex belt and the JYTB on both sides of the JASB. We propose that the bipolar subduction of the JASO occurred in the Middle Permian and ended in the Early Triassic. (2) Middle Triassic (ca. 248–237 Ma). The mafic rocks at this stage have LREE- and LILE-enriched patterns, negative Nb and Ta anomalies and negative εNd(t) values. Their variable εHf(t), εNd(t) values and La/Nb ratios show that these mafic rocks were highly affected by crustal material (ca. 16%). Considering the Middle Triassic high-pressure (HP) metamorphism and massive Al-enriched felsic magmatism in the JASB, these rocks may have formed in a collisional setting between the South China Block (SCB) and the North Qiangtang–Simao–Indochina Block (QSIB) during the Middle Triassic. (3) Late Triassic (ca. 235–202 Ma). The mafic rocks at this stage have negative εNd(t) and εHf(t) values and show terrestrial array characteristics. The εNd(t) values and La/Nb ratios show that approximately 30% of crustal components account for the generation of these rocks. Combined with the contemporaneous bimodal magma and metamorphism during the Late Triassic, we suggest that these rocks may have formed in a postcollisional extensional setting associated with magma diapir. Full article
(This article belongs to the Special Issue Tectono-Magmatic Evolution and Metallogeny of Tethyan Orogenic Belts)
Show Figures

Figure 1

Figure 1
<p>(<b>a</b>) Tectonic framework of the southwestern Tibet region; (<b>b</b>) Simplified geological map showing the major continental Blocks, suture belts, and the distribution of Ordovician-Triassic magmatic and metamorphic rocks, as well as the location of crystallization and metamorphic ages in the JASB. Revised from Deng et al. [<a href="#B38-minerals-12-00633" class="html-bibr">38</a>].</p>
Full article ">Figure 2
<p>(<b>a</b>–<b>h</b>) Field photographs and (<b>i</b>–<b>q</b>) photomicrographs of mafic and metamafic rocks in the JASB. (<b>a</b>) Amphibolite in the Batang area; (<b>b</b>) Bedded Grt-bearing amphibolite in the Batang area; (<b>c</b>) Amphibolite intruded by felsic vein in the Batang area; (<b>d</b>) Amphibolite is accompanied by serpentinite and in contact with Bt-Ms schist by the fault in the Batang area; (<b>e</b>) Amphibolite is in sharp contact with Bt-Ms schist by the fault in the Batang area; (<b>f</b>) Pillow basalt in the Yaxuanqiao area; (<b>g</b>) Massive gabbro in the Yaxuanqiao area; (<b>h</b>) Gabbro in the Lvchun area; (<b>i</b>) Garnet in Grt-Bt amphibolite alternating with amphibole, plagioclase, and biotite; (<b>j</b>) Multiple atoll microstructures of garnet in Grt-Bt amphibolite with BSE image; (<b>k</b>,<b>l</b>) Euhedral and subhedral garnet in Grt-Bt amphibolite with inclusions of plagioclase, biotite, and amphibole in core and rim, respectively; (<b>m</b>) Euhedral atoll garnet in Grt-Bt amphibolite; (<b>n</b>) Dark green amphibolite with oriented amphibole and plagioclase; (<b>o</b>) Basalt with altered clinopyroxene phenocryst in the Yaxuanqiao area; (<b>p</b>) Fresh gabbro in the Yaxuanqiao area; (<b>q</b>) Porphyritic gabbro in the Lvchun area.</p>
Full article ">Figure 3
<p>Compositional variation of Principal minerals from Grt-amphibolite from the JASB. (<b>a</b>) Alm vs. Prp vs. Grs + Sps ternary diagrams of garnet from Grt-amphibolite. (<b>b</b>) Si vs. <sup>A</sup>[Na+K] classification diagram for amphibole [<a href="#B80-minerals-12-00633" class="html-bibr">80</a>]. (<b>c</b>) <span class="html-italic">X</span><sub>Ab</sub> vs. <span class="html-italic">X</span><sub>An</sub> vs. <span class="html-italic">X</span><sub>or</sub> classification diagram for plagioclase. (<b>d</b>) FeO<sup>T</sup> vs. MgO diagram for biotite.</p>
Full article ">Figure 4
<p>(<b>a</b>–<b>c</b>) Sensitive High-Resolution Ion Microprobe (SHRIMP) and (<b>d</b>–<b>g</b>) laser ablation inductively coupled plasma mass spectrometry (LA–ICP–MS) zircon U–Pb concordia diagrams with representative zircon images for the amphibolites from the JASB.</p>
Full article ">Figure 5
<p>(<b>a</b>) Nb/Y vs. Zr/TiO<sub>2</sub> diagram [<a href="#B96-minerals-12-00633" class="html-bibr">96</a>] and (<b>b</b>) Ta/Yb vs. Ce/Yb diagram [<a href="#B97-minerals-12-00633" class="html-bibr">97</a>] for mafic and metamafic rocks from the JASB.</p>
Full article ">Figure 6
<p>(<b>a</b>,<b>c</b>,<b>e</b>) Chondrite-normalized REE patterns and (<b>b</b>,<b>d</b>,<b>f</b>) primitive mantle-normalized trace element patterns for mafic and metamafic rocks from the JASB. Normalized values for primitive mantle and chondrite are from [<a href="#B98-minerals-12-00633" class="html-bibr">98</a>]. Data for N-MORB, E-MORB, and OIB are from [<a href="#B98-minerals-12-00633" class="html-bibr">98</a>].</p>
Full article ">Figure 7
<p>Histograms of Late Ordovician–Late Triassic crystallization and metamorphic ages in the JASB. (<b>a</b>) Crystallization and metamorphic ages in the Jinshajiang orogenic belt; (<b>b</b>) Crystallization and metamorphic ages in the Ailaoshan orogenic belt; (<b>c</b>) Crystallization and metamorphic ages in the Song Ma orogenic blet. Detailed data sources are listed in <a href="#app1-minerals-12-00633" class="html-app">Supplementary Tables S7 and S8</a>.</p>
Full article ">Figure 8
<p>(<b>a</b>) εNd(t) vs. εHf(t) diagram, (<b>b</b>) La/Nb vs. εNd(t) diagram [<a href="#B25-minerals-12-00633" class="html-bibr">25</a>], and (<b>c</b>) age vs. εHf(t) diagram of the Jinshajiang and Ailaoshan mafic and felsic rocks. Data sources: The trace element contents and the average εNd (−8) value of Global Oceanic Sediments (GLOSS) are from Plank and Langmuir [<a href="#B105-minerals-12-00633" class="html-bibr">105</a>], N-MORB are from Sun and McDonough [<a href="#B98-minerals-12-00633" class="html-bibr">98</a>] and Chauvel et al. [<a href="#B106-minerals-12-00633" class="html-bibr">106</a>], Back-arc Basin Basalts (BABB) are from Fan et al. [<a href="#B48-minerals-12-00633" class="html-bibr">48</a>], OIB are from Sun and McDonough [<a href="#B98-minerals-12-00633" class="html-bibr">98</a>] and La Flèche et al. [<a href="#B107-minerals-12-00633" class="html-bibr">107</a>], Emeishan Flood Basalts (EFB) are from Xiao et al. [<a href="#B108-minerals-12-00633" class="html-bibr">108</a>], and Jinshajiang ophiolites (JSO) are from Xu and Castillo [<a href="#B10-minerals-12-00633" class="html-bibr">10</a>]. Island arc array (εHf = 1.23 × εNd + 6.45) and mantle array (εHf = 1.59 × εNd + 1.28) are from Su [<a href="#B109-minerals-12-00633" class="html-bibr">109</a>] and Chauvel et al. [<a href="#B106-minerals-12-00633" class="html-bibr">106</a>], respectively, and Terrestrial array (εHf = 1.36 × εNd + 2.95) is from Vervoort et al. [<a href="#B110-minerals-12-00633" class="html-bibr">110</a>].</p>
Full article ">Figure 9
<p>Primitive mantle-normalized incompatible element spidergrams for the Devonian-Triassic mafic rocks in the Jinshajiang and Ailaoshan orogenic belts. (<b>a</b>) 285–262 Ma mafic rocks in the Jinshajiang orogenic belt [<a href="#B108-minerals-12-00633" class="html-bibr">108</a>]; (<b>b</b>) 288–249 Ma mafic rocks in the Ailaoshan orogenic belt [<a href="#B112-minerals-12-00633" class="html-bibr">112</a>]; (<b>c</b>) 248–239 Ma mafic rocks in the Jinshajiang orogenic belt; (<b>d</b>) 246–237 Ma mafic rocks in the Ailaoshan orogenic belt; (<b>e</b>) 232–225 Ma mafic rocks in the Jinshajiang orogenic belt; (<b>f</b>) 235–216 Ma mafic rocks in the Ailaoshan orogenic belt; Detailed data sources are listed in <a href="#app1-minerals-12-00633" class="html-app">Supplementary Table S10</a> [<a href="#B61-minerals-12-00633" class="html-bibr">61</a>]. The legends are the same as those in <a href="#minerals-12-00633-f005" class="html-fig">Figure 5</a> and <a href="#minerals-12-00633-f010" class="html-fig">Figure 10</a>.</p>
Full article ">Figure 10
<p>Age vs. εNd(t) diagrams of the Jinshajiang and Ailaoshan mafic rocks. (<b>a</b>) Mafic rocks in the Jinshajiang orogenic belt; (<b>b</b>) Mafic rocks in the Ailaoshan orogenic belt. Detailed data sources are listed in <a href="#app1-minerals-12-00633" class="html-app">Supplementary Table S9</a>.</p>
Full article ">Figure 11
<p>(<b>a</b>,<b>b</b>) Ta/Yb vs. Th/Yb [<a href="#B97-minerals-12-00633" class="html-bibr">97</a>] and (<b>c</b>,<b>d</b>) Zr vs. Zr/Y [<a href="#B116-minerals-12-00633" class="html-bibr">116</a>] discrimination plots for the Devonian-Triassic mafic rocks in the Jinshajiang and Ailaoshan orogenic belts. Data sources of mafic rocks are the same as those in <a href="#minerals-12-00633-f009" class="html-fig">Figure 9</a>.</p>
Full article ">Figure 12
<p>Schematic model illustrating the development of the JASB during the Early Permian to Late Triassic.(<b>a</b>) During the Early Permian period (ca. 288–272 Ma), the JASO subducted westward under the QSIB and formed a continental margin arc along the JYTA; (<b>b</b>) During Middle Permian to Early Triassic (ca. 272–265 Ma), continuous subduction and slab rollback resulted in overriding plate extension to open a back-arc basin in the Batang-Yaxuanqiao area and to form Middle Permian MORB-like magmatic rocks. Meanwhile, subduction-associated magmatism that resulted from the eastward subduction of the JASO may have occurred on the southwestern margin of the SCB. (<b>c</b>) During the Middle Triassic (ca. 248–237 Ma), the collision between the QSIB and SCB closed the JASO and produced an intense orogenic magma in the JASB; (<b>d</b>) During the Late Triassic (ca. 235–202 Ma), the postcollisional extension along the JASB led to the MP metamorphic event and bi-modal magmatism.</p>
Full article ">
17 pages, 2610 KiB  
Article
The Effect of the Concentration of Copper Ions on the Unfrozen Water Content in Bentonites Measured with the Use of DSC Method
by Edyta Nartowska and Tomasz Kozłowski
Minerals 2022, 12(5), 632; https://doi.org/10.3390/min12050632 - 17 May 2022
Cited by 4 | Viewed by 1989
Abstract
Studies on changes of unfrozen water content in calcium bentonite from Slovakia, with various concentrations of copper ions, were carried out using the method of differential scanning calorimetry (DSC). In this study, the influence of molar concentration of copper(II) chloride solution (1 M, [...] Read more.
Studies on changes of unfrozen water content in calcium bentonite from Slovakia, with various concentrations of copper ions, were carried out using the method of differential scanning calorimetry (DSC). In this study, the influence of molar concentration of copper(II) chloride solution (1 M, 0.5 M, 0.25 M, 0.1 M), used to saturate clay, was analyzed, as well as the impact of copper ions contained in bentonite and how the copper concentration affects to changes of unfrozen water content versus temperature. The results suggest that new mineral phases originate in bentonite saturated with highly concentrated solutions due to the reaction with copper(II) chloride solutions. These minerals, identified based on XRD and SEM-EDS (X-ray Diffraction and Scanning Electron Microscopy with Energy Dispersive Spectroscopy) studies, are from the atacamite group. ANOVA (Analysis of Variance) has shown a statistically significant relationship between the unfrozen water content and the molar concentration of the solution used to saturate bentonite and between the unfrozen water content and the content of copper ions in the bentonite. The analysis of multiple regression has shown that the change of unfrozen water content in copper bentonites is related to the temperature change, specific surface, and the concentration of copper ions in the clay. An empirical equation was developed to estimate the content of unfrozen water at a given negative temperature in Cu-bentonites, in which the specific surface and copper ions concentration in the bentonite are the main parameters. Full article
(This article belongs to the Special Issue Application of Clays and Clay Minerals to Prevent Contamination)
Show Figures

Figure 1

Figure 1
<p>Morphology and SEM-EDX data of the BSvk bentonite samples saturated with copper(II) chloride solutions of different molar concentrations: (<b>a</b>) 0.1 M, (<b>b</b>) 0.25 M, (<b>c</b>) 0.5 M.</p>
Full article ">Figure 2
<p>Powder XRD patterns of the bentonite BSvk samples after saturation with copper(II) chloride solutions of different molar concentrations: 0.1 M, 0.25 M, and 0.5 M.</p>
Full article ">Figure 3
<p>Macro photography of a mineral that crystallizes on the leachate from the bentonite ion exchange process, identified as an atacamite group mineral. (<b>a</b>) atacamite group mineral that crystallizes on the leachate (<b>b</b>) atacamite group mineral.</p>
Full article ">Figure 4
<p>Curves of unfrozen water content versus temperature for selected samples of BSvk bentonite, before the ion exchange ‘0’, and after saturation with copper ions ‘Cu’ of various concentrations.</p>
Full article ">Figure 5
<p>Average contents of unfrozen water in BSvk ‘Cu’ bentonites versus the molar concentration of the solution (0.1–1 M CuCl<sub>2</sub>) used for Cu ion exchange.</p>
Full article ">Figure 6
<p>Average contents of unfrozen water in BSvk ‘Cu’ bentonites versus the concentration of copper ions in the soil, irrespective of temperature.</p>
Full article ">
20 pages, 14210 KiB  
Article
Iron Ore Sinter Macro- and Micro-Structures, and Their Relationships to Breakage Characteristics
by Siyu Cheng, Peter Charles Hayes and Evgueni Jak
Minerals 2022, 12(5), 631; https://doi.org/10.3390/min12050631 - 16 May 2022
Cited by 2 | Viewed by 4790
Abstract
A systematic analysis of industrial iron ore sinter product and associated sinter returns was undertaken. The samples were characterised through identification of the major macro- and micro-structural types present in these materials. Examination of the breakage surfaces of the particles indicates a strong [...] Read more.
A systematic analysis of industrial iron ore sinter product and associated sinter returns was undertaken. The samples were characterised through identification of the major macro- and micro-structural types present in these materials. Examination of the breakage surfaces of the particles indicates a strong correlation between mechanical sinter strength and sinter microstructure. Preferential breakage was observed to occur in sinter materials having high porosity and those microstructures consisting of isolated hematite grains in a glass matrix. The bulk of the sinter product consisted of material with a microstructure of magnetite and silico-ferrite of calcium and aluminium (SFCA). The phases formed and the reaction sequences responsible for the formation of the principal microstructure types are explained by the non-equilibrium solidification of melts in the “Fe2O3”-Al2O3-CaO-SiO2 system. Full article
(This article belongs to the Special Issue Mineralogy of Iron Ore Sinters, Volume II)
Show Figures

Figure 1

Figure 1
<p>XRD pattern of sinter product and return samples reported by Chen et al. [<a href="#B27-minerals-12-00631" class="html-bibr">27</a>] (Cu Kα, 40kv), S = SFCA solid solution, H = hematite; M = magnetite; Q = quartz; D = dicalcium-silicate C<sub>2</sub>S; L = lime.</p>
Full article ">Figure 2
<p>Example of Macro-Types A~E on industrial sinter products.</p>
Full article ">Figure 3
<p>Four main microstructural types I~IV in the sinter samples, (<b>a</b>) Micro-Type I; (<b>b</b>) Micro-Type II; (<b>c</b>) Micro-Type-III; (<b>d</b>) zoomed details of Micro-Type II; (<b>e</b>) Micro-Type IV; and (<b>f</b>) zoomed details of Micro-Type IV, G = Glass; H = Hematite; M = Magnetite; S = SFCA solid solution; D = Dicalcium silicate (C<sub>2</sub>S); P = Pores.</p>
Full article ">Figure 4
<p>(<b>a</b>) Details of macro-features of type A (smooth/dull, molten, dense surface) taken by digital camera; (<b>b</b>) backscattered electron image of microstructure Macro-Type A, G = Glass; H = Hematite; M = Magnetite; S = SFCA solution; D = Dicalcium silicate (C<sub>2</sub>S); P = Pores.</p>
Full article ">Figure 5
<p>(<b>a</b>) Details of macro-features of type B (smooth/dull, porous, molten surface) taken by digital camera; (<b>b</b>) backscattered electron image of microstructures in Macro-Type B, G = Glass; H = Hematite; M = Magnetite; S = SFCA solid solution; D = Dicalcium silicate (C<sub>2</sub>S); P = Pores.</p>
Full article ">Figure 6
<p>(<b>a</b>) Details of macro-features of type C (shiny/fractured, dense surface) taken by digital camera; (<b>b</b>) backscattered electron image of microstructures in Macro-Type C; (<b>c</b>) and (<b>d</b>) details from different locations of (<b>b</b>), G = Glass; H = Hematite; M = Magnetite; S = SFCA solid solution; D = Dicalcium silicate (C<sub>2</sub>S); P = Pores, (*) microcrystalline material, formerly liquid slag.</p>
Full article ">Figure 7
<p>(<b>a</b>) Details of macro-features of type D (shiny/fractured surface large pores) taken by digital camera; (<b>b</b>) overview of interface between two microstructures in Macro-Type D; (<b>c</b>,<b>d</b>) details from different locations of (<b>b</b>), G = Glass; H = Hematite; M = Magnetite; S = SFCA solid solution; D = Dicalcium silicate (C<sub>2</sub>S); P = Pores.</p>
Full article ">Figure 8
<p>(<b>a</b>) Details of macro-features of type E (shiny/fractured surface fine pores) taken by digital camera; (<b>b</b>) overview of the microstructure in Macro-Type E; (<b>c</b>,<b>d</b>) details from different locations of (<b>b</b>), G = Glass; H = Hematite; S = SFCA solid solution; D = Dicalcium silicate (C<sub>2</sub>S); P = Pores.</p>
Full article ">Figure 9
<p>Typical microstructures of return samples Macro-Type F, porous and in irregular shape, taken on optical microscope and back scattered electron microscope, G = Glass; H = Hematite; M = Magnetite; S = SFCA solid solution; and P = Pores.</p>
Full article ">Figure 10
<p>Typical microstructures of return samples Macro-Type G, dense, round to irregular shape, taken on optical microscope and back scattered electron microscope, G = Glass; H = Hematite; M = Magnetite; and P = Pores.</p>
Full article ">Figure 11
<p>Macro-features of other return samples: (<b>a</b>,<b>b</b>) Macro-Type H; (<b>c</b>,<b>d</b>) Macro-Type J; (<b>e</b>,<b>f</b>) Macro-Type K; and their respective typical microstructures: (<b>g</b>) Macro-Type H; (<b>h</b>) Macro-Type J and (<b>i</b>) Macro-Type K, H = Hematite; S = SFCA solid solution; P = Pores; and Q = Quartz.</p>
Full article ">Figure 12
<p>Compositions of phases in Microstructure-Types I–IV measured by EPMA projected onto the “Fe<sub>2</sub>O<sub>3</sub>”-CaO-SiO<sub>2</sub> system in air based on the study by Cheng et al. [<a href="#B20-minerals-12-00631" class="html-bibr">20</a>], compositions in wt%, temperature in °C, *X denotes sample Macro-Types, Y denotes locations of measurement taken.</p>
Full article ">Figure 13
<p>Schematic representation of changes in liquid composition during solidification in different Microstructure-Types, (<b>a</b>) Type I; (<b>b</b>) Type II; (<b>c</b>) Type III, and (<b>d</b>) Type IV in the sinter.</p>
Full article ">
15 pages, 3137 KiB  
Article
A Methodology to Determine the Potential for Particulate Ore Sorting Based on Intrinsic Particle Properties
by Michael Duncan and David Deglon
Minerals 2022, 12(5), 630; https://doi.org/10.3390/min12050630 - 16 May 2022
Viewed by 2233
Abstract
Sensor-based particulate ore sorting is a pre-concentration technique that sorts particles based on measurable physical properties, resulting in reduced energy consumption by removing waste prior to grinding. This study presents an integrated methodology to determine the potential for ore sorting based on intrinsic [...] Read more.
Sensor-based particulate ore sorting is a pre-concentration technique that sorts particles based on measurable physical properties, resulting in reduced energy consumption by removing waste prior to grinding. This study presents an integrated methodology to determine the potential for ore sorting based on intrinsic particle properties. The methodology first considers the intrinsic sortability based on perfect separation. Only intrinsically sortable ore is further assessed by determining the sensor-based sortability. The methodology is demonstrated using a case study based on a typical copper porphyry comminution circuit. The sorting duty identified for the case study was the removal of low-grade waste material from the pebble crusher stream at a suitable Cu cut-off grade. It was found that the ore had the potential to be sorted based on the intrinsic and ideal laboratory sensor sortability results but showed no potential to be sorted using industrial-scale sensors. The ideal laboratory XRF sensor results showed that around 40% of mass could be rejected as waste at copper recoveries above 80%. An economic analysis of the sortability tests showed that, at optimum separation conditions, the intrinsic, ideal sensor and industrial sensor sortability would result in an additional annual profit of ~$30 million, $21 million and $−7 million (loss), respectively. Full article
(This article belongs to the Special Issue Recent Developments in Mineral Processing at University of Cape Town)
Show Figures

Figure 1

Figure 1
<p>Flow diagram of the six stages in the methodology.</p>
Full article ">Figure 2
<p>Simulated theoretical intrinsic sortability test.</p>
Full article ">Figure 3
<p>Examples of cumulative grade, recovery and mass rejection curves comparing the intrinsic, ideal sensor and industrial sensor sortability tests.</p>
Full article ">Figure 4
<p>Grade distribution of the pebbles (% Cu).</p>
Full article ">Figure 5
<p>Regression curve for the Cu grade determined using the hand−held XRF.</p>
Full article ">Figure 6
<p>Cumulative grade−recovery curves for the overall sample as well as the +40 mm and −40 mm size fractions.</p>
Full article ">Figure 7
<p>XRF, XRT and NIR sensor response curves.</p>
Full article ">Figure 8
<p>Cumulative grade-recovery curves for the intrinsic and laboratory (ideal) sensor tests.</p>
Full article ">Figure 9
<p>Cumulative grade-recovery and mass rejection curves for the intrinsic, ideal and industrial sensor tests.</p>
Full article ">
16 pages, 3736 KiB  
Article
Hyperspectral and Geochemical Analysis of Chlorites at the Gongchangling High-Grade Magnetite Deposit, NE China: Implications for Alteration Processes
by Ende Wang, Kun Song, Yuzeng Yao, Jianfei Fu, Dahai Hao and Sishun Ma
Minerals 2022, 12(5), 629; https://doi.org/10.3390/min12050629 - 15 May 2022
Cited by 1 | Viewed by 2237
Abstract
The Gongchangling deposit is a representative banded iron formation (BIF) in China, in which developed several high-grade magnetite ores. The surrounding alteration rocks recorded the genesis information of the high-grade ores. However, the study related to alteration processes remains poor. In this study, [...] Read more.
The Gongchangling deposit is a representative banded iron formation (BIF) in China, in which developed several high-grade magnetite ores. The surrounding alteration rocks recorded the genesis information of the high-grade ores. However, the study related to alteration processes remains poor. In this study, we investigate the sub-types and formation temperature of chlorite using hyperspectral imaging and electronic probe microanalysis (EPMA), and deciphered the elemental migration trend during alteration processes by whole-rock geochemistry. The chlorites in the alteration rocks were divided into three sub-types according to the spectral features of the Fe-OH band near 2250 nm. The range of wavelength position is approximately 2250–2255 nm for chlorite-I, 2255–2260 nm for chlorite-II, and 2260–2265 nm for chlorite-III. The variation in Mg# is 0.32–0.44 in chlorite-I, 0.20–0.34 in chlorite-II, and 0.15–0.23 in chlorite-III, which is consistent with the range of wavelength position. The hydrothermal alteration resulted in the enrichment of iron and the depletion of silicon. The results shed new light on the recognition of chlorite sub-types and deciphered the hydrothermal alteration processes of high-grade magnetite ores, which proposed an effective method for mineralogical mapping. Full article
(This article belongs to the Special Issue Mapping of Rocks and Minerals Using Hyperspectral Remote Sensing)
Show Figures

Figure 1

Figure 1
<p>(<b>a</b>) Geological sketch map of the North China Craton (NCC), showing the distribution of the Archean greenstone belt and BIFs, adapted with permission from Zhai et al., 2020 Ref. [<a href="#B22-minerals-12-00629" class="html-bibr">22</a>]; (<b>b</b>) Geological sketch map of the Gongchangling deposit, illustrating the location of study area, adapted with permission from Li et al., 2014; Zhou et al., 1994 Refs. [<a href="#B19-minerals-12-00629" class="html-bibr">19</a>,<a href="#B23-minerals-12-00629" class="html-bibr">23</a>]; (<b>c</b>) Geological profile map in the No.2 mining area, exhibiting the location of the sampling profile, adapted with permission from Li et al., 2014; Zhou et al., 1994 Refs. [<a href="#B19-minerals-12-00629" class="html-bibr">19</a>,<a href="#B23-minerals-12-00629" class="html-bibr">23</a>]. (<b>d</b>) The cartoon graph displays the distribution of the collected samples in this study, adapted with permission from Song et al., 2020 Ref. [<a href="#B18-minerals-12-00629" class="html-bibr">18</a>]. The legends of (<b>c</b>) are identical with (<b>d</b>).</p>
Full article ">Figure 2
<p>Result of mapping mineralogy from Hyspex hyperspectral images. (<b>a</b>) Map of chlorite spectral wavelength position at 2250 nm by Fe-OH, the circles point out the location of single spectrum in (<b>b</b>). (<b>b</b>) The single spectrum of three types of chlorites in the Gongchangling deposit.</p>
Full article ">Figure 3
<p>The textures of different chlorite. The photos are collected under microscopy with plane-polarized light (images on the left) and cross-polarized light (images on the right). (<b>a</b>,<b>b</b>) Chlorite-I with abnormal interference color of purple exhibiting straight cantact boundary with garnet; (<b>c</b>,<b>d</b>) Chlorite-II infilled in the fissures of lamellar chlorite (Chl-I) and some anhedral fine grained magnetites were included in it; (<b>e</b>,<b>f</b>) Chlorite-III and anhedral quartz dissolved and replaced garnet.</p>
Full article ">Figure 4
<p>Chlorite classification diagrams in the Gongchangling alteration rocks. (<b>a</b>): Si vs. Fe (a.p.f.u) after [<a href="#B26-minerals-12-00629" class="html-bibr">26</a>] (<b>b</b>): (Al + □)–Mg–Fe, reprinted with permission from Zane et al., 1998 Ref. [<a href="#B27-minerals-12-00629" class="html-bibr">27</a>].</p>
Full article ">Figure 5
<p>Correlation scatter plots for the chlorite. (<b>a</b>) Fe<sup>2+</sup> vs. Mg<sup>2+</sup> (<span class="html-italic">a.p.f.u</span>); (<b>b</b>) Al<sub>(total)</sub> vs. Si + Fe<sup>2+</sup> + Mg<sup>2+</sup> (<span class="html-italic">a.p.f.u</span>); (<b>c</b>) Al<sup>iv</sup> vs. Al<sup>vi</sup> (<span class="html-italic">a.p.f.u</span>); and (<b>d</b>) Fe/(Fe + Mg) vs. Al<sup>iv</sup> (<span class="html-italic">a.p.f.u</span>); (<b>e</b>) Fe<sub>(total)</sub> vs. Pos2250; and (<b>f</b>) Fe/(Fe + Mg) vs. Pos2250.</p>
Full article ">Figure 6
<p>Primitive mantle-normalized trace elements patterns of Gongchangling No. 2 Mining Area.</p>
Full article ">Figure 7
<p>PAAS-normalized rare earth element patterns in Gongchangling No. 2 Mining Area.</p>
Full article ">Figure 8
<p>The results image of the mass balance calculation. (<b>a</b>) The gains and losses of Ti in altered rocks; (<b>b</b>) The gains and losses of major components in altered rocks; (<b>c</b>) The gains and losses of V, Co, and Cu in altered rocks; (<b>d</b>) The gains and losses of Zn, Ga, and Zr in altered rocks; (<b>e</b>) The gains and losses of SiO<sub>2</sub> and TFe<sub>2</sub>O<sub>3</sub> in altered rocks; (<b>f</b>) The gains and losses of Ni, Rb, and Sr in altered rocks.</p>
Full article ">
Previous Issue
Next Issue
Back to TopTop