[go: up one dir, main page]

Next Issue
Volume 13, April
Previous Issue
Volume 13, February


Symmetry, Volume 13, Issue 3 (March 2021) – 161 articles

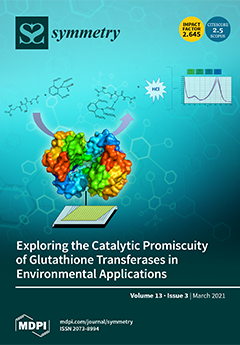
Cover Story (view full-size image): Glutathione transferases catalyze the conjugation of glutathione with xenobiotics, including pesticides. In the present work, in vitro directed evolution was used for the creation of an optimized GST variant with enhanced catalytic activity that was exploited for the development of an optical biosensor for alachlor determination. View this paper.
  • Issues are regarded as officially published after their release is announced to the table of contents alert mailing list.
  • You may sign up for e-mail alerts to receive table of contents of newly released issues.
  • PDF is the official format for papers published in both, html and pdf forms. To view the papers in pdf format, click on the "PDF Full-text" link, and use the free Adobe Reader to open them.
Order results
Result details
Section
Select all
Export citation of selected articles as:
20 pages, 5008 KiB  
Article
Towards a Novel Computer-Aided Optimization of Microreactors: Techno-Economic Evaluation of an Immobilized Enzyme System
by Philip Pietrek, Manfred Kraut and Roland Dittmeyer
Symmetry 2021, 13(3), 524; https://doi.org/10.3390/sym13030524 - 23 Mar 2021
Cited by 2 | Viewed by 2912
Abstract
Immobilized multi-enzyme cascades are increasingly used in microfluidic devices. In particular, their application in continuous flow reactors shows great potential, utilizing the benefits of reusability and control of the reaction conditions. However, capitalizing on this potential is challenging and requires detailed knowledge of [...] Read more.
Immobilized multi-enzyme cascades are increasingly used in microfluidic devices. In particular, their application in continuous flow reactors shows great potential, utilizing the benefits of reusability and control of the reaction conditions. However, capitalizing on this potential is challenging and requires detailed knowledge of the investigated system. Here, we show the application of computational methods for optimization with multi-level reactor design (MLRD) methodology based on the underlying physical and chemical processes. We optimize a stereoselective reduction of a diketone catalyzed by ketoreductase (Gre2) and Nicotinamidadenindinukleotidphosphat (NADPH) cofactor regeneration with glucose dehydrogenase (GDH). Both enzymes are separately immobilized on magnetic beads forming a packed bed within the microreactor. We derive optimal reactor feed concentrations and enzyme ratios for enhanced performance and a basic economic model in order to maximize the techno-economic performance (TEP) for the first reduction of 5-nitrononane-2,8-dione. Full article
(This article belongs to the Special Issue Symmetry and Complexity of Catalysis in Flow Chemistry)
Show Figures

Figure 1

Figure 1
<p>Reaction scheme of chiral reduction of NDK to the corresponding hydroxyketone (HK) and the diol using immobilized Gre2. The cofactor NADPH is regenerated during oxidation of glucose with glucose 1-dehydrogenase (GDH) [<a href="#B36-symmetry-13-00524" class="html-bibr">36</a>].</p>
Full article ">Figure 2
<p>Schematic of the reactor with height H and length L. Particles with a diameter <math display="inline"><semantics> <mrow> <msub> <mi>d</mi> <mi>p</mi> </msub> </mrow> </semantics></math> of 2.8 µm form a packed bed of fixed height <math display="inline"><semantics> <mrow> <msub> <mi>d</mi> <mrow> <mi>b</mi> <mi>e</mi> <mi>d</mi> </mrow> </msub> </mrow> </semantics></math> on the bottom of a flow channel, and are held inside the reactor with magnets below the flow channel plate.</p>
Full article ">Figure 3
<p>Multi-level reactor design (MLRD) levels according to Freund et al. [<a href="#B40-symmetry-13-00524" class="html-bibr">40</a>] and further adaptation to suit a multi-enzyme cascade reactor with mass transport limitations with a fixed channel length.</p>
Full article ">Figure 4
<p>Optimization parameters considered. Parameters specific for immobilized GDH (light grey) and aqueous GDH enzyme (dark grey).</p>
Full article ">Figure 5
<p>Concentration distribution for feed NDK, product HK and diol for the first 2 mm of the reactor. The lower part (brown) depicts the particle bed, and the volume above is the free volume with convective flow.</p>
Full article ">Figure 6
<p>Concentration profiles over the whole cross-section at the beginning of the reactor for the basic Matlab model (lines) and F2D model (dashes).</p>
Full article ">Figure 7
<p>Development of the cross-section averaged concentration in the free channel volume in flow direction for the basic Matlab model (lines) and F2D model (dashes).</p>
Full article ">Figure 8
<p>NADPH concentration in the reactor entrance region for aqueous GDH (<b>A</b>) and immobilized GDH (<b>B</b>).</p>
Full article ">Figure 9
<p>Results for MLRD case 1.1 (unlimited regeneration and mass transport), case 1.2 (with regeneration limitation) and case 1.3 (with mass transport limitation) for different amounts of beads. (<b>A</b>): Enzyme utilization (EU) <math display="inline"><semantics> <mrow> <msub> <mi>η</mi> <mi>R</mi> </msub> </mrow> </semantics></math>. (<b>B</b>): Space time yield (STY) and productivity. (<b>C</b>): Cost. (<b>D</b>): TEP.</p>
Full article ">Figure 10
<p>Parameter evaluation of the results for (<b>A</b>) feed NADP/H concentration and (<b>B</b>) bead ratio for different amounts of beads ranging from 1 to 5.4 mg. For all bead amounts, a limiting curve was added to clarify the limits.</p>
Full article ">Figure 11
<p>Optimization of a microchannel enzymatic reactor system with an overflown particle bed and immobilized enzyme cascades. Results generated by a genetic algorithm with characterizing Pareto for different amounts of beads, indicated by grey dashed lines. An increase in TEP is depicted by symbols’ color, ranging from red (low TEP) to green (high TEP).</p>
Full article ">Figure 12
<p>Level 2 results from the genetic algorithm. Results of the optimal cases for different amounts of magnetic beads (MBs). (<b>A</b>): Conversion of NDK to HK and diol. (<b>B</b>): Enzyme utilization (EU) <math display="inline"><semantics> <mrow> <msub> <mi>η</mi> <mi>R</mi> </msub> </mrow> </semantics></math>. (<b>C</b>): Cost with contributions of CapEx and OpEX. (<b>D</b>): TEP.</p>
Full article ">Figure 13
<p>TEP for different amounts of beads for an operating time (OT) ranging from 1 h to 3 weeks (<b>A</b>–<b>D</b>). TEP is scaled to the respective TEP of a reactor with aq. GDH and 4.5 mg beads and the corresponding OT. TEP maxima shift for higher amounts of beads and are reduced overall for increased OT.</p>
Full article ">Figure 14
<p>Evolution of performance (<b>A</b>), enzyme utilization (EU) <math display="inline"><semantics> <mrow> <msub> <mi>η</mi> <mi>R</mi> </msub> </mrow> </semantics></math> (<b>B</b>), economics (<b>C</b>) and overall TEP (<b>D</b>) in relation to the base case with aqueous GDH (black), comparable immobilization (red) and optimized system parameters (blue).</p>
Full article ">
14 pages, 2654 KiB  
Article
Study of Cascading Failure in Multisubnet Composite Complex Networks
by Gengxin Sun, Chih-Cheng Chen and Sheng Bin
Symmetry 2021, 13(3), 523; https://doi.org/10.3390/sym13030523 - 23 Mar 2021
Cited by 42 | Viewed by 4115
Abstract
Current research on the cascading failure of coupling networks is mostly based on hierarchical network models and is limited to a single relationship. In reality, many relationships exist in a network system, and these relationships collectively affect the process and scale of the [...] Read more.
Current research on the cascading failure of coupling networks is mostly based on hierarchical network models and is limited to a single relationship. In reality, many relationships exist in a network system, and these relationships collectively affect the process and scale of the network cascading failure. In this paper, a composite network is constructed based on the multisubnet composite complex network model, and its cascading failure is proposed combined with multiple relationships. The effect of intranetwork relationships and coupling relationships on network robustness under different influencing factors is studied. It is shown that cascading failure in composite networks is different from coupling networks, and increasing the strength of the coupling relationship can significantly improve the robustness of the network. Full article
(This article belongs to the Special Issue Selected Papers from IIKII 2020 Conferences II)
Show Figures

Figure 1

Figure 1
<p>An example of composite complex network.</p>
Full article ">Figure 2
<p>Cascading failure of a coupling network.</p>
Full article ">Figure 3
<p>Cascading failure of a composite network.</p>
Full article ">Figure 4
<p>Influence of intranetwork relationship strength on composite networks. (<b>a</b>) WS-WS (Two subnets are WS network); (<b>b</b>) BA-BA (Two subnets are BA network); (<b>c</b>) WS-BA (The first subnet is WS network and the second subnet is BA network); (<b>d</b>) BA-WS (The first subnet is BA network and the second subnet is WS network).</p>
Full article ">Figure 5
<p>Influence of coupling relationship strength on composite networks. (<b>a</b>) WS-WS (Two subnets are WS network); (<b>b</b>) BA-BA (Two subnets are BA network); (<b>c</b>) WS-BA (The first subnet is WS network and the second subnet is BA network); (<b>d</b>) BA-WS (The first subnet is BA network and the second subnet is WS network).</p>
Full article ">Figure 6
<p>The average degree of the relationship on composite networks. (<b>a</b>) The average degree of intranetwork relationships is 2 and 4; (<b>b</b>) the average degree of intranetwork relationships is 2 and 6; (<b>c</b>) the average degree of intranetwork relationships is 4 and 2; (<b>d</b>) the average degree of intranetwork relationships is 6 and 2.</p>
Full article ">Figure 7
<p>The effect of relationship strength on composite networks. (<b>a</b>) The average degree of coupling relationship is 2; (<b>b</b>) the average degree of coupling relationship is 4; (<b>c</b>) the average degree of coupling relationship is 6; (<b>d</b>) the average degree of coupling relationship is 8.</p>
Full article ">
43 pages, 581 KiB  
Article
Reparametrization Invariance and Some of the Key Properties of Physical Systems
by Vesselin G. Gueorguiev and Andre Maeder
Symmetry 2021, 13(3), 522; https://doi.org/10.3390/sym13030522 - 23 Mar 2021
Cited by 7 | Viewed by 3177
Abstract
In this paper, we argue in favor of first-order homogeneous Lagrangians in the velocities. The relevant form of such Lagrangians is discussed and justified physically and geometrically. Such Lagrangian systems possess Reparametrization Invariance (RI) and explain the observed common Arrow of Time as [...] Read more.
In this paper, we argue in favor of first-order homogeneous Lagrangians in the velocities. The relevant form of such Lagrangians is discussed and justified physically and geometrically. Such Lagrangian systems possess Reparametrization Invariance (RI) and explain the observed common Arrow of Time as related to the non-negative mass for physical particles. The extended Hamiltonian formulation, which is generally covariant and applicable to reparametrization-invariant systems, is emphasized. The connection between the explicit form of the extended Hamiltonian H and the meaning of the process parameter λ is illustrated. The corresponding extended Hamiltonian H defines the classical phase space-time of the system via the Hamiltonian constraint H=0 and guarantees that the Classical Hamiltonian H corresponds to p0—the energy of the particle when the coordinate time parametrization is chosen. The Schrödinger’s equation and the principle of superposition of quantum states emerge naturally. A connection is demonstrated between the positivity of the energy E=cp0>0 and the normalizability of the wave function by using the extended Hamiltonian that is relevant for the proper-time parametrization. Full article
16 pages, 2146 KiB  
Article
Synthesis of C3-Symmetric Cinchona-Based Organocatalysts and Their Applications in Asymmetric Michael and Friedel–Crafts Reactions
by Péter Kisszékelyi, Zsuzsanna Fehér, Sándor Nagy, Péter Bagi, Petra Kozma, Zsófia Garádi, Miklós Dékány, Péter Huszthy, Béla Mátravölgyi and József Kupai
Symmetry 2021, 13(3), 521; https://doi.org/10.3390/sym13030521 - 23 Mar 2021
Cited by 4 | Viewed by 3726
Abstract
In this work, anchoring of cinchona derivatives to trifunctional cores (hub approach) was demonstrated to obtain size-enlarged organocatalysts. By modifying the cinchona skeleton in different positions, we prepared four C3-symmetric size-enlarged cinchona derivatives (hub-cinchonas), which were tested as organocatalysts and their [...] Read more.
In this work, anchoring of cinchona derivatives to trifunctional cores (hub approach) was demonstrated to obtain size-enlarged organocatalysts. By modifying the cinchona skeleton in different positions, we prepared four C3-symmetric size-enlarged cinchona derivatives (hub-cinchonas), which were tested as organocatalysts and their catalytic activities were compared with the parent cinchona (hydroquinine) catalyst. We showed that in the hydroxyalkylation reaction of indole, hydroquinine provides good enantioselectivities (up to 73% ee), while the four new size-enlarged derivatives resulted in significantly lower values (up to 29% ee) in this reaction. Anchoring cinchonas to trifunctional cores was found to facilitate nanofiltration-supported catalyst recovery using the PolarClean alternative solvent. The C3-symmetric size-enlarged organocatalysts were completely rejected by all the applied membranes, whereas the separation of hydroquinine was found to be insufficient when using organic solvent nanofiltration. Furthermore, the asymmetric catalysis was successfully demonstrated in the case of the Michael reaction of 1,3-diketones and trans-β-nitrostyrene using Hub3-cinchona (up to 96% ee) as a result of the positive effect of the C3-symmetric structure using a bulkier substrate. This equates to an increased selectivity of the catalyst in comparison to hydroquinine in the latter Michael reaction. Full article
(This article belongs to the Collection Feature Papers in Chemistry)
Show Figures

Graphical abstract

Graphical abstract
Full article ">Figure 1
<p>We explored C<sub>3</sub>-symmetric hub-cinchona structures containing no (<b>a</b>), or single H-bond donor units (<b>b</b>). Cinchona skeleton was anchored through different positions (<b>c</b>). CuAAC: copper(I) catalyzed azide–alkyne cycloaddition.</p>
Full article ">Figure 2
<p>Rejection (<b>a</b>) and flux (<b>b</b>) values for the three screened solvent-resistant membranes in PolarClean green solvent at 10 bar in crossflow mode.</p>
Full article ">Scheme 1
<p>Syntheses of the size-enlarged C<sub>3</sub>-symmetric <b>Hub<sup>1</sup>-</b> and <b>Hub<sup>2</sup>-cinchona</b> organocatalysts (Type A) by CuAAC using a common cinchona azide intermediate (<b>3</b>) and trifunctional alkynes (<b>4</b> or <b>5</b>) with different chemical and structural properties. TEA: triethylamine; MsCl: methanesulfonyl chloride; DIPEA: <span class="html-italic">N</span>,<span class="html-italic">N</span>-diisopropylethylamine.</p>
Full article ">Scheme 2
<p>Synthesis of the size-enlarged C<sub>3</sub>-symmetric <b>Hub<sup>3</sup>-cinchona</b> organocatalyst by Williamson ether formation.</p>
Full article ">Scheme 3
<p>Convergent synthesis of size-enlarged C<sub>3</sub>-symmetric <b>Hub<sup>4</sup>-cinchona</b> organocatalyst by CuAAC using a triazide core unit (<b>10</b>). TBAI: tetra-<span class="html-italic">n</span>-butylammonium iodide; DIPEA: <span class="html-italic">N</span>,<span class="html-italic">N</span>-diisopropylethylamine.</p>
Full article ">Scheme 4
<p>Michael addition of 1,3-diphenylpropane-1,3-dione (<b>17</b>) and <span class="html-italic">trans</span>-β-nitrostyrene (<b>15</b>) catalyzed by <b>Hub<sup>3</sup>-cinchona</b> organocatalyst.</p>
Full article ">
18 pages, 584 KiB  
Article
Atomic Cascade Computations
by Stephan Fritzsche, Patrick Palmeri and Stefan Schippers
Symmetry 2021, 13(3), 520; https://doi.org/10.3390/sym13030520 - 23 Mar 2021
Cited by 27 | Viewed by 3907
Abstract
Atomic cascades are ubiquitous in nature and they have been explored within very different scenarios, from precision measurements to the modeling of astrophysical spectra, and up to the radiation damage in biological matter. However, up to the present, a quantitative analysis of these [...] Read more.
Atomic cascades are ubiquitous in nature and they have been explored within very different scenarios, from precision measurements to the modeling of astrophysical spectra, and up to the radiation damage in biological matter. However, up to the present, a quantitative analysis of these cascades often failed because of their inherent complexity. Apart from utilizing the rotational symmetry of atoms and a proper distinction of different physical schemes, a hierarchy of useful approaches is therefore needed in order to keep cascade computations feasible. We here suggest a classification of atomic cascades and demonstrate how they can be modeled within the framework of the Jena Atomic Calculator. As an example, we shall compute within a configuration-average approach the stepwise decay cascade of atomic magnesium, following a 1s inner-shell ionization, and simulate the corresponding (final) ion distribution. Our classification of physical scenarios (schemes) and the hierarchy of computational approaches are both flexible to further refinements as well as to complex shell structures of the atoms and ions, for which the excitation and decay dynamics need to be modeled in good detail. Full article
(This article belongs to the Special Issue Development of New Methods in Atomic and Molecular Theory)
Show Figures

Figure 1

Figure 1
<p>Important building blocks of all cascade computations. Each cascade is formed by the—list of energetically sorted—levels of electron configurations (blue lines in yellow boxes) from neighbored charge states. These levels are connected to each by fine-structure transitions (red and green arrows, often called <span class="html-italic">lines</span> below) of different kind, and where the number of these transitions rapidly increases <math display="inline"><semantics> <mrow> <mo>∝</mo> <mspace width="0.222222em"/> <msub> <mi>n</mi> <mi>i</mi> </msub> <mo>×</mo> <msub> <mi>n</mi> <mi>f</mi> </msub> </mrow> </semantics></math> with the number of the initial- and final-state levels of the associated configurations. A pathway (green arrows) decribes a possible decay path of an atom and it connects three or more fine-structure levels by different excitation and/or decay processes. Moreover, one or several electron configurations can be comprised together into a single cascade block (gray frames) to properly deal with inter-electronic correlations, but to ensure that each level just belongs to one block. Apart from those configurations of an atomic cascade, which are readily derived from the atomic shell model, further <span class="html-italic">shake</span> configurations can also be considered, although this incorporation typically results in a sizeable increase of the overall complexity. Finally, pairs of cascade blocks give rise to one or several cascade steps (wide light-red arrow) in order to deal with the different atomic processes, and that occur during the relaxation of the atom or ion. The formal decomposition of a cascade into these building blocks suggests various cascade approaches, as explained in the text below.</p>
Full article ">Figure 2
<p>Simplified view of frequently occuring cascade schemes. Apart from (<b>a</b>) the stepwise decay of an initial <span class="html-italic">N</span>-electron hole-state configuration of an ion via two or more intermediate cascade blocks, including bound levels with less than (the initially) <span class="html-italic">N</span> electrons, these schemes also help account for the excitation of the atoms or ions. Such an excitation may arise from the (<b>b</b>) photoexcitation or photoionization, (<b>c</b>) electron-impact excitation, (<b>d</b>) radiative or dielectronic capture of electrons, (<b>e</b>) the formation of hollow ions via multiple electron capture, or (<b>f</b>) by a muon capture.</p>
Full article ">Figure 3
<p>Definition of the data structure <tt>Cascade.Computation</tt> in <span class="html-small-caps">Jac</span> that helps to specify all relevant data about a cascade computation as described in <a href="#sec3dot4-symmetry-13-00520" class="html-sec">Section 3.4</a>. This structure enables the user to select both, a cascade <tt>scheme::Cascade.AbstractCascadeScheme</tt> and (cascade) <tt>approach::Cascade.AbstractCascadeApproach</tt> in order to distinguish different computational models for a cascade.</p>
Full article ">Figure 4
<p>Definition of the data structures <tt>Cascade.StepwiseDecayScheme</tt> (upper panel) and <tt>Cascade.PhotonIonizationScheme</tt> (lower panel) in <span class="html-small-caps">Jac</span>. For each of these structures, different information must be given to control the corresponding cascade computations. In particular, the subfield <tt>processes::Array{Basics.AbstractProcess,1</tt>} allow the user to specify the processes, such as <tt>Auger(), Radiative(), ...</tt>, and which are taken into account to determine the cascade blocks.</p>
Full article ">Figure 5
<p>Selected printout from the example in <a href="#sec4dot3-symmetry-13-00520" class="html-sec">Section 4.3</a>. Apart from the initial levels (multiplet), this printout lists the cascade tree, the generated blocks, and steps of the cascade, as well as a summary of all generated continuum orbitals and transition amplitudes. This printout can indeed be quite long, but it enables the user to reconstruct the individual calculations and check for inconsistencies or warning that are issued during the execution.</p>
Full article ">Figure 6
<p>(<b>a</b>) Level structure of the <math display="inline"><semantics> <mrow> <mn>1</mn> <mi>s</mi> <mo>→</mo> <mn>3</mn> <mi>p</mi> </mrow> </semantics></math> excited neutral and <math display="inline"><semantics> <mrow> <mn>1</mn> <mi>s</mi> </mrow> </semantics></math> ionized atomic magnesium. (<b>b</b>) Comparison of the final ion distribution for the <math display="inline"><semantics> <mrow> <mn>1</mn> <mi>s</mi> </mrow> </semantics></math> hole-state levels as obtained in the averaged single-configuration approach <tt>(AverageSCA)</tt>. Relative ion distribution are shown for an initially occupied <math display="inline"><semantics> <mrow> <mn>1</mn> <mi>s</mi> <mspace width="0.166667em"/> <mn>2</mn> <msup> <mi>s</mi> <mn>2</mn> </msup> <mn>2</mn> <msup> <mi>p</mi> <mn>6</mn> </msup> <mn>3</mn> <msup> <mi>s</mi> <mn>2</mn> </msup> <mn>3</mn> <mi>p</mi> <mspace width="0.277778em"/> <msup> <mspace width="0.222222em"/> <mn>1</mn> </msup> <msub> <mi>P</mi> <mn>1</mn> </msub> </mrow> </semantics></math> level of neutral Mg (red bars), a statistical distribution of all four <math display="inline"><semantics> <mrow> <mn>1</mn> <mi>s</mi> <mspace width="0.166667em"/> <mn>2</mn> <msup> <mi>s</mi> <mn>2</mn> </msup> <mn>2</mn> <msup> <mi>p</mi> <mn>6</mn> </msup> <mn>3</mn> <msup> <mi>s</mi> <mn>2</mn> </msup> <mn>3</mn> <mi>p</mi> <mspace width="0.277778em"/> <msup> <mspace width="0.222222em"/> <mrow> <mn>1</mn> <mo>,</mo> <mn>3</mn> </mrow> </msup> <msub> <mi>P</mi> <mi>J</mi> </msub> </mrow> </semantics></math> levels (blue bars) for the <math display="inline"><semantics> <mrow> <mn>1</mn> <mi>s</mi> </mrow> </semantics></math> ionized <math display="inline"><semantics> <mrow> <mn>1</mn> <mi>s</mi> <mspace width="0.166667em"/> <mn>2</mn> <msup> <mi>s</mi> <mn>2</mn> </msup> <mn>2</mn> <msup> <mi>p</mi> <mn>6</mn> </msup> <mn>3</mn> <msup> <mi>s</mi> <mn>2</mn> </msup> <mspace width="0.277778em"/> <msup> <mspace width="0.222222em"/> <mn>2</mn> </msup> <msub> <mi>S</mi> <mrow> <mn>1</mn> <mo>/</mo> <mn>2</mn> </mrow> </msub> </mrow> </semantics></math> level of Mg<math display="inline"><semantics> <msup> <mrow/> <mo>+</mo> </msup> </semantics></math> (orange bars). The small difference between the red and blue bars arises from the contributions of different decay paths.</p>
Full article ">
19 pages, 3409 KiB  
Article
Implementation and Evaluation of Physical, Hybrid, and Virtual Testbeds for Cybersecurity Analysis of Industrial Control Systems
by Andres Robles-Durazno, Naghmeh Moradpoor, James McWhinnie, Gordon Russell and Jorge Porcel-Bustamante
Symmetry 2021, 13(3), 519; https://doi.org/10.3390/sym13030519 - 23 Mar 2021
Cited by 8 | Viewed by 3856
Abstract
Industrial Control Systems are an essential part of our daily lives and can be found in industries such as oil, utilities, and manufacturing. Rapid growth in technology has introduced industrial components with network capabilities that allow them to communicate with traditional computer networks, [...] Read more.
Industrial Control Systems are an essential part of our daily lives and can be found in industries such as oil, utilities, and manufacturing. Rapid growth in technology has introduced industrial components with network capabilities that allow them to communicate with traditional computer networks, thus increasing their exposure to cyber-attacks. Current research on Industrial Control Systems suffer from lack of technical information as these systems are part of critical infrastructures. To overcome this, researchers have employed different types of testbeds to develop their mechanisms of cyber-attack detection and prevention. This manuscript describes, implements, and evaluates physical, hybrid, and virtual application of a clean water supply system developed for cybersecurity research. The results show that physical testbeds allow an understanding of the behaviour and dynamics of control components like sensors and actuators, which might be affected by external influences such as noise, vibration, temperature, and non-ideal device behaviour. Although, hybrid testbeds reduce the cost of implementation, they ignore the physical dynamics of the system as explained above. Virtual testbeds are the cheapest option in comparison with physical and hybrid testbeds; however, they provide a limited view of the control system operation that could have negative consequences when developing a detection/prevention system. Full article
(This article belongs to the Section Computer)
Show Figures

Figure 1

Figure 1
<p>Industrial Control System (ICS) Architecture: (<b>a</b>) 1 Purdue Model for Control Hierarchy logical framework; (<b>b</b>) ICS reference model.</p>
Full article ">Figure 2
<p>Hybrid testbed: (<b>a</b>) CWSS virtual process; (<b>b</b>) Festo rig components.</p>
Full article ">Figure 3
<p>Physical testbed diagram: (<b>a</b>) Festo MPA Process Control Rig.; (<b>b</b>) Festo MPA Process Control Rig Diagram.</p>
Full article ">Figure 4
<p>CWSS-H testbed architecture.</p>
Full article ">Figure 5
<p>CWSS-V testbed.</p>
Full article ">Figure 6
<p>CWSS Transfer Function.</p>
Full article ">Figure 7
<p>CWSS-P and CWSS-H during normal operation and attack conditions.</p>
Full article ">Figure 8
<p>CWSS Virtual Plant Normal Operation.</p>
Full article ">Figure 9
<p>CWSS Transfer function.</p>
Full article ">
16 pages, 1619 KiB  
Article
An Improved SPSIM Index for Image Quality Assessment
by Mariusz Frackiewicz, Grzegorz Szolc and Henryk Palus
Symmetry 2021, 13(3), 518; https://doi.org/10.3390/sym13030518 - 22 Mar 2021
Cited by 8 | Viewed by 2496
Abstract
Objective image quality assessment (IQA) measures are playing an increasingly important role in the evaluation of digital image quality. New IQA indices are expected to be strongly correlated with subjective observer evaluations expressed by Mean Opinion Score (MOS) or Difference Mean Opinion Score [...] Read more.
Objective image quality assessment (IQA) measures are playing an increasingly important role in the evaluation of digital image quality. New IQA indices are expected to be strongly correlated with subjective observer evaluations expressed by Mean Opinion Score (MOS) or Difference Mean Opinion Score (DMOS). One such recently proposed index is the SuperPixel-based SIMilarity (SPSIM) index, which uses superpixel patches instead of a rectangular pixel grid. The authors of this paper have proposed three modifications to the SPSIM index. For this purpose, the color space used by SPSIM was changed and the way SPSIM determines similarity maps was modified using methods derived from an algorithm for computing the Mean Deviation Similarity Index (MDSI). The third modification was a combination of the first two. These three new quality indices were used in the assessment process. The experimental results obtained for many color images from five image databases demonstrated the advantages of the proposed SPSIM modifications. Full article
Show Figures

Figure 1

Figure 1
<p>Similarity maps for the mean deviation similarity index (MDSI): (<b>a</b>) reference image, (<b>b</b>) distorted image, (<b>c</b>) color similarity map <math display="inline"><semantics> <mrow> <mover accent="true"> <mrow> <mi>C</mi> <mi>S</mi> </mrow> <mo>^</mo> </mover> <mrow> <mo stretchy="false">(</mo> <mi>x</mi> <mo stretchy="false">)</mo> </mrow> </mrow> </semantics></math>, (<b>d</b>) similarity map <math display="inline"><semantics> <mrow> <mover accent="true"> <mrow> <mi>G</mi> <mi>C</mi> <mi>S</mi> </mrow> <mo>^</mo> </mover> <mrow> <mo stretchy="false">(</mo> <mi>x</mi> <mo stretchy="false">)</mo> </mrow> </mrow> </semantics></math>.</p>
Full article ">Figure 1 Cont.
<p>Similarity maps for the mean deviation similarity index (MDSI): (<b>a</b>) reference image, (<b>b</b>) distorted image, (<b>c</b>) color similarity map <math display="inline"><semantics> <mrow> <mover accent="true"> <mrow> <mi>C</mi> <mi>S</mi> </mrow> <mo>^</mo> </mover> <mrow> <mo stretchy="false">(</mo> <mi>x</mi> <mo stretchy="false">)</mo> </mrow> </mrow> </semantics></math>, (<b>d</b>) similarity map <math display="inline"><semantics> <mrow> <mover accent="true"> <mrow> <mi>G</mi> <mi>C</mi> <mi>S</mi> </mrow> <mo>^</mo> </mover> <mrow> <mo stretchy="false">(</mo> <mi>x</mi> <mo stretchy="false">)</mo> </mrow> </mrow> </semantics></math>.</p>
Full article ">Figure 2
<p>Local similarity maps for the superpixel-based similarity (SPSIM) index (100 superpixels): (<b>a</b>) reference image, (<b>b</b>) distorted image, (<b>c</b>) luminance similarity map, (<b>d</b>) chrominance similarity map, (<b>e</b>) gradient similarity map.</p>
Full article ">Figure 3
<p>Local similarity maps for the SPSIM index (400 superpixels): (<b>a</b>) reference image, (<b>b</b>) distorted image, (<b>c</b>) luminance similarity map, (<b>d</b>) chrominance similarity map, (<b>e</b>) gradient similarity map.</p>
Full article ">Figure 4
<p>Flowchart of SPSIM with locations of proposed modifications (green boxes).</p>
Full article ">Figure 5
<p>Konstanz Artificially Distorted Image quality Database (KADID-10k): reference images.</p>
Full article ">
16 pages, 2148 KiB  
Article
Optical-Cavity-Induced Current
by Garret Moddel, Ayendra Weerakkody, David Doroski and Dylan Bartusiak
Symmetry 2021, 13(3), 517; https://doi.org/10.3390/sym13030517 - 22 Mar 2021
Cited by 8 | Viewed by 22132
Abstract
The formation of a submicron optical cavity on one side of a metal–insulator–metal (MIM) tunneling device induces a measurable electrical current between the two metal layers with no applied voltage. Reducing the cavity thickness increases the measured current. Eight types of tests were [...] Read more.
The formation of a submicron optical cavity on one side of a metal–insulator–metal (MIM) tunneling device induces a measurable electrical current between the two metal layers with no applied voltage. Reducing the cavity thickness increases the measured current. Eight types of tests were carried out to determine whether the output could be due to experimental artifacts. All gave negative results, supporting the conclusion that the observed electrical output is genuinely produced by the device. We interpret the results as being due to the suppression of vacuum optical modes by the optical cavity on one side of the MIM device, which upsets a balance in the injection of electrons excited by zero-point fluctuations. This interpretation is in accord with observed changes in the electrical output as other device parameters are varied. A feature of the MIM devices is their femtosecond-fast transport and scattering times for hot charge carriers. The fast capture in these devices is consistent with a model in which an energy ∆E may be accessed from zero-point fluctuations for a time ∆t, following a ∆Et uncertainty-principle-like relation governing the process. Full article
(This article belongs to the Special Issue Symmetries in Quantum Mechanics)
Show Figures

Figure 1

Figure 1
<p>Device cross section, showing a metal–insulator–metal (MIM) structure adjoining an optical cavity. The electrical characteristics of the device are measured between the two metal layers of the MIM structure, where the polarity of the upper electrode voltage is with reference to the base electrode, which is defined as ground. Positive current is defined to be in the direction of the arrow.</p>
Full article ">Figure 2
<p>Germanium shadow mask (GSM) device fabrication. (<b>a</b>) Depiction of fabrication process, showing a cross-sectional view of materials deposited under a germanium bridge. The NiO<sub>x</sub> and Al<sub>2</sub>O<sub>3</sub> insulating layer formed over the Ni layer is not shown. The active area of the device is formed in the overlap region. (<b>b</b>) A scanning electron microscope (SEM) image of a completed device, with an overlap area of 0.02 ± 0.006 µm<sup>2</sup>. The Ni and Pd-coated regions are indicated; the lightest regions, in the center and at the left and right-hand sides, are coated with both Ni and Pd layers with the insulator layer between them.</p>
Full article ">Figure 3
<p>Photolithographic device. Top view of devices formed by the standard photolithographic technique. The overlap of the pallidum upper electrode, shown to the right, with the nickel lower electrode, shown to the left, forms active square regions with edge lengths between 5 and 100 µm.</p>
Full article ">Figure 4
<p>Electrical response as a function of cavity thickness. (<b>a</b>) Current as a function of voltage for different polymethyl methacrylate (PMMA) cavity thicknesses. (<b>b</b>) Short-circuit current as a function of cavity thickness for PMMA and SiO<sub>2</sub>–filled cavities.</p>
Full article ">Figure 5
<p>Tests for photoinjection of hot carriers through the Pd upper electrode and through the insulator. (<b>a</b>) Short-circuit current as a function of upper electrode Pd thickness. (<b>b</b>) Short-circuit current as a function of effective insulator thickness. Both trends are consistent with hot-carrier photoinjection from optical fields in the optical cavity.</p>
Full article ">Figure 6
<p>Two tests to check whether the measured current could be an experimental artifact. (<b>a</b>) Short-circuit current as a function of time over a period of four hours for a GSM device. (<b>b</b>) Short-circuit current as a function of active device area, as defined by the upper electrode area, for devices fabricated using the photolithography process.</p>
Full article ">Figure 7
<p>Measurements of device arrays. (<b>a</b>) Schematic representation of a 4 × 4 staggered array, where the circuit symbols represent cavity/electronic-device elements; the measured total short-circuit current between the top and bottom bars and the open-circuit voltage are each four times that for a single element. (<b>b</b>) Measured short-circuit current and open-circuit voltage for single devices, staggered 4 × 4 arrays, and series–parallel arrays consisting of four parallel sets of four devices in series.</p>
Full article ">Figure 8
<p>Effect of cavity formation on short-circuit current. The anneal was carried out at 180 °C for 15 min to replicate the mirror processing temperature cycle. Only a completed device produces a significant current.</p>
Full article ">Figure 9
<p>Comparison of resistance values across the optical cavity transparent dielectrics and across MIM structures. Because of the much higher resistance between the mirror and upper electrode than between the upper and the base electrodes (shown in <a href="#symmetry-13-00517-f001" class="html-fig">Figure 1</a>), the currents observed between the electrodes could not be the result of leakage from the mirror.</p>
Full article ">Figure 10
<p>Effect of blocking ambient electromagnetic radiation during measurement of current-voltage characteristics. The characteristics measured under open ambient conditions did not change when the device was place in mu-metal or aluminum boxes.</p>
Full article ">Figure 11
<p>Test for possible thermoelectric effects. The electrical output is measured as the difference between the substrate and ambient temperatures is varied. The measured short-circuit current and open-circuit voltage does not vary, providing evidence that such a temperature difference is not the source of the measured electrical output.</p>
Full article ">Figure 12
<p>Cross section of the photoinjector device, showing optically generated electron current component <b>A</b>, and internally generated components <b>B</b> and <b>C</b>.</p>
Full article ">
21 pages, 1483 KiB  
Article
The Resonant and Normal Auger Spectra of Ozone
by Simone Taioli and Stefano Simonucci
Symmetry 2021, 13(3), 516; https://doi.org/10.3390/sym13030516 - 22 Mar 2021
Cited by 4 | Viewed by 2460
Abstract
In this work, we outline a general method for calculating Auger spectra in molecules, which accounts for the underlying symmetry of the system. This theory starts from Fano’s formulation of the interaction between discrete and continuum states, and it generalizes this formalism to [...] Read more.
In this work, we outline a general method for calculating Auger spectra in molecules, which accounts for the underlying symmetry of the system. This theory starts from Fano’s formulation of the interaction between discrete and continuum states, and it generalizes this formalism to deal with the simultaneous presence of several intermediate quasi-bound states and several non-interacting decay channels. Our theoretical description is specifically tailored to resonant autoionization and Auger processes, and it explicitly includes the incoming wave boundary conditions for the continuum states and an accurate treatment of the Coulomb repulsion. This approach is implemented and applied to the calculation of the KLL Auger and autoionization spectra of ozone, which is a C2v symmetric molecule, whose importance in our atmosphere to filter out radiation has been widely confirmed. We also show the effect that the molecular point group and, in particular, the localization of the core-hole in the oxygen atoms related by symmetry operations, has on the electronic structure of the Auger states and on the spectral lineshape by comparing our results with the experimental data. Full article
(This article belongs to the Special Issue Symmetry and Molecular Spectroscopy)
Show Figures

Figure 1

Figure 1
<p>Ozone geometry in the ground state.</p>
Full article ">Figure 2
<p><math display="inline"><semantics> <mrow> <mi>K</mi> <mo>−</mo> <mi>L</mi> <mi>L</mi> </mrow> </semantics></math> Auger spectrum of ozone, where <math display="inline"><semantics> <mrow> <mi>K</mi> <mo>=</mo> <mn>1</mn> <msub> <mi>a</mi> <mn>1</mn> </msub> </mrow> </semantics></math>. Green line: HF level of theory with 80 independent final states, obtained by diagonalization of the multichannel Hamiltonian (<a href="#FD24-symmetry-13-00516" class="html-disp-formula">24</a>). The black, red, and blue lines represent the spectral lineshape obtained with an active space of 27 molecular orbitals and a number of 20, 70, 140 independent final channels, respectively.</p>
Full article ">Figure 3
<p><math display="inline"><semantics> <mrow> <mi>K</mi> <mo>−</mo> <mi>L</mi> <mi>L</mi> </mrow> </semantics></math> Auger spectrum of ozone, where <math display="inline"><semantics> <mrow> <mi>K</mi> <mo>=</mo> <mn>1</mn> <msub> <mi>b</mi> <mn>1</mn> </msub> </mrow> </semantics></math>. Green line: HF level of theory with 80 independent final states, obtained by diagonalization of the multichannel Hamiltonian (<a href="#FD24-symmetry-13-00516" class="html-disp-formula">24</a>). Black, red, and blue lines represent the spectral lineshape obtained with an active space of 27 molecular orbitals and a number of 20, 70, and 140 independent final channels, respectively.</p>
Full article ">Figure 4
<p><math display="inline"><semantics> <mrow> <mi>K</mi> <mo>−</mo> <mi>L</mi> <mi>L</mi> </mrow> </semantics></math> Auger spectrum of ozone, where <math display="inline"><semantics> <mrow> <mi>K</mi> <mo>=</mo> <mn>2</mn> <msub> <mi>a</mi> <mn>1</mn> </msub> </mrow> </semantics></math>. Green line: HF level of theory with 80 independent final states, obtained by diagonalization of the multichannel Hamiltonian (<a href="#FD24-symmetry-13-00516" class="html-disp-formula">24</a>). Black, red, and blue lines represent the spectral lineshape obtained with an active space of 27 molecular orbitals and a number of 20, 70, and 140 independent final channels, respectively.</p>
Full article ">Figure 5
<p>A comparison between the <math display="inline"><semantics> <mrow> <mi>K</mi> <mo>−</mo> <mi>L</mi> <mi>L</mi> </mrow> </semantics></math> (<math display="inline"><semantics> <mrow> <mi>K</mi> <mo>=</mo> <mn>1</mn> <msub> <mi>a</mi> <mn>1</mn> </msub> </mrow> </semantics></math>) Auger experimental spectrum of ozone (black line) [<a href="#B10-symmetry-13-00516" class="html-bibr">10</a>] and our first-principles simulation (green line) obtained with an active space of 27 molecular orbitals and 140 independent final channels. Our lineshapes were convolved via 0.8 eV Gaussian function to achieve the experimental broadening.</p>
Full article ">Figure 6
<p><math display="inline"><semantics> <mrow> <mi>O</mi> <mn>1</mn> <mi>s</mi> <mo>→</mo> <msup> <mi>σ</mi> <mo>∗</mo> </msup> </mrow> </semantics></math> autoionization spectrum of ozone. Red, blue lines: CIS lineshapes with 140 final states obtained upon diagonalization of the multichannel Hamiltonian (<a href="#FD24-symmetry-13-00516" class="html-disp-formula">24</a>). The core-hole belongs to molecular symmetry orbitals, which are optimized using HF and extend all over the ozone molecule. However, upon CI the hole relocalizes in one of the two oxygen atoms (<math display="inline"><semantics> <msub> <mi>O</mi> <mi>T</mi> </msub> </semantics></math>) related by symmetry operations (see inset). Green line: the spectral lineshape for a core-hole relocalized after the CIS procedure in the central oxygen atom <math display="inline"><semantics> <msub> <mi>O</mi> <mi>C</mi> </msub> </semantics></math>.</p>
Full article ">Figure 7
<p><math display="inline"><semantics> <mrow> <mi>K</mi> <mo>−</mo> <mi>L</mi> <mi>L</mi> </mrow> </semantics></math> Auger spectrum of ozone obtained from CIS calculations after convolution with both Lorentzian functions having the theoretical widths and with 1 eV full width at half maximum (FWHM) Gaussian functions to reproduce the combined effect of the finite resolution of the spectrometer and of the nuclear vibrations. Black line: HF orbitals optimized starting from an atomic core-hole localized in one of the two <math display="inline"><semantics> <msub> <mi>O</mi> <mi>T</mi> </msub> </semantics></math> oxygen centers. Red line: HF orbitals are optimized with the initial core-hole “delocalized” in the molecular symmetry orbitals. Calculations were carried out with an active space of 27 molecular orbitals and 140 independent final channels, including the interchannel coupling (<a href="#FD24-symmetry-13-00516" class="html-disp-formula">24</a>).</p>
Full article ">
24 pages, 6317 KiB  
Article
Salt and Pepper Noise Removal Method Based on a Detail-Aware Filter
by Hu Liang, Na Li and Shengrong Zhao
Symmetry 2021, 13(3), 515; https://doi.org/10.3390/sym13030515 - 21 Mar 2021
Cited by 10 | Viewed by 4886
Abstract
The median-type filter is an effective technique to remove salt and pepper (SAP) noise; however, such a mechanism cannot always effectively remove noise and preserve details due to the local diversity singularity and local non-stationarity. In this paper, a two-step SAP removal method [...] Read more.
The median-type filter is an effective technique to remove salt and pepper (SAP) noise; however, such a mechanism cannot always effectively remove noise and preserve details due to the local diversity singularity and local non-stationarity. In this paper, a two-step SAP removal method was proposed based on the analysis of the median-type filter errors. In the first step, a median-type filter was used to process the image corrupted by SAP noise. Then, in the second step, a novel-designed adaptive nonlocal bilateral filter is used to weaken the error of the median-type filter. By building histograms of median-type filter errors, we found that the error almost obeys Gaussian–Laplacian mixture distribution statistically. Following this, an improved bilateral filter was proposed to utilize the nonlocal feature and bilateral filter to weaken the median-type filter errors. In the proposed filter, (1) the nonlocal strategy is introduced to improve the bilateral filter, and the intensity similarity is measured between image patches instead pixels; (2) a novel norm based on half-quadratic estimation is used to measure the image patch- spatial proximity and intensity similarity, instead of fixed L1 and L2 norms; (3) besides, the scale parameters, which were used to control the behavior of the half-quadratic norm, were updated based on the local image feature. Experimental results showed that the proposed method performed better compared with the state-of-the-art methods. Full article
(This article belongs to the Section Computer)
Show Figures

Figure 1

Figure 1
<p>Error image and the corresponding histogram. (<b>a</b>) Error image between <span class="html-italic">I</span> and <span class="html-italic">I</span><span class="html-italic"><sub>ori</sub></span> for image “Lena”; (<b>b</b>) histogram of (<b>a</b>); (<b>c</b>) error image between <span class="html-italic">I</span><span class="html-italic"><sub>ori</sub></span> and <math display="inline"><semantics> <mrow> <msub> <mover accent="true"> <mi>I</mi> <mo stretchy="false">^</mo> </mover> <mrow> <mi>m</mi> <mi>f</mi> </mrow> </msub> </mrow> </semantics></math> for the image “Lena”; (<b>d</b>) histograms of the error image for 10 images.</p>
Full article ">Figure 2
<p>Curve of <math display="inline"><semantics> <mrow> <mi>ψ</mi> <mo stretchy="false">(</mo> <mi>t</mi> <mo stretchy="false">)</mo> </mrow> </semantics></math> with different <span class="html-italic">a</span> values.</p>
Full article ">Figure 3
<p>Simple example.</p>
Full article ">Figure 4
<p>Twelve test images. (<b>a</b>) Cameraman; (<b>b</b>)Barbara; (<b>c</b>) Couple; (<b>d</b>) Dog; (<b>e</b>) Lena; (<b>f</b>) Man-made; (<b>g</b>) Pepper; (<b>h</b>) Zebra; (<b>i</b>)Baboon; (<b>j</b>) Street; (<b>k</b>) Boat; (<b>l</b>) Man.</p>
Full article ">Figure 5
<p>Comparisons of the pre- and post-processed images. In each line, the left part is the original image, the middle part is the zoomed details. The pre-processed marked “1”, the post-processed marked “2”. The right part is the corresponding error images, the first one is pre-processed error, the second one is post-processed error.</p>
Full article ">Figure 6
<p>Comparison of different methods. From top left to right down: the curves of IEF vs. noise intensity achieved for the images Baboon, Pepper, Man-made, Lena, Couple, Cameraman, Barbara, Street.</p>
Full article ">Figure 7
<p>Results of different algorithms for Barbara image with 60% noise intensity. The subfigures in rounded rectangle are corresponding to original image, MF, ACWMF, DBA, NAFSM, NASEPF, INLM, DAMF, FSAP, and our proposed method, respectively.</p>
Full article ">Figure 8
<p>Results of different algorithms for Cameraman image with 70% noise intensity. The subfigures in the first line from left to right are corresponding to original image, MF, ACWMF, DBA, and NAFSM, respectively. The subfigures in the third line from left to right are NASEPF, INLM, DAMF, FSAP, and our proposed method, respectively.</p>
Full article ">Figure 9
<p>Results of different algorithms for Man-made image with 80% noise intensity. The first and third lines are original image, MF, ACWMF, DBA, NAFSM, NASEPF, INLM, DAMF, FSAP, and our proposed method. The second and fourth lines are noise image and corresponding error images.</p>
Full article ">Figure 10
<p>Results of different algorithms for Lena image with 90% noise intensity. The first and third lines are original image, MF, ACWMF, DBA, NAFSM, NASEPF, INLM, DAMF, FSAP, and our proposed method. The second and fourth lines are noise image and corresponding error images.</p>
Full article ">Figure 11
<p>Average running time comparison based on different search window sizes for (<b>a</b>) 512 × 512 images and (<b>b</b>) 256 × 256 images. The provided values of search window size are 7 × 7, 11 × 11, 15 × 15, and 21 × 21.</p>
Full article ">
13 pages, 791 KiB  
Article
Quark Cluster Expansion Model for Interpreting Finite-T Lattice QCD Thermodynamics
by David Blaschke, Kirill A. Devyatyarov and Olaf Kaczmarek
Symmetry 2021, 13(3), 514; https://doi.org/10.3390/sym13030514 - 21 Mar 2021
Cited by 1 | Viewed by 1995
Abstract
In this work, we present a unified approach to the thermodynamics of hadron–quark–gluon matter at finite temperatures on the basis of a quark cluster expansion in the form of a generalized Beth–Uhlenbeck approach with a generic ansatz for the hadronic phase shifts that [...] Read more.
In this work, we present a unified approach to the thermodynamics of hadron–quark–gluon matter at finite temperatures on the basis of a quark cluster expansion in the form of a generalized Beth–Uhlenbeck approach with a generic ansatz for the hadronic phase shifts that fulfills the Levinson theorem. The change in the composition of the system from a hadron resonance gas to a quark–gluon plasma takes place in the narrow temperature interval of 150–190 MeV, where the Mott dissociation of hadrons is triggered by the dropping quark mass as a result of the restoration of chiral symmetry. The deconfinement of quark and gluon degrees of freedom is regulated by the Polyakov loop variable that signals the breaking of the Z(3) center symmetry of the color SU(3) group of QCD. We suggest a Polyakov-loop quark–gluon plasma model with O(αs) virial correction and solve the stationarity condition of the thermodynamic potential (gap equation) for the Polyakov loop. The resulting pressure is in excellent agreement with lattice QCD simulations up to high temperatures. Full article
(This article belongs to the Special Issue Chiral Symmetry in Physics)
Show Figures

Figure 1

Figure 1
<p>Comparison of the fit (<a href="#FD11-symmetry-13-00514" class="html-disp-formula">11</a>) for the temperature dependence of the chiral condensate <math display="inline"><semantics> <mrow> <msub> <mo>Δ</mo> <mrow> <mi>l</mi> <mo>,</mo> <mi>s</mi> </mrow> </msub> <mrow> <mo>(</mo> <mi>T</mi> <mo>)</mo> </mrow> </mrow> </semantics></math> and the LQCD data for it from the Wuppertal–Budapest Collaboration [<a href="#B1-symmetry-13-00514" class="html-bibr">1</a>] and the hotQCD Collaboration [<a href="#B2-symmetry-13-00514" class="html-bibr">2</a>].</p>
Full article ">Figure 2
<p>Pressure as a function of temperature for the HRG model with stable hadrons (red line) and for the MHRG model with Mott dissociation of hadrons according to the simple phase shift model (<a href="#FD4-symmetry-13-00514" class="html-disp-formula">4</a>) employed in the present work. These results are compared to the LQCD data from the HotQCD Collaboration [<a href="#B4-symmetry-13-00514" class="html-bibr">4</a>] (green band) and the Wuppertal–Budapest Collaboration [<a href="#B3-symmetry-13-00514" class="html-bibr">3</a>] (blue band).</p>
Full article ">Figure 3
<p>Two-loop diagram for the contribution of the one-gluon exchange interaction to the thermodynamic potential of quark matter.</p>
Full article ">Figure 4
<p>The traced Polyakov loop <math display="inline"><semantics> <mi>ϕ</mi> </semantics></math> from the solution of the stationarity condition (<a href="#FD23-symmetry-13-00514" class="html-disp-formula">23</a>) on the thermodynamical potential as a function of temperature (magenta solid line) compared with the lattice results for the renormalized Polyakov loop the TU Munich QCD (TUMQCD) Collaboration [<a href="#B32-symmetry-13-00514" class="html-bibr">32</a>] (green band) and the Wuppertal–Budapest Collaboration [<a href="#B1-symmetry-13-00514" class="html-bibr">1</a>] (blue symbols).</p>
Full article ">Figure 5
<p>The temperature derivatives of the chiral condensate (chiral susceptibility <math display="inline"><semantics> <mrow> <mi>d</mi> <msub> <mo>Δ</mo> <mrow> <mi>l</mi> <mo>,</mo> <mi>s</mi> </mrow> </msub> <mo>/</mo> <mi>d</mi> <mi>T</mi> </mrow> </semantics></math>, red solid line) and of the Polyakov loop (Polyakov-loop susceptibility <math display="inline"><semantics> <mrow> <mi>d</mi> <mi>ϕ</mi> <mo>/</mo> <mi>d</mi> <mi>T</mi> </mrow> </semantics></math>, ) as functions of temperature. The vertical lines indicate their almost coincident peak positions at <math display="inline"><semantics> <mrow> <msub> <mi>T</mi> <mi>χ</mi> </msub> <mo>=</mo> <mn>156.5</mn> </mrow> </semantics></math> MeV and <math display="inline"><semantics> <mrow> <msub> <mi>T</mi> <mi>ϕ</mi> </msub> <mo>=</mo> <mn>159.0</mn> </mrow> </semantics></math> MeV, respectively.</p>
Full article ">Figure 6
<p>The temperature dependence of the total scaled pressure (red solid line) and it’s constituents: MHRG (coral dotted line), quark (dashed magenta line), Polyakov-loop potential <math display="inline"><semantics> <mrow> <mi mathvariant="script">U</mi> <mo>(</mo> <mi>T</mi> <mo>;</mo> <mi>ϕ</mi> <mo>)</mo> </mrow> </semantics></math> (dash–dotted green line) and perturbative QCD contribution (dash-dotted blue line) compared to the lattice QCD data: HotQCD Collaboration [<a href="#B4-symmetry-13-00514" class="html-bibr">4</a>] (green band) and Wuppertal–Budapest Collaboration [<a href="#B3-symmetry-13-00514" class="html-bibr">3</a>] (blue band).</p>
Full article ">Figure 7
<p>The temperature dependence of the total scaled pressure (red solid line) and its constituents: MHRG (coral dotted line), quark (dashed magenta line), Polyakov-loop potential <math display="inline"><semantics> <mrow> <mi>U</mi> <mo>(</mo> <mi>ϕ</mi> <mo>,</mo> <mi>T</mi> <mo>)</mo> </mrow> </semantics></math> (dash-dotted green line) and perturbative QCD contribution (dash-dotted blue line) compared to the lattice QCD data: HotQCD Collaboration [<a href="#B4-symmetry-13-00514" class="html-bibr">4</a>] (green band) and Wuppertal–Budapest Collaboration [<a href="#B3-symmetry-13-00514" class="html-bibr">3</a>] (blue band), and the high-temperature result [<a href="#B33-symmetry-13-00514" class="html-bibr">33</a>] (magenta band).</p>
Full article ">Figure 8
<p>The dimensionless ratio of quark number density to quark number susceptibility <math display="inline"><semantics> <mrow> <msub> <mi>R</mi> <mn>12</mn> </msub> <mrow> <mo>(</mo> <mi>T</mi> <mo>)</mo> </mrow> <mo>=</mo> <msub> <mi>n</mi> <mi>q</mi> </msub> <mrow> <mo>(</mo> <mi>T</mi> <mo>)</mo> </mrow> <mo>/</mo> <mrow> <mo>(</mo> <msub> <mi>μ</mi> <mi>q</mi> </msub> <msub> <mi>χ</mi> <mi>q</mi> </msub> <mrow> <mo>(</mo> <mi>T</mi> <mo>)</mo> </mrow> <mo>)</mo> </mrow> <msub> <mrow> <mo>|</mo> </mrow> <mrow> <msub> <mi>μ</mi> <mi>q</mi> </msub> <mo>=</mo> <mn>0</mn> </mrow> </msub> </mrow> </semantics></math> as a function of temperature for <math display="inline"><semantics> <mrow> <msub> <mi>μ</mi> <mi>q</mi> </msub> <mo>/</mo> <mi>T</mi> <mo>=</mo> <mn>0.4</mn> </mrow> </semantics></math> (red solid line) and <math display="inline"><semantics> <mrow> <msub> <mi>μ</mi> <mi>q</mi> </msub> <mo>/</mo> <mi>T</mi> <mo>=</mo> <mn>0.8</mn> </mrow> </semantics></math> (blue dash-dotted line) compared to the lattice QCD data [<a href="#B34-symmetry-13-00514" class="html-bibr">34</a>] <math display="inline"><semantics> <mrow> <msub> <mi>μ</mi> <mi>q</mi> </msub> <mo>/</mo> <mi>T</mi> <mo>=</mo> <mn>0.4</mn> </mrow> </semantics></math> (red band), <math display="inline"><semantics> <mrow> <msub> <mi>μ</mi> <mi>q</mi> </msub> <mo>/</mo> <mi>T</mi> <mo>=</mo> <mn>0.8</mn> </mrow> </semantics></math> (blue band). For details, see text.</p>
Full article ">
15 pages, 447 KiB  
Article
Graphs with Minimal Strength
by Zhen-Bin Gao, Gee-Choon Lau and Wai-Chee Shiu
Symmetry 2021, 13(3), 513; https://doi.org/10.3390/sym13030513 - 21 Mar 2021
Cited by 5 | Viewed by 1834
Abstract
For any graph G of order p, a bijection f:V(G){1,2,,p} is called a numbering of G. The strength strf(G) of [...] Read more.
For any graph G of order p, a bijection f:V(G){1,2,,p} is called a numbering of G. The strength strf(G) of a numbering f of G is defined by strf(G)=max{f(u)+f(v)|uvE(G)}, and the strength str(G) of a graph G is str(G)=min{strf(G)|f is a numbering of G}. In this paper, many open problems are solved, and the strengths of new families of graphs are determined. Full article
(This article belongs to the Special Issue Graph Labelings and Their Applications)
17 pages, 333 KiB  
Article
Inverse Scattering and Soliton Solutions of Nonlocal Complex Reverse-Spacetime Modified Korteweg-de Vries Hierarchies
by Liming Ling and Wen-Xiu Ma
Symmetry 2021, 13(3), 512; https://doi.org/10.3390/sym13030512 - 21 Mar 2021
Cited by 27 | Viewed by 2331
Abstract
This paper aims to explore nonlocal complex reverse-spacetime modified Korteweg-de Vries (mKdV) hierarchies via nonlocal symmetry reductions of matrix spectral problems and to construct their soliton solutions by the inverse scattering transforms. The corresponding inverse scattering problems are formulated by building the associated [...] Read more.
This paper aims to explore nonlocal complex reverse-spacetime modified Korteweg-de Vries (mKdV) hierarchies via nonlocal symmetry reductions of matrix spectral problems and to construct their soliton solutions by the inverse scattering transforms. The corresponding inverse scattering problems are formulated by building the associated Riemann-Hilbert problems. A formulation of solutions to specific Riemann-Hilbert problems, with the jump matrix being the identity matrix, is established, where eigenvalues could equal adjoint eigenvalues, and thus N-soliton solutions to the nonlocal complex reverse-spacetime mKdV hierarchies are obtained from the reflectionless transforms. Full article
(This article belongs to the Special Issue Symmetry in the Soliton Theory)
29 pages, 3573 KiB  
Article
Plant Leaf Disease Recognition Using Depth-Wise Separable Convolution-Based Models
by Syed Mohammad Minhaz Hossain, Kaushik Deb, Pranab Kumar Dhar and Takeshi Koshiba
Symmetry 2021, 13(3), 511; https://doi.org/10.3390/sym13030511 - 21 Mar 2021
Cited by 29 | Viewed by 4263
Abstract
Proper plant leaf disease (PLD) detection is challenging in complex backgrounds and under different capture conditions. For this reason, initially, modified adaptive centroid-based segmentation (ACS) is used to trace the proper region of interest (ROI). Automatic initialization of the number of clusters (K) [...] Read more.
Proper plant leaf disease (PLD) detection is challenging in complex backgrounds and under different capture conditions. For this reason, initially, modified adaptive centroid-based segmentation (ACS) is used to trace the proper region of interest (ROI). Automatic initialization of the number of clusters (K) using modified ACS before recognition increases tracing ROI’s scalability even for symmetrical features in various plants. Besides, convolutional neural network (CNN)-based PLD recognition models achieve adequate accuracy to some extent. However, memory requirements (large-scaled parameters) and the high computational cost of CNN-based PLD models are burning issues for the memory restricted mobile and IoT-based devices. Therefore, after tracing ROIs, three proposed depth-wise separable convolutional PLD (DSCPLD) models, such as segmented modified DSCPLD (S-modified MobileNet), segmented reduced DSCPLD (S-reduced MobileNet), and segmented extended DSCPLD (S-extended MobileNet), are utilized to represent the constructive trade-off among accuracy, model size, and computational latency. Moreover, we have compared our proposed DSCPLD recognition models with state-of-the-art models, such as MobileNet, VGG16, VGG19, and AlexNet. Among segmented-based DSCPLD models, S-modified MobileNet achieves the best accuracy of 99.55% and F1-sore of 97.07%. Besides, we have simulated our DSCPLD models using both full plant leaf images and segmented plant leaf images and conclude that, after using modified ACS, all models increase their accuracy and F1-score. Furthermore, a new plant leaf dataset containing 6580 images of eight plants was used to experiment with several depth-wise separable convolution models. Full article
Show Figures

Figure 1

Figure 1
<p>The proposed framework for recognizing plant leaf disease.</p>
Full article ">Figure 2
<p>Samples of plant leaf disease images under numerous health conditions in various backgrounds and having different symptoms: (<b>a</b>) Rice Sheath-rot, (<b>b</b>) Rice Tungro, (<b>c</b>) Rice Bacterial leaf-blight, (<b>d</b>) Rice Blast, (<b>e</b>) Potato Late-blight, (<b>f</b>) Pepper Bacterial-spot, (<b>g</b>) Potato Early-blight Pepper Bacterial-spot, (<b>h</b>) Grape Black-measles, (<b>i</b>) Corn Northern Leaf-blight, (<b>j</b>) Apple Black-rot, (<b>k</b>) Mango Sooty-mold, and (<b>l</b>) Cherry Powdery-mildew.</p>
Full article ">Figure 3
<p>Directional Disturbance: (<b>a</b>) Original Rice Blast image. (<b>b</b>) Rotated by 45°. (<b>c</b>) Rotated by 90°. (<b>d</b>) Rotated by 180°. (<b>e</b>) Rotated by 270°. (<b>f</b>) Horizontal mirror symmetry. (<b>g</b>) Vertical mirror symmetry.</p>
Full article ">Figure 4
<p>Illumination Disturbance: (<b>a</b>) Original Rice Blast image. (<b>b</b>) Brightened image. (<b>c</b>) Darkened image. (<b>d</b>) Less contrast image. (<b>e</b>) More contrast image. (<b>f</b>) Sharpened image. (<b>g</b>) Blur image.</p>
Full article ">Figure 5
<p>Effect of image enhancement on recognizing PLD: (<b>a</b>) rice blast disease image, and (<b>b</b>) apple black rot disease image. (<b>c</b>,<b>d</b>) are histogram of (<b>a</b>,<b>b</b>), respectively; (<b>e</b>,<b>g</b>) are the color segmentation results of (<b>a</b>,<b>b</b>), respectively, in traditional K-means clustering having extra noise without image enhancement, and (<b>f</b>,<b>h</b>) are the segmentation results of (<b>a</b>,<b>b</b>), respectively, in our modified color segmentation algorithm with image enhancement.</p>
Full article ">Figure 6
<p>The effect of our modified segmentation technique under different critical environments: (<b>a</b>–<b>e</b>) are the RGB PLD samples. (<b>f</b>–<b>j</b>) are segmented regions of interest (ROIs) of (<b>a</b>–<b>e</b>) after implementing adaptive centroid-based segmentation.</p>
Full article ">Figure 7
<p>Comparison among various convolutions.</p>
Full article ">Figure 8
<p>Primary modules for PLD recognition. (<b>a</b>) traditional convolutional layer, (<b>b</b>) quantization friendly depth-wise separable convolution, and (<b>c</b>) depth-wise separable convolution proposed in MobileNet.</p>
Full article ">Figure 9
<p>Primary module of MobileNetV2 for PLD recognition.</p>
Full article ">Figure 10
<p>(<b>a</b>) Confusion matrix for recognizing PLDs; (<b>b</b>) ROC curve of each PLD; (<b>c</b>) Accuracy curve, and (<b>d</b>) Loss curve in S-modified MobileNet-based recognition framework.</p>
Full article ">Figure 11
<p>(<b>a</b>) Confusion matrix for recognizing PLDs; (<b>b</b>) ROC curve of each PLD; (<b>c</b>) Accuracy curve, and (<b>d</b>) Loss curve in S-reduced MobileNet-based recognition framework.</p>
Full article ">Figure 12
<p>(<b>a</b>) Confusion matrix for recognizing PLDs; (<b>b</b>) ROC curve of each PLD; (<b>c</b>) Accuracy curve, and (<b>d</b>) Loss curve in S-extended MobileNet-based recognition framework.</p>
Full article ">Figure 13
<p>Processing steps of depth-wise separable convolutional PLD (DSCPLD) recognition framework using S-modified MobileNet: (<b>a</b>) Original Rice Blast image. (<b>b</b>) Segmented image after applying adaptive centroid-based segmentation (ACS). (<b>c</b>) Activations on the first CONV layer. (<b>d</b>) Activations on the first ReLU layer. (<b>e</b>) Activations on the first Max-pooling layer. (<b>f</b>) Activations on the first separable CONV layer. (<b>g</b>) Activations on the second separable CONV layer. (<b>h</b>) Activations on the second Max-pooling layer. (<b>i</b>) Activations on the second ReLU layer. (<b>j</b>) Activations on the third separable CONV layer. (<b>k</b>) Activations on the fourth separable CONV layer. (<b>l</b>) Activations on the third Max-pooling layer. (<b>m</b>) Activations on the third ReLU layer. (<b>n</b>) Activations on the fifth separable CONV layer. (<b>o</b>) Activations on the sixth separable CONV layer. (<b>p</b>) Activations on the fourth Max-pooling layer. (<b>q</b>) Activations on the fourth ReLU layer. and (<b>r</b>) Predicted result.</p>
Full article ">Figure 14
<p>(<b>a</b>) Confusion matrix for recognizing PLDs and (<b>b</b>) ROC curve of each PLD in F-modified MobileNet-based recognition framework.</p>
Full article ">
9 pages, 248 KiB  
Article
The ‘Oumuamua Encounter: How Modern Cosmology Handled Its First Black Swan
by Les Coleman
Symmetry 2021, 13(3), 510; https://doi.org/10.3390/sym13030510 - 20 Mar 2021
Cited by 1 | Viewed by 2967
Abstract
The first macroscopic object observed to have come from outside the solar system slipped back out of sight in early 2018. 1I/2017 U1 ‘Oumuamua offered a unique opportunity to test understanding of gravity, planetary formation and galactic structure against a true outlier, and [...] Read more.
The first macroscopic object observed to have come from outside the solar system slipped back out of sight in early 2018. 1I/2017 U1 ‘Oumuamua offered a unique opportunity to test understanding of gravity, planetary formation and galactic structure against a true outlier, and astronomical teams from around the globe rushed to study it. Observations lasted several months and generated a tsunami of scientific (and popular) literature. The brief window available to study ‘Oumuamua created crisis-like conditions, and this paper makes a comparative study of techniques used by cosmologists against those used by financial economists in qualitatively similar situations where data conflict with the current paradigm. Analyses of ‘Oumuamua were marked by adherence to existing paradigms and techniques and by confidence in results from self and others. Some, though, over-reached by turning uncertain findings into graphic, detailed depictions of ‘Oumuamua and making unsubstantiated suggestions, including that it was an alien investigator. Using a specific instance to test cosmology’s research strategy against approaches used by economics researchers in comparable circumstances is an example of reverse econophysics that highlights the benefits of an extra-disciplinary lens. Full article
(This article belongs to the Special Issue 30 Years of Econophysics: Symmetry in Physics and Economics)
16 pages, 687 KiB  
Article
Parametric Fuzzy Implications Produced via Fuzzy Negations with a Case Study in Environmental Variables
by Stefanos Makariadis, Georgios Souliotis and Basil Papadopoulos
Symmetry 2021, 13(3), 509; https://doi.org/10.3390/sym13030509 - 20 Mar 2021
Cited by 7 | Viewed by 2044
Abstract
In this paper, we present a new Fuzzy Implication Generator via Fuzzy Negations which was generated via conical sections, in combination with the well-known Fuzzy Conjunction. The new Fuzzy Implication Generator takes its final forms after being configured by the fuzzy strong negations [...] Read more.
In this paper, we present a new Fuzzy Implication Generator via Fuzzy Negations which was generated via conical sections, in combination with the well-known Fuzzy Conjunction. The new Fuzzy Implication Generator takes its final forms after being configured by the fuzzy strong negations and combined with the most well-known fuzzy conjunctions TM, TP, TLK, TD, and TnM. The final implications that emerge, given that they are configured with the appropriate code, select the best value of the parameter and the best combination of the fuzzy conjunctions. This choice is made after comparing them with the Empiristic implication, which was created with the help of real temperature and humidity data from the Hellenic Meteorological Service. The use of the Empiristic implication is based on real data, and it also reduces the volume of the data without canceling them. Finally, the MATLAB code, which was used in the programming part of the paper, uses the new Fuzzy Implication Generator and approaches the Empiristic implication satisfactorily which is our final goal. Full article
(This article belongs to the Special Issue Recent Advances in Mathematical Modeling)
Show Figures

Figure 1

Figure 1
<p>Data from the Hellenic Meteorological Service (see Reference [<a href="#B1-symmetry-13-00509" class="html-bibr">1</a>]).</p>
Full article ">Figure 2
<p>The Membership Function of the Temperature Variable is the Gaussian membership functions <math display="inline"><semantics> <mrow> <mi>f</mi> <mfenced separators="" open="(" close=")"> <mi>x</mi> <mo>;</mo> <mi>σ</mi> <mo>,</mo> <mi>c</mi> </mfenced> <mo>=</mo> <msup> <mi>e</mi> <mrow> <mo>−</mo> <mfrac> <msup> <mrow> <mo>(</mo> <mi>x</mi> <mo>−</mo> <mi>c</mi> <mo>)</mo> </mrow> <mn>2</mn> </msup> <mrow> <mn>2</mn> <msup> <mi>σ</mi> <mn>2</mn> </msup> </mrow> </mfrac> </mrow> </msup> </mrow> </semantics></math>, from which the standard deviation, σ, and mean, c are gaussmf[5.122 10.72], gaussmf[4.481 19.21], gaussmf[4.768 25.52], respectively.</p>
Full article ">Figure 3
<p>Membership Function of the Humidity Variable is Gaussian membership functions <math display="inline"><semantics> <mrow> <mi>f</mi> <mfenced separators="" open="(" close=")"> <mi>x</mi> <mo>;</mo> <mi>σ</mi> <mo>,</mo> <mi>c</mi> </mfenced> <mo>=</mo> <msup> <mi>e</mi> <mrow> <mo>−</mo> <mfrac> <msup> <mrow> <mo>(</mo> <mi>x</mi> <mo>−</mo> <mi>c</mi> <mo>)</mo> </mrow> <mn>2</mn> </msup> <mrow> <mn>2</mn> <msup> <mi>σ</mi> <mn>2</mn> </msup> </mrow> </mfrac> </mrow> </msup> </mrow> </semantics></math>, from which the standard deviation, σ, and mean, c are gaussmf[7.826 50.09], gaussmf[5.371 64.44], gaussmf[6.775 74.89], respectively.</p>
Full article ">Figure 4
<p>Graph of the strong Fuzzy Negations Ν(x) for four random values of the parameter <math display="inline"><semantics> <mi>α</mi> </semantics></math>.</p>
Full article ">Figure 5
<p>Data in Clusters.</p>
Full article ">Figure 6
<p>Relation between Parametric (<a href="#FD5-symmetry-13-00509" class="html-disp-formula">5</a>) and Square Error.</p>
Full article ">Figure 7
<p>Relation between Parametric (7) and Square Error.</p>
Full article ">Figure 8
<p>Relation between Parametric (9) and Square Error.</p>
Full article ">Figure 9
<p>Relation between Parametric (11) and Square Error.</p>
Full article ">Figure 10
<p>Relation between Parametric (13) and Square Error.</p>
Full article ">
29 pages, 1686 KiB  
Article
GPGPU Task Scheduling Technique for Reducing the Performance Deviation of Multiple GPGPU Tasks in RPC-Based GPU Virtualization Environments
by Jihun Kang and Heonchang Yu
Symmetry 2021, 13(3), 508; https://doi.org/10.3390/sym13030508 - 20 Mar 2021
Cited by 2 | Viewed by 3655
Abstract
In remote procedure call (RPC)-based graphic processing unit (GPU) virtualization environments, GPU tasks requested by multiple-user virtual machines (VMs) are delivered to the VM owning the GPU and are processed in a multi-process form. However, because the thread executing the computing on general [...] Read more.
In remote procedure call (RPC)-based graphic processing unit (GPU) virtualization environments, GPU tasks requested by multiple-user virtual machines (VMs) are delivered to the VM owning the GPU and are processed in a multi-process form. However, because the thread executing the computing on general GPUs cannot arbitrarily stop the task or trigger context switching, GPU monopoly may be prolonged owing to a long-running general-purpose computing on graphics processing unit (GPGPU) task. Furthermore, when scheduling tasks on the GPU, the time for which each user VM uses the GPU is not considered. Thus, in cloud environments that must provide fair use of computing resources, equal use of GPUs between each user VM cannot be guaranteed. We propose a GPGPU task scheduling scheme based on thread division processing that supports GPU use evenly by multiple VMs that process GPGPU tasks in an RPC-based GPU virtualization environment. Our method divides the threads of the GPGPU task into several groups and controls the execution time of each thread group to prevent a specific GPGPU task from a long time monopolizing the GPU. The efficiency of the proposed technique is verified through an experiment in an environment where multiple VMs simultaneously perform GPGPU tasks. Full article
(This article belongs to the Section Computer)
Show Figures

Figure 1

Figure 1
<p>General-purpose computing on graphics processing unit (GPGPU) programming model.</p>
Full article ">Figure 2
<p>Our remote procedure call (RPC)-based graphic processing unit (GPU) virtualization system.</p>
Full article ">Figure 3
<p>Performance deviation when running long-running GPGPU tasks and short-running GPGPU tasks simultaneously.</p>
Full article ">Figure 4
<p>Performance when the same GPGPU tasks are simultaneously executed in each virtual machine (VM).</p>
Full article ">Figure 5
<p>System overall structure.</p>
Full article ">Figure 6
<p>Partitioning GPGPU task in an environment where multiple GPGPU task is running.</p>
Full article ">Figure 7
<p>Performance of newly requested GPGPU task in the case of lack of GPU memory.</p>
Full article ">Figure 8
<p>In an environment where different GPGPU tasks are executed in 2 VM groups at the same time, reduced the performance deviation by our proposed method.</p>
Full article ">Figure 9
<p>Performance of the Sobel image filter on 6 VMs.</p>
Full article ">Figure 10
<p>Performance of the binomial option pricing model on 6 VMs.</p>
Full article ">
15 pages, 693 KiB  
Article
Modeling the Dynamics of Heavy-Ion Collisions with a Hydrodynamic Model Using a Graphics Processor
by Marcin Słodkowski, Dominik Setniewski, Paweł Aszklar and Joanna Porter-Sobieraj
Symmetry 2021, 13(3), 507; https://doi.org/10.3390/sym13030507 - 20 Mar 2021
Cited by 2 | Viewed by 2149
Abstract
Dense bulk matter is formed during heavy-ion collision and expands towards a vacuum. It behaves as a perfect fluid, described by relativistic hydrodynamics. In order to study initial condition fluctuation and properties of jet propagation in dense hot matter, we assume a Cartesian [...] Read more.
Dense bulk matter is formed during heavy-ion collision and expands towards a vacuum. It behaves as a perfect fluid, described by relativistic hydrodynamics. In order to study initial condition fluctuation and properties of jet propagation in dense hot matter, we assume a Cartesian laboratory frame with several million cells in a stencil with high-accuracy data volume grids. Employing numerical algorithms to solve hydrodynamic equations in such an assumption requires a lot of computing power. Hydrodynamic simulations of nucleus + nucleus interactions in the range of energies of the Large Hadron Collider (LHC) are carried out using our program, which uses Graphics Processing Units (GPUs) and Compute Unified Device Architecture (CUDA). In this work, we focused on transforming hydrodynamic quantities into kinetic descriptions. We implemented the hypersurface freeze-out conditions using marching cubes techniques. We developed freeze-out procedures to obtain the momentum distributions of particles on the hypersurface. The final particle distributions, elliptic flow, and higher harmonics are comparable to the experimental LHC data. Full article
(This article belongs to the Special Issue High Energy Particle Physics and Relativistic Hydrodynamics)
Show Figures

Figure 1

Figure 1
<p>Execution time of hypersurface extraction methods per step (<b>left</b>) and cumulative (<b>right</b>).</p>
Full article ">Figure 2
<p>Influence of grid size on hypersurface extraction methods cumulative execution time.</p>
Full article ">Figure 3
<p>Evolution of energy density cross-section in YZ plane in time, 0–5% most central events.</p>
Full article ">Figure 4
<p>Evolution of energy density cross-section in XY plane, 30–40% most central events. (<b>Left</b>) panel time of the initial stage 0.6 fm. (<b>Right</b>) panel time of the final stage 9.6 fm.</p>
Full article ">Figure 5
<p>Shapes of thefreeze-out hypersurface from the hydrodynamic simulations (Pb-Pb collisions at <math display="inline"><semantics> <mrow> <msqrt> <msub> <mi>s</mi> <mrow> <mi>N</mi> <mi>N</mi> </mrow> </msub> </msqrt> <mo>=</mo> <mn>2.76</mn> </mrow> </semantics></math> TeV, 0–2% most central). Red solid line result from own Hydro on GPU and the initial conditions were generated from the UrQMD, averaging over 100 events. model. Blue dashed line result based on Ref. [<a href="#B48-symmetry-13-00507" class="html-bibr">48</a>] from a Hydro3p1 and initial conditions were generated from the Glissando program.</p>
Full article ">Figure 6
<p>Shapes of the freeze-out hypersurface from the hydrodynamic simulations (Pb-Pb collisions at <math display="inline"><semantics> <mrow> <msqrt> <msub> <mi>s</mi> <mrow> <mi>N</mi> <mi>N</mi> </mrow> </msub> </msqrt> <mo>=</mo> <mn>2.76</mn> </mrow> </semantics></math> TeV, 0–2% most central). Red solid line represents a result from our hydrodynamic model on GPU using UrQMD model as an initial conditions generator. Left panel–averaging over 10 UrQMD events, right panel–single UrQMD event.</p>
Full article ">Figure 7
<p>Distribution of the azimuth angle. Azimuth angle distribution as a result of the hydrodynamic simulation on the GPU for 2000 UrQMD events. Green dashed line is 0–2%, blue dashed line is 0–5%, and red solid line is 30–40% most central events.</p>
Full article ">Figure 8
<p>Elliptic flow (<math display="inline"><semantics> <msub> <mi>v</mi> <mn>2</mn> </msub> </semantics></math>) as a function transverse momentum <math display="inline"><semantics> <msub> <mi>p</mi> <mi>T</mi> </msub> </semantics></math>. Green dashed line is 0–2%, blue dashed line is 0–5%, and red solid line is 30–40% most central events (2000 events for each case).</p>
Full article ">
11 pages, 361 KiB  
Article
Anomalous Diffusion with an Apparently Negative Diffusion Coefficient in a One-Dimensional Quantum Molecular Chain Model
by Sho Nakade, Kazuki Kanki, Satoshi Tanaka and Tomio Petrosky
Symmetry 2021, 13(3), 506; https://doi.org/10.3390/sym13030506 - 19 Mar 2021
Cited by 2 | Viewed by 2536
Abstract
An interesting anomaly in the diffusion process with an apparently negative diffusion coefficient defined through the mean-square displacement in a one-dimensional quantum molecular chain model is shown. Nevertheless, the system satisfies the H-theorem so that the second law of thermodynamics is satisfied. The [...] Read more.
An interesting anomaly in the diffusion process with an apparently negative diffusion coefficient defined through the mean-square displacement in a one-dimensional quantum molecular chain model is shown. Nevertheless, the system satisfies the H-theorem so that the second law of thermodynamics is satisfied. The reason why the “diffusion constant” becomes negative is due to the effect of the phase mixing process, which is a characteristic result of the one-dimensionality of the system. We illustrate the situation where this negative “diffusion constant” appears. Full article
(This article belongs to the Special Issue The Importance of Being Symmetrical)
Show Figures

Figure 1

Figure 1
<p>Time evolution of <math display="inline"><semantics> <mrow> <msup> <mi>D</mi> <mrow> <mo>(</mo> <mi>x</mi> <mo>)</mo> </mrow> </msup> <mrow> <mo>(</mo> <mi>t</mi> <mo>)</mo> </mrow> </mrow> </semantics></math> under two different initial conditions in units where <math display="inline"><semantics> <mrow> <mi>m</mi> <mo>=</mo> <mn>1</mn> </mrow> </semantics></math>, <math display="inline"><semantics> <mrow> <mi>c</mi> <mo>=</mo> <mn>1</mn> </mrow> </semantics></math>, <math display="inline"><semantics> <mrow> <mo>ℏ</mo> <mo>=</mo> <mn>1</mn> </mrow> </semantics></math>, <math display="inline"><semantics> <mrow> <msub> <mi>k</mi> <mi mathvariant="normal">B</mi> </msub> <mo>=</mo> <mn>1</mn> </mrow> </semantics></math>, <math display="inline"><semantics> <mrow> <mi>g</mi> <msub> <mi mathvariant="regular">Δ</mi> <mn>0</mn> </msub> <mo>=</mo> <mn>1</mn> </mrow> </semantics></math>, and <math display="inline"><semantics> <mrow> <msub> <mi>ρ</mi> <mi>M</mi> </msub> <mo>=</mo> <mn>1</mn> </mrow> </semantics></math>. The transport coefficients <math display="inline"><semantics> <mrow> <mi>σ</mi> <mo>(</mo> <mi>P</mi> <mo>)</mo> </mrow> </semantics></math> and <math display="inline"><semantics> <mrow> <mi>D</mi> <mo>(</mo> <mi>P</mi> <mo>)</mo> </mrow> </semantics></math> are calculated at the temperature <math display="inline"><semantics> <mrow> <mi>T</mi> <mo>=</mo> <mn>1</mn> </mrow> </semantics></math>. We chose the initial peak positions of the Gaussian wave packets as <math display="inline"><semantics> <mrow> <mrow> <mo>{</mo> <mrow> <mo>(</mo> <msub> <mover accent="true"> <mi>X</mi> <mo>¯</mo> </mover> <mn>1</mn> </msub> <mo>,</mo> <msub> <mover accent="true"> <mi>P</mi> <mo>¯</mo> </mover> <mn>1</mn> </msub> <mo>)</mo> </mrow> <mo>,</mo> <mrow> <mo>(</mo> <msub> <mover accent="true"> <mi>X</mi> <mo>¯</mo> </mover> <mn>2</mn> </msub> <mo>,</mo> <msub> <mover accent="true"> <mi>P</mi> <mo>¯</mo> </mover> <mn>2</mn> </msub> <mo>)</mo> </mrow> <mo>}</mo> </mrow> <mo>=</mo> <mrow> <mo>{</mo> <mrow> <mo>(</mo> <mn>0</mn> <mo>,</mo> <mn>0.7</mn> <mo>)</mo> </mrow> <mo>,</mo> <mrow> <mo>(</mo> <mn>40</mn> <mo>,</mo> <mo>−</mo> <mn>0.7</mn> <mo>)</mo> </mrow> <mo>}</mo> </mrow> </mrow> </semantics></math> for the solid-line, and <math display="inline"><semantics> <mrow> <mrow> <mo>{</mo> <mrow> <mo>(</mo> <msub> <mover accent="true"> <mi>X</mi> <mo>¯</mo> </mover> <mn>1</mn> </msub> <mo>,</mo> <msub> <mover accent="true"> <mi>P</mi> <mo>¯</mo> </mover> <mn>1</mn> </msub> <mo>)</mo> </mrow> <mo>,</mo> <mrow> <mo>(</mo> <msub> <mover accent="true"> <mi>X</mi> <mo>¯</mo> </mover> <mn>2</mn> </msub> <mo>,</mo> <msub> <mover accent="true"> <mi>P</mi> <mo>¯</mo> </mover> <mn>2</mn> </msub> <mo>)</mo> </mrow> <mo>}</mo> </mrow> <mo>=</mo> <mrow> <mo>{</mo> <mrow> <mo>(</mo> <mn>0</mn> <mo>,</mo> <mo>−</mo> <mn>0.2</mn> <mo>)</mo> </mrow> <mo>,</mo> <mrow> <mo>(</mo> <mn>40</mn> <mo>,</mo> <mn>0.5</mn> <mo>)</mo> </mrow> <mo>}</mo> </mrow> </mrow> </semantics></math> for the dashed-line. The width of each Gaussian wave packet is given as <math display="inline"><semantics> <mrow> <mi mathvariant="regular">Δ</mi> <msub> <mi>X</mi> <mrow> <mi>α</mi> <mo>=</mo> <mn>1</mn> <mo>,</mo> <mn>2</mn> </mrow> </msub> <mo>=</mo> <mn>3</mn> </mrow> </semantics></math>. Note that the origin of time <span class="html-italic">t</span> is <math display="inline"><semantics> <msub> <mi>τ</mi> <mi>rel</mi> </msub> </semantics></math>.</p>
Full article ">
18 pages, 8952 KiB  
Article
Application of Wind Tunnel Device for Evaluation of Biokinetic Parameters of Running
by Brane Širok, Jurij Gostiša, Matej Sečnik, Krzysztof Mackala and Milan Čoh
Symmetry 2021, 13(3), 505; https://doi.org/10.3390/sym13030505 - 19 Mar 2021
Viewed by 2193
Abstract
The aim of the study was the application of high-tech wind tunnel device to identify the changes in the biokinetic parameters of running performed on the specially designed treadmill. The research was carried out in the “Planica Nordic Centre—PNC” in the wind tunnel [...] Read more.
The aim of the study was the application of high-tech wind tunnel device to identify the changes in the biokinetic parameters of running performed on the specially designed treadmill. The research was carried out in the “Planica Nordic Centre—PNC” in the wind tunnel system, where the AirRunner Assault treadmill, which was equipped with four sensors measuring the vertical and horizontal ground reaction forces, was installed. To obtain biokinetic data, the runners performed the treadmill’s run under conditions of airflow directed at each participant’s back (backwind speeds +3 m/s and +5 m/s) and the chest (headwind speeds −5 m/s and −7 m/s). The runner’s speed was measured via image analysis using a DSLR camera and markers on the belt of the treadmill. Additionally, a high-speed camera synchronised to the force acquisition system was used to analyse the contact phase via comparison of foot placement and time series of the ground reaction forces. The contact phases of the running step were found to be longer than the flight phases, with their duration ranging from 0.15 to 0.20 s and the maximum forces at take-off were found to be greater than when running with the backwind. It should be noted that the application of high-tech devices wind tunnel and treadmill were found to be sufficiently accurate to perform kinetic measurements of running parameters in changing conditions, such as resistance and assistance (facilitating). Full article
(This article belongs to the Special Issue Bioinformatics and Computational Biology)
Show Figures

Figure 1

Figure 1
<p>(<b>A</b>) represents the wind tunnel’s physical model, tested by the water flow in the model with an M:1:36 ratio (wind tunnel designed size: wind tunnel model size); (<b>B</b>) represents the computational fluid dynamics (CFD) model of the airflow in the wind tunnel flow tract.</p>
Full article ">Figure 2
<p>Treadmill positioning (<b>A</b>) with marginal conditions—airflow velocity profile in the meridian plane (<b>B</b>).</p>
Full article ">Figure 3
<p>The horizontal <span class="html-italic">x</span>-oriented force sensors and the vertically oriented sensors–schematic representation (<b>A</b>); images of the sensors in the <span class="html-italic">x</span> orientation and <span class="html-italic">y</span> orientation (<b>B</b>).</p>
Full article ">Figure 4
<p>Snapshot of the step load of the runner time series, consisting of the left—L and right—R leg load on the treadmill. original signal (<b>A</b>); a snapshot of the time series specifying the time limits of the foot’s contact with the surface of the treadmill (<b>B</b>).</p>
Full article ">Figure 5
<p>Initial contact of the right foot.</p>
Full article ">Figure 6
<p>Achieving the local extreme of the on its outer side. the <span class="html-italic">Fy</span> force load on the inner side of the foot.</p>
Full article ">Figure 7
<p>Transition into the take-off phase.</p>
Full article ">Figure 8
<p>Reduction of the vertical force on the outer side of the foot. <span class="html-italic">Fy</span> load on the inner side of the foot.</p>
Full article ">Figure 9
<p>Initial foot contact phase.</p>
Full article ">Figure 10
<p>Transition to running acceleration.</p>
Full article ">Figure 11
<p>The take-off phase and lifting the foot.</p>
Full article ">Figure 12
<p>Final stage of the take-off -flight.</p>
Full article ">Figure 13
<p>Vertical component of the force on the surface of the running belt <span class="html-italic">Fy (N).</span></p>
Full article ">Figure 14
<p>Horizontal component of the force on the surface of the running belt <span class="html-italic">Fx (N).</span></p>
Full article ">Figure 15
<p>Step frequency, contact times, and flight phases as functions of the time sequence of running.</p>
Full article ">Figure 16
<p>Time-averaged forces in vertical and horizontal directions: (<b>A</b>)—<span class="html-italic">Fy</span>, (<b>B</b>)—force <span class="html-italic">Fx</span> during the braking phase, (<b>C</b>) force <span class="html-italic">Fx</span> during the acceleration phase, at different airflow velocities, and running Athletes 1, 2, and 3.</p>
Full article ">Figure 17
<p>Relationship between the acceleration and deceleration force for individual athletes under different aerodynamic conditions.</p>
Full article ">Figure 18
<p>Running frequency of individual athletes, depending on aerodynamic characteristics.</p>
Full article ">Figure 19
<p>Contact times (<b>A</b>) and flight phases (<b>B</b>) of individual athletes depending on aerodynamic characteristics.</p>
Full article ">
23 pages, 884 KiB  
Article
Fractional (p,q)-Calculus on Finite Intervals and Some Integral Inequalities
by Pheak Neang, Kamsing Nonlaopon, Jessada Tariboon and Sotiris K. Ntouyas
Symmetry 2021, 13(3), 504; https://doi.org/10.3390/sym13030504 - 19 Mar 2021
Cited by 9 | Viewed by 2263
Abstract
Fractional q-calculus has been investigated and applied in a variety of fields in mathematical areas including fractional q-integral inequalities. In this paper, we study fractional (p,q)-calculus on finite intervals and give some basic properties. In particular, [...] Read more.
Fractional q-calculus has been investigated and applied in a variety of fields in mathematical areas including fractional q-integral inequalities. In this paper, we study fractional (p,q)-calculus on finite intervals and give some basic properties. In particular, some fractional (p,q)-integral inequalities on finite intervals are proven. Full article
(This article belongs to the Section Mathematics)
14 pages, 282 KiB  
Article
Relaxed Modulus-Based Matrix Splitting Methods for the Linear Complementarity Problem
by Shiliang Wu, Cuixia Li and Praveen Agarwal
Symmetry 2021, 13(3), 503; https://doi.org/10.3390/sym13030503 - 19 Mar 2021
Cited by 7 | Viewed by 1909
Abstract
In this paper, we obtain a new equivalent fixed-point form of the linear complementarity problem by introducing a relaxed matrix and establish a class of relaxed modulus-based matrix splitting iteration methods for solving the linear complementarity problem. Some sufficient conditions for guaranteeing the [...] Read more.
In this paper, we obtain a new equivalent fixed-point form of the linear complementarity problem by introducing a relaxed matrix and establish a class of relaxed modulus-based matrix splitting iteration methods for solving the linear complementarity problem. Some sufficient conditions for guaranteeing the convergence of relaxed modulus-based matrix splitting iteration methods are presented. Numerical examples are offered to show the efficacy of the proposed methods. Full article
(This article belongs to the Special Issue Advanced Calculus in Problems with Symmetry)
10 pages, 3447 KiB  
Article
Chiral Aziridine Sulfide N(sp3),S-Ligands for Metal-Catalyzed Asymmetric Reactions
by Agata J. Pacuła-Miszewska, Anna Laskowska, Anna Kmieciak, Mariola Zielińska-Błajet, Marek P. Krzemiński and Jacek Ścianowski
Symmetry 2021, 13(3), 502; https://doi.org/10.3390/sym13030502 - 19 Mar 2021
Cited by 1 | Viewed by 2110
Abstract
A series of new bidentate N,S-ligands—aziridines containing a para-substituted phenyl sulfide group—was synthesized and evaluated in the Pd-catalyzed Tsuji–Trost reaction and addition of diethylzinc and phenylethynylzinc to benzaldehyde. A high enantiomeric ratio for the addition reactions (up to 94.2:5.8) was obtained using [...] Read more.
A series of new bidentate N,S-ligands—aziridines containing a para-substituted phenyl sulfide group—was synthesized and evaluated in the Pd-catalyzed Tsuji–Trost reaction and addition of diethylzinc and phenylethynylzinc to benzaldehyde. A high enantiomeric ratio for the addition reactions (up to 94.2:5.8) was obtained using the aziridine ligand bearing a p-nitro phenyl sulfide group. Collected results reveal a specific electronic effect that, by the presence of particular electron-donating or electron-withdrawing groups in the PhS- moiety, influences the σ-donor–metal binding and the enantioselectivity of the catalyzed reactions. Full article
(This article belongs to the Special Issue Chemistry for Life)
Show Figures

Figure 1

Figure 1
<p><span class="html-italic">N,heteroatom</span>-bidentate ligands <b>1</b>–<b>8</b> for carbon–carbon bond formation.</p>
Full article ">Figure 2
<p>Construction of the designed ligands.</p>
Full article ">Figure 3
<p>Structure of the synthesized ligands <b>15</b>–<b>19</b>.</p>
Full article ">
11 pages, 260 KiB  
Article
Solution of Some Impulsive Differential Equations via Coupled Fixed Point
by Ahmed Boudaoui, Khadidja Mebarki, Wasfi Shatanawi and Kamaleldin Abodayeh
Symmetry 2021, 13(3), 501; https://doi.org/10.3390/sym13030501 - 19 Mar 2021
Cited by 2 | Viewed by 1922
Abstract
In this article, we employ the notion of coupled fixed points on a complete b-metric space endowed with a graph to give sufficient conditions to guarantee a solution of system of differential equations with impulse effects. We derive recisely some new coupled [...] Read more.
In this article, we employ the notion of coupled fixed points on a complete b-metric space endowed with a graph to give sufficient conditions to guarantee a solution of system of differential equations with impulse effects. We derive recisely some new coupled fixed point theorems under some conditions and then apply our results to achieve our goal. Full article
(This article belongs to the Section Mathematics)
14 pages, 313 KiB  
Article
Connected Fundamental Groups and Homotopy Contacts in Fibered Topological (C, R) Space
by Susmit Bagchi
Symmetry 2021, 13(3), 500; https://doi.org/10.3390/sym13030500 - 18 Mar 2021
Cited by 1 | Viewed by 1902
Abstract
The algebraic as well as geometric topological constructions of manifold embeddings and homotopy offer interesting insights about spaces and symmetry. This paper proposes the construction of 2-quasinormed variants of locally dense p-normed 2-spheres within a non-uniformly scalable quasinormed topological (C, [...] Read more.
The algebraic as well as geometric topological constructions of manifold embeddings and homotopy offer interesting insights about spaces and symmetry. This paper proposes the construction of 2-quasinormed variants of locally dense p-normed 2-spheres within a non-uniformly scalable quasinormed topological (C, R) space. The fibered space is dense and the 2-spheres are equivalent to the category of 3-dimensional manifolds or three-manifolds with simply connected boundary surfaces. However, the disjoint and proper embeddings of covering three-manifolds within the convex subspaces generates separations of p-normed 2-spheres. The 2-quasinormed variants of p-normed 2-spheres are compact and path-connected varieties within the dense space. The path-connection is further extended by introducing the concept of bi-connectedness, preserving Urysohn separation of closed subspaces. The local fundamental groups are constructed from the discrete variety of path-homotopies, which are interior to the respective 2-spheres. The simple connected boundaries of p-normed 2-spheres generate finite and countable sets of homotopy contacts of the fundamental groups. Interestingly, a compact fibre can prepare a homotopy loop in the fundamental group within the fibered topological (C, R) space. It is shown that the holomorphic condition is a requirement in the topological (C, R) space to preserve a convex path-component. However, the topological projections of p-normed 2-spheres on the disjoint holomorphic complex subspaces retain the path-connection property irrespective of the projective points on real subspace. The local fundamental groups of discrete-loop variety support the formation of a homotopically Hausdorff (C, R) space. Full article
17 pages, 7350 KiB  
Article
SCN: A Novel Shape Classification Algorithm Based on Convolutional Neural Network
by Chaoyan Zhang, Yan Zheng, Baolong Guo, Cheng Li and Nannan Liao
Symmetry 2021, 13(3), 499; https://doi.org/10.3390/sym13030499 - 18 Mar 2021
Cited by 10 | Viewed by 3708
Abstract
Shape classification and matching is an important branch of computer vision. It is widely used in image retrieval and target tracking. Shape context method, curvature scale space (CSS) operator and its improvement have been the main algorithms of shape matching and classification. The [...] Read more.
Shape classification and matching is an important branch of computer vision. It is widely used in image retrieval and target tracking. Shape context method, curvature scale space (CSS) operator and its improvement have been the main algorithms of shape matching and classification. The shape classification network (SCN) algorithm is proposed inspired by LeNet5 basic network structure. Then, the network structure of SCN is introduced and analyzed in detail, and the specific parameters of the network structure are explained. In the experimental part, SCN is used to perform classification tasks on three shape datasets, and the advantages and limitations of our algorithm are analyzed in detail according to the experimental results. SCN performs better than many traditional shape classification algorithms. Accordingly, a practical example is given to show that SCN can save computing resources. Full article
(This article belongs to the Section Computer)
Show Figures

Figure 1

Figure 1
<p>A binary graph represents the shape of an object.</p>
Full article ">Figure 2
<p>(<b>a</b>) Network structure model; and (<b>b</b>) deep learning model with multiple hidden layers.</p>
Full article ">Figure 3
<p>Sparse data.</p>
Full article ">Figure 4
<p>Perform convolution calculation on the 3 × 3 size image with padding = 1 and kernel size = 3 × 3.</p>
Full article ">Figure 5
<p>The transposition of convolving a 3 × 3 kernel over a 4 × 4 input using unit strides (i.e., i = 4, k = 3, s = 1 and <span class="html-italic">p</span> = 0). It is equivalent to convolving a 3 × 3 kernel over a 2 × 2 input padded with a 2 × 2 border of zero using unit strides (i.e., i′ = 2, k′ = k, s′ = 1 and p′ = 2).</p>
Full article ">Figure 6
<p>(<b>a</b>–<b>c</b>) is convolution operation; (<b>c</b>–<b>f</b>) is transposed convolution operation.</p>
Full article ">Figure 7
<p>Perform transposed convolution calculation with (<b>a</b>) stride = 2, kernel size = 5; (<b>b</b>) stride = 2, kernel size = 4.</p>
Full article ">Figure 8
<p>Shape classification network (SCN) network architecture.</p>
Full article ">Figure 9
<p>Rotate 10° counterclockwise. (<b>a</b>–<b>c</b>) are images in three different datasets.</p>
Full article ">Figure 10
<p>Twenty kinds of shapes of the Animals dataset.</p>
Full article ">Figure 11
<p>Different kinds of shapes in the same class.</p>
Full article ">Figure 12
<p>Fifteen shapes of the Swedish Plant Leaf dataset.</p>
Full article ">Figure 13
<p>Different shapes in the same class.</p>
Full article ">Figure 14
<p>Twenty of 70 shapes of MPEG-7 dataset.</p>
Full article ">Figure 15
<p>Different shapes in the same class.</p>
Full article ">Figure 16
<p>RGB images are preprocessed to get adaptive binarization after saliency detection.</p>
Full article ">Figure 17
<p>After getting adaptive binarization with saliency detection, it is input into the SCN network. Then, the binary image of the same class is obtained. Finally, the original image is obtained due to the corresponding labels, and the shape retrieval is completed.</p>
Full article ">
15 pages, 319 KiB  
Article
Existence and Approximation of Fixed Points of Enriched Contractions and Enriched φ-Contractions
by Vasile Berinde and Mădălina Păcurar
Symmetry 2021, 13(3), 498; https://doi.org/10.3390/sym13030498 - 18 Mar 2021
Cited by 19 | Viewed by 2874
Abstract
We obtain existence and uniqueness fixed point theorems as well as approximation results for some classes of mappings defined by symmetric contractive type conditions in a convex metric space in the sense of Takahashi. By using a new approach, i.e., the technique of [...] Read more.
We obtain existence and uniqueness fixed point theorems as well as approximation results for some classes of mappings defined by symmetric contractive type conditions in a convex metric space in the sense of Takahashi. By using a new approach, i.e., the technique of enrichment of contractive type mappings, we obtain general results which extend the well known Banach contraction mapping principle from metric spaces as well as other corresponding results for enriched mappings defined on Banach spaces. To indicate the relevance of our new results, we present some important particular cases and future directions of research. Full article
20 pages, 6517 KiB  
Article
Quantum-Chemical Search for Keto Tautomers of Azulenols in Vacuo and Aqueous Solution
by Ewa D. Raczyńska
Symmetry 2021, 13(3), 497; https://doi.org/10.3390/sym13030497 - 18 Mar 2021
Cited by 4 | Viewed by 2198
Abstract
Keto-enol prototropic conversions for carbonyl compounds and phenols have been extensively studied, and many interesting review articles and even books appeared in the last 50 years. Quite a different situation takes place for derivatives of biologically active azulene, for which only scanty information [...] Read more.
Keto-enol prototropic conversions for carbonyl compounds and phenols have been extensively studied, and many interesting review articles and even books appeared in the last 50 years. Quite a different situation takes place for derivatives of biologically active azulene, for which only scanty information on this phenomenon can be found in the literature. In this work, quantum-chemical studies have been undertaken for symmetrically and unsymmetrically substituted azulenols (constitutional isomers of naphthols). Stabilities of two enol (OH) rotamers and all possible keto (CH) tautomers have been analyzed in the gas phase {DFT(B3LYP)/6-311+G(d,p)} and also in aqueous solution {PCM(water)//DFT(B3LYP)/6-311+G(d,p)}. Contrary to naphthols, for which the keto forms can be neglected, at least one keto isomer (C1H, C2H, and/or C3H) contributes significantly to the tautomeric mixture of each azulenol to a higher degree in vacuo (non-polar environment) than in water (polar amphoteric solvent). The highest amounts of the CH forms have been found for 2- and 5-hydroxyazulenes, and the smallest ones for 1- and 6-hydroxy derivatives. The keto tautomer(s), together with the enol rotamers, can also participate in deprotonation reaction leading to a common anion and influence its acid-base properties. The strongest acidity in vacuo exhibits 6-hydroxyazulene, and the weakest one displays 1-hydroxyazulene, but all azulenols are stronger acids than phenol and naphthols. Bond length alternation in all DFT-optimized structures has been measured using the harmonic oscillator model of electron delocalization (HOMED) index. Generally, the HOMED values decrease for the keto tautomers, particularly for the ring containing the labile proton. Even for the keto tautomers possessing energetic parameters close to those of the enol isomers, the HOMED indices are low. However, some kind of parallelism exists for the keto forms between their relative energies and HOMEDs estimated for the entire molecules. Full article
(This article belongs to the Special Issue Symmetry in Acid-Base Chemistry)
Show Figures

Figure 1

Figure 1
<p>The structural differences between azulene (<b>a</b>) and naphthalene (<b>b</b>).</p>
Full article ">Figure 2
<p>Monohydroxyazulenes investigated in this work.</p>
Full article ">Figure 3
<p>The potential resonance structures for anions of hydroxyazulenes: <b>A<sup>−</sup>1</b> (<b>a</b>), <b>A<sup>−</sup>2</b> (<b>b</b>), <b>A<sup>−</sup>3</b> (<b>c</b>), <b>A<sup>−</sup>4</b> (<b>d</b>), and <b>A<sup>−</sup>5</b> (<b>e</b>).</p>
Full article ">Figure 3 Cont.
<p>The potential resonance structures for anions of hydroxyazulenes: <b>A<sup>−</sup>1</b> (<b>a</b>), <b>A<sup>−</sup>2</b> (<b>b</b>), <b>A<sup>−</sup>3</b> (<b>c</b>), <b>A<sup>−</sup>4</b> (<b>d</b>), and <b>A<sup>−</sup>5</b> (<b>e</b>).</p>
Full article ">Figure 4
<p>The DFT-calculated negative protonation energies (−<span class="html-italic">E</span><sub>prot</sub>, in kJ mol<sup>−1</sup>) for deprotonated azulenols. −<span class="html-italic">E</span><sub>prot</sub> for individual conjugated sites placed near O and C atoms.</p>
Full article ">Figure 5
<p>The structures of enol rotamers and possible keto tautomers of 1- (<b>a</b>), 2- (<b>b</b>), 4- (<b>c</b>), 5- (<b>d</b>), and 6-hydroxyazulene (<b>e</b>), and their relative electronic energies (∆<span class="html-italic">E</span> given in parentheses, in kJ mol<sup>−1</sup>) in vacuo (normal style) and aqueous solution (italic style).</p>
Full article ">Figure 5 Cont.
<p>The structures of enol rotamers and possible keto tautomers of 1- (<b>a</b>), 2- (<b>b</b>), 4- (<b>c</b>), 5- (<b>d</b>), and 6-hydroxyazulene (<b>e</b>), and their relative electronic energies (∆<span class="html-italic">E</span> given in parentheses, in kJ mol<sup>−1</sup>) in vacuo (normal style) and aqueous solution (italic style).</p>
Full article ">Figure 6
<p>Comparison of the harmonic oscillator model of electron delocalization (HOMED) indices estimated for the DFT structures of naphthalene (<b>a</b>), azulene (<b>b</b>), and single aromatic rings: benzene (<b>c</b>), cyclopentadiene anion (<b>d</b>), and cycloheptatriene cation (<b>e</b>). HOMEDs for the entire bicyclic molecule placed below structure and those for the single structural parts included in the ring.</p>
Full article ">Figure 7
<p>The HOMED indices estimates for unsubstituted azulene (structure 6) and for the five anionic forms A<sup>−</sup>1–A<sup>−</sup>5 (structures 1–5, respectively). HOMED5, HOMED7, HOMED11, and HOMED12 correspond to the five- and seven-membered rings, azulene system, and the entire molecule containing the CO bond.</p>
Full article ">Figure 8
<p>The linear relationships between the DFT-calculated C9C10 bond lengths (in Å) and HOMED5 indices for the anion forms and enol rotamers of hydroxyazulenes.</p>
Full article ">Figure 9
<p>Linear tendencies between the HOMED7 and HOMED5 indices for selected keto isomers of azulenols <b>AH1</b> and <b>AH4</b>.</p>
Full article ">Figure 10
<p>Linear tendencies between the HOMED12 indices and relative electronic energies (∆<span class="html-italic">E</span> in kJ mol<sup>−1</sup>) for all possible keto tautomers of azulenols <b>AH1</b><b>−AH5</b>.</p>
Full article ">Scheme 1
<p>The favored keto and enol tautomers for 1- (<b>a</b>), 2- (<b>b</b>), 4- (<b>c</b>), 5- (<b>d</b>), and 6-hydroxyazulene (<b>e</b>). HOMED5s and HOMED7s are placed in the rings. The percentages contents of isomers in vacuo and aqueous solution are included below structures.</p>
Full article ">
14 pages, 6571 KiB  
Article
A Fully Symmetrical High Performance Modular Milling Cutter
by Mircea-Viorel Dragoi, Dorin Mircea Rosca, Milena Flavia Folea and Gheorghe Oancea
Symmetry 2021, 13(3), 496; https://doi.org/10.3390/sym13030496 - 18 Mar 2021
Cited by 3 | Viewed by 3147
Abstract
Milling cutters belong to a widely used category of cutting tools. In this category, modular milling cutters are a narrow niche, less studied, and developed. Usually, they are symmetrical cutting tools. A milling cutting tool that can be reconfigured due to its modularity [...] Read more.
Milling cutters belong to a widely used category of cutting tools. In this category, modular milling cutters are a narrow niche, less studied, and developed. Usually, they are symmetrical cutting tools. A milling cutting tool that can be reconfigured due to its modularity and still keeps its symmetry becomes more interesting and useful for machining. The paper presents such a new concept in a computer aided design (CAD) model of a cutting tool based on some novel features. The tool itself is designed as a modular complex. The way the torque is transmitted from the shaft to the elementary cutters is an original one, as they are joined together based on a profiled assembling. The profile is one formed of filleted circular sectors and segments. The reaming of the elementary cutters has two sections each of them assuming a task: transmitting the torque, and precisely centring, respectively. The cooling system, which is a component of the tool, provides the cutting area with coolant both on the front and side face of the cutting tool. Some nozzles placed around the cutting tool send jets or curtains of coolant towards the side surface of the cutter, instead of parallel, as some existing solutions do. The source of the coolant supply is the inner cooling system of the machine tool. This provides the tool with coolant having proper features: high enough flow and pressure. The output of the research is a CAD-based model of the modular milling cutter with a high performance cooling system. All of this model’s elements were designed taking into account the design for manufacturing principles, so it will be possible to easily manufacture this tool. Several variants of milling cutters obtained by reconfiguring the complex tool are presented. Even if the tool is usually a symmetric complex, it can process asymmetric parts. Symmetry is intensively used to add some advantages to the modular cutting tool: balanced forces in the cutting process, the possibility of controlling the direction of the axial cutting force, and a good machinability of the grooves used to assemble the main parts of the cutting tool. Full article
Show Figures

Figure 1

Figure 1
<p>Model of modular milling cutter [<a href="#B27-symmetry-13-00496" class="html-bibr">27</a>].</p>
Full article ">Figure 2
<p>Exploded CAD model [<a href="#B27-symmetry-13-00496" class="html-bibr">27</a>].</p>
Full article ">Figure 3
<p>Conjugate profile of shaft and milling cutters [<a href="#B27-symmetry-13-00496" class="html-bibr">27</a>].</p>
Full article ">Figure 4
<p>Grooved shaft [<a href="#B27-symmetry-13-00496" class="html-bibr">27</a>].</p>
Full article ">Figure 5
<p>Monoblock shaft with distributor [<a href="#B27-symmetry-13-00496" class="html-bibr">27</a>].</p>
Full article ">Figure 6
<p>Milling cutters: (<b>a</b>) front milling cutter; (<b>b</b>) regular milling cutter. In detail are presented the two sections of the reaming, separated by the technological grooving [<a href="#B27-symmetry-13-00496" class="html-bibr">27</a>].</p>
Full article ">Figure 7
<p>The inner profile of the milling cutter’s hole with two arcs connected by their common tangent: (<b>a</b>) two different profiles on the same shaft diameter; (<b>b</b>) angular pitch, and the radii of the two arcs on the profile. The common tangent of two adjacent arcs is emphasized in red.</p>
Full article ">Figure 8
<p>The adopted inner profile of the milling cutter’s hole: (<b>a</b>) a profile with 20 teeth; (<b>b</b>) detail of the profile, with the radii of inner and outer. Toolpath is the trajectory of the end mill that machines the reaming profile.</p>
Full article ">Figure 9
<p>Distributor with nozzles and threaded pins. A quarter of the shaft is also represented to show the space for the coolant on the upper side of the section [<a href="#B27-symmetry-13-00496" class="html-bibr">27</a>].</p>
Full article ">Figure 10
<p>Different types of nozzles. (<b>a</b>) Spherical; (<b>b</b>) conical; (<b>c</b>) cylindrical with parallel holes; (<b>d</b>) cylindrical with bent holes [<a href="#B27-symmetry-13-00496" class="html-bibr">27</a>].</p>
Full article ">Figure 11
<p>Modular milling cutters with different bending of the side cutting edges: (<b>a</b>) right; (<b>b</b>) left.</p>
Full article ">Figure 12
<p>Modular milling cutter balanced in terms of axial force [<a href="#B27-symmetry-13-00496" class="html-bibr">27</a>].</p>
Full article ">Figure 13
<p>Processing parts with low stiffness: (<b>a</b>) thin parts processed simultaneously, being clamped in a package; (<b>b</b>) slender symmetrical part [<a href="#B27-symmetry-13-00496" class="html-bibr">27</a>].</p>
Full article ">Figure 14
<p>Modular milling cutter: (<b>a</b>) variant 1 with free end; (<b>b</b>) variant 2 with elementary cutters having two rows of inserts [<a href="#B27-symmetry-13-00496" class="html-bibr">27</a>].</p>
Full article ">
15 pages, 11385 KiB  
Article
An Approach on Image Processing of Deep Learning Based on Improved SSD
by Liang Jin and Guodong Liu
Symmetry 2021, 13(3), 495; https://doi.org/10.3390/sym13030495 - 17 Mar 2021
Cited by 31 | Viewed by 2995
Abstract
Compared with ordinary images, each of the remote sensing images contains many kinds of objects with large scale changes, providing more details. As a typical object of remote sensing image, ship detection has been playing an essential role in the field of remote [...] Read more.
Compared with ordinary images, each of the remote sensing images contains many kinds of objects with large scale changes, providing more details. As a typical object of remote sensing image, ship detection has been playing an essential role in the field of remote sensing. With the rapid development of deep learning, remote sensing image detection method based on convolutional neural network (CNN) has occupied a key position. In remote sensing images, the objects of which small scale objects account for a large proportion are closely arranged. In addition, the convolution layer in CNN lacks ample context information, leading to low detection accuracy for remote sensing image detection. To improve detection accuracy and keep the speed of real-time detection, this paper proposed an efficient object detection algorithm for ship detection of remote sensing image based on improved SSD. Firstly, we add a feature fusion module to shallow feature layers to refine feature extraction ability of small object. Then, we add Squeeze-and-Excitation Network (SE) module to each feature layers, introducing attention mechanism to network. The experimental results based on Synthetic Aperture Radar ship detection dataset (SSDD) show that the mAP reaches 94.41%, and the average detection speed is 31FPS. Compared with SSD and other representative object detection algorithms, this improved algorithm has a better performance in detection accuracy and can realize real-time detection. Full article
Show Figures

Figure 1

Figure 1
<p>Examples of ship in remote sensing image. The samples are from the SAR ship detection dataset (SSDD) dataset. <b>Left</b> side is the description of the sample under multiobject condition; <b>right</b> side is the description of the sample in complex background.</p>
Full article ">Figure 2
<p>The architecture of SSD.</p>
Full article ">Figure 3
<p>The default boxes in the feature map [<a href="#B20-symmetry-13-00495" class="html-bibr">20</a>].</p>
Full article ">Figure 4
<p>Our improved model.</p>
Full article ">Figure 5
<p>The architecture of feature pyramid network (FPN).</p>
Full article ">Figure 6
<p>Aliasing effect reduction module.</p>
Full article ">Figure 7
<p>Squeeze-and-excitation module.</p>
Full article ">Figure 8
<p>Detection results of SSDD dataset. (<b>a</b>) represents detection result in complex background and (<b>b</b>) represents detection results under multiobject condition.</p>
Full article ">Figure 9
<p>P-R curve (the threshold changed from 0.05 to 0.95).</p>
Full article ">Figure 10
<p>Comparison of experimental results between our model and SSD.</p>
Full article ">Figure 10 Cont.
<p>Comparison of experimental results between our model and SSD.</p>
Full article ">Figure 11
<p>The comparison of experimental results with histogram.</p>
Full article ">
Previous Issue
Next Issue
Back to TopTop