[go: up one dir, main page]

Next Issue
Volume 11, February-1
Previous Issue
Volume 11, January-1


Cells, Volume 11, Issue 2 (January-2 2022) – 131 articles

Cover Story (view full-size image):

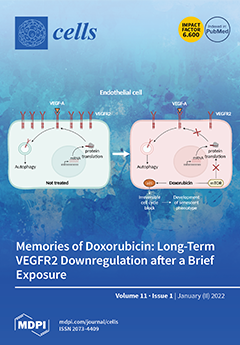
Doxorubicin (Dox) remains an essential drug in several anticancer regimens even though its use is associated with severe cardiotoxic side effects that persist after drug withdrawal and can lead to heart failure. In addition to cardiomyocytes, damaged cardiac endothelial cells are a culprit of Dox-induced cardiotoxicity. We show that a brief exposure of endothelial cells to low Dox concentrations leads to long-lasting effects that include cellular senescence and downregulation of VEGFR2, crucial for endothelial cell activation. Mechanistically, Dox represses global protein synthesis by inhibiting mTOR. Senescence and downregulation of VEGFR2 in endothelial cells might participate in Dox-induced cardiotoxicity. View this paper

  • Issues are regarded as officially published after their release is announced to the table of contents alert mailing list.
  • You may sign up for e-mail alerts to receive table of contents of newly released issues.
  • PDF is the official format for papers published in both, html and pdf forms. To view the papers in pdf format, click on the "PDF Full-text" link, and use the free Adobe Reader to open them.
Order results
Result details
Section
Select all
Export citation of selected articles as:
22 pages, 4916 KiB  
Review
Myeloid-Derived Suppressor Cells in Solid Tumors
by Tianmiao Ma, Bernhard W. Renz, Matthias Ilmer, Dominik Koch, Yuhui Yang, Jens Werner and Alexandr V. Bazhin
Cells 2022, 11(2), 310; https://doi.org/10.3390/cells11020310 - 17 Jan 2022
Cited by 46 | Viewed by 9245
Abstract
Myeloid-derived suppressor cells (MDSCs) are one of the main suppressive cell population of the immune system. They play a pivotal role in the establishment of the tumor microenvironment (TME). In the context of cancers or other pathological conditions, MDSCs can differentiate, expand, and [...] Read more.
Myeloid-derived suppressor cells (MDSCs) are one of the main suppressive cell population of the immune system. They play a pivotal role in the establishment of the tumor microenvironment (TME). In the context of cancers or other pathological conditions, MDSCs can differentiate, expand, and migrate in large quantities during circulation, inhibiting the cytotoxic functions of T cells and NK cells. This process is regulated by ROS, iNOS/NO, arginase-1, and multiple soluble cytokines. The definition of MDSCs and their phenotypes in humans are not as well represented as in other organisms such as mice, owing to the absence of the cognate molecule. However, a comprehensive understanding of the differences between different species and subsets will be beneficial for clarifying the immunosuppressive properties and potential clinical values of these cells during tumor progression. Recently, experimental evidence and clinical investigations have demonstrated that MDSCs have a close relationship with poor prognosis and drug resistance, which is considered to be a leading marker for practical applications and therapeutic methods. In this review, we summarize the remarkable position of MDSCs in solid tumors, explain their classifications in different models, and introduce new treatment approaches to target MDSCs to better understand the advancement of new approaches to cancer treatment. Full article
Show Figures

Figure 1

Figure 1
<p>Crosstalk between MDSCs and other immune cells. Up arrows mean increased, and the down arrows mean decreased.</p>
Full article ">
21 pages, 11104 KiB  
Review
Fibrosis Is a Basement Membrane-Related Disease in the Cornea: Injury and Defective Regeneration of Basement Membranes May Underlie Fibrosis in Other Organs
by Steven E. Wilson
Cells 2022, 11(2), 309; https://doi.org/10.3390/cells11020309 - 17 Jan 2022
Cited by 18 | Viewed by 4056
Abstract
Every organ develops fibrosis that compromises functions in response to infections, injuries, or diseases. The cornea is a relatively simple, avascular organ that offers an exceptional model to better understand the pathophysiology of the fibrosis response. Injury and defective regeneration of the epithelial [...] Read more.
Every organ develops fibrosis that compromises functions in response to infections, injuries, or diseases. The cornea is a relatively simple, avascular organ that offers an exceptional model to better understand the pathophysiology of the fibrosis response. Injury and defective regeneration of the epithelial basement membrane (EBM) or the endothelial Descemet’s basement membrane (DBM) triggers the development of myofibroblasts from resident corneal fibroblasts and bone marrow-derived blood borne fibrocytes due to the increased entry of TGF beta-1/-2 into the stroma from the epithelium and tears or residual corneal endothelium and aqueous humor. The myofibroblasts, and disordered extracellular matrix these cells produce, persist until the source of injury is removed, the EBM and/or DBM are regenerated, or replaced surgically, resulting in decreased stromal TGF beta requisite for myofibroblast survival. A similar BM injury-related pathophysiology can underly the development of fibrosis in other organs such as skin and lung. The normal liver does not contain traditional BMs but develops sinusoidal endothelial BMs in many fibrotic diseases and models. However, normal hepatic stellate cells produce collagen type IV and perlecan that can modulate TGF beta localization and cognate receptor binding in the space of Dissé. BM-related fibrosis is deserving of more investigation in all organs. Full article
(This article belongs to the Special Issue Cellular and Molecular Mechanisms of Fibrosis)
Show Figures

Figure 1

Figure 1
<p>Slit lamp photographs of haze and scarring fibrosis in rabbit corneas. (<b>A</b>) Normal unwounded transparent cornea. (<b>B</b>) One month after −4.5D PRK a cornea has faint opacity (haze) within arrows [<a href="#B5-cells-11-00309" class="html-bibr">5</a>]. (<b>C</b>) One month after −9D PRK a cornea has dense scarring fibrosis within arrows [<a href="#B5-cells-11-00309" class="html-bibr">5</a>]. (<b>D</b>) At 2 mo. after −9D PRK areas of clearing (lacunae, arrows) are developing within scarring fibrosis [<a href="#B5-cells-11-00309" class="html-bibr">5</a>]. (<b>E</b>) Dense scarring fibrosis 2 weeks after 5 mm surface alkali burn with 1 N NaOH. Stromal neovascularization (arrowheads) begins to develop. (<b>F</b>) Scarring fibrosis has progressed at 4 weeks after alkali burn. Stromal neovascularization (arrowheads) has progressed. (<b>G</b>) Dense scarring fibrosis 1 mo. after 8mm Descemetorhexis. Stromal neovascularization (arrowheads) has developed [<a href="#B7-cells-11-00309" class="html-bibr">7</a>]. (<b>H</b>) Scarring fibrosis has diminished by 6 mo. after Descemetorhexis with iris details now visible. Most of the opacity that remains is associated with the corneal neovascularization (arrowheads) [<a href="#B7-cells-11-00309" class="html-bibr">7</a>]. Mag. 20×.</p>
Full article ">Figure 2
<p>Corneal BM components that modulate TGF beta-driven myofibroblast development and fibrosis in unwounded rabbit corneas [<a href="#B5-cells-11-00309" class="html-bibr">5</a>]. (<b>A</b>) Immunohistochemistry (IHC) for perlecan (Perl), as well as laminin alpha-5 (LAMA5) [<a href="#B5-cells-11-00309" class="html-bibr">5</a>]. (<b>B</b>) IHC for perlecan alone. (<b>C</b>) IHC for collagen type IV. Arrows indicate the EBM with overlying epithelium (e) and arrowheads indicate Descemet’s membrane that overlies the corneal endothelium, respectively, in all panels. S is stroma populated primarily with keratocytes. Blue is DAPI stained nuclei. Mag. 200×.</p>
Full article ">Figure 3
<p>TEM of normal and fibrotic rabbit corneas. (<b>A</b>) Lower magnification image of an unwounded cornea showing the epithelium (e) and stroma (s) with a keratocyte (arrow). (<b>B</b>) Higher magnification image showing the epithelium (e) with the underlying EBM. The arrows indicate the lamina lucida anterior to the lamina densa of the EBM. In the stroma (s) note the uniform diameter of the collagen fibrils, with some seen in cross-section and others longitudinally, and the highly ordered packing of the fibrils. (<b>C</b>) In a cornea with severe fibrosis at 1 month after PRK, the stromal ECM is highly disorganized (*), without evidence of regular fibrils or packing. The anterior stroma (S) is also populated with many layered myofibroblasts (m). These images were previously unpublished but from the study of Torricelli et al., Investig. Ophthalmol. Vis. Sci. 2013, <span class="html-italic">54</span>, 4026–4033.</p>
Full article ">Figure 4
<p>Keratocyte apoptosis in response to injury in rabbit corneas. (<b>A</b>) TUNEL assay at 24 h after −4.5D PRK that entails epithelial debridement and then anterior stromal ablation with the excimer laser. Arrows indicate anterior stromal keratocytes undergoing apoptosis. The apoptotic cells can be detected with TEM within moments of epithelial scrape but become strongly TUNEL+ from 4 to more than 24 h. Many bone marrow-derived cells such as monocytes and fibrocytes detected with markers such as CD34, CD45, and CD11b infiltrate the stroma from the limbus and many also undergo apoptosis in the first 24 to 72 h. (<b>B</b>) At 24 h after −9D PRK, with twice the number of excimer laser pulses, many more anterior stromal keratocytes (arrows) undergo apoptosis. Thus, there is a correlation between the magnitude of the anterior corneal injury and the number of keratocytes that undergo early apoptosis [<a href="#B19-cells-11-00309" class="html-bibr">19</a>]. (<b>C</b>) At 1 h following an 8 mm corneal endothelial scrape injury, many posterior stromal keratocytes (arrows) undergo apoptosis detected with the TUNEL assay. Note the edema of the stroma that also occurs immediately after endothelial injury. The arrowhead indicates DBM stained (green) for BM component nidogen-1. Figures (<b>A</b>,<b>B</b>) were previously unpublished but from the study of Mohan et al., 2003 [<a href="#B19-cells-11-00309" class="html-bibr">19</a>]. Figure (<b>C</b>) reprinted with permission from Medeiros et al. Exp. Eye Res. 2018; 172:30-35.</p>
Full article ">Figure 5
<p>Localization of TGF beta-1 and TGF beta-2 in unwounded and wounded rabbit corneas. (<b>A</b>) TGF beta-1 (TGFb1) is produced (large arrows) in corneal epithelium (e) and endothelium (large arrowheads) and is also present in tears and aqueous humor in the anterior chamber (AC) [<a href="#B5-cells-11-00309" class="html-bibr">5</a>]. In unwounded cornea, collagen type IV (COL IV) is detected in the EBM (small arrows) and in DBM (small arrowheads). (<b>B</b>) TGFb2 is not expressed in the corneal epithelium or corneal endothelium (arrowhead indicates a small area of visible corneal endothelium) but is present in tears (produced by accessory and main lacrimal glands) and in the aqueous humor. (<b>C</b>) In corneas that do not develop fibrosis or in corneas that develop fibrosis that subsequently resolves, as in this cornea at 8 weeks after PRK, TGFb1 is retained from entering the stroma by the fully regenerated EBM (arrows) and regeneration of the superficial epithelial barrier function (EBF, small arrowheads). Note no SMA-positive myofibroblasts remain, but a few vimentin-positive, SMA-negative corneal fibroblasts persist just posterior to the EBM. (<b>D</b>) In a cornea that develops fibrosis 4 weeks after PRK, high levels of TGFb1 (and TGFb2 not shown) accumulate throughout the epithelium (e) and into the anterior stroma (s) without evidence of EBM regeneration or EBF. Numerous SMA-positive myofibroblasts (arrows) and SMA-negative, vimentin-positive corneal fibroblasts are present in the sub-epithelial stroma. (<b>E</b>) The same section as in D, but showing only TGFb1, highlights the penetration of the TGFb1 into the anterior stroma (arrows), although some stromal cells also produce limited amounts of TGFb1 [<a href="#B5-cells-11-00309" class="html-bibr">5</a>]. (<b>F</b>) In a rabbit cornea at 4 weeks after Descemetorhexis removal of an 8 mm disc of DBM and corneal endothelium, TGFb1 (arrows) is localized at the posterior corneal surface still devoid of DBM or endothelium. Much of the posterior stroma (bracket) contains collagen type IV (COL IV) not associated with DBM that is upregulated in corneal fibroblasts by TGFb1. Since COL IV directly binds TGFb1 in competition with cognate TGF beta receptors, it is hypothesized this COL IV is produced to downregulate TGFb1 effects on cells in the posterior stroma, including myofibroblast precursors [<a href="#B7-cells-11-00309" class="html-bibr">7</a>]. A similar upregulation of non-EBM COL IV occurs in the anterior stroma after injuries such as PRK. Panels A and B are previously unpublished images from study de Oliveira et al. Exp Eye Res, 2021;202:108325. Panels C, D and E reprinted with permission from de Oliveira et al. Exp Eye Res, 2021;202:108325. Panel F reprinted with permission from Sampaio LP et al. Exp Eye Res. 2021;213:108803.</p>
Full article ">Figure 6
<p>Stromal cellularity of a normal cornea and corneas after injuries that heal without fibrosis and with fibrosis in rabbits. (<b>A</b>) The unwounded corneal stroma (s) is populated with keratocan-positive keratocytes between the epithelium (e) and corneal endothelium (arrowheads). At the vimentin (vim) antibody concentration used [<a href="#B5-cells-11-00309" class="html-bibr">5</a>,<a href="#B25-cells-11-00309" class="html-bibr">25</a>], only a few anterior stromal keratocytes were vimentin positive. No SMA-positive cells were detected. (<b>B</b>) One month after −4.5D PRK, there were numerous vimentin-positive corneal fibroblasts in the anterior stroma but the stroma was mostly populated with keratocan-positive keratocytes. No SMA-positive myofibroblasts were detected. (<b>C</b>) One month after −9D PRK, the anterior stroma is populated with SMA-positive, vimentin-positive myofibroblasts and SMA-negative, vimentin-positive corneal fibroblasts (and possibly fibrocyte progeny). (<b>D</b>) At 1 month after a one-minute 1N NaOH alkali burn that also destroyed the endothelium and Descemet’s membrane, the full-thickness corneal stroma is filled with myofibroblasts and corneal fibroblasts. Few keratocytes are detected. (<b>E</b>) At 1 month after infection with Pseudomonas aeruginosa keratitis sterilized with topical tobramycin there is severe opacity of the cornea in a slit lamp photograph. In IHC, approximately 90% of the stroma is filled with SMA-positive myofibroblasts, and in this cornea sparred only the most posterior stroma adjacent to the corneal endothelium. In a TEM image of this cornea, no lamina lucida/lamina densa is detected. The stroma (s) has disorganized ECM (*) and numerous myofibroblasts (m). (<b>F</b>) At 1 month after infection with Pseudomonas aeruginosa keratitis sterilized with topical tobramycin, the opacity in the cornea decreases and numerous transparent areas called lacunae (black arrows) develop. On IHC in this cornea where the Pseudomonas aeruginosa extended through the entire cornea and destroyed the corneal endothelium, SMA-positive myofibroblasts populate the posterior stroma but myofibroblasts disappeared in the anterior stroma. Corneal neovascularization (arrows) with SMA-positive pericytes develops. In a TEM image, lamina lucida/lamina densa (arrowhead) was regenerated. The stroma (s) had organized collagen fibrils similar to normal unwounded stroma and no myofibroblasts were detected in the anterior stroma. (<b>G</b>) At 1 month after Descemetorhexis (DMR), the posterior stroma is filled with SMA-positive myofibroblasts. The more anterior stroma in this section had keratocan-positive keratocytes. An intermediate layer of SMA-negative, keratocan-negative, vimentin-positive corneal fibroblasts (and likely fibrocyte progeny) are present between the keratocyte and myofibroblast layers. (<b>H</b>) At 6 months after DMR, the corneal endothelium (arrowheads) regenerates. Most of the posterior stroma is repopulated with keratocan-positive keratocytes, except adjacent to the corneal endothelium and regenerated DBM there were numerous keratocan-negative, SMA-negative, vimentin-positive corneal fibroblasts and a few remaining SMA-positive myofibroblasts. e is epithelium and s is stroma in all panels. Blue is DAPI-stained nuclei in all panels. Panels B and C reprinted with permission from de Oliveira et al. Exp Eye Res 2021:202;108325. Panels E and F reprinted with permission from Marino et al. Exp Eye Res. 2017;161:101-105. Panels G and H reprinted with permission from Sampaio LP et al. Exp Eye Res. 2021;213:108803.</p>
Full article ">Figure 7
<p>Defective perlecan EBM incorporation in a PRK injured rabbit cornea that developed scarring stromal fibrosis and myofibroblasts. Confocal microscopy Imaris 3D constructed images of triplex IHC for laminin alpha-5, perlecan and nidogen-1 in an unwounded control cornea and corneas with moderate −4.5D PRK and severe −9D PRK epithelial-stromal injury [<a href="#B5-cells-11-00309" class="html-bibr">5</a>]. (<b>A</b>) Laminin alpha-5 (green) was detected in the epithelium (e) and in the EBM (arrows) in an unwounded cornea. Two DAPI-negative vesicles with laminin alpha-5 (arrowheads) are present in the anterior stroma adjacent to the EBM. These were likely produced by keratocytes to contribute to maintenance of the EBM. Perlecan (red) was detected in the EBM (arrows), and in vesicles in the anterior stroma (arrowhead). Nidogen-1 (blue gray) is a major component in the EBM (arrows) and is present in secretory vesicles in the anterior stroma (arrowheads). (<b>B</b>) A cornea at 1 month after surgery that had moderate epithelial-stromal injury (−4.5D PRK) and did not develop myofibroblasts or scarring stromal fibrosis (see <a href="#cells-11-00309-f001" class="html-fig">Figure 1</a>B). The laminin alpha-5, perlecan and nidogen-1 localization in the EBM are similar to that noted in the unwounded cornea (large arrows), except there are increased nidogen-1 (arrowheads) in the subepithelial stroma surrounding stromal keratocyte/corneal fibroblast cells. Vesicles (small arrows) that are DAPI-negative are present in the anterior stroma and contain one or more of the EBM components. (<b>C</b>) In a cornea 1 month after more severe epithelial-stromal injury (−9D PRK) there is greater stromal opacity and myofibroblasts (see <a href="#cells-11-00309-f001" class="html-fig">Figure 1</a>C). Laminin alpha-5 and nidogen-1 (arrows) EBM localization is similar to that noted in the unwounded control cornea. Perlecan, however, was not detected at significant levels in the EBM, even though it is present within and surrounding myofibroblasts (arrowheads) in the anterior stroma. Stromal nidogen-1 (arrowheads) surrounding myofibroblasts is also present at high levels in the anterior stroma. Blue in all panels is DAPI-stained nuclei. e is epithelium. * indicates artifactual defects in the epithelium which are often noted in PRK corneas that are cryo-sectioned in the first 1 to 2 months after surgery while the EBM has not fully regenerated. Reprinted with permission from de Oliveira et al. Exp Eye Res 2021:202;108325.</p>
Full article ">Figure 8
<p>Organs where BMs can have a role in fibrosis [<a href="#B43-cells-11-00309" class="html-bibr">43</a>]. (<b>A</b>) TEM in normal rabbit skin. The basal keratinocyte (k) and dermis (d) are separated by the BM with lamina lucida (arrows) and lamina densa. Note the larger and more disorganized fibrils in the dermis compared with corneal stroma in <a href="#cells-11-00309-f003" class="html-fig">Figure 3</a>b. (<b>B</b>) TEM in normal rabbit lung. The alveolar BM with lamina lucida (arrow) and underlying lamina densa separates the alveolar epithelial cell type I (AE cell type I) from the interstitial space. (<b>C</b>) IHC for SMA in normal human lung primarily stains pericytes associated with blood vessels. There is little staining for SMA in the normal lung parenchyma. Blue is DAPI stained nuclei. (<b>D</b>) In a human lung with advanced idiopathic pulmonary fibrosis (IPF) SMA-positive myofibroblasts are present throughout the parenchyma. Blue is DAPI stained nuclei.</p>
Full article ">Figure 9
<p>TEM of normal liver in the rabbit. No BM is associated with hepatocytes, endothelial cells (e), vascular channel sinusoids or spaces of Dissé (D). The hepatocyte has processes (arrowheads) that extend into the space of Dissé. The sinusoids have a discontinuous, highly fenestrated endothelial lining. Neither the hepatocytes nor endothelial cells have BMs that separate them from the space of Dissé. Mag. 30,000×. Reprinted with permission from Saikia et al. Cell and Tissue Res, 2018;374:439-453.</p>
Full article ">
15 pages, 3064 KiB  
Review
Emerging Role of cAMP/AMPK Signaling
by Muhammad Aslam and Yury Ladilov
Cells 2022, 11(2), 308; https://doi.org/10.3390/cells11020308 - 17 Jan 2022
Cited by 100 | Viewed by 11049
Abstract
The 5′-Adenosine monophosphate (AMP)-activated protein kinase (AMPK) is a natural energy sensor in mammalian cells that plays a key role in cellular and systemic energy homeostasis. At the cellular level, AMPK supports numerous processes required for energy and redox homeostasis, including mitochondrial biogenesis, [...] Read more.
The 5′-Adenosine monophosphate (AMP)-activated protein kinase (AMPK) is a natural energy sensor in mammalian cells that plays a key role in cellular and systemic energy homeostasis. At the cellular level, AMPK supports numerous processes required for energy and redox homeostasis, including mitochondrial biogenesis, autophagy, and glucose and lipid metabolism. Thus, understanding the pathways regulating AMPK activity is crucial for developing strategies to treat metabolic disorders. Mounting evidence suggests the presence of a link between cyclic AMP (cAMP) and AMPK signaling. cAMP signaling is known to be activated in circumstances of physiological and metabolic stress due to the release of stress hormones, such as adrenaline and glucagon, which is followed by activation of membrane-bound adenylyl cyclase and elevation of cellular cAMP. Because the majority of physiological stresses are associated with elevated energy consumption, it is not surprising that activation of cAMP signaling may promote AMPK activity. Aside from the physiological role of the cAMP/AMPK axis, numerous reports have suggested its role in several pathologies, including inflammation, ischemia, diabetes, obesity, and aging. Furthermore, novel reports have provided more mechanistic insight into the regulation of the cAMP/AMPK axis. In particular, the role of distinct cAMP microdomains generated by soluble adenylyl cyclase in regulating basal and induced AMPK activity has recently been demonstrated. In the present review, we discuss current advances in the understanding of the regulation of the cAMP/AMPK axis and its role in cellular homeostasis and explore some translational aspects. Full article
(This article belongs to the Special Issue Advances in AMPK Research: Basic and Translational Aspects)
Show Figures

Figure 1

Figure 1
<p>Schematic presentation of the cAMP-dependent regulation of AMPK activity. AMPK consists of three subunits: one catalytic subunit alpha and two regulatory subunits, beta and gamma. At a high AMP/ATP ratio, ATP bound to the γ-subunit is exchanged for AMP, causing an allosteric modification of AMPK that leads to reduced access of Thr172 to phosphatases, but easy access to LKB1 and CaMKKβ, resulting in enhanced AMPK phosphorylation and activation. cAMP, either via EPAC-dependent activation of CaMKK2 or PKA-dependent activation of LKB1, may promote AMPK activity. On the other hand, both PKA and Akt can also directly phosphorylate AMPK at inhibitory Ser485, thus negatively regulating its activity. Furthermore, cAMP elevation may lead to the simultaneous elevation of AMP, a degradation product of cAMP resulting from PDE activity, which, via an increasing AMP/ATP ratio, may promote AMPK activity. AMP: adenosine monophosphate; ATP: adenosine 5’-triphosphate; cAMP: cyclic AMP; CaMKKβ: Ca<sup>2+</sup>/calmodulin regulated kinase kinase beta; EPAC: exchange protein directly activated by cAMP; LKB1: liver kinase b1; PDEs: phosphodiesterases; PKA: protein kinase A; PPs: protein phosphatases.</p>
Full article ">
16 pages, 1055 KiB  
Review
A Special Network Comprised of Macrophages, Epithelial Cells, and Gut Microbiota for Gut Homeostasis
by Wei Chen, Dan Liu, Changhao Ren, Xiaomin Su, Chun-Kwok Wong and Rongcun Yang
Cells 2022, 11(2), 307; https://doi.org/10.3390/cells11020307 - 17 Jan 2022
Cited by 8 | Viewed by 3853
Abstract
A number of gut epithelial cells derived immunological factors such as cytokines and chemokines, which are stimulated by the gut microbiota, can regulate host immune responses to maintain a well-balance between gut microbes and host immune system. Multiple specialized immune cell populations, such [...] Read more.
A number of gut epithelial cells derived immunological factors such as cytokines and chemokines, which are stimulated by the gut microbiota, can regulate host immune responses to maintain a well-balance between gut microbes and host immune system. Multiple specialized immune cell populations, such as macrophages, dendritic cells (DCs), innate lymphoid cells, and T regulatory (Treg) cells, can communicate with intestinal epithelial cells (IEC) and/or the gut microbiota bi-directionally. The gut microbiota contributes to the differentiation and function of resident macrophages. Situated at the interface between the gut commensals and macrophages, the gut epithelium is crucial for gut homeostasis in microbial recognition, signaling transformation, and immune interactions, apart from being a physical barrier. Thus, three distinct but interactive components—macrophages, microbiota, and IEC—can form a network for the delicate and dynamic regulation of intestinal homeostasis. In this review, we will discuss the crucial features of gut microbiota, macrophages, and IEC. We will also summarize recent advances in understanding the cooperative and dynamic interactions among the gut microbiota, gut macrophages, and IEC, which constitute a special network for gut homeostasis. Full article
(This article belongs to the Special Issue 10th Anniversary of Cells—Advances in Cell Microenvironment)
Show Figures

Figure 1

Figure 1
<p>A special network comprised of macrophages, the gut microbiota, and epithelial cells for gut homeostasis. Immunological mediators, including cytokines and chemokines secreted from the gut epithelial cells stimulated by gut microbiota, such as IL-18 and IL-1β, modulate host immune responses and maintain a well-balanced relationship between gut microbes and the host immune system. The metabolites of the gut microbiota, such as short-chain fatty acids (SCFAs), tryptophan metabolites, secondary bile acids, and polyamines, regulate the proliferation and function of the gut epithelial cells. The metabolites of the gut microbiota, such as SCFAs, tryptophan metabolites, secondary bile acids, UroA/UAS03, polysaccharide, and polyamine can promote the differentiation of macrophages into resident macrophages. Substances such as defensins, c-type lectins, lysozymes, chemokines, Ly6/Plaur domain-containing 8 (Lypd8), Nlrp9b, and interleukin (IL)-25, produced by the gut epithelial cells, especially Paneth cells, also have effects on the gut microbiota. Intestinal epithelial cells (IEC) also produce factors such as thymic stromal lymphopoietin (TSLP), TGFβ, semaphoring 7A, transforming growth factor (TGF-β), retinoic acid, IL-25, and apoptotic cells to promote the macrophages into resident macrophages. Conversely, macrophages can generate some factors such as IL-6, IL-3, IL-4, nitric oxide (NO), Wnt, IL-10, and Lieberkuehn to regulate the proliferation and function of the gut epithelial cells. Meanwhile, macrophages can directly or indirectly produce effects on the gut microbiota. Recent studies have also found effects of the gut microbiota on the perivascular macrophages and muscularis macrophages. Red lines with arrows indicate that the effects of the gut microbiota or their metabolites in the gut contents on the macrophages or gut epithelial cells. Blue lines with arrows indicate that effects of the gut epithelial cell derived factors on the macrophages or gut microbiota. Green lines with arrows indicate the effects of the macrophage derived factors on the gut epithelial cells or gut microbiota. Boxes indicate the components from the gut microbiota, gut epithelial cells, or macrophages.</p>
Full article ">Figure 2
<p>Subpopulations of macrophages in the colon tissues by scRNA-seq analyses. CD45<sup>+</sup>CD11b<sup>+</sup> cells in the colon tissues were sorted and then used as scRNA-seq analyses.</p>
Full article ">
11 pages, 3978 KiB  
Review
Janus Kinase Signaling Pathway and Its Role in COVID-19 Inflammatory, Vascular, and Thrombotic Manifestations
by Jonathan D. Ravid, Orly Leiva and Vipul C. Chitalia
Cells 2022, 11(2), 306; https://doi.org/10.3390/cells11020306 - 17 Jan 2022
Cited by 20 | Viewed by 2692
Abstract
Acute respiratory syndrome-coronavirus-2 (SARS-CoV-2) infection continues to be a worldwide public health crisis. Among the several severe manifestations of this disease, thrombotic processes drive the catastrophic organ failure and mortality in these patients. In addition to a well-established cytokine storm associated with the [...] Read more.
Acute respiratory syndrome-coronavirus-2 (SARS-CoV-2) infection continues to be a worldwide public health crisis. Among the several severe manifestations of this disease, thrombotic processes drive the catastrophic organ failure and mortality in these patients. In addition to a well-established cytokine storm associated with the disease, perturbations in platelets, endothelial cells, and the coagulation system are key in triggering systemic coagulopathy, involving both the macro- and microvasculatures of different organs. Of the several mechanisms that might contribute to dysregulation of these cells following SARS-CoV-2 infection, the current review focuses on the role of activated Janus kinase (JAK) signaling in augmenting thrombotic processes and organ dysfunction. The review concludes with presenting the current understanding and emerging controversies concerning the potential therapeutic applications of JAK inhibitors for ameliorating the inflammation-thrombosis phenotype in COVID-19 patients. Full article
(This article belongs to the Special Issue COVID19, Renin-Angiotensin System and Endothelial Dysfunction)
Show Figures

Figure 1

Figure 1
<p>Schematic illustration of SARS-CoV-2-induced JAK–STAT activation and thrombosis.</p>
Full article ">Figure 2
<p>JAK–STAT inhibitors. Ruxolitonib and baricitinib inhibit JAK1/JAK2 while tofacitinib inhibits JAK1/JAK3. This event, in turn, suppresses the phosphorylation of STAT proteins and reduces their nuclear translocation. This phenomenon downregulates the inflammatory genes.</p>
Full article ">
17 pages, 3222 KiB  
Article
Rhenium Perrhenate (188ReO4) Induced Apoptosis and Reduced Cancerous Phenotype in Liver Cancer Cells
by Samieh Asadian, Abbas Piryaei, Nematollah Gheibi, Bagher Aziz Kalantari, Mohamad Reza Davarpanah, Mehdi Azad, Valentina Kapustina, Mehdi Alikhani, Sahar Moghbeli Nejad, Hani Keshavarz Alikhani, Morteza Mohamadi, Anastasia Shpichka, Peter Timashev, Moustapha Hassan and Massoud Vosough
Cells 2022, 11(2), 305; https://doi.org/10.3390/cells11020305 - 17 Jan 2022
Cited by 18 | Viewed by 3153 | Correction
Abstract
Recurrence in hepatocellular carcinoma (HCC) after conventional treatments is a crucial challenge. Despite the promising progress in advanced targeted therapies, HCC is the fourth leading cause of cancer death worldwide. Radionuclide therapy can potentially be a practical targeted approach to address this concern. [...] Read more.
Recurrence in hepatocellular carcinoma (HCC) after conventional treatments is a crucial challenge. Despite the promising progress in advanced targeted therapies, HCC is the fourth leading cause of cancer death worldwide. Radionuclide therapy can potentially be a practical targeted approach to address this concern. Rhenium-188 (188Re) is a β-emitting radionuclide used in the clinic to induce apoptosis and inhibit cell proliferation. Although adherent cell cultures are efficient and reliable, appropriate cell-cell and cell-extracellular matrix (ECM) contact is still lacking. Thus, we herein aimed to assess 188Re as a potential therapeutic component for HCC in 2D and 3D models. The death rate in treated Huh7 and HepG2 lines was significantly higher than in untreated control groups using viability assay. After treatment with 188ReO4, Annexin/PI data indicated considerable apoptosis induction in HepG2 cells after 48 h but not Huh7 cells. Quantitative RT-PCR and western blotting data also showed increased apoptosis in response to 188ReO4 treatment. In Huh7 cells, exposure to an effective dose of 188ReO4 led to cell cycle arrest in the G2 phase. Moreover, colony formation assay confirmed post-exposure growth suppression in Huh7 and HepG2 cells. Then, the immunostaining displayed proliferation inhibition in the 188ReO4-treated cells on 3D scaffolds of liver ECM. The PI3-AKT signaling pathway was activated in 3D culture but not in 2D culture. In nude mice, Huh7 cells treated with an effective dose of 188ReO4 lost their tumor formation ability compared to the control group. These findings suggest that 188ReO4 can be a potential new therapeutic agent against HCC through induction of apoptosis and cell cycle arrest and inhibition of tumor formation. This approach can be effectively combined with antibodies and peptides for more selective and personalized therapy. Full article
(This article belongs to the Special Issue 10th Anniversary of Cells—Advances in Cellular Pathology)
Show Figures

Figure 1

Figure 1
<p><sup>188</sup>ReO<sub>4</sub> IC50 dose finding on Huh7 and HepG2 cell lines. Huh7 cells viability was measured using LIVE/DEAD<sup>®</sup> Viability/Cytotoxicity Kit and the mean viability of untreated cells (control group), and the treated groups were compared on various doses of 18, 37, and 55 MBq of <sup>188</sup>ReO<sub>4</sub> at 18, 24, and 48 h post-exposure for finding the effective dose of <sup>188</sup>ReO<sub>4</sub> (<b>A</b>–<b>C</b>). HepG2 cells viability was measured using LIVE/DEAD<sup>®</sup> Viability/Cytotoxicity Kit in response to 37, 55, and 73 MBq of <sup>188</sup>ReO<sub>4</sub> 18, 24, and 48 h post-exposure for finding the effective dose of <sup>188</sup>ReO4 in treated HepG2 cells (<b>D</b>–<b>F</b>). The IC50 value of 188ReO<sub>4</sub> in Huh7 cells was 37 MBq 24 h after exposure, and it was 55 MBq 48 h for HepG2 cells. Data are presented as the mean ± SD, <span class="html-italic">n</span> = 3 (* <span class="html-italic">p</span> &lt; 0.05, ** <span class="html-italic">p</span> &lt; 0.01, and *** <span class="html-italic">p</span> &lt; 0.001, **** <span class="html-italic">p</span> &lt; 0.0001).</p>
Full article ">Figure 2
<p>Cell cycle evaluation and colony formation assay. (<b>A</b>,<b>B</b>) Flow cytometry evaluated cell cycle profile for cells treated with 37 MBq (Huh7)/55 MBq (HepG2) of <sup>188</sup>ReO<sub>4</sub> versus untreated group 18, 24, and 24 h post-exposure using PI/ RNase staining. The results showed that 37 MBq exposure led into significant G2/M arrest in Huh7 cells after 24 h, while, in HepG2, 55MBq exposure did not make significant changes in cell cycle phases. (<b>C</b>,<b>D</b>) Cells treated with 37 MBq (Huh7)/55 MBq (HepG2) of <sup>188</sup>ReO<sub>4</sub> reduced colony formation capacity. The results show an almost three-fold lower number of colonies in treated cells compared to untreated control cells. (<b>E</b>,<b>F</b>) The number of CD133 positive cells decreased significantly after treatment in a time dependent manner. Data are expressed as the mean ± SD, <span class="html-italic">n</span> = 3 (* <span class="html-italic">p</span> &lt; 0.05, ** <span class="html-italic">p</span> &lt; 0.01, and *** <span class="html-italic">p</span> &lt; 0.001, **** <span class="html-italic">p</span> &lt; 0.0001) versus the control group.</p>
Full article ">Figure 3
<p>Apoptosis induction evaluation. (<b>A</b>,<b>B</b>) Apoptosis evaluated using Annexin PI at three time points of 18, 24, and 48 h post-exposure for both Huh7 and HepG2 cell lines. (<b>C</b>,<b>D</b>). Bar plots show increased percentage of apoptotic Huh7 cells and HepG2 cells at 18, 24, and 48 h post-exposure. (<b>E</b>–<b>H</b>) represents the qPCR results for <span class="html-italic">p53</span> and <span class="html-italic">Bax</span> relative mRNA expression in Huh7 and HepG2 cells, respectively, treated with 37 and 55 MBq of <sup>188</sup>ReO<sub>4</sub> and normalized to control cells at 18, 24, and 48 h post-exposure. The <span class="html-italic">GAPDH</span> used as a housekeeping gene. Huh7 cells displayed increased relative expression of <span class="html-italic">p53</span> mRNA at 24 h and <span class="html-italic">Bax</span> mRNA was significantly higher in Huh7 cells at 24 and 48 h post-exposure. HepG2 cells showed increased Bax expression 18 and 24 h post-exposure. (<b>I</b>) Western blots of p53 and BAX protein in Huh7 and HepG2 cells before and 48 h after treatment. (<b>J</b>) Western blots of Caspase 3 protein in Huh7 and HepG2 cells before and 24 and 48 h after treatment. Data are expressed as the mean ± SD, <span class="html-italic">n</span> = 3 (* <span class="html-italic">p</span> &lt; 0.05, ** <span class="html-italic">p</span> &lt; 0.01).</p>
Full article ">Figure 4
<p>Evaluation of Huh7 and HepG2 cells in 3D LEM culture. (<b>A</b>) MT staining of Huh7 and HepG2 cells homing at synthesized LEM. (<b>B</b>,<b>C</b>) Viability percentage versus the control for finding the effective dose of <sup>188</sup>ReO<sub>4</sub> in Huh7/HepG2-LEM treated with 37, 55, and 73 MBq doses 18, 24, and 48 h post-exposure. (<b>D</b>–<b>F)</b> The Ki67-positive cells representing proliferating fraction of Huh7/HepG2-LEMs treated with <sup>188</sup>ReO<sub>4</sub>. (<b>G</b>) The qPCR results for <span class="html-italic">p53</span> and <span class="html-italic">Bax</span> relative mRNA expression in Huh7/HepG2-LEMs treated with <sup>188</sup>ReO<sub>4</sub> versus the control after 18, 24, and 48 h. (<b>H</b>–<b>L</b>) IF staining done to visualize p53 and Bax protein expressions in Huh7-LEM and HepG2-LEM treated with <sup>188</sup>ReO<sub>4</sub>. Scale bars: 200 μm. Values are presented as mean ± SD, <span class="html-italic">n</span> = 3 (* <span class="html-italic">p</span> &lt; 0.05, ** <span class="html-italic">p</span> &lt; 0.01).</p>
Full article ">Figure 5
<p>Radio-resistance evaluation. (<b>A</b>,<b>C</b>,<b>D</b>) The qPCR results for <span class="html-italic">PTEN</span> and <span class="html-italic">PI3K</span> relative mRNA expressions in 2D cultured Huh7 and HepG2 cells, respectively, treated with 37 and 55 MBq of <sup>188</sup>ReO<sub>4</sub>, versus the control 18, 24, and 48 h post-exposure. (<b>B</b>) Western blots and relative bar graphs of P-AKT protein alternation in Huh7 and HepG2 cells, respectively, after exposure versus the untreated control group. (<b>E</b>,<b>F</b>) The qPCR results for <span class="html-italic">PTEN</span> and <span class="html-italic">PI3K</span> relative mRNA expression in Huh7/HepG2-LEMs 3D culture 18, 24, and 48 h post-exposure. Values are expressed as mean ± SD, <span class="html-italic">n</span> = 3 (* <span class="html-italic">p</span> &lt; 0.05, ** <span class="html-italic">p</span> &lt; 0.01). IF staining done to detect P-AKT expression in Huh7-LEM and HepG2-LEM treated with 55 MBq of <sup>188</sup>ReO<sub>4</sub> (Scale bars: 200 μm).</p>
Full article ">
12 pages, 7788 KiB  
Review
Endolysosomal Cation Channels and Lung Disease
by Barbara Spix, Aicha Jeridi, Meshal Ansari, Ali Önder Yildirim, Herbert B. Schiller and Christian Grimm
Cells 2022, 11(2), 304; https://doi.org/10.3390/cells11020304 - 17 Jan 2022
Cited by 4 | Viewed by 3750
Abstract
Endolysosomal cation channels are emerging as key players of endolysosomal function such as endolysosomal trafficking, fusion/fission, lysosomal pH regulation, autophagy, lysosomal exocytosis, and endocytosis. Diseases comprise lysosomal storage disorders (LSDs) and neurodegenerative diseases, metabolic diseases, pigmentation defects, cancer, immune disorders, autophagy related diseases, [...] Read more.
Endolysosomal cation channels are emerging as key players of endolysosomal function such as endolysosomal trafficking, fusion/fission, lysosomal pH regulation, autophagy, lysosomal exocytosis, and endocytosis. Diseases comprise lysosomal storage disorders (LSDs) and neurodegenerative diseases, metabolic diseases, pigmentation defects, cancer, immune disorders, autophagy related diseases, infectious diseases and many more. Involvement in lung diseases has not been a focus of attention so far but recent developments in the field suggest critical functions in lung physiology and pathophysiology. Thus, loss of TRPML3 was discovered to exacerbate emphysema formation and cigarette smoke induced COPD due to dysregulated matrix metalloproteinase 12 (MMP-12) levels in the extracellular matrix of the lung, a known risk factor for emphysema/COPD. While direct lung function measurements with the exception of TRPML3 are missing for other endolysosomal cation channels or channels expressed in lysosome related organelles (LRO) in the lung, links between those channels and important roles in lung physiology have been established such as the role of P2X4 in surfactant release from alveolar epithelial Type II cells. Other channels with demonstrated functions and disease relevance in the lung such as TRPM2, TRPV2, or TRPA1 may mediate their effects due to plasma membrane expression but evidence accumulates that these channels might also be expressed in endolysosomes, suggesting additional and/or dual roles of these channels in cell and intracellular membranes. We will discuss here the current knowledge on cation channels residing in endolysosomes or LROs with respect to their emerging roles in lung disease. Full article
(This article belongs to the Section Intracellular and Plasma Membranes)
Show Figures

Figure 1

Figure 1
<p>Schematic of an alveolus showing expression of confirmed and putative endolysosomal/vesicular/LRO cation channels involved in lung physiology and disease in the different alveolar/lung cell types. Black labeled compartments represent nuclei.</p>
Full article ">Figure 2
<p>(<b>A</b>) Single-cell suspension from murine whole lungs were analyzed using Drop-seq following 6 months of either filtered air (control) or cigarette smoke exposure (CS). The transcriptomes data are projected using the UMAP algorithm, each cell colour-coded by cell type, exposure condition and expression values of indicated genes. Cell types with prominent expression are highlighted. (<b>B</b>) The dotplot reflects normalized expression levels of selected genes across cell types. The dot colour indicates the expression level, and the dot size the percentage of cells expressing the gene per group. DC = dendritic cells; IM = interstitial macrophages; Mono = monocytes; AM = alveolar macrophages; Neutro = neutrophils; Baso = basophils; Ciliated = ciliated cells; Club and Goblet = Club (or clara) and Goblet cells; NK = natural killer cells; NEC = neuroendocrine cells; Fibro = fibroblasts; SMCs = smooth muscle cells; aCap = alveolar capillary; gCap = general capillary; VEC = vascular endothelial cells; LEC = lymphatic endothelial cells; AT1 and AT2 = alveolar epithelial cells type 1 and 2; MegaK = megakaryocytes.</p>
Full article ">
13 pages, 940 KiB  
Review
Functions of CNKSR2 and Its Association with Neurodevelopmental Disorders
by Hidenori Ito and Koh-ichi Nagata
Cells 2022, 11(2), 303; https://doi.org/10.3390/cells11020303 - 17 Jan 2022
Cited by 5 | Viewed by 3270
Abstract
The Connector Enhancer of Kinase Suppressor of Ras-2 (CNKSR2), also known as CNK2 or MAGUIN, is a scaffolding molecule that contains functional protein binding domains: Sterile Alpha Motif (SAM) domain, Conserved Region in CNK (CRIC) domain, PSD-95/Dlg-A/ZO-1 (PDZ) domain, Pleckstrin Homology (PH) domain, [...] Read more.
The Connector Enhancer of Kinase Suppressor of Ras-2 (CNKSR2), also known as CNK2 or MAGUIN, is a scaffolding molecule that contains functional protein binding domains: Sterile Alpha Motif (SAM) domain, Conserved Region in CNK (CRIC) domain, PSD-95/Dlg-A/ZO-1 (PDZ) domain, Pleckstrin Homology (PH) domain, and C-terminal PDZ binding motif. CNKSR2 interacts with different molecules, including RAF1, ARHGAP39, and CYTH2, and regulates the Mitogen-Activated Protein Kinase (MAPK) cascade and small GTPase signaling. CNKSR2 has been reported to control the development of dendrite and dendritic spines in primary neurons. CNKSR2 is encoded by the CNKSR2 gene located in the X chromosome. CNKSR2 is now considered as a causative gene of the Houge type of X-linked syndromic mental retardation (MRXHG), an X-linked Intellectual Disability (XLID) that exhibits delayed development, intellectual disability, early-onset seizures, language delay, attention deficit, and hyperactivity. In this review, we summarized molecular features, neuronal function, and neurodevelopmental disorder-related variations of CNKSR2. Full article
(This article belongs to the Special Issue Pathophysiological Mechanism of Neurodevelopmental Disorders)
Show Figures

Figure 1

Figure 1
<p>Molecular structure and interacting molecules of CNKSR2. (<b>A</b>) Structure of CNKSR2. SAM, the sterile alpha motif; CRIC, the conserved region in CNKSR2; PDZ, PDZ domain; PH, pleckstrin homology domain. Numbers indicate amino acid positions. (<b>B</b>) Interacting partners for CNKSR2. Binding regions of CNKSR2 and interacting partners are connected with solid lines. The full-length molecule of CNKSR2 may be required for binding with Rlf, because neither <span class="html-italic">N</span>- nor C-terminal fragment interact. The region in CNKSR2 responsible for binding to Ral has not been obtained because of the weak interaction.</p>
Full article ">Figure 2
<p>Schematic representation of human CNKSR2 variants identified in patients with neurodevelopmental disorder. (<b>A</b>) Genomic map of chromosome Xp22.12 with extent of deletions (gray bars). (<b>B</b>) Illustration of human CNKSR2 including the positions and the predicted effect of the variants.</p>
Full article ">
22 pages, 974 KiB  
Review
A Defective Viral Particle Approach to COVID-19
by Maria Kalamvoki and Vic Norris
Cells 2022, 11(2), 302; https://doi.org/10.3390/cells11020302 - 17 Jan 2022
Cited by 8 | Viewed by 3515
Abstract
The novel coronavirus SARS-CoV-2 has caused a pandemic resulting in millions of deaths worldwide. While multiple vaccines have been developed, insufficient vaccination combined with adaptive mutations create uncertainty for the future. Here, we discuss novel strategies to control COVID-19 relying on Defective Interfering [...] Read more.
The novel coronavirus SARS-CoV-2 has caused a pandemic resulting in millions of deaths worldwide. While multiple vaccines have been developed, insufficient vaccination combined with adaptive mutations create uncertainty for the future. Here, we discuss novel strategies to control COVID-19 relying on Defective Interfering Particles (DIPs) and related particles that arise naturally during an infection. Our intention is to encourage and to provide the basis for the implementation of such strategies by multi-disciplinary teams. We therefore provide an overview of SARS-CoV-2 for a multi-disciplinary readership that is specifically tailored to these strategies, we identify potential targets based on the current knowledge of the properties and functions of coronaviruses, and we propose specific strategies to engineer DIPs and other interfering or therapeutic nanoparticles. Full article
Show Figures

Figure 1

Figure 1
<p>Harnessing EV properties to combat SARS-CoV-2 infection or treat COVID-19. (<b>A</b>) EVs can be used to deliver nucleic acid sequences that either modulate the expression of specific targets, express genes of interests, or encode for viral products. (<b>B</b>) EVs can be used to deliver compounds of interest. (<b>C</b>) EVs derived from a specific cell type or tissue could be used to mitigate disease and trigger tissue regeneration. (<b>D</b>) EVs carrying the spike protein can be used to antagonize viral entry into a host cell. (<b>E</b>) EVs carrying the virus entry receptor ACE2 could serve as decoys for the virus. (<b>F</b>) EVs carrying viral antigens could be used for vaccine development. The image was generated with <a href="http://BioRender.com" target="_blank">BioRender.com</a> (accessed on 13 September 2021).</p>
Full article ">Figure 2
<p>The SARS-CoV-2 genome. On entry into the host cell, a coronavirus particle is uncoated, and its single-stranded positive-sense RNA genome enters the cytoplasm. Two-thirds of the coronavirus genome is occupied by two large overlapping open reading frames (ORF1a and ORF1b) that are translated into polyproteins and that are processed to generate 16 non-structural proteins (nsp1 to nsp16). The rest of the genome includes ORFs for the structural proteins and several accessory proteins. The 5′-UTR is 265 nucleotides long, while the 3′-UTR is 358 nucleotides. The major distinction between other coronaviruses related to SARS-CoV and SARS-CoV-2 is in orf3b, Spike and orf8 but especially in the highly variable Spike S1 and orf8, which are recombination hot spots.</p>
Full article ">
22 pages, 4714 KiB  
Article
[(WR)8WKβA]-Doxorubicin Conjugate: A Delivery System to Overcome Multi-Drug Resistance against Doxorubicin
by Khalid Zoghebi, Hamidreza Montazeri Aliabadi, Rakesh Kumar Tiwari and Keykavous Parang
Cells 2022, 11(2), 301; https://doi.org/10.3390/cells11020301 - 16 Jan 2022
Cited by 11 | Viewed by 3516
Abstract
Doxorubicin (Dox) is an anthracycline chemotherapeutic agent used to treat breast, leukemia, and lymphoma malignancies. However, cardiotoxicity and inherent acquired resistance are major drawbacks, limiting its clinical application. We have previously shown that cyclic peptide [WR]9 containing alternate tryptophan (W) and arginine [...] Read more.
Doxorubicin (Dox) is an anthracycline chemotherapeutic agent used to treat breast, leukemia, and lymphoma malignancies. However, cardiotoxicity and inherent acquired resistance are major drawbacks, limiting its clinical application. We have previously shown that cyclic peptide [WR]9 containing alternate tryptophan (W) and arginine (R) residues acts as an efficient molecular transporter. An amphiphilic cyclic peptide containing a lysine (K) residue and alternative W and R was conjugated through a free side chain amino group with Dox via a glutarate linker to afford [(WR)8WKβA]-Dox conjugate. Antiproliferative assays were performed in different cancer cell lines using the conjugate and the corresponding physical mixture of the peptide and Dox to evaluate the effectiveness of synthesized conjugate compared to the parent drug alone. [(WR)8WKβA]-Dox conjugate showed higher antiproliferative activity at 10 µM and 5 µM than Dox alone at 5 μM. The conjugate inhibited the cell viability of ovarian adenocarcinoma (SK-OV-3) by 59% and the triple-negative breast cancer cells MDA-MB-231 and MCF-7 by 71% and 77%, respectively, at a concentration of 5 μM after 72 h of incubation. In contrast, Dox inhibited the proliferation of SK-OV-3, MDA-MB-231, and MCF-7 by 35%, 63%, and 57%, respectively. Furthermore, [(WR)8WKβA]-Dox conjugate (5 µM) inhibited the cell viability of Dox-resistant cells (MES-SA/MX2) by 92%, while the viability of cells incubated with free Dox was only 15% at 5 μM. Confocal microscopy images confirmed the ability of both Dox conjugate and the physical mixture of the peptide with the drug to deliver Dox through an endocytosis-independent pathway, as the uptake was not inhibited in the presence of endocytosis inhibitors. The stability of Dox conjugate was observed at different time intervals using analytical HPLC when the conjugate was incubated with 25% human serum. Half-life (t1/2) for [(WR)8WKβA]-Dox conjugate was (∼6 h), and more than 80% of the conjugate was degraded at 12 h. The release of free Dox was assessed intracellularly using the CCRF-CEM cell line. The experiment demonstrated that approximately 100% of free Dox was released from the conjugate intracellularly within 72 h. These data confirm the ability of the cyclic cell-penetrating peptide containing tryptophan and arginine residues as an efficient tool for delivery of Dox and for overcoming resistance to it. Full article
Show Figures

Graphical abstract

Graphical abstract
Full article ">Figure 1
<p>Inhibition of (<b>A</b>) SK-OV-3, (<b>B</b>) MDA-MB-231, (<b>C</b>) MCF-7, and (<b>D</b>) MES-SA/MX2 cells (Dox-resistant cells) by free Dox (5 µM) or (1, 5, 10, and 20 µM), [(WR)<sub>8</sub>WKbA]-Dox, [WR]<sub>9</sub> + Dox, and [WR]<sub>9</sub> at 1, 5, and 10 mM. Results are mean ± SD (<span class="html-italic">n</span> = 3) (* <span class="html-italic">p</span> &lt; 0.05, ** <span class="html-italic">p</span> &lt; 0.01, *** <span class="html-italic">p</span> &lt; 0.001 treatment vs. Ctrl (Dox), <span class="html-italic">p</span>-value only for treatment after 72 h).</p>
Full article ">Figure 1 Cont.
<p>Inhibition of (<b>A</b>) SK-OV-3, (<b>B</b>) MDA-MB-231, (<b>C</b>) MCF-7, and (<b>D</b>) MES-SA/MX2 cells (Dox-resistant cells) by free Dox (5 µM) or (1, 5, 10, and 20 µM), [(WR)<sub>8</sub>WKbA]-Dox, [WR]<sub>9</sub> + Dox, and [WR]<sub>9</sub> at 1, 5, and 10 mM. Results are mean ± SD (<span class="html-italic">n</span> = 3) (* <span class="html-italic">p</span> &lt; 0.05, ** <span class="html-italic">p</span> &lt; 0.01, *** <span class="html-italic">p</span> &lt; 0.001 treatment vs. Ctrl (Dox), <span class="html-italic">p</span>-value only for treatment after 72 h).</p>
Full article ">Figure 2
<p>Confocal microscopy images of free Dox (5 μM), [WR]<sub>9</sub> + Dox (1:1, (5 μM)) [(WR)<sub>8</sub>WKβA]-Dox conjugate (5 μM), or after 24 h in SK-OV-3 cells. Red represents the fluorescence of Dox.</p>
Full article ">Figure 3
<p>Confocal microscopy images of free Dox (5 μM), [WR]<sub>9</sub> + Dox (1:1, (5 μM)), or [(WR)<sub>8</sub>WKβA]-Dox conjugate (5 μM) after 24 h in (<b>A</b>) MDA-MB-231 and (<b>B</b>) MES-SA/MX2 cells. Red represents the fluorescence of Dox.</p>
Full article ">Figure 4
<p>Intracellular tracking of Dox in MDA-MB-231 cells revealed efficient nuclear delivery by [(WR)<sub>8</sub>WKβA]-Dox via quantification by (<b>A</b>) HPLC in nuclear and cytoplasmic compartments and by (<b>B</b>) confocal microscopy.</p>
Full article ">Figure 5
<p>[(WR)<sub>8</sub>WKβA]-Dox conjugate cellular uptake in MDA-MB-231 and MES-SA/MX2 cells in the presence of different inhibitors of clathrin- and caveolae-dependent endocytosis, as studied by flow cytometry. Results are mean ± SD (<span class="html-italic">n</span> = 3) (* <span class="html-italic">p</span> &lt; 0.05, ** <span class="html-italic">p</span> &lt; 0.01, treatment vs. Ctrl ([(WR)<sub>8</sub>WKβA]-Dox conjugate alone).</p>
Full article ">Figure 6
<p>[(WR)<sub>8</sub>WKβA]-Dox conjugate (10 µM) cellular uptake in (<b>A</b>) MDA-MB-231 cells and (<b>B</b>) and MES-SA/MX2cells in the presence of different inhibitors of clathrin- and caveolae-dependent endocytosis, as studied by confocal microscopy.</p>
Full article ">Figure 6 Cont.
<p>[(WR)<sub>8</sub>WKβA]-Dox conjugate (10 µM) cellular uptake in (<b>A</b>) MDA-MB-231 cells and (<b>B</b>) and MES-SA/MX2cells in the presence of different inhibitors of clathrin- and caveolae-dependent endocytosis, as studied by confocal microscopy.</p>
Full article ">Figure 7
<p>(<b>A</b>) Schematic representation of the possible susceptible bonds in [(WR)<sub>8</sub>WKβA]-Dox conjugate. (<b>B</b>) Stability analysis of [(WR)<sub>8</sub>WKβA]-Dox conjugate in human plasma. (<b>C</b>) Intracellular release of free Dox from [(WR)<sub>8</sub>WKβA]-Dox conjugate.</p>
Full article ">Scheme 1
<p>Synthesis of cyclic peptide [(WR)<sub>8</sub>WKβA].</p>
Full article ">Scheme 2
<p>Synthesis of cyclic peptide [(WR)<sub>8</sub>WKβA]-Dox conjugate.</p>
Full article ">
15 pages, 5018 KiB  
Article
STAT3 Is the Master Regulator for the Forming of 3D Spheroids of 3T3-L1 Preadipocytes
by Hiroshi Ohguro, Yosuke Ida, Fumihito Hikage, Araya Umetsu, Hanae Ichioka, Megumi Watanabe and Masato Furuhashi
Cells 2022, 11(2), 300; https://doi.org/10.3390/cells11020300 - 16 Jan 2022
Cited by 23 | Viewed by 4467
Abstract
To elucidate the currently unknown mechanisms responsible for the diverse biological aspects between two-dimensional (2D) and three-dimensional (3D) cultured 3T3-L1 preadipocytes, RNA-sequencing analyses were performed. During a 7-day culture period, 2D- and 3D-cultured 3T3-L1 cells were subjected to lipid staining by BODIPY, qPCR [...] Read more.
To elucidate the currently unknown mechanisms responsible for the diverse biological aspects between two-dimensional (2D) and three-dimensional (3D) cultured 3T3-L1 preadipocytes, RNA-sequencing analyses were performed. During a 7-day culture period, 2D- and 3D-cultured 3T3-L1 cells were subjected to lipid staining by BODIPY, qPCR for adipogenesis related genes, including peroxisome proliferator-activated receptor γ (Pparγ), CCAAT/enhancer-binding protein alpha (Cebpa), Ap2 (fatty acid-binding protein 4; Fabp4), leptin, and AdipoQ (adiponectin), and RNA-sequencing analysis. Differentially expressed genes (DEGs) were detected by next-generation RNA sequencing (RNA-seq) and validated by a quantitative reverse transcription–polymerase chain reaction (qRT–PCR). Bioinformatic analyses were performed on DEGs using a Gene Ontology (GO) enrichment analysis and an Ingenuity Pathway Analysis (IPA). Significant spontaneous adipogenesis was observed in 3D 3T3-L1 spheroids, but not in 2D-cultured cells. The mRNA expression of Pparγ, Cebpa, and Ap2 among the five genes tested were significantly higher in 3D spheroids than in 2D-cultured cells, thus providing support for this conclusion. RNA analysis demonstrated that a total of 826 upregulated and 725 downregulated genes were identified as DEGs. GO enrichment analysis and IPA found 50 possible upstream regulators, and among these, 6 regulators—transforming growth factor β1 (TGFβ1), signal transducer and activator of transcription 3 (STAT3), interleukin 6 (IL6), angiotensinogen (AGT), FOS, and MYC—were, in fact, significantly upregulated. Further analyses of these regulators by causal networks of the top 14 predicted diseases and functions networks (IPA network score indicated more than 30), suggesting that STAT3 was the most critical upstream regulator. The findings presented herein suggest that STAT3 has a critical role in regulating the unique biological properties of 3D spheroids that are produced from 3T3-L1 preadipocytes. Full article
(This article belongs to the Section Cell Methods)
Show Figures

Figure 1

Figure 1
<p>Spontaneous adipogenic differentiation in 3D 3T3-L1 spheroids. Representative images of lipid staining of 2D- and 3D-cultured 3T3-L1 cells with BODIPY, DAPI, and phalloidin are shown in upper panels (scale bar; 100 μm). In the lower panels, 2D- and 3D-cultured 3T3-L1 cells at Day 7 were subjected to qPCR analysis of <span class="html-italic">Ppa</span><span class="html-italic">γ</span>, <span class="html-italic">Cebpa</span>, <span class="html-italic">Ap2</span> (<span class="html-italic">Fabp4</span>), <span class="html-italic">AdipoQ</span>, and <span class="html-italic">leptin</span>, and the resulting plots of <span class="html-italic">Ppar</span><span class="html-italic">γ</span>, <span class="html-italic">Cebpa,</span> and <span class="html-italic">Ap2</span> are shown <span class="html-italic">(AdipoQ</span> and <span class="html-italic">leptin</span> expressions were not detected in both 2D and 3D). All experiments were performed in duplicate using fresh preparations consisting of 5 or 16 of 3D spheroids each for lipid staining or qPCR analysis, respectively, or 2D-cultured cells (<span class="html-italic">n</span> = 4 wells from 6 well culture dish) for both analyses. Data are presented as arithmetic mean ± standard error of the mean (SEM). ** <span class="html-italic">p</span> &lt; 0.01 (unpaired <span class="html-italic">t</span>-test).</p>
Full article ">Figure 2
<p>Differentially expressed genes (DEGs) between 2D- and 3D-cultured 3T3-L1 cells. Genes that are expressed differentially between 2D- and 3D-cultured 3T3-L1 cells were demonstrated by a hierarchical clustering heatmap (<b>A</b>), an M–A plot (<b>B</b>), and a volcano plot (<b>C</b>). M–A plot represents relationship between mean expression values (log (base mean); <span class="html-italic">x</span> axis) and magnitude of gene expression change (log2 of fold change; <span class="html-italic">y</span> axis), and volcano plot represents the relationship between the magnitude of gene expression change (log2 of fold change; <span class="html-italic">x</span> axis) and statistical significance of this change (−log10 of false discovery rate (FDR); <span class="html-italic">y</span> axis). Colored points represent differentially expressed genes (cutoff FDR &lt; 0.05) and/or the magnitude of change ≥2 that are either overexpressed (red) or underexpressed (blue) in 2D-cultured, compared with 3D-cultured 3T3-L1 cells.</p>
Full article ">Figure 3
<p>Possible networks of adipogenesis-related signaling during the maturation of adipocytes obtained by the IPA analysis database.</p>
Full article ">Figure 4
<p>The graphical summary of the biological process network of DEGs. Prediction legend is shown in <a href="#app1-cells-11-00300" class="html-app">Figure S1</a>.</p>
Full article ">Figure 5
<p>GO enrichment analysis and Ingenuity Pathway Analysis (IPA) of DEGs in 2D- and 3D-cultured 3T3-L1 cells. Upregulated (<b>A</b>) and downregulated (<b>B</b>) mRNA-enriched biological functions were validated by GO analysis.</p>
Full article ">Figure 6
<p>IPA analysis of DEGs. Overlapping canonical 25 upregulated pathways were estimated by the IPA analysis. Among three biophysiological categories, molecular and cellular functions (<b>A</b>), physiological system development and function (<b>B</b>), and diseases and disorders (<b>C</b>), the bars correspond to the top 18–22 canonical pathways that surpassed the Ingenuity statistical threshold using the Benjamini–Hochberg multiple testing correction of Fisher’s exact test.</p>
Full article ">Figure 7
<p>Upstream regulator analysis by IPA. Upstream analysis in IPA identified TGFβ1, STAT3, IL6, AGT, FOS, and MYC as master regulators. The graphs and the networks of each regulator were obtained through the use of IPA (QIAGEN Inc., <a href="https://www.qiagenbioinformatics.com/products/ingenuity-pathway-analysis" target="_blank">https://www.qiagenbioinformatics.com/products/ingenuity-pathway-analysis</a>, accessed on 3 November 2021). Among these, the STAT3 network is demonstrated, and others are shown in <a href="#app1-cells-11-00300" class="html-app">Figure S2</a>. Prediction legend is shown in <a href="#app1-cells-11-00300" class="html-app">Figure S1</a>.</p>
Full article ">Figure 8
<p>Merged causal networks related to AGT (network 5), STAT3 (network 7), and TGFβ1 (network 10). Prediction legend is shown in <a href="#app1-cells-11-00300" class="html-app">Figure S1</a>.</p>
Full article ">
15 pages, 2177 KiB  
Article
Sacsin Deletion Induces Aggregation of Glial Intermediate Filaments
by Fernanda Murtinheira, Mafalda Migueis, Ricardo Letra-Vilela, Mickael Diallo, Andrea Quezada, Cláudia A. Valente, Abel Oliva, Carmen Rodriguez, Vanesa Martin and Federico Herrera
Cells 2022, 11(2), 299; https://doi.org/10.3390/cells11020299 - 16 Jan 2022
Cited by 8 | Viewed by 3566
Abstract
Autosomal recessive spastic ataxia of Charlevoix-Saguenay (ARSACS) is a neurodegenerative disorder commonly diagnosed in infants and characterized by progressive cerebellar ataxia, spasticity, motor sensory neuropathy and axonal demyelination. ARSACS is caused by mutations in the SACS gene that lead to truncated or defective [...] Read more.
Autosomal recessive spastic ataxia of Charlevoix-Saguenay (ARSACS) is a neurodegenerative disorder commonly diagnosed in infants and characterized by progressive cerebellar ataxia, spasticity, motor sensory neuropathy and axonal demyelination. ARSACS is caused by mutations in the SACS gene that lead to truncated or defective forms of the 520 kDa multidomain protein, sacsin. Sacsin function is exclusively studied on neuronal cells, where it regulates mitochondrial network organization and facilitates the normal polymerization of neuronal intermediate filaments (i.e., neurofilaments and vimentin). Here, we show that sacsin is also highly expressed in astrocytes, C6 rat glioma cells and N9 mouse microglia. Sacsin knockout in C6 cells (C6Sacs−/−) induced the accumulation of the glial intermediate filaments glial fibrillary acidic protein (GFAP), nestin and vimentin in the juxtanuclear area, and a concomitant depletion of mitochondria. C6Sacs−/− cells showed impaired responses to oxidative challenges (Rotenone) and inflammatory stimuli (Interleukin-6). GFAP aggregation is also associated with other neurodegenerative conditions diagnosed in infants, such as Alexander disease or Giant Axonal Neuropathy. Our results, and the similarities between these disorders, reinforce the possible connection between ARSACS and intermediate filament-associated diseases and point to a potential role of glia in ARSACS pathology. Full article
(This article belongs to the Topic Cellular Redox Homeostasis)
Show Figures

Figure 1

Figure 1
<p>Glial cells express sacsin. (<b>A</b>) Representative Western blot images indicate that primary rat astrocytes have sacsin levels similar to C6 glioblastoma cells, with C1 and C2 indicating independent cultures of primary astrocytes. (<b>B</b>) Sacsin was detected in HEK293, HeLa, N/Tert-1 and N9 cell lines and primary human keratinocytes by Western blot, but at lower levels than C6 cells. (<b>C</b>) Sacsin was not detected in HT22 mouse hippocampal cell lines or U251 glioblastoma cells in these conditions, but we cannot rule out that they express very low levels of the protein. Data were analyzed by means of a one-way ANOVA, followed by a Tukey post hoc test, *, significant vs. C6 reference strain, <span class="html-italic">p</span> &lt; 0.05. (<b>D</b>) Representative images of immunocytochemistry for endogenous sacsin (green) in primary rat astrocytes and C6 cells. Mitochondria were counterstained with Mitotracker (red) and nuclei with Hoechst (blue). Scale bar, 20 μm. (<b>E</b>), Diagram illustrating the workflow for CRISPR/Cas9-mediated generation of C6<sup>Sacs−/−</sup> cell lines. Cells were transfected with CRISPR/Cas9 plasmids, sorted by FACS and clonally expanded. Resulting clonal populations were then tested for sacsin expression and phenotype. (<b>F</b>) Representative Western blot analyses of a C6<sup>Sacs−/−</sup> clone, using two different sacsin antibodies against its N- and C-termini (refs. sc-515118 and ABN1019, respectively).</p>
Full article ">Figure 2
<p>Sacsin knockout renders cells more sensitive to rotenone-induced stress. (<b>A</b>) Under basal conditions, C6<sup>Sacs−/−</sup> had levels of reactive oxygen species (ROS) similar to C6 cells, as determined by DCF fluorescence. However, C6<sup>Sacs−/−</sup> showed higher levels of superoxide radicals, as determined by DHE fluorescence. Data were analyzed by means of two-way ANOVA followed by a Tukey post hoc test, #, significant vs. C6 reference strain, <span class="html-italic">p</span> &lt; 0.05. (<b>B</b>) Both C6 and C6<sup>Sacs−/−</sup> displayed a non-significant decrease in viability when challenged with rotenone (5 µM) or its vehicle (DMSO 0.1%) for 4 h. (<b>C</b>) Representative brightfield images show similar gross morphological alterations in both cell strains following rotenone treatment, but flow cytometry analysis (<b>D</b>) indicated a stronger decrease in size (Forward-Scatter, FSC-A) in C6<sup>Sacs−/−</sup> cells. (<b>E</b>) Representative flow cytometry plot showing DAPI and DCF staining of C6 and C6<sup>Sacs−/−</sup> cells after incubation with rotenone (red and dark blue, respectively) or its vehicle (orange and light blue). Rotenone increases ROS levels in both C6 cell strains, but with more intensity in C6<sup>Sacs−/−</sup> (Quadrant 1, Q1). In C6<sup>Sacs−/−</sup> cells it only induces some residual cell death (DAPI staining, quadrants 2 and 3, Q2/Q3). (<b>F</b>,<b>G</b>) Representative histograms from flow cytometry analysis using DCF and DHE in C6 and C6<sup>Sacs−/−</sup> cells after treatment with rotenone. (<b>H</b>,<b>I</b>) Quantification of oxidative stress levels in 3 independent experiments (mean ± SEM). Data were analyzed by means of two-way ANOVA, followed by a Tukey post hoc test, *, significant vs. vehicle; #, significant vs. C6 reference strain, <span class="html-italic">p</span> &lt; 0.05.</p>
Full article ">Figure 3
<p>Sacsin deletion disrupts glial intermediate filament networks. (<b>A</b>) Representative immunocytochemistry images showing the distribution of the glial intermediate filaments vimentin, nestin and GFAP (green); mitochondria (Mitotracker, red); and nuclei (Hoechst, blue) in C6 and C6<sup>Sacs−/−</sup> cells. Vimentin, nestin and GFAP accumulate in the juxtanuclear area in C6<sup>Sacs−/−</sup> cells. Scale bar, 20 μm. (<b>B</b>) Widefield images of C6 and C6<sup>Sacs−/−</sup> cells were further analyzed by means of the Nano J Super-Resolution Radial Fluctuations (SRRF) algorithm, which provided higher resolution details to obtain a more defined image of the intermediate filament networks. N, nucleus. White arrows, intermediate filament aggregates. Scale bar, 20 μm. (<b>C</b>) Quantification of microscopy images from 3 independent experiments (mean ± SEM). *, significant vs. C6 reference strain (<span class="html-italic">p</span> &lt; 0.05, Student’s <span class="html-italic">t</span>-test). The total numbers of reference C6 cells counted in 3 independent experiments were 549 (GFAP), 464 (Nestin) and 353 (Vimentin). The total numbers of C6<sup>Sacs−/−</sup> cells counted in 3 independent experiments were 836 (GFAP), 697 (Nestin) and 438 (Vimentin).</p>
Full article ">Figure 4
<p>Sacsin deletion increases protein levels and aggregation of glial intermediate filaments. (<b>A</b>) Representative Western blots showing the expression patterns of the glial intermediate filaments. (<b>B</b>) Densitometric analysis of Western blots from at least 3 independent experiments normalized versus GAPDH. The levels of GFAP and vimentin proteins are increased in C6<sup>Sacs−/−</sup>cells. (<b>C</b>) Filter trap assays confirmed higher aggregation of intermediate filaments in C6<sup>Sacs−/−</sup>cells. (<b>D</b>) Densitometric analysis of filter traps normalized versus the reference C6 strain. *, significant vs. C6 reference strain (<span class="html-italic">p</span> &lt; 0.05, Student’s <span class="html-italic">t</span>-test).</p>
Full article ">Figure 5
<p>Sacsin deletion impairs response to inflammatory cytokines. Reference C6 and C6<sup>Sacs−/−</sup> strains were incubated with LIF and IL-6 cytokines (200 and 30 ng/mL, respectively) for 20 min, but a strong response was only observed upon the addition of the soluble IL-6 receptor (IL-6R, 60 ng/mL) in combination with IL-6. Rate-limiting, post-translational modifications of STAT3 were used as surrogates of STAT3 activation, namely Y705 and S727 phosphorylation and K49 acetylation. (<b>A</b>) Representative Western blot images. (<b>B</b>–<b>E</b>) Densitometry analysis of bands from at least 3 independent experiments normalized to GAPDH or total STAT3. White bars, reference C6 cell strain; black bars, C6<sup>Sacs−/−</sup> cells. Data were analyzed by means of two-way ANOVA, followed by a Tukey post hoc test. * <span class="html-italic">p</span> &lt; 0.05, significant vs. IL-6+IL-6R in C6 cell strain.</p>
Full article ">
13 pages, 5545 KiB  
Article
Endogenous pH 6.0 β-Galactosidase Activity Is Linked to Neuronal Differentiation in the Olfactory Epithelium
by José Antonio de Mera-Rodríguez, Guadalupe Álvarez-Hernán, Yolanda Gañán, Ana Santos-Almeida, Gervasio Martín-Partido, Joaquín Rodríguez-León and Javier Francisco-Morcillo
Cells 2022, 11(2), 298; https://doi.org/10.3390/cells11020298 - 16 Jan 2022
Cited by 7 | Viewed by 2880
Abstract
The histochemical detection of β-galactosidase enzymatic activity at pH 6.0 (β-gal-pH6) is a widely used biomarker of cellular senescence in aging tissues. This histochemical assay also detects the presence of programmed cell senescence during specific time windows in degenerating structures of vertebrate embryos. [...] Read more.
The histochemical detection of β-galactosidase enzymatic activity at pH 6.0 (β-gal-pH6) is a widely used biomarker of cellular senescence in aging tissues. This histochemical assay also detects the presence of programmed cell senescence during specific time windows in degenerating structures of vertebrate embryos. However, it has recently been shown that this enzymatic activity is also enhanced in subpopulations of differentiating neurons in the developing central nervous system in vertebrates. The present study addressed the histochemical detection of β-gal-pH6 enzymatic activity in the developing postnatal olfactory epithelium in the mouse. This activity was detected in the intermediate layer of the olfactory epithelium. As development progressed, the band of β-gal-pH6 labeling in this layer increased in width. Immunohistochemistry and lectin histochemistry showed the β-gal-pH6 staining to be strongly correlated with the immunolabeling of the olfactory marker protein (OMP) that identifies mature olfactory sensory neurons. The cell somata of a subpopulation of differentiated olfactory neurons that were recognized with the Dolichos biflorus agglutinin (DBA) were always located inside this band of β-gal-pH6 staining. However, the β-gal-pH6 histochemical signal was always absent from the apical region where the cytokeratin-8 positive supporting cells were located. Furthermore, no β-gal-pH6 staining was found in the basal region of the olfactory epithelium where PCNA/pHisH3 immunoreactive proliferating progenitor cells, GAP43 positive immature neurons, and cytokeratin-5 positive horizontal basal cells were located. Therefore, β-gal-pH6 seems to be linked to neuronal differentiation and cannot be regarded as a biomarker of cellular senescence during olfactory epithelium development in mice. Full article
(This article belongs to the Special Issue Cell Biology: State-of-the-Art and Perspectives in Spain)
Show Figures

Figure 1

Figure 1
<p>Patterns of staining for the different antibodies and the lectin used in the present study in the P60 mouse olfactory epithelium (<b>A</b>,<b>C</b>,<b>E</b>,<b>G</b>,<b>I</b>,<b>K</b>). Negative controls (<b>B</b>,<b>D</b>,<b>F</b>,<b>H</b>,<b>L</b>) included the replacement of primary antibodies by PBS. PCNA immunoreactive nuclei were observed in the basal olfactory epithelium (arrows in (<b>A</b>)). Intense immunoreactivity against CyK5 was confined to the layer where the horizontal basal cells were located (arrows in (<b>C</b>)). Strong immunoreactivity against CyK8 was detected in the cell somata located in the apical surface of the olfactory epithelium (arrows in (<b>E</b>)). DBA-stained olfactory neurons appeared in the middle part of the olfactory epithelium (arrows in (<b>G</b>)). Mature olfactory neurons expressing OMP (arrows in (<b>I</b>)). Anti-OMP staining was also localized in nerve bundles dispersed throughout the lamina propria (asterisks). (<b>K</b>) GAP43-immunoreactive immature neurons were mainly located in the basal region of the olfactory epithelium (arrows in (<b>K</b>)) and in sparse cell somata located in the central region (arrowheads in (<b>K</b>) Scale bars: 100 µm in (<b>A</b>–<b>F</b>); 50 µm in (<b>G</b>).</p>
Full article ">Figure 2
<p>The presence of β-gal-pH6 histochemical staining in the developing olfactory epithelium of P0 (<b>A</b>), P1 (<b>B</b>), P3 (<b>C</b>), P7 (<b>D</b>), P15 (<b>E</b>), P30 (<b>F</b>), and P60 (<b>G</b>) mice. β-gal-pH6 staining was restricted to the intermediate zone of the olfactory epithelium. (<b>H</b>) Quantitative analysis of the relationship between the width of the band of β-gal-pH6 staining and the thickness of the olfactory epithelium (OEw) during postnatal mouse development. Data are expressed as mean ± SEM. Statistical significance is indicated by asterisks (** <span class="html-italic">p</span> &lt; 0.01). The width of the β-gal-pH6 staining band increased progressively with age. LP, lamina propria; OE, olfactory epithelium. Scale bars: 100 µm in (<b>A</b>–<b>F</b>); 50 µm in (<b>G</b>).</p>
Full article ">Figure 3
<p>Relationship between β-gal-pH6 histochemical staining and markers of proliferation in the olfactory epithelium of mice of different postnatal ages. Cryosections were triply labeled with β-gal-pH6 histochemistry and PCNA/pHisH3 antibodies (<b>A</b>–<b>D</b>) or doubly labeled with β-gal-pH6 histochemistry and antibodies against pHisH3 (<b>E</b>) or antibodies against PCNA (<b>F</b>). (<b>A</b>,<b>B</b>) At P0, PCNA immunoreactive nuclei (green, arrows) and pHisH3 immunolabeled mitoses (red, arrowheads) were mainly located in the basal and apical regions of the olfactory epithelium. A band of β-gal-pH6 staining was found in the epithelium region where the olfactory neurons were located. (<b>C</b>–<b>F</b>) At P30 and P60, a wide band of intense β-gal-pH6 labeling was found in the intermediate layer of the olfactory epithelium. PCNA immunoreactive nuclei (arrows) and pHisH3 immunolabeled mitoses (arrowheads) were mainly located in the basal region of the epithelium. Some PCNA-immunolabeled nuclei were found at different depths of the epithelium (<b>D</b>). LP, lamina propria; OE, olfactory epithelium. Scale bars: 100 µm in (<b>A</b>–<b>D</b>); 50 µm in (<b>E</b>,<b>F</b>).</p>
Full article ">Figure 4
<p>Relationship between β-gal-pH6 histochemical staining and markers of horizontal basal (<b>A</b>) and supporting cells (<b>B</b>–<b>E</b>) in the postnatal olfactory mouse mucosa. Cryosections of the P60 olfactory epithelium were doubly labeled with β-gal-pH6 histochemistry and antibodies against CyK5 (<b>A</b>) or CyK8 (<b>B</b>–<b>E</b>). (<b>A</b>) CyK5-immunoreactive horizontal basal cells were located in the basal surface of the olfactory epithelium (double arrowhead) in a region negative for the β-gal-pH6 staining. (<b>B</b>–<b>E</b>) CyK8 immunoreactive supporting cell bodies were always located apically to the β-gal-pH6 labeling (asterisks in (<b>B</b>,<b>C</b>); arrows in (<b>D</b>,<b>E</b>)). CyK8 immunoreactive fine processes from supporting cells were observed spanning the full extent of the epithelium (arrowheads in (<b>C</b>–<b>E</b>)). LP, lamina propria; OE, olfactory epithelium. Scale bars: 100 µm in (<b>A</b>–<b>D</b>); 15 µm in (<b>E</b>).</p>
Full article ">Figure 5
<p>Relationship between β-gal-pH6 histochemical staining and neuronal markers in the developing olfactory mucosa in mice. (<b>A</b>,<b>B</b>) In the P0 olfactory epithelium, the cell somata of DBA-positive (arrows) or OMP-immunoreactive (arrowheads) neurons were always located inside the band of β-gal-pH6 staining. (<b>C</b>) In the P7 mouse olfactory epithelium, the cell somata of DBA-positive neurons coincided spatially with the β-gal-pH6 signal (arrows). At P30 (<b>D</b>) and P60 (<b>E</b>) most of the GAP43-immunoreactive neurons were located in the basal surface of the olfactory epithelium in a region negative for the β-gal-pH6 staining (arrowheads). Still, a few of them were found inside this band of labeling (arrows). At P30 (<b>F</b>,<b>G</b>) and P60 (<b>H</b>,<b>I</b>), the cell somata of DBA-positive (arrows) and OMP-positive (arrowheads) neurons were mainly found inside the band of β-gal-pH6 staining. Intesnse OMP-immunoreaction was detected in the apical surface of the epithelium (asterisks in (<b>G</b>)). LP, lamina propria; OE, olfactory epithelium. Scale bars: 100 µm.</p>
Full article ">
18 pages, 4535 KiB  
Article
Changes in the Mitochondria-Related Nuclear Gene Expression Profile during Human Oocyte Maturation by the IVM Technique
by Zhi-Yong Yang, Min Ye, Ya-Xin Xing, Qi-Gui Xie, Jian-Hong Zhou, Xin-Rui Qi, Kehkooi Kee and Ri-Cheng Chian
Cells 2022, 11(2), 297; https://doi.org/10.3390/cells11020297 - 16 Jan 2022
Cited by 7 | Viewed by 2908
Abstract
To address which mitochondria-related nuclear differentially expressed genes (DEGs) and related pathways are altered during human oocyte maturation, single-cell analysis was performed in three oocyte states: in vivo matured (M-IVO), in vitro matured (M-IVT), and failed to mature in vitro (IM-IVT). There were [...] Read more.
To address which mitochondria-related nuclear differentially expressed genes (DEGs) and related pathways are altered during human oocyte maturation, single-cell analysis was performed in three oocyte states: in vivo matured (M-IVO), in vitro matured (M-IVT), and failed to mature in vitro (IM-IVT). There were 691 DEGs and 16 mitochondria-related DEGs in the comparison of M-IVT vs. IM-IVT oocytes, and 2281 DEGs and 160 mitochondria-related DEGs in the comparison of M-IVT vs. M-IVO oocytes, respectively. The GO and KEGG analyses showed that most of them were involved in pathways such as oxidative phosphorylation, pyruvate metabolism, peroxisome, and amino acid metabolism, i.e., valine, leucine, isoleucine, glycine, serine, and threonine metabolism or degradation. During the progress of oocyte maturation, the metabolic pathway, which derives the main source of ATP, shifted from glucose metabolism to pyruvate and fatty acid oxidation in order to maintain a low level of damaging reactive oxygen species (ROS) production. Although the immature oocytes could be cultured to a mature stage by an in vitro technique (IVM), there were still some differences in mitochondria-related regulations, which showed that the mitochondria were regulated by nuclear genes to compensate for their developmental needs. Meanwhile, the results indicated that the current IVM culture medium should be optimized to compensate for the special need for further development according to this disclosure, as it was a latent strategy to improve the effectiveness of the IVM procedure. Full article
(This article belongs to the Special Issue Molecular Mechanism of Oocyte Maturation)
Show Figures

Figure 1

Figure 1
<p>Schematic representation of the experimental procedures and group treatments.</p>
Full article ">Figure 2
<p>Different scale of DEGs. Volcano plot of differentially regulated genes in oocytes between M-IVT and IM-IVT (<b>A</b>), between M-IVT and M-IVO (<b>B</b>). Each point in the figures represents a gene. The <span class="html-italic">X</span>-axis shows log<sub>2</sub> (Fold changes) and the <span class="html-italic">Y</span>-axis shows −log<sub>10</sub> (<span class="html-italic">p</span>-value). The vertical lines show thresholds for log<sub>2</sub> ratio larger than 1 or lower than −1. The horizontal line shows threshold for <span class="html-italic">p</span>-value &lt;  0.05. The gray points represent gene exhibiting no significant differential expression between IM-IVT and M-IVO or between M-IVT and IM-IVT; the red points represent genes that are upregulated and the blue points represent genes that are downregulated; the green points represent genes that are related to mitochondrion. Gene ontology (GO) categories enrichment analysis of differentially expressed genes in oocytes between M-IVT and IM-IVT (<b>C</b>), between M-IVT and M-IVO (<b>D</b>). (<b>E</b>) Venn diagrams showing the number of DEGs which were overlapped in the three comparisons. 67 (28 + 39) overlapped DEGs were present in the DEGs of M-IVT vs. M-IVO comparison and M-IVT vs. IM-IVT comparison. 1356 (1317 + 39) overlapped DEGs were present in the DEGs of M-IVT vs. M-IVO comparison and M-IVTvs. I M-IVO comparison. 507 (468 + 39) overlapped DEGs were present in the DEGs of M-IVT vs. IM-IVT comparison and IM-IVT vs. M-IVO comparison. 897 DEGs were only present in M-IVT vs. M-IVO comparison. 156 DEGs were only present in M-IVT vs. IM-IVT comparison. 1427 DEGs were only present in IM-IVT vs. M-IVO comparison. 39 overlapped DEGs were present in the DEGs of the three comparisons (M-IVT vs. M-IVO comparison, M-IVT vs. IM-IVT comparison, and IM-IVT vs. M-IVO comparison).</p>
Full article ">Figure 2 Cont.
<p>Different scale of DEGs. Volcano plot of differentially regulated genes in oocytes between M-IVT and IM-IVT (<b>A</b>), between M-IVT and M-IVO (<b>B</b>). Each point in the figures represents a gene. The <span class="html-italic">X</span>-axis shows log<sub>2</sub> (Fold changes) and the <span class="html-italic">Y</span>-axis shows −log<sub>10</sub> (<span class="html-italic">p</span>-value). The vertical lines show thresholds for log<sub>2</sub> ratio larger than 1 or lower than −1. The horizontal line shows threshold for <span class="html-italic">p</span>-value &lt;  0.05. The gray points represent gene exhibiting no significant differential expression between IM-IVT and M-IVO or between M-IVT and IM-IVT; the red points represent genes that are upregulated and the blue points represent genes that are downregulated; the green points represent genes that are related to mitochondrion. Gene ontology (GO) categories enrichment analysis of differentially expressed genes in oocytes between M-IVT and IM-IVT (<b>C</b>), between M-IVT and M-IVO (<b>D</b>). (<b>E</b>) Venn diagrams showing the number of DEGs which were overlapped in the three comparisons. 67 (28 + 39) overlapped DEGs were present in the DEGs of M-IVT vs. M-IVO comparison and M-IVT vs. IM-IVT comparison. 1356 (1317 + 39) overlapped DEGs were present in the DEGs of M-IVT vs. M-IVO comparison and M-IVTvs. I M-IVO comparison. 507 (468 + 39) overlapped DEGs were present in the DEGs of M-IVT vs. IM-IVT comparison and IM-IVT vs. M-IVO comparison. 897 DEGs were only present in M-IVT vs. M-IVO comparison. 156 DEGs were only present in M-IVT vs. IM-IVT comparison. 1427 DEGs were only present in IM-IVT vs. M-IVO comparison. 39 overlapped DEGs were present in the DEGs of the three comparisons (M-IVT vs. M-IVO comparison, M-IVT vs. IM-IVT comparison, and IM-IVT vs. M-IVO comparison).</p>
Full article ">Figure 3
<p>The alterations of mitochondria-related genes in the comparison between M-IVT group and IM-IVT group. (<b>A</b>) Hierarchical clustering of differentially expressed genes (DEGs) in oocytes between M-IVT and IM-IVT based on Z-score normalized FPKM values. Each column represents a sample, and each row represents a gene. Blue indicates lower expression and red indicates higher expression. (<b>B</b>) Top significant DEGs in oocytes between M-IVT and IM-IVT. (<b>C</b>) GO classification of DEGs in oocytes between M-IVT and IM-IVT. <span class="html-italic">X</span>-axis represents the GO terms. <span class="html-italic">Y</span>-axis represents the number of genes. (<b>D</b>) Kyoto Encyclopedia of Genes and Genome analysis of DEGs in oocytes between M-IVT and IM-IVT. <span class="html-italic">X</span>-axis represents the counts. <span class="html-italic">Y</span>-axis shows the name of the statistical pathway enrichment. Abbreviation: ABCD1, ATP binding cassette subfamily D member 1; ABC transporters: ATP-binding cassette (ABC) transporters; ACSM3, acyl-CoA synthetase medium chain family member 3; ADCK2, aarF domain containing kinase 2; ATP5F1C, ATP synthase F1 subunit gamma; DCXR, dicarbonyl and L-xylulose reductase; GPAT2, glycerol-3-phosphate acyltransferase 2, mitochondrial; HAGH, hydroxyacylglutathione hydrolase; LDHD, lactate dehydrogenase D; MRPL53, mitochondrial ribosomal protein L53; MSRB3, methionine sulfoxide reductase B3; NDUFA13, NADH:ubiquinone oxidoreductase subunit A13; NDUFB10, NADH:ubiquinone oxidoreductase subunit B10; NTHL1, nth like DNA glycosylase 1; POLG, DNA polymerase gamma, catalytic subunit; SLC25A43, solute carrier family 25 member 43; UQCR10, ubiquinol-cytochrome c reductase, complex III subunit X.</p>
Full article ">Figure 3 Cont.
<p>The alterations of mitochondria-related genes in the comparison between M-IVT group and IM-IVT group. (<b>A</b>) Hierarchical clustering of differentially expressed genes (DEGs) in oocytes between M-IVT and IM-IVT based on Z-score normalized FPKM values. Each column represents a sample, and each row represents a gene. Blue indicates lower expression and red indicates higher expression. (<b>B</b>) Top significant DEGs in oocytes between M-IVT and IM-IVT. (<b>C</b>) GO classification of DEGs in oocytes between M-IVT and IM-IVT. <span class="html-italic">X</span>-axis represents the GO terms. <span class="html-italic">Y</span>-axis represents the number of genes. (<b>D</b>) Kyoto Encyclopedia of Genes and Genome analysis of DEGs in oocytes between M-IVT and IM-IVT. <span class="html-italic">X</span>-axis represents the counts. <span class="html-italic">Y</span>-axis shows the name of the statistical pathway enrichment. Abbreviation: ABCD1, ATP binding cassette subfamily D member 1; ABC transporters: ATP-binding cassette (ABC) transporters; ACSM3, acyl-CoA synthetase medium chain family member 3; ADCK2, aarF domain containing kinase 2; ATP5F1C, ATP synthase F1 subunit gamma; DCXR, dicarbonyl and L-xylulose reductase; GPAT2, glycerol-3-phosphate acyltransferase 2, mitochondrial; HAGH, hydroxyacylglutathione hydrolase; LDHD, lactate dehydrogenase D; MRPL53, mitochondrial ribosomal protein L53; MSRB3, methionine sulfoxide reductase B3; NDUFA13, NADH:ubiquinone oxidoreductase subunit A13; NDUFB10, NADH:ubiquinone oxidoreductase subunit B10; NTHL1, nth like DNA glycosylase 1; POLG, DNA polymerase gamma, catalytic subunit; SLC25A43, solute carrier family 25 member 43; UQCR10, ubiquinol-cytochrome c reductase, complex III subunit X.</p>
Full article ">Figure 4
<p>The alterations of mitochondria-related genes in the comparison between M-IVT group and M-IVO group. (<b>A</b>) Hierarchical clustering of differentially expressed genes (DEGs) in oocytes between M-IVT and M-IVO based on Z-score normalized FPKM values. Each column represents a sample, and each row represents a gene. Blue indicates lower expression and red indicates higher expression. (<b>B</b>) Top significant DEGs in oocytes between M-IVT and M-IVO. (<b>C</b>) GO classification of DEGs in oocytes between M-IVT and M-IVO. <span class="html-italic">X</span>-axis represents the GO terms. <span class="html-italic">Y</span>-axis represents the number of genes. (<b>D</b>) Kyoto Encyclopedia of Genes and Genome analysis of DEGs in oocytes between M-IVT and M-IVO. <span class="html-italic">X</span>-axis represents the counts. <span class="html-italic">Y</span>-axis shows the name of the statistical pathway enrichment. Abbreviation: AMT, aminomethyltransferase; BOLA1, bolA family member 1; CASP3, caspase 3; CYP11A1, cytochrome P450 family 11 subfamily A member 1; DHODH, dihydroorotate dehydrogenase (quinone); DNAJC28, DnaJ heat shock protein family (Hsp40) member C28; EXOG, exo/endonuclease G; FKBP10, FKBP prolyl isomerase 10; GATM, glycine amidinotransferase; LIPT2, lipoyl(octanoyl) transferase 2; MRPL27, mitochondrial ribosomal protein L27; MRPL28, mitochondrial ribosomal protein L28; PDF, peptide deformylase, mitochondrial; PNPO, pyridoxamine 5’-phosphate oxidase; PTGES2, prostaglandin E synthase 2; SELENOO, selenoprotein O; SIRT4, sirtuin 4; SLC25A15, solute carrier family 25 member 15; STAR, steroidogenic acute regulatory protein; TIMM8B, translocase of inner mitochondrial membrane 8 homolog B.</p>
Full article ">Figure 4 Cont.
<p>The alterations of mitochondria-related genes in the comparison between M-IVT group and M-IVO group. (<b>A</b>) Hierarchical clustering of differentially expressed genes (DEGs) in oocytes between M-IVT and M-IVO based on Z-score normalized FPKM values. Each column represents a sample, and each row represents a gene. Blue indicates lower expression and red indicates higher expression. (<b>B</b>) Top significant DEGs in oocytes between M-IVT and M-IVO. (<b>C</b>) GO classification of DEGs in oocytes between M-IVT and M-IVO. <span class="html-italic">X</span>-axis represents the GO terms. <span class="html-italic">Y</span>-axis represents the number of genes. (<b>D</b>) Kyoto Encyclopedia of Genes and Genome analysis of DEGs in oocytes between M-IVT and M-IVO. <span class="html-italic">X</span>-axis represents the counts. <span class="html-italic">Y</span>-axis shows the name of the statistical pathway enrichment. Abbreviation: AMT, aminomethyltransferase; BOLA1, bolA family member 1; CASP3, caspase 3; CYP11A1, cytochrome P450 family 11 subfamily A member 1; DHODH, dihydroorotate dehydrogenase (quinone); DNAJC28, DnaJ heat shock protein family (Hsp40) member C28; EXOG, exo/endonuclease G; FKBP10, FKBP prolyl isomerase 10; GATM, glycine amidinotransferase; LIPT2, lipoyl(octanoyl) transferase 2; MRPL27, mitochondrial ribosomal protein L27; MRPL28, mitochondrial ribosomal protein L28; PDF, peptide deformylase, mitochondrial; PNPO, pyridoxamine 5’-phosphate oxidase; PTGES2, prostaglandin E synthase 2; SELENOO, selenoprotein O; SIRT4, sirtuin 4; SLC25A15, solute carrier family 25 member 15; STAR, steroidogenic acute regulatory protein; TIMM8B, translocase of inner mitochondrial membrane 8 homolog B.</p>
Full article ">Figure 5
<p>The common altered mitochondria-related genes in the comparisons. (<b>A</b>) Venn diagrams showing the number of mitochondria-related genes, which were overlapped within the three comparisons. 2 overlapped mitochondria-related DEGs were present in the DEGs of the three comparisons (M-IVO vs. M-IVT comparison, M-IVT vs. IM-IVT comparison, and M-IVO vs. IM-IVT comparison). 6 overlapped mitochondria-related DEGs were present in the DEGs of M-IVO vs. M-IVT comparison and M-IVT vs. IM-IVT comparison. 85 overlapped mitochondria-related DEGs were present in the DEGs of M-IVT vs. M-IVO comparison and M-IVO vs. IM-IVT comparison. 7 overlapped mitochondria-related DEGs were present in the DEGs of M-IVT vs. IM-IVT comparison and M-IVO vs. IM-IVT comparison. 71 mitochondria-related DEGs were only present in M-IVO vs. M-IVT comparison. 5 mitochondria-related DEGs were only present in M-IVT vs. IM-IVT comparison. 66 mitochondria-related DEGs were only present in M-IVO vs. IM-IVT comparison. The gene transcript expression level in oocytes from IM-IVT group, M-IVT group and M-IVO group for ABCD1 (<b>B</b>) and HAGH (<b>D</b>). Browser view of RNA-seq signals on the gene ABCD1 (<b>C</b>) and HAGH (<b>E</b>) in IM-IVT, M-IVT and M-IVO group. The scale of normalized reads is shown for the RNA-seq data. *** <span class="html-italic">p</span> &lt; 0.001, ** <span class="html-italic">p</span> &lt; 0.01 and * <span class="html-italic">p</span> &lt; 0.05 by Wilcoxon test (B and D). Abbreviation: ABCD1, ATP binding cassette subfamily D member 1; HAGH, hydroxyacylglutathione hydrolase.</p>
Full article ">Figure 6
<p>Increased mRNA expression level of PHB, GPX4, and PNPO were correlated with the methylation level of their promoter region. The gene transcript expression level of PHB (<b>A</b>), GPX4 (<b>D</b>), and PNPO (<b>G</b>) in oocytes from IM-IVT group, M-IVT group and M-IVO group. Browser view of RNA-seq and bisulfite-seq signals on the gene PHB (<b>B</b>), GPX4 (<b>E</b>), and PNPO (<b>H</b>) in the IM-IVT and M-IVO. The scale of normalized reads is shown for the RNA-seq data. The scale of DNA methylation ratio is shown for the bisulfite-seq data. For PHB (<b>C</b>), GPX4 (<b>F</b>), and PNPO (<b>I</b>), DNA methylation levels is plotted on the <span class="html-italic">X</span>-axis, while gene expression level (FPKM) is plotted on the <span class="html-italic">Y</span>-axis. ** <span class="html-italic">p</span> &lt; 0.01 and * <span class="html-italic">p</span> &lt; 0.05 by Wilcoxon test (<b>A</b>,<b>D</b>,<b>G</b>). Abbreviation: GPX4, glutathione peroxidase 4; PHB, prohibitin; PNPO, pyridoxamine 5’-phosphate oxidase.</p>
Full article ">
6 pages, 788 KiB  
Commentary
Developing Digital Photomicroscopy
by Kingsley Micklem
Cells 2022, 11(2), 296; https://doi.org/10.3390/cells11020296 - 16 Jan 2022
Viewed by 1598
Abstract
(1) The need for efficient ways of recording and presenting multicolour immunohistochemistry images in a pioneering laboratory developing new techniques motivated a move away from photography to electronic and ultimately digital photomicroscopy. (2) Initially broadcast quality analogue cameras were used in the absence [...] Read more.
(1) The need for efficient ways of recording and presenting multicolour immunohistochemistry images in a pioneering laboratory developing new techniques motivated a move away from photography to electronic and ultimately digital photomicroscopy. (2) Initially broadcast quality analogue cameras were used in the absence of practical digital cameras. This allowed the development of digital image processing, storage and presentation. (3) As early adopters of digital cameras, their advantages and limitations were recognised in implementation. (4) The adoption of immunofluorescence for multiprobe detection prompted further developments, particularly a critical approach to probe colocalization. (5) Subsequently, whole-slide scanning was implemented, greatly enhancing histology for diagnosis, research and teaching. Full article
Show Figures

Figure 1

Figure 1
<p>The interpretation of colocalization images. (<b>a</b>): Superimposition of immunofluorescence signal does not imply interaction. Stimulation of a stem cell reveals the independent segregation of membrane antigens. (<b>a1</b>): Unstimulated stem cell showing strong overlap of red and green signals, which may imply association of antigens. (<b>a2</b>): Following stimulation, antigens migrate to opposite poles of the cell, demonstrating they are not associated. (<b>b</b>): High-resolution imaging may not produce an overlapped yellow signal even though they are present on the same subcellular organelle. (<b>b1</b>): Mitochondria stained with an organelle-specific marker. (<b>b2</b>): A new putative candidate antigen for mitochondrial localisation. (<b>b3</b>): Combined image showing little yellow signal as the mitochondrial marker is spatially separate from the green-labelled mitochondrial antigen.</p>
Full article ">Figure 2
<p>An example of multiprobe imaging.</p>
Full article ">
16 pages, 5218 KiB  
Article
Long-Term High-Fat Diet Consumption Depletes Glial Cells and Tyrosine Hydroxylase–Containing Neurons in the Brain of Middle-Aged Rats
by Mei-Chuan Chou, Hsiang-Chun Lee, Yen-Chin Liu, Patrick Szu-Ying Yen, Ching-Kuan Liu, Chu-Huang Chen, Tzu-Han Hsieh and Shiou-Lan Chen
Cells 2022, 11(2), 295; https://doi.org/10.3390/cells11020295 - 15 Jan 2022
Cited by 7 | Viewed by 3092
Abstract
Epidemiologic studies have indicated that dyslipidemia may facilitate the progression of neuronal degeneration. However, the effects of chronic dyslipidemia on brain function, especially in older individuals, remain unclear. In this study, middle-aged 37-week-old male Wistar-Kyoto rats were fed a normal diet (ND) or [...] Read more.
Epidemiologic studies have indicated that dyslipidemia may facilitate the progression of neuronal degeneration. However, the effects of chronic dyslipidemia on brain function, especially in older individuals, remain unclear. In this study, middle-aged 37-week-old male Wistar-Kyoto rats were fed a normal diet (ND) or a 45% high-fat diet (HFD) for 30 weeks (i.e., until 67 weeks of age). To study the effects of chronic dyslipidemia on the brain, we analyzed spontaneous locomotor activity, cognitive function, and brain tissues in both groups of rats after 30 weeks. Compared with age-matched rats fed a ND, Wistar-Kyoto rats fed a HFD had dyslipidemia and showed decreased movement but normal recognition of a novel object. In our brain analyses, we observed a significant decrease in astrocytes and tyrosine hydroxylase–containing neurons in the substantia nigra and locus coeruleus of rats fed a HFD compared with rats fed a ND. However, hippocampal pyramidal neurons were not affected. Our findings indicate that the long-term consumption of a HFD may cause lipid metabolism overload in the brain and damage to glial cells. The decrease in astrocytes may lead to reduced protection of the brain and affect the survival of tyrosine hydroxylase–containing neurons but not pyramidal neurons of the hippocampus. Full article
Show Figures

Figure 1

Figure 1
<p>Laboratory data for middle-aged rats fed a normal diet (ND; control, n = 8) or a 45% high-fat diet (HFD; n = 8) for 30 weeks. Bar graphs show the mean (±SEM) values at the end of 30 weeks for (<b>a</b>) body weight, (<b>b</b>) blood glucose level, and blood lipid levels including (<b>c</b>) total cholesterol, (<b>d</b>) triglycerides, (<b>e</b>) low-density lipoprotein (LDL), and (<b>f</b>) high-density lipoprotein (HDL). * <span class="html-italic">p</span> &lt; 0.05, ** <span class="html-italic">p</span> &lt; 0.01, *** <span class="html-italic">p</span> &lt; 0.001 vs ND group (<span class="html-italic">t</span>-test).</p>
Full article ">Figure 2
<p>The spontaneous locomotor activity of middle-aged rats evaluated by using the open field test after rats were fed a normal diet (ND, control, n = 8) or 45% high-fat diet (HFD, n = 8) for 30 weeks. Data in a-e show the (<b>a</b>) travel tracks, (<b>b</b>) total travel distance (cm), (<b>c</b>) maximal travel speed (cm/min), (<b>d</b>) fast-moving time (s, speed &gt; 15 cm/s), and (<b>e</b>) slow-moving time (s, speed &lt; 2.5 cm/s). Behavior was analyzed by using a camera and an authorized image-tracking software (Panlab Smart video-tracking software). For (<b>b</b>–<b>e</b>), data are expressed as the mean ± SEM. * <span class="html-italic">p</span> &lt; 0.05 vs ND group (<span class="html-italic">t</span>-test).</p>
Full article ">Figure 3
<p>Cognitive function of middle-aged rats evaluated by using the novel object recognition test after rats were fed a normal diet (ND, control, n=8) or 45% high-fat diet (HFD, n = 8) for 30 weeks. (<b>a</b>) A schematic of the novel object recognition test is shown. Data in (<b>b</b>–<b>d</b>) show the (<b>b</b>) travel tracks, (<b>c</b>) total travel distance (cm), and (<b>d</b>) percentage (%) of travel distance in a familiar (zone 1) and novel object (zone 2) zone after 30 weeks. Behavior was analyzed by using a camera and an authorized image-tracking software (Panlab Smart video-tracking software). Data in (<b>c</b>,<b>d</b>) are expressed as the mean ± SEM. ** <span class="html-italic">p</span> &lt; 0.01 between familiar and novel object zones within the same group (<span class="html-italic">t</span>-test).</p>
Full article ">Figure 4
<p>Immunostaining of dopaminergic neurons (tyrosine hydroxylase [TH]-positive cells) in the substantia nigra pars compacta (SNc) after middle-aged rats were fed a normal diet (ND, control, n = 8) or 45% high-fat diet (HFD, n = 8) for 30 weeks. Data were captured by using 4X (scale bar = 200 μm) and 10X (scale bar = 100 μm) objectives. Immunostaining for TH in neurons in the (<b>a</b>) rostral part of the SNc and (<b>b</b>) caudal part of the SNc. TUNEL staining (brown) for cell apoptosis and hematoxylin staining (blue) for cell nuclei in the (<b>c</b>) SNc and SNr. The arrow indicates the loss of nuclei. The quantification of TH-positive cells in the rostral and caudal parts of the SNc (4X objective) is shown. The TH-positive cells were quantified by using cellSens Dimension software (Olympus). Data are expressed as the mean ± SEM. *** <span class="html-italic">p</span> &lt; 0.001 between groups (<span class="html-italic">t</span>-test).</p>
Full article ">Figure 5
<p>Immunostaining of astrocytes (GFAP-positive cells) in the substantia nigra pars reticularis (SNr) after middle-aged rats were fed a normal diet (ND, control, n = 8) or 45% high-fat diet (HFD, n = 8) for 30 weeks. Data were captured with 4X (scale bar = 200 μm), 10X (scale bar = 100 μm), and 20X (scale bar = 50 μm) objectives. Immunostaining for GFAP in neurons in the (<b>a</b>) rostral part of the SNr and (<b>b</b>) caudal part of the SNr. As shown on the right, the GFAP immuno-intensity (%) and GFAP-positive cells per unit of area (20X objective) were quantified by using cellSens Dimension software (Olympus). Data are expressed as the mean ± SEM. ** <span class="html-italic">p</span> &lt; 0.01, *** <span class="html-italic">p</span> &lt; 0.001 between groups (<span class="html-italic">t</span>-test).</p>
Full article ">Figure 6
<p>Immunostaining of astrocytes (GFAP-positive cells) and norepinephrine neurons (tyrosine hydroxylase [TH]-positive cells) in the locus coeruleus (LC) after middle-aged rats were fed a normal diet (ND, control) or 45% high-fat diet (HFD) for 30 weeks. Data were captured with 4X (scale bar = 200 μm) and 10X (scale bar = 100 μm) objectives. Immunostaining for TH-positive cells (norepinephrine neurons) and GFAP-positive cells (astrocytes) in the (<b>a</b>) rostral part of the LC and the (<b>b</b>) caudal part of the LC. As shown on the right, the GFAP immuno-intensity (%) and TH-positive cells per unit of area (10X objective, n = 4) were quantified by using cellSens Dimension software (Olympus). Data are expressed as the mean ± SEM. ** <span class="html-italic">p</span> &lt; 0.01, *** <span class="html-italic">p</span> &lt; 0.001 between groups (<span class="html-italic">t</span>-test).</p>
Full article ">Figure 7
<p>Immunostaining of pyramidal neurons (NeuN-positive cells) and astrocytes (GFAP-positive cells) in the hippocampus after middle-aged rats were fed a normal diet (ND; control, n = 4) or 45% high-fat diet (HFD; n = 4) for 30 weeks. Data were captured with 10X (scale bar = 100 μm) and 20X (scale bar = 50 μm) objectives. Immunostaining for NeuN (pyramidal neurons) and GFAP (astrocytes) in the (<b>a</b>) hippocampus dentate gyrus (DG) and (<b>b</b>) CA3. NeuN or GFAP immuno-intensity (%) and NeuN- or GFAP-positive cells per unit of area (20X objective) were quantified by using cellSens Dimension software (Olympus). Data are expressed as the mean ± SEM. ** <span class="html-italic">p</span> &lt; 0.01, *** <span class="html-italic">p</span> &lt; 0.001 between groups (<span class="html-italic">t</span>-test).</p>
Full article ">Figure 8
<p>Western blot analysis of GFAP (astrocytes), TH (DA neurons), and NeuN (pyramidal neurons) in the hippocampus and midbrain of middle-aged rats after rats were fed a normal diet (ND, n = 3) or 45% high-fat diet (HFD, n = 5) for 30 weeks. Immunoblotting of the (<b>a</b>) hippocampus and midbrain of rats from the ND or HFD group. As shown in (<b>b</b>), the GFAP%, TH%, and NeuN% were quantified in the hippocampus and midbrain. Data are presented as the mean ± SEM. * <span class="html-italic">p</span> &lt; 0.05, ** <span class="html-italic">p</span> &lt; 0.01 vs ND rats (<span class="html-italic">t</span>-test).</p>
Full article ">Figure 9
<p>Immunostaining of microglial cells (IbA1-positive cells) in the substantia nigra pars reticularis (SNr) after rats were fed a normal diet (ND, control, n = 5) or 45% high-fat diet (HFD, n = 5) for 30 weeks. Data were captured with 10X (scale bar = 100 μm) and 20X (scale bar = 50 μm) objectives. Immunostaining for IbA1 (microglial cells) in the (<b>a</b>) rostral part of the SNr and (<b>b</b>) caudal part of the SNr. IbA1 immuno-intensity (%) and IbA1-positive cells per unit of area (20X objective) were quantified by using cellSens Dimension software (Olympus). Data are expressed as the mean ± SEM. * <span class="html-italic">p</span> &lt; 0.05, ** <span class="html-italic">p</span> &lt; 0.01 vs ND rats (<span class="html-italic">t-</span>test).</p>
Full article ">Figure 10
<p>Immunostaining of microglial cells (IbA1-positive cells) in the hippocampus dentate gyrus (DG) and CA3 after rat were fed a normal diet (ND, control, n = 5) or 45% high-fat diet (HFD, n = 5) for 30 weeks. Data were captured with 10X (scale bar = 100 μm) and 20X (scale bar = 50 μm) objectives. Immunostaining of IbA1 (microglial cells) in the hippocampus (<b>a</b>) and DG (<b>b</b>). IbA1 immuno-intensity (%) and IbA1-positive cells per unit of area (10X objective) were quantified by using cellSens Dimension software (Olympus). Data are expressed as the mean ± SEM.</p>
Full article ">
15 pages, 1875 KiB  
Article
The Longevity-Associated Variant of BPIFB4 Reduces Senescence in Glioma Cells and in Patients’ Lymphocytes Favoring Chemotherapy Efficacy
by Annibale Alessandro Puca, Valentina Lopardo, Francesco Montella, Paola Di Pietro, Daniela Cesselli, Irene Giulia Rolle, Michela Bulfoni, Veronica Di Sarno, Giorgio Iaconetta, Pietro Campiglia, Carmine Vecchione, Antonio Paolo Beltrami and Elena Ciaglia
Cells 2022, 11(2), 294; https://doi.org/10.3390/cells11020294 - 15 Jan 2022
Cited by 7 | Viewed by 3370
Abstract
Glioblastoma (GBM) is the most common primary brain cancer with the median age at diagnosis around 64 years, thus pointing to aging as an important risk factor. Indeed, aging, by increasing the senescence burden, is configured as a negative prognostic factor for GBM [...] Read more.
Glioblastoma (GBM) is the most common primary brain cancer with the median age at diagnosis around 64 years, thus pointing to aging as an important risk factor. Indeed, aging, by increasing the senescence burden, is configured as a negative prognostic factor for GBM stage. Furthermore, several anti-GBM therapies exist, such as temozolomide (TMZ) and etoposide (ETP), that unfortunately trigger senescence and the secretion of proinflammatory senescence-associated secretory phenotype (SASP) factors that are responsible for the improper burst of (i) tumorigenesis, (ii) cancer metastasis, (iii) immunosuppression, and (iv) tissue dysfunction. Thus, adjuvant therapies that limit senescence are urgently needed. The longevity-associated variant (LAV) of the bactericidal/permeability-increasing fold-containing family B member 4 (BPIFB4) gene previously demonstrated a modulatory activity in restoring age-related immune dysfunction and in balancing the low-grade inflammatory status of elderly people. Based on the above findings, we tested LAV-BPIFB4 senotherapeutic effects on senescent glioblastoma U87-MG cells and on T cells from GBM patients. We interrogated SA-β-gal and HLA-E senescence markers, SASP factors, and proliferation and apoptosis assays. The results highlighted a LAV-BPIFB4 remodeling of the senescent phenotype of GBM cells, enhancement of their sensitivity to temozolomide and a selective reduction of the T cells’ senescence from GBM patients. Overall, these findings candidate LAV-BPIFB4 as an adjuvant therapy for GBM. Full article
(This article belongs to the Special Issue Molecular-Cellular Basis of Ageing and Cancer)
Show Figures

Figure 1

Figure 1
<p>Senescence analysis in the U87-MG glioblastoma cell line. Cytofluorometric analysis of Spider-β galactosidase (spider-βGal), common senescence marker, in the U87-MG glioma cell line after 24 h of treatment with etoposide (6 μM) and 5 days resting in the presence or absence of 18 ng/mL of rhLAV-BPIFB4 for the last 48 h. The treatment with etoposide induced senescence as shown in (<b>A</b>) (middle graph); after the treatment with 18 ng/mL of rhLAV-BPIFB4 the spider-βGal values decreased (right graph in (<b>A</b>)). (<b>B</b>) Bar graph reporting the mean percentage values ± SD of β galactosidase viable cells from 3 independent experiments. (<b>C</b>) Cytofluorimetric analysis of the HLA-E expression on U87-MG cells’ surfaces in the control and in ETP-treated cells with or without rhLAV-BPIFB4 for the 5 days resting as indicated in <a href="#sec2-cells-11-00294" class="html-sec">Section 2</a>. The bar graphs report the mean ± SD of the percentage of positive cells in the different conditions. Statistical analysis by two-way ANOVA with Tukey’s test for multiple comparison was conducted. (** <span class="html-italic">p</span> &lt; 0.001, *** <span class="html-italic">p</span> &lt; 0.0001, **** <span class="html-italic">p</span> &lt; 0.00001).</p>
Full article ">Figure 2
<p>Cytokine analysis of Senescent U87-MG glioblastoma cell line. Secretory profile of U87-MG glioma cell line after 24 h treatment with etoposide (6 μM) and 5 days resting in the presence or absence of 18 ng/mL of rhLAV-BPIFB4 for the last 48 h as detected by multiplex ELISA of the cell medium. The etoposide induced the secretion of some SASP factors: IL-1β, MCP1, IL-6, and IL-8; the 48 h treatment with rhLAV-BPIFB4 modulated this secretory phenotype. Statistical analysis by two-way ANOVA with Tukey’s test for multiple comparison was conducted. (**** <span class="html-italic">p</span> &lt; 0.0001).</p>
Full article ">Figure 3
<p>Drug sensibilization in senescent U87-MG glioblastoma cell line. (<b>A</b>) Representative FACS dot plots showing the percentages of multidrug resistance protein (MDR)-positive U87-MG cells in different conditions as indicated. After inducing senescence with etoposide, the percentage of MDR-positive cells rose to 6.36%, and the 48 h treatment with rhLAV-BPIFB4 reduced this value to 0.72%. (<b>B</b>) Bar graph reporting the mean percentage values ± SD of MDR+ viable cells from 3 independent experiments. (<b>C</b>) Cytofluorometric analysis of Spider-β galactosidase in the U87-MG glioma cell line after 24 h treatment with TMZ (100 μM) and 5 days resting in the absence or presence with rhLAV-BPIFB4 for the last 48 h. The right panel reports the Western blot analysis of p16 and p21 senescence-related proteins in the same experimental condition. β-Actin was used as a control for quantitation of the sample protein. (<b>D</b>) BrdU proliferation assay on the U87-MG cell line after treatment with temozolomide (96 h, 100 μM). The LAV-BPIFB4 co-treatment induced a higher sensibilization to the drug in a dose–response manner. (<b>E</b>) Cytofluorimetric analysis of the HLA-E expression. The panel on left side shows a representative, of three independent experiments, histogram profile of HLA-E staining on U87-MG cells’ surface in the control and TMZ-treated cells with or without rhLAV-BPIFB4 for the last 48 h of the 5 days resting. (<b>F</b>) The right panel is a bar graph of percentage positive cells. The results are representative of 3 independent experiments expressed as the mean ± SD. (<b>G</b>,<b>H</b>) Induction of apoptosis measured by Annexin V and propidium iodide (PI) double-staining through flow cytometry in the U87-MG glioma cell line after 24 h of treatment with TMZ (100 μM) and 5 days resting in the absence or presence of rhLAV-BPIFB4 for the last 48 h. The left panel is a representative density plot of cytofluorometric analysis. Histograms on the right indicate total percentage of early (Annexin V-positive cells/PI-negative cells) and late apoptotic events (Annexin V/PI-double positive cells) as well as necrotic cells (Annexin V-negative cells/PI-positive cells). The results are representative of 3 independent experiments performed in duplicate and expressed as mean ± SD. Statistical analysis by two-way ANOVA with Tukey’s test for multiple comparison was conducted (* <span class="html-italic">p</span> &lt; 0.01, ** <span class="html-italic">p</span> &lt;0.001, *** <span class="html-italic">p</span> &lt;0.0001, **** <span class="html-italic">p</span> &lt; 0.00001).</p>
Full article ">Figure 4
<p>Immune senescence profile of PBMCs from GBM patients. (<b>A</b>) Results of the FACS analysis of Spider-β galactosidase in CD3+ T cells and CD3-CD56+ NK cells compartment among total PBMCs from GBM patients (<span class="html-italic">low</span> and <span class="html-italic">high</span> grade) and healthy control, for comparison. (<b>B</b>) Analysis of the effects of 48 h LAV-BPIFB4 treatment (18 ng/mL) on the percentage of Spider-βGal+ CD3+ T cells among total PBMCs from healthy donors, <span class="html-italic">high-</span> and <span class="html-italic">low-</span>grade GBM patients. <span class="html-italic">High-</span>grade GBM patients had more senescent CD3+ T cells then healthy or <span class="html-italic">low</span>-grade patients. The treatment with rhLAV-BPIFB4 could restore the profile of peripheral immune cells. Statistical analysis by two-way ANOVA with Tukey’s test for multiple comparison was conducted. (* <span class="html-italic">p</span> &lt; 0.01, ** <span class="html-italic">p</span> &lt; 0.001, *** <span class="html-italic">p</span> &lt; 0.0001, **** <span class="html-italic">p</span> &lt; 0.00001). (<b>C</b>–<b>F</b>) Secretory profile of PBMC from GBM patients (<span class="html-italic">low</span> and <span class="html-italic">high</span> grade) and healthy control after 48 h treatment with 18 ng/mL of rhLAV-BPIFB4 as detected by multiplex ELISA of the cell medium. Statistical analysis by two-way ANOVA with Tukey’s test for multiple comparison was conducted (* <span class="html-italic">p</span> &lt; 0.01, ** <span class="html-italic">p</span> &lt; 0.001, *** <span class="html-italic">p</span> &lt; 0.0001, **** <span class="html-italic">p</span> &lt; 0.00001).</p>
Full article ">
18 pages, 3987 KiB  
Article
RNA Molecular Signature Profiling in PBMCs of Sporadic ALS Patients: HSP70 Overexpression Is Associated with Nuclear SOD1
by Maria Garofalo, Cecilia Pandini, Matteo Bordoni, Emanuela Jacchetti, Luca Diamanti, Stephana Carelli, Manuela Teresa Raimondi, Daisy Sproviero, Valeria Crippa, Serena Carra, Angelo Poletti, Orietta Pansarasa, Stella Gagliardi and Cristina Cereda
Cells 2022, 11(2), 293; https://doi.org/10.3390/cells11020293 - 15 Jan 2022
Cited by 7 | Viewed by 3257
Abstract
Superoxide dismutase 1 (SOD1) is one of the causative genes associated with amyotrophic lateral sclerosis (ALS), a neurodegenerative disorder. SOD1 aggregation contributes to ALS pathogenesis. A fraction of the protein is localized in the nucleus (nSOD1), where it seems to be involved in [...] Read more.
Superoxide dismutase 1 (SOD1) is one of the causative genes associated with amyotrophic lateral sclerosis (ALS), a neurodegenerative disorder. SOD1 aggregation contributes to ALS pathogenesis. A fraction of the protein is localized in the nucleus (nSOD1), where it seems to be involved in the regulation of genes participating in the oxidative stress response and DNA repair. Peripheral blood mononuclear cells (PBMCs) were collected from sporadic ALS (sALS) patients (n = 18) and healthy controls (n = 12) to perform RNA-sequencing experiments and differential expression analysis. Patients were stratified into groups with “high” and “low” levels of nSOD1. We obtained different gene expression patterns for high- and low-nSOD1 patients. Differentially expressed genes in high nSOD1 form a cluster similar to controls compared to the low-nSOD1 group. The pathways activated in high-nSOD1 patients are related to the upregulation of HSP70 molecular chaperones. We demonstrated that, in this condition, the DNA damage is reduced, even under oxidative stress conditions. Our findings highlight the importance of the nuclear localization of SOD1 as a protective mechanism in sALS patients. Full article
(This article belongs to the Special Issue Cellular and Molecular Mechanisms of Neurodegenerative Diseases)
Show Figures

Graphical abstract

Graphical abstract
Full article ">Figure 1
<p>(<b>A</b>) PBMCs of sALS patients differ in nSOD1 distribution. Violin plots with boxplot showing distribution of SOD1 in control group (<span class="html-italic">n</span> = 12; red), sALS patient group with “high” nSOD1 (<span class="html-italic">n</span> = 8; green) and sALS patient group with “low” nSOD1 (<span class="html-italic">n</span> = 10; blue). Data were analyzed by Kruskal–Wallis test. **** <span class="html-italic">p</span> &lt; 0.005; ns = nonsignificant. Levels of nSOD1 correlate with patients’ age. (<b>B</b>) Scatter plot of age vs. nSOD1 levels in patients considered for this work; <span class="html-italic">p</span>-value = 0.0021; R<sup>2</sup> = 0.4456. nSOD1 amount is age-dependent.</p>
Full article ">Figure 2
<p>Differential expression analysis in low- and high-nSOD1 PBMCs of sALS patients. Volcano plots. Panel (<b>A</b>) shows DE genes in low-nSOD1 patients, while panel (<b>B</b>) shows DE genes in high-nSOD1 patients. The expression difference is considered significant for a log2 fold change of ≥1 or ≤−1 (<span class="html-italic">x</span>-axis) and for false discovery rate ≤ 0.1 (<span class="html-italic">y</span>-axis). Red dots represent significantly up- and downregulated genes that have |log2(fold change)| ≥ 1 and a <span class="html-italic">p</span>-value ≤ 0.05. Blue, green and gray dots represent detected DE genes that are not significant, because they do not satisfy both requirements. (NS = nonsignificant; log2FC = satisfying fold change criteria; P: satisfying <span class="html-italic">p</span>-value criteria; P and log2FC: satisfying both fold change and <span class="html-italic">p</span>-value cut-off). The top 11 DE genes are labeled (Ensembl ID). Heat maps. Expression profiles of differently expressed genes in sALS patients and healthy controls. Panel (<b>C</b>) compares RNAs in low-nSOD1 patients (pink bar) and the control samples (light blue bar), while panel (<b>D</b>) compares RNAs in high-nSOD1 patients (pink bar) and the control samples (light blue bar). Venn diagram. Differentially expressed genes in common between the two nSOD1 ALS groups (<b>E</b>).</p>
Full article ">Figure 3
<p>Principal component analysis (PCA) of all differentially expressed genes. PC1: 37.2 (<span class="html-italic">x</span>-axis) and PC2: 19.8 (<span class="html-italic">y</span>-axis). Both low-nSOD1 (in purple) and high-nSOD1 (in orange) groups are separate from healthy controls (CTRL in green), and interestingly, the high-nSOD1 group is closer to the control group.</p>
Full article ">Figure 4
<p>High nSOD1 induces an increase in H3K27 methylation. Representative images of trimethylation of histone 3 on lysine 27 (H3K27me3) investigated through immunofluorescence in PBMCs of controls (<span class="html-italic">n</span> = 2) and high-nSOD1 (<span class="html-italic">n</span> = 2) and low-nSOD1 (<span class="html-italic">n</span> = 2) patients.</p>
Full article ">Figure 5
<p>GO chord plot. Chord plot showing significantly enriched GO terms for biological process (<b>A</b>,<b>D</b>), cellular component (<b>B</b>,<b>E</b>) and molecular function (<b>C</b>,<b>F</b>) in low (<b>A</b>–<b>C</b>) and in high (<b>D</b>–<b>F</b>) nSOD1. The left of the plot shows the genes contributing to the enrichment, arranged in order of their logFC, which is displayed in descending intensity of red squares for the upregulated genes and blue squares for the downregulated ones. The genes are linked to their assigned terms via colored ribbons.</p>
Full article ">Figure 5 Cont.
<p>GO chord plot. Chord plot showing significantly enriched GO terms for biological process (<b>A</b>,<b>D</b>), cellular component (<b>B</b>,<b>E</b>) and molecular function (<b>C</b>,<b>F</b>) in low (<b>A</b>–<b>C</b>) and in high (<b>D</b>–<b>F</b>) nSOD1. The left of the plot shows the genes contributing to the enrichment, arranged in order of their logFC, which is displayed in descending intensity of red squares for the upregulated genes and blue squares for the downregulated ones. The genes are linked to their assigned terms via colored ribbons.</p>
Full article ">Figure 6
<p>High nSOD1 shows an increase in heat shock proteins. Validation of HSPs. (<b>A</b>–<b>C</b>) RT-PCR of HSPA1A (CTRL <span class="html-italic">n</span> = 8; LOW <span class="html-italic">n</span> = 10; HIGH <span class="html-italic">n</span> = 7), HSPA1B (CTRL <span class="html-italic">n</span> = 7; LOW <span class="html-italic">n</span> = 10; HIGH <span class="html-italic">n</span> = 7) and HSPH1 (CTRL <span class="html-italic">n</span> = 13; LOW <span class="html-italic">n</span> = 9; HIGH <span class="html-italic">n</span> = 7) in PBMCs of CTRL, low-nSOD1 sALS patients and high-nSOD1 sALS patients. Data were analyzed by ANOVA (number of analyzed groups = 3) followed by Bonferroni post-test. * <span class="html-italic">p</span> &lt; 0.05. Levels of HSPA1A and HSPA1B mRNAs are higher in patients with high nSOD1, confirming RNA-seq results, while no significant alterations are observed in HSPH1 mRNA through qPCR. (<b>D</b>,<b>E</b>) WB analysis for evaluating expression of HSP70s (CTRL <span class="html-italic">n</span> = 13; LOW <span class="html-italic">n</span> = 10; HIGH <span class="html-italic">n</span> = 9) and HSPH1 (CTRL <span class="html-italic">n</span> = 12; LOW <span class="html-italic">n</span> = 9; HIGH <span class="html-italic">n</span> = 11) in sALS PBMCs. Data were analyzed by ANOVA (number of analyzed groups = 3) followed by Bonferroni post-test. * <span class="html-italic">p</span> &lt; 0.05. Levels of HSP70 and HSPH1 are higher in patients with high nSOD1 compared to those with low nSOD1. Phosphorylation of HSF1 is increased in high-nSOD1 PBMCs of sALS patients. (<b>F</b>) Representative WB membrane for HSP70s and HSHP1. (<b>G</b>) RT-PCR of HSF1 mRNA (CTRL <span class="html-italic">n</span> = 18; LOW <span class="html-italic">n</span> = 10; HIGH <span class="html-italic">n</span> = 8) in PBMCs of CTRL, low-nSOD1 sALS patients and high nSOD1 sALS patients. (<b>H</b>) WB analysis of HSF1 protein. Their levels do not change. (<b>I</b>) WB analysis for the study of HSF1 phosphorylation at serine 326 (CTRL <span class="html-italic">n</span> = 13; LOW <span class="html-italic">n</span> = 9; HIGH <span class="html-italic">n</span> = 10). Levels of phosphorylated HSF1 at S326 are higher in patients with high nSOD1 compared to those with low nSOD1 and to healthy controls. HSF1 Ps326 was normalized to total HSF1. Data were analyzed by ANOVA (number of analyzed groups = 3) followed by Bonferroni post-test. * <span class="html-italic">p</span> &lt; 0.05. (<b>J</b>) Representative WB membrane for pHSF1 and HSF1.</p>
Full article ">Figure 7
<p>HSP70 is involved in DNA damage protection in PBMCs of sALS patients. (<b>A</b>) Protective role of nuclear SOD1 against DNA damage in PBMCs. Controls (<span class="html-italic">n</span> = 2) and high- (<span class="html-italic">n</span> = 2) and low- nSOD1 (<span class="html-italic">n</span> = 2) PBMCs underwent basal evaluation (NT: not treated) or H<sub>2</sub>O<sub>2</sub> (5 min; 500 μM) treatment followed by recovery or H<sub>2</sub>O<sub>2</sub> (5 min; 500 μM) + VER (1 h; 50 μM) treatment followed by recovery. (<b>B</b>) Comet assay quantification by comet length. Data were analyzed by ANOVA (number of analyzed groups = 3) followed by Bonferroni post-test. * <span class="html-italic">p</span> &lt; 0.05 and *** <span class="html-italic">p</span> &lt; 0.001. Mean of analyzed cells for each sample <span class="html-italic">n</span> = 15.22. An increased comet length, indicating DNA damage, was observed in basal conditions in patients with low nSOD1 compared to controls. Treatment with H<sub>2</sub>O<sub>2</sub> (5 min; 500 μM) + VER (1 h; 50 μM) visibly increased DNA damage compared to both cells in basal conditions and cells treated with H<sub>2</sub>O<sub>2</sub> (5 min; 500 μM) only in healthy controls. In high-nSOD1 patients, no significant variation was detected when comparing basal cells and cells treated with H<sub>2</sub>O<sub>2</sub> (5 min; 500 μM), meaning that upregulation of HSP70 restored normal DNA repair during recovery phase. Inhibition of HSP70 with VER (1 h; 50 μM) prevented the re-establishment of this mechanism. In the end, in low-nSOD1 PBMCs, no significant variation in terms of comet length was observed.</p>
Full article ">
26 pages, 5040 KiB  
Article
Identification of the Cysteine Protease Legumain as a Potential Chronic Hypoxia-Specific Multiple Myeloma Target Gene
by Ada-Sophia Clees, Verena Stolp, Björn Häupl, Dominik C. Fuhrmann, Frank Wempe, Marcel Seibert, Sarah Weber, Antje Banning, Ritva Tikkanen, Richard Williams, Bernhard Brüne, Hubert Serve, Frank Schnütgen, Ivana von Metzler and Nina Kurrle
Cells 2022, 11(2), 292; https://doi.org/10.3390/cells11020292 - 15 Jan 2022
Cited by 4 | Viewed by 3707
Abstract
Multiple myeloma (MM) is the second most common hematologic malignancy, which is characterized by clonal proliferation of neoplastic plasma cells in the bone marrow. This microenvironment is characterized by low oxygen levels (1–6% O2), known as hypoxia. For MM cells, hypoxia [...] Read more.
Multiple myeloma (MM) is the second most common hematologic malignancy, which is characterized by clonal proliferation of neoplastic plasma cells in the bone marrow. This microenvironment is characterized by low oxygen levels (1–6% O2), known as hypoxia. For MM cells, hypoxia is a physiologic feature that has been described to promote an aggressive phenotype and to confer drug resistance. However, studies on hypoxia are scarce and show little conformity. Here, we analyzed the mRNA expression of previously determined hypoxia markers to define the temporal adaptation of MM cells to chronic hypoxia. Subsequent analyses of the global proteome in MM cells and the stromal cell line HS-5 revealed hypoxia-dependent regulation of proteins, which directly or indirectly upregulate glycolysis. In addition, chronic hypoxia led to MM-specific regulation of nine distinct proteins. One of these proteins is the cysteine protease legumain (LGMN), the depletion of which led to a significant growth disadvantage of MM cell lines that is enhanced under hypoxia. Thus, herein, we report a methodologic strategy to examine MM cells under physiologic hypoxic conditions in vitro and to decipher and study previously masked hypoxia-specific therapeutic targets such as the cysteine protease LGMN. Full article
(This article belongs to the Collection Emerging Cancer Target Genes)
Show Figures

Figure 1

Figure 1
<p>Definition of chronic hypoxia in MM cells: mRNA expression of acute and chronic hypoxia-related marker genes in RPMI-8226, LP-1, OPM-2 and KMS-12-BM cells grown at 1% O<sub>2</sub> for 0, 1, 3, 5 and 7 days. (<b>A</b>) relative <span class="html-italic">EGLN1</span> mRNA levels normalized to <span class="html-italic">TATA-box-binding protein</span> (<span class="html-italic">TBP</span>) and to day 0. (<b>B</b>) relative <span class="html-italic">ADM</span> mRNA levels normalized to <span class="html-italic">TBP</span> and day 0. (<b>C</b>) relative <span class="html-italic">H4C1</span> mRNA levels normalized to <span class="html-italic">TBP</span> and day 0. (<b>D</b>) relative <span class="html-italic">OSTF1</span> mRNA levels normalized to <span class="html-italic">TBP</span> and day 0. Graphs indicate mRNA levels ± SD of one representative experiment, total <span class="html-italic">n</span> = 3. One-way ANOVA with Bonferroni’s multiple comparison test. * <span class="html-italic">p</span> &lt; 0.05; ** <span class="html-italic">p</span> &lt; 0.01, *** <span class="html-italic">p</span> &lt; 0.001. Values of <span class="html-italic">p</span> &gt; 0.05 were considered not significant (n.s.).</p>
Full article ">Figure 2
<p>HIF1α and HIF2α levels during the adaptation to hypoxia: (<b>A</b>) Western blot of HIF1α (upper blot) and HIF2α (lower blot) levels during the adaptation to hypoxic conditions (1% O<sub>2</sub>) up to 7 days in RPMI-8226 cells. Loading control: β-actin. (<b>B</b>) Densitometric quantifications of protein levels (HIF1α and HIF2α). Signals were normalized to β-actin. (<b>C</b>) Model of adaptation of MM cells to hypoxia in in vitro cell culture. Abbreviations: h = hours; d = day; rel. = relative; kDa = kilodalton.</p>
Full article ">Figure 3
<p>Global proteome profiling of multiple myeloma and stromal cell lines: (<b>A</b>) Heatmap of Z-transformed SILAC ratios (chronic hypoxia/normoxia) of protein groups quantified in each LC/MS analysis. Rows and columns are clustered based on the Euclidean distance and average linkage method. (<b>B</b>) Venn diagram illustrating the numbers and overlap of proteins regulated under hypoxia for the multiple myeloma cell lines under investigation. Regulated proteins were assigned by filtering for SILAC ratios showing 2-fold up- or down-regulation in at least 2 biological replicate analyses per cell line. (<b>C</b>) Volcano plot showing proteins significantly regulated under hypoxic conditions across the multiple myeloma cell lines LP-1, OPM-2, RPMI-8226 and the stromal cell line HS-5. For statistical analysis, one-sample <span class="html-italic">t</span>-test of the log2-transformed SILAC ratios against zero (no change) was conducted and the <span class="html-italic">p</span>-values were adjusted for multiple hypotheses testing (Benjamini-Hochberg FDR &lt; 5%). (<b>D</b>) Venn diagram showing the numbers and overlap of regulated proteins between the multiple myeloma cell lines (MM) and the bone marrow stromal cell line HS-5, including and excluding MM cell line KMS-12-BM.</p>
Full article ">Figure 4
<p>Pathway analysis of hypoxia-regulated pathways in MM and HS-5 cells: Proteins considered to be regulated in each cell line were subjected to Ingenuity core analysis and activation Z-scores of pathways scoring in at least 2 cell lines were plotted. MM cell lines RPMI-8226, LP-1 and OPM-2 and with (<b>A</b>) and without (<b>B</b>) the bone marrow stromal cell line HS-5 cells. (<b>C</b>) Illustration of the individual glycolytic enzymes identified in our LC/MS measurement. Upregulation was defined as normalized log2 SILAC ratio chronic hypoxia/normoxia &gt;0.6. Upregulation in MM cells was defined as upregulation in at least one MM cell line. Abbreviations: P = phosphate, GAP = glyceraldehyde-3-phosphate, DHAP = dihydroxyacetone-phosphate, PEP = phosphoenolpyruvate.</p>
Full article ">Figure 5
<p>Hexokinase 2 and lactate dehydrogenase A protein expression in chronic hypoxia: Four MM cell lines and the bone marrow stromal cell line HS-5 were cultivated under hypoxic conditions and harvested at day 0, 1 and 7 for protein analysis. Representative Western blots for hexokinase 2 (HK2) (<b>A</b>) and lactate dehydrogenase A (LDHA) (<b>C</b>) are shown. Loading control: β-tubulin. Densitometric quantifications of protein expression are shown in (<b>B</b>) for HK2 and (<b>D</b>) for LDHA. Signals were normalized to β-tubulin expression. Bar graphs represent mean ±SEM of 3 independent experiments. One-way-ANOVA with Bonferroni’s post-hoc test. *, <span class="html-italic">p</span> &lt; 0.05; **, <span class="html-italic">p</span> &lt; 0.01; ***, <span class="html-italic">p</span> &lt; 0.001. Abbreviations: d = day; rel. = relative; kDa = kilodalton; HK2 = hexokinase 2; LDHA = lactate dehydrogenase A.</p>
Full article ">Figure 6
<p>MM-specific upregulation of the cysteine protease legumain (LGMN) in chronic hypoxia: Four MM cell lines and the bone marrow stromal cell line HS-5 were cultured under hypoxic conditions (1% O<sub>2</sub>) and analyzed at day 0, 1 and 7 for protein and mRNA expression. (<b>A</b>) Relative <span class="html-italic">LGMN</span> mRNA levels in MM cell lines, normalized to <span class="html-italic">TATA-box-binding protein</span> (<span class="html-italic">TBP</span>) mRNA levels. * <span class="html-italic">p</span> &lt; 0.05; ***, <span class="html-italic">p</span> &lt; 0.001. (<b>B</b>) Representative Western blots for LGMN at 56 kDa (pro-LGMN) and 37 kDa (activated LGMN). β-tubulin served as a loading control. (<b>C</b>) Densitometric quantifications of LGMN expression (pro-LGMN and active LGMN). Signals were normalized to β-tubulin expression. Bar graphs represent the mean ±SEM of three independent experiments. One-way-ANOVA with Bonferroni’s post-hoc test. *, <span class="html-italic">p</span> &lt; 0.05; **, <span class="html-italic">p</span> &lt; 0.01; ***, <span class="html-italic">p</span> &lt; 0.001. (<b>D</b>) The extracellular concentration of LGMN in RPMI-8226, OP;-2 and U266 cells was assessed by enzyme-linked immunosorbent assay (ELISA) in the supernatant under normoxic and chronic hypoxic conditions. Extracellular concentration of LGMN [ng/mL] in RPMI 8226, OPM 2 and U266 cells. Bar graphs indicate the mean ±SEM of three technical replicates. Unpaired student’s <span class="html-italic">t</span>-test, *, <span class="html-italic">p</span> &lt; 0.05; **, <span class="html-italic">p</span> &lt; 0.01.</p>
Full article ">Figure 7
<p>CRISPR/Cas9-based depletion of LGMN in MM cells confers enhanced growth disadvantage under chronic hypoxia: (<b>A</b>) Left: Competition growth assay of RPMI-8226 LGMN KO cells (sgRNA1, 3, 4 and 1 + 4) using NTC as a negative control and c-myc KO as a positive control in hypoxia (1% O<sub>2</sub>). The percentage of GFP-positive cells measured via flow cytometry is normalized to NTC and day 0. Error bars indicate mean ± SEM of three technical replicates. Right: Representative Western blot of LGMN KO in RPMI-8226 cells used in the competition assay. Loading control: Nucleolin. (<b>B</b>) Left: Cumulative growth assay of RPMI-8226 LGMN KO (sgRNA5, 8) and NTC cells in normoxia (21% O<sub>2</sub>, blue colors) and hypoxia (1% O<sub>2</sub>, red colors). Error bars indicate mean ± SEM of three technical replicates. Right: Representative Western blot of LGMN KO in RPMI-8226 cells used in the cumulative growth assay. Loading control: Vinculin. (<b>C</b>) Viability assay in RPMI-8226 cells of 3 independent experiments after treatment with LGMN inhibitor 10t for 48 h under normoxia and hypoxia. Viability in [%] measured by NAD(P)H production. IC<sub>50</sub> is represented by black dashed line by blue dotted line in the graph and hypoxia by red dotted line. Error bars indicate the mean ± SEM of three biological replicates. (<b>D</b>) Apoptosis assay. Annexin V-PE-positive (apoptotic) RPMI-8226 cells [% of total cells] four and six days post transduction with sgRNA NTC, sgRNA LGMN(5) and sgRNA LGMN(8) in normoxic conditions. Bar graphs represent the mean ± SD of two independent experiments. (<b>E</b>) Rescue experiment using a pro-LGMN WT construct (LGMN Wt SIHW) in RPMI-8226 NTC and LGMN KO (sgRNA5) cells under normoxic conditions. Bar graphs represent the cumulative, relative cell number after 12 days of 3 independent experiments. Two-way-ANOVA with Bonferroni’s post-hoc test. *, <span class="html-italic">p</span> &lt; 0.05; ***, <span class="html-italic">p</span> &lt; 0.001. Values of <span class="html-italic">p</span> &gt; 0.05 were considered not significant (ns). Abbreviations: p.t. = post transduction.</p>
Full article ">
20 pages, 4752 KiB  
Article
Glucose Regulates m6A Methylation of RNA in Pancreatic Islets
by Florine Bornaque, Clément Philippe Delannoy, Emilie Courty, Nabil Rabhi, Charlène Carney, Laure Rolland, Maeva Moreno, Xavier Gromada, Cyril Bourouh, Pauline Petit, Emmanuelle Durand, François Pattou, Julie Kerr-Conte, Philippe Froguel, Amélie Bonnefond, Frédérik Oger and Jean-Sébastien Annicotte
Cells 2022, 11(2), 291; https://doi.org/10.3390/cells11020291 - 15 Jan 2022
Cited by 17 | Viewed by 4049
Abstract
Type 2 diabetes is characterized by chronic hyperglycemia associated with impaired insulin action and secretion. Although the heritability of type 2 diabetes is high, the environment, including blood components, could play a major role in the development of the disease. Amongst environmental effects, [...] Read more.
Type 2 diabetes is characterized by chronic hyperglycemia associated with impaired insulin action and secretion. Although the heritability of type 2 diabetes is high, the environment, including blood components, could play a major role in the development of the disease. Amongst environmental effects, epitranscriptomic modifications have been recently shown to affect gene expression and glucose homeostasis. The epitranscriptome is characterized by reversible chemical changes in RNA, with one of the most prevalent being the m6A methylation of RNA. Since pancreatic β cells fine tune glucose levels and play a major role in type 2 diabetes physiopathology, we hypothesized that the environment, through variations in blood glucose or blood free fatty acid concentrations, could induce changes in m6A methylation of RNAs in pancreatic β cells. Here we observe a significant decrease in m6A methylation upon high glucose concentration, both in mice and human islets, associated with altered expression levels of m6A demethylases. In addition, the use of siRNA and/or specific inhibitors against selected m6A enzymes demonstrate that these enzymes modulate the expression of genes involved in pancreatic β-cell identity and glucose-stimulated insulin secretion. Our data suggest that environmental variations, such as glucose, control m6A methylation in pancreatic β cells, playing a key role in the control of gene expression and pancreatic β-cell functions. Our results highlight novel causes and new mechanisms potentially involved in type 2 diabetes physiopathology and may contribute to a better understanding of the etiology of this disease. Full article
(This article belongs to the Special Issue Cellular and Molecular Biology of the Beta Cell)
Show Figures

Figure 1

Figure 1
<p>m<sup>6</sup>A RNA methylation in human and murine diabetic islets. (<b>A</b>,<b>B</b>) ELISA quantification of m<sup>6</sup>A levels in total RNA from (<b>A</b>) pancreatic islets isolated from mice fed with chow diet (<span class="html-italic">n</span> = 5) or high fat diet during 12 weeks (<span class="html-italic">n</span> = 4) and (<b>B</b>) human control islets (<span class="html-italic">n</span> = 10) vs. human islets from donors with T2D (<span class="html-italic">n</span> = 5). Data were analyzed by Mann–Whitney test. ** <span class="html-italic">p</span> &lt; 0.01. (<b>C</b>) Representative immunofluorescent staining of m<sup>6</sup>A levels (in green), insulin (in red) and glucagon (in white) in pancreatic sections from 15-week-old wild C57Bl6J mice fed with chow (CD), high fat (HFD) diets or from 15-week-old db/db mice. Nuclei were stained with Dapi (in blue). Scale bar represents 22 µm.</p>
Full article ">Figure 2
<p>Effect of glucose on m<sup>6</sup>A RNA methylation in Min6 cells and non-diabetic human islets. (<b>A</b>,<b>B</b>) m<sup>6</sup>A methylation was quantified by dot blot in total RNA of Min6 cells (<span class="html-italic">n</span> = 3) after 3 h of treatment with 2.8 or 20 mM glucose. Quantification of m<sup>6</sup>A labeling in B was obtained from nylon membranes ((<b>A</b>), right membrane) and normalized by total RNA ((<b>A</b>), left membrane). (<b>C</b>,<b>D</b>) Immunofluorescence of Min6 cells (<span class="html-italic">n</span> = 5) after glucose treatment (<b>C</b>) and its quantification (<b>D</b>). (<b>E</b>,<b>F</b>) m<sup>6</sup>A methylation was quantified by dot blot in total RNA of non-diabetic human islets from 3 donors (H1028, H1032, H1033) after 1 h of 2.8 or 20 mM glucose treatment (<span class="html-italic">n</span> = 3 or 4). Quantification of m<sup>6</sup>A labeling obtained in nylon membrane ((<b>E</b>), right membrane) and normalized by total RNA (<b>E</b>, left, blue membrane). Data were analyzed by two-way ANOVA with Bonferroni’s correction for multiple comparisons (<b>B</b>) or Mann–Whitney tests (<b>D</b>,<b>F</b>). ** <span class="html-italic">p</span> &lt; 0.01, **** <span class="html-italic">p</span> &lt; 0.0001.</p>
Full article ">Figure 3
<p>mRNA expression and protein localization of m<sup>6</sup>A reader and erasers after glucose treatment. (<b>A</b>–<b>C</b>) mRNA expression of <span class="html-italic">Alkbh5</span> (<b>A</b>), <span class="html-italic">Fto</span> (<b>B</b>) and <span class="html-italic">Mettl3</span> (<b>C</b>) were quantified in Min6 cells by RT-qPCR after 1, 2 or 3 h of 2.8 or 20 mM glucose treatment (<span class="html-italic">n</span> = 3). Immunofluorescence of ALKBH5 in Min6 cells after 3 h of 2.8 or 20 mM glucose treatment (<b>D</b>) and its quantification using ImageJ ((<b>E</b>), <span class="html-italic">n</span> = 3). Immunofluorescence of METTL3 in Min6 cells after a 3 h treatment with 2.8 or 20 mM glucose treatment (<b>F</b>) and its quantification ((<b>G</b>), <span class="html-italic">n</span> = 3). Data were analyzed by two-way ANOVA with Bonferroni’s correction for multiple comparisons multiple <span class="html-italic">t</span>-tests (<b>A</b>–<b>C</b>) or multiple unpaired <span class="html-italic">t</span>-tests (<b>E</b>,<b>G</b>). * <span class="html-italic">p</span> &lt; 0.05, ** <span class="html-italic">p</span> &lt; 0.01.</p>
Full article ">Figure 4
<p>Effects of a chronic high glucose and palmitate treatment on m<sup>6</sup>A RNA methylation and m<sup>6</sup>A enzyme expression in Min6 cells and non-diabetic human islets. (<b>A</b>,<b>B</b>) Glucose-stimulated insulin secretion was quantified by ELISA ((<b>A</b>), <span class="html-italic">n</span> = 4) and quantification of mRNA expression levels of some ER stress genes by RT-qPCR ((<b>B</b>), <span class="html-italic">n</span> = 4) after 20 mM glucose with or without 1 mM palmitate during 72 h. (<b>C</b>,<b>D</b>) Immunofluorescence of m<sup>6</sup>A methylation in Min6 cells after after 72 h of 20 mM glucose with or without 1 mM palmitate (<b>C</b>) and its quantification (<span class="html-italic">n</span> ≥ 4, (<b>D</b>)). (<b>E</b>) Quantification of m<sup>6</sup>A enzyme expression by RT-qPCR in Min6 cells treated with 20 mM glucose with or without 1 mM palmitate ((<b>E</b>), <span class="html-italic">n</span> = 4). (<b>F</b>,<b>G</b>) Western blot (<b>F</b>) and its quantification (<b>G</b>) showing METTL3 and ALKBH5 protein levels in Min6 cells treated with 5.6 or 20 mM glucose, with or without 1 mM palmitate, for 72 h. (<b>H</b>) Quantification of m<sup>6</sup>A enzyme expression by RT-qPCR in pancreatic human islets (H1099) treated with 0.5 mM palmitate (<span class="html-italic">n</span> = 4). Data were analyzed by two-way ANOVA with Tukey’s correction for multiple comparisons (<b>A</b>) or Mann–Whitney tests (<b>B</b>,<b>D</b>,<b>E</b>,<b>H</b>). * <span class="html-italic">p</span> &lt; 0.05, ** <span class="html-italic">p</span> &lt; 0.01, *** <span class="html-italic">p</span> &lt; 0.001, **** <span class="html-italic">p</span> &lt; 0.0001.</p>
Full article ">Figure 5
<p>Effects of a chronic low glucose and palmitate treatment on m<sup>6</sup>A RNA methylation and m<sup>6</sup>A enzyme expression in Min6 cells and non-diabetic human islets. (<b>A</b>,<b>B</b>) Glucose-stimulated insulin secretion was quantified by ELISA ((<b>A</b>), <span class="html-italic">n</span> = 4) and quantification of mRNA expression levels of some ER stress genes by RT-qPCR ((<b>B</b>), <span class="html-italic">n</span> = 4) after 5.6 mM glucose and 1 mM palmitate cotreatment during 72 h. (<b>C</b>) m<sup>6</sup>A methylation levels in Min6 cells after 72 h of 5.6 mM glucose and 1 mM palmitate ((<b>C</b>), <span class="html-italic">n</span> = 4). (<b>D</b>) Quantification of m<sup>6</sup>A enzyme expression by RT-qPCR in Min6 cells treated with 5.6 mM glucose and 1 mM palmitate (<span class="html-italic">n</span> = 4). (<b>E</b>) Glucose-stimulated insulin secretion of human islets treated with 5.6 mM glucose and 0.5 mM palmitate was quantified by ELISA. (<b>F</b>) Quantification of m<sup>6</sup>A enzyme expression by RT-qPCR in pancreatic human islets (H1099) treated with 0.5 mM palmitate (<span class="html-italic">n</span> = 4). Data were analyzed by two-way ANOVA with Tukey’s correction for multiple comparisons (<b>A</b>,<b>E</b>) or Mann–Whitney tests (<b>B</b>–<b>D</b>,<b>F</b>). * <span class="html-italic">p</span> &lt; 0.05, ** <span class="html-italic">p</span> &lt; 0.01, *** <span class="html-italic">p</span> &lt; 0.001, **** <span class="html-italic">p</span> &lt; 0.0001.</p>
Full article ">Figure 6
<p>Knock-down of m<sup>6</sup>A enzymes through siRNA affects the expression of genes involved in beta-cell identity and function. Cells were treated during 24 h with a non targetting siRNA (siControl), siAlkbh5, siFto and siMettl3 and lysed 48 h later to study mRNA expression. Quantification of m<sup>6</sup>A enzyme expression by RT-qPCR after siRNA transfection against <span class="html-italic">Alkbh5</span> (<b>A</b>), <span class="html-italic">Fto</span> (<b>D</b>) or <span class="html-italic">Mettl3</span> (<b>G</b>) (<span class="html-italic">n</span> = 4). mRNA expression of genes involved in β-cell identity (<b>B</b>,<b>E</b>,<b>H</b>) and function (<b>C</b>,<b>F</b>,<b>I</b>) (<span class="html-italic">n</span> = 4) is represented. Data were analyzed by two-way ANOVA with Bonferroni’s correction for multiple comparisons (<b>A</b>,<b>D</b>,<b>G</b>) and multiple t-tests (<b>B</b>,<b>C</b>,<b>E</b>,<b>F</b>,<b>H</b>,<b>I</b>). * <span class="html-italic">p</span> &lt; 0.05, ** <span class="html-italic">p</span> &lt; 0.01, *** <span class="html-italic">p</span> &lt; 0.001, **** <span class="html-italic">p</span> &lt; 0.0001.</p>
Full article ">Figure 7
<p>Effects of genetic or pharmacological FTO inhibition on glucose-stimulated insulin secretion in Min6 cells, mouse and human pancreatic islets. (<b>A</b>) GSIS after siRNA mediated <span class="html-italic">Fto</span> knockdown in Min6 cells (<span class="html-italic">n</span> = 16). (<b>B</b>,<b>C</b>) GSIS after treatment of Min6 cells ((<b>B</b>), <span class="html-italic">n</span> = 4) and primary mouse pancreatic islets ((<b>C</b>), <span class="html-italic">n</span> = 6) with 100 nM bisantrene for 8 and 2 h, respectively. (<b>D</b>–<b>F</b>) Human pancreatic islets were untreated or treated with 100 nM bisantrene for 1 h (<b>D</b>), 4 h (<b>E</b>) and 24 h (<b>F</b>) and global m<sup>6</sup>A RNA methylation was quantified by ELISA. (<b>G</b>) GSIS of pancreatic human islets untreated or treated with 100 nM bisantrene for 1, 4 and 24 h. Stimulation index represents the fold of 20 mM glucose-stimulated insulin secretion over 2.8 mM glucose-stimulated insulin secretion. Data were analyzed by two-way ANOVA with Tukey’s correction for multiple comparisons (<b>A</b>–<b>C</b>), Mann–Whitney tests (<b>D</b>–<b>F</b>) or one-way ANOVA with Dunnett’s correction for multiple comparisons (<b>G</b>). * <span class="html-italic">p</span> &lt; 0.05, ** <span class="html-italic">p</span> &lt; 0.01, *** <span class="html-italic">p</span> &lt; 0.001.</p>
Full article ">
16 pages, 1954 KiB  
Article
The Electrostatic Basis of Diacylglycerol Pyrophosphate—Protein Interaction
by Zachary Graber, Desmond Owusu Kwarteng, Shannon M. Lange, Yannis Koukounas, Hady Khalifa, Jean W. Mutambuze and Edgar E. Kooijman
Cells 2022, 11(2), 290; https://doi.org/10.3390/cells11020290 - 15 Jan 2022
Cited by 3 | Viewed by 2410
Abstract
Diacylglycerol pyrophosphate (DGPP) is an anionic phospholipid formed in plants, yeast, and parasites under multiple stress stimuli. It is synthesized by the phosphorylation action of phosphatidic acid (PA) kinase on phosphatidic acid, a signaling lipid with multifunctional properties. PA functions in the membrane [...] Read more.
Diacylglycerol pyrophosphate (DGPP) is an anionic phospholipid formed in plants, yeast, and parasites under multiple stress stimuli. It is synthesized by the phosphorylation action of phosphatidic acid (PA) kinase on phosphatidic acid, a signaling lipid with multifunctional properties. PA functions in the membrane through the interaction of its negatively charged phosphomonoester headgroup with positively charged proteins and ions. DGPP, like PA, can interact electrostatically via the electrostatic-hydrogen bond switch mechanism but differs from PA in its overall charge and shape. The formation of DGPP from PA alters the physicochemical properties as well as the structural dynamics of the membrane. This potentially impacts the molecular and ionic binding of cationic proteins and ions with the DGPP enriched membrane. However, the results of these important interactions in the stress response and in DGPP’s overall intracellular function is unknown. Here, using 31P MAS NMR, we analyze the effect of the interaction of low DGPP concentrations in model membranes with the peptides KALP23 and WALP23, which are flanked by positively charged Lysine and neutral Tryptophan residues, respectively. Our results show a significant effect of KALP23 on the charge of DGPP as compared to WALP23. There was, however, no significant effect on the charge of the phosphomonoester of DGPP due to the interaction with positively charged lipids, dioleoyl trimethylammonium propane (DOTAP) and dioleoyl ethyl-phosphatidylcholine (EtPC). Divalent calcium and magnesium cations induce deprotonation of the DGPP headgroup but showed no noticeable differences on DGPP’s charge. Our results lead to a novel model for DGPP—protein interaction. Full article
Show Figures

Graphical abstract

Graphical abstract
Full article ">Figure 1
<p>Effect of transmembrane peptides on the chemical shift of DGPP. (<b>A</b>) Ribbon models for the transmembrane Alanine and Leucine (AL) peptides KALP23 and WALP23 with flanking lysine and tryptophan residues. (<b>B</b>) Representative solid-state <sup>31</sup>P NMR spectra for control (DOPC:DGPP (95 mol%:5 mol%)), WALP23 and KALP23 at a 4:100 peptide–lipid ratio. (<b>C</b>) Quantified changes in the chemical shift of the phosphomonoester of DGPP in the presence of KALP23 and WALP23, compared to control, as a function of peptide–lipid ratio. Error bars show the standard deviation determined from at least three unique samples (* <span class="html-italic">p</span> &lt; 0.001). (<b>D</b>) Representative static <sup>31</sup>P NMR spectra for NMR samples from B that show samples formed lipid bilayers. Chemical shift values are relative to an 85% H3PO4 external reference.</p>
Full article ">Figure 1 Cont.
<p>Effect of transmembrane peptides on the chemical shift of DGPP. (<b>A</b>) Ribbon models for the transmembrane Alanine and Leucine (AL) peptides KALP23 and WALP23 with flanking lysine and tryptophan residues. (<b>B</b>) Representative solid-state <sup>31</sup>P NMR spectra for control (DOPC:DGPP (95 mol%:5 mol%)), WALP23 and KALP23 at a 4:100 peptide–lipid ratio. (<b>C</b>) Quantified changes in the chemical shift of the phosphomonoester of DGPP in the presence of KALP23 and WALP23, compared to control, as a function of peptide–lipid ratio. Error bars show the standard deviation determined from at least three unique samples (* <span class="html-italic">p</span> &lt; 0.001). (<b>D</b>) Representative static <sup>31</sup>P NMR spectra for NMR samples from B that show samples formed lipid bilayers. Chemical shift values are relative to an 85% H3PO4 external reference.</p>
Full article ">Figure 2
<p>Ionization curve for DGPP in the presence of KALP23. (<b>A</b>) <sup>31</sup>P MAS NMR spectra as a function of pH for 5 mol% DGPP in 95% DOPC vesicles. (<b>B</b>) Static <sup>31</sup>P NMR spectra for low, medium, and high pH values recorded for samples from A. (<b>C</b>) Ionization curve for the phosphomonoester of DGPP as a function of pH. The titration curve for DGPP in the presence of KALP23 (green) is compared against the control curve in the absence of KALP23 (grey), taken from [<a href="#B17-cells-11-00290" class="html-bibr">17</a>]. The solid lines are from a Henderson–Hasselbalch fit of the ionization data (see Methods).</p>
Full article ">Figure 3
<p>Solid-state MAS <sup>31</sup>P NMR-based titration curves for DGPP in the presence of cationic lipids. (<b>A</b>) DOTAP, blue diamonds and lines. Also shown are the KALP23 data from <a href="#cells-11-00290-f002" class="html-fig">Figure 2</a>. (<b>B</b>) EtPC 16 and EtPC 32 are shown in light red and dark red squares and lines, respectively. The DOTAP data in <a href="#cells-11-00290-f003" class="html-fig">Figure 3</a>A and <a href="#app1-cells-11-00290" class="html-app">Figure S4A</a> are compared with our previous results for KALP23 and the 95:5 DOPC/DGPP control. Surprisingly, we observe no effect on the ionization behavior and charge of the phosphomonoester of DGPP due to the presence of the cationic DOTAP (the titration and especially the protonation curve for DOTAP completely overlaps with that of the PC/DGPP control). This is opposite to what we previously observed for PA. In the presence of DOTAP the ionization curve for PA moved to lower pH values, albeit less than in the presence of KALP23, indicating a lower pK<sub>a2</sub>, and hence a higher negative charge for the phosphomonoester as expected based on simple electrostatics. The effect of positive charge in the quaternary amine of DOTAP accounted for ~40% of the change in charge of PA [<a href="#B18-cells-11-00290" class="html-bibr">18</a>] compared to the change in charge induced by KALP23 (due to both positive charge and hydrogen bonding). Since DOTAP has no effect on the ionization of the phosphomonoester of DGPP, something novel must be happening at the lipid headgroup–aqueous interface. To investigate this further, we used a cationic lipid that has a positive charge that is located further away from the hydrophobic interior of the membrane. In DOTAP, the positive charge is located in the quaternary amine, which is likely close to the pyrophosphate of DGPP. We thus chose a cationic PC where the phosphate is conjugated with an ethyl group, hence ethyl-PC (EtPC). The quaternary amine of this EtPC is located further away from the hydrophobic interior of the membrane and closer to the aqueous interface.</p>
Full article ">Figure 4
<p>(<b>A</b>) Schematic showing DOPC and DGPP in the membrane with no direct electrostatic interaction between DGPP’s inner phosphate and the phosphate of DOPC. (<b>B</b>) Schematic showing the electrostatic interaction between the positively charged amine of DOTAP and the inner phosphate of DGPP leading to its ionization (removal of the proton).</p>
Full article ">Figure 5
<p>DGPP Ionization in the presence of Divalent Cations. The DGPP phosphomonoester peak chemical shift value is plotted for varying cation concentrations. Chemical shift values are obtained from <sup>31</sup>P MAS NMR spectra of DOPC:DGPP (95%/5%) MLVs in buffer at pH 7.2 ± 0.1 with 100 mM NaCl. Samples contained 0–1 mM Ca<sup>2+</sup> or 1 mM Mg<sup>2+</sup>. Error bars show the standard deviation measured from at least seven samples. * <span class="html-italic">p</span> &lt; 0.001.</p>
Full article ">
16 pages, 737 KiB  
Review
Golgi Metal Ion Homeostasis in Human Health and Diseases
by Jie Li and Yanzhuang Wang
Cells 2022, 11(2), 289; https://doi.org/10.3390/cells11020289 - 15 Jan 2022
Cited by 20 | Viewed by 4840
Abstract
The Golgi apparatus is a membrane organelle located in the center of the protein processing and trafficking pathway. It consists of sub-compartments with distinct biochemical compositions and functions. Main functions of the Golgi, including membrane trafficking, protein glycosylation, and sorting, require a well-maintained [...] Read more.
The Golgi apparatus is a membrane organelle located in the center of the protein processing and trafficking pathway. It consists of sub-compartments with distinct biochemical compositions and functions. Main functions of the Golgi, including membrane trafficking, protein glycosylation, and sorting, require a well-maintained stable microenvironment in the sub-compartments of the Golgi, along with metal ion homeostasis. Metal ions, such as Ca2+, Mn2+, Zn2+, and Cu2+, are important cofactors of many Golgi resident glycosylation enzymes. The homeostasis of metal ions in the secretory pathway, which is required for proper function and stress response of the Golgi, is tightly regulated and maintained by transporters. Mutations in the transporters cause human diseases. Here we provide a review specifically focusing on the transporters that maintain Golgi metal ion homeostasis under physiological conditions and their alterations in diseases. Full article
(This article belongs to the Section Intracellular and Plasma Membranes)
Show Figures

Figure 1

Figure 1
<p>Ca<sup>2+</sup> concentration and Ca<sup>2+</sup> homeostasis-related molecules in different Golgi sub-compartments. The <span class="html-italic">cis</span>-Golgi expresses mainly SERCA and IP3Rs and contains around 250 µM lumenal Ca<sup>2+</sup>; the medial Golgi mainly expresses SERCA and SPCA1; and the <span class="html-italic">trans-</span>Golgi mainly expresses SPCA1 and RyRs, with a lumenal Ca<sup>2+</sup> of about 130 µM.</p>
Full article ">
14 pages, 1004 KiB  
Review
Role of Mitochondrial Cytochrome P450 2E1 in Healthy and Diseased Liver
by Julie Massart, Karima Begriche, Jessica H. Hartman and Bernard Fromenty
Cells 2022, 11(2), 288; https://doi.org/10.3390/cells11020288 - 15 Jan 2022
Cited by 44 | Viewed by 5851
Abstract
Cytochrome P450 2E1 (CYP2E1) is pivotal in hepatotoxicity induced by alcohol abuse and different xenobiotics. In this setting, CYP2E1 generates reactive metabolites inducing oxidative stress, mitochondrial dysfunction and cell death. In addition, this enzyme appears to play a role in the progression of [...] Read more.
Cytochrome P450 2E1 (CYP2E1) is pivotal in hepatotoxicity induced by alcohol abuse and different xenobiotics. In this setting, CYP2E1 generates reactive metabolites inducing oxidative stress, mitochondrial dysfunction and cell death. In addition, this enzyme appears to play a role in the progression of obesity-related fatty liver to nonalcoholic steatohepatitis. Indeed, increased CYP2E1 activity in nonalcoholic fatty liver disease (NAFLD) is deemed to induce reactive oxygen species overproduction, which in turn triggers oxidative stress, necroinflammation and fibrosis. In 1997, Avadhani’s group reported for the first time the presence of CYP2E1 in rat liver mitochondria, and subsequent investigations by other groups confirmed that mitochondrial CYP2E1 (mtCYP2E1) could be found in different experimental models. In this review, we first recall the main features of CYP2E1 including its role in the biotransformation of endogenous and exogenous molecules, the regulation of its expression and activity and its involvement in different liver diseases. Then, we present the current knowledge on the physiological role of mtCYP2E1, its contribution to xenobiotic biotransformation as well as the mechanism and regulation of CYP2E1 targeting to mitochondria. Finally, we discuss experimental investigations suggesting that mtCYP2E1 could have a role in alcohol-associated liver disease, xenobiotic-induced hepatotoxicity and NAFLD. Full article
(This article belongs to the Section Mitochondria)
Show Figures

Figure 1

Figure 1
<p>Possible role of mitochondrial CYP2E1 in hepatotoxicity induced by ethanol abuse and acetaminophen intoxication. (<b>A</b>) In alcohol-associated liver disease, mitochondrial CYP2E1 (mtCYP2E1) could be involved by two different mechanisms. First, ethanol intoxication increases mtCYP2E1 levels, which can induce reactive oxygen species (ROS) overproduction, Second, mtCYP2E1 might contribute to the generation of acetaldehyde and free radicals such as the 1-hydroxyethyl and hydroxyl radicals. ROS, and possibly acetaldehyde and free radicals, cause reduced glutathione (GSH) depletion, lipid peroxidation and mitochondrial dysfunction. Altogether, these deleterious events contribute to ethanol-induced liver injury. (<b>B</b>) In acetaminophen (APAP) intoxication, mtCYP2E1 generates <span class="html-italic">N</span>-acetyl-<span class="html-italic">p</span>-benzoquinone imine (NAPQI), a highly reactive metabolite inducing ROS overproduction, depletion of GSH and major mitochondrial dysfunction, which causes massive hepatic cytolysis. The lack of UDP-glucuronosyltransferases in mitochondria does not allow the generation of APAP-glucuronide (APAP-GLU), which is a non-toxic APAP metabolite. Importantly, the involvement of mtCYP2E1 in alcohol and APAP-induced hepatotoxicity does not exclude the role of extramitochondrial CYP2E1 in ROS overproduction and reactive intermediate generation.</p>
Full article ">Figure 2
<p>Hypothetical scheme regarding regulation and role of mitochondrial CYP2E1 in nonalcoholic fatty liver disease. In nonalcoholic fatty liver disease (NAFLD), different factors might favor CYP2E1 targeting to mitochondria including hyperglucagonemia, insulin resistance and some fatty acids. Higher levels of mitochondrial CYP2E1 (mtCYP2E1) might then secondarily cause reactive oxygen species (ROS) overproduction, which in turn triggers local lipid peroxidation and decreased activity of the mitochondrial respiratory chain (MRC). Of note, impaired MRC activity enhances ROS production, thus creating a vicious circle (not shown). In NAFLD, ROS and lipid peroxidation are deemed to play a key role in the transition of simple fatty liver to nonalcoholic steatohepatitis (NASH). Importantly, mtCYP2E1 involvement in NAFLD does not exclude the role of microsomal CYP2E1 in ROS overproduction, lipid peroxidation and mitochondrial dysfunction.</p>
Full article ">
13 pages, 3200 KiB  
Article
Oncocytoma-Related Gene Signature to Differentiate Chromophobe Renal Cancer and Oncocytoma Using Machine Learning
by Khaled Bin Satter, Paul Minh Huy Tran, Lynn Kim Hoang Tran, Zach Ramsey, Katheine Pinkerton, Shan Bai, Natasha M. Savage, Sravan Kavuri, Martha K. Terris, Jin-Xiong She and Sharad Purohit
Cells 2022, 11(2), 287; https://doi.org/10.3390/cells11020287 - 15 Jan 2022
Cited by 5 | Viewed by 2606
Abstract
Publicly available gene expression datasets were analyzed to develop a chromophobe and oncocytoma related gene signature (COGS) to distinguish chRCC from RO. The datasets GSE11151, GSE19982, GSE2109, GSE8271 and GSE11024 were combined into a discovery dataset. The transcriptomic differences were identified with unsupervised [...] Read more.
Publicly available gene expression datasets were analyzed to develop a chromophobe and oncocytoma related gene signature (COGS) to distinguish chRCC from RO. The datasets GSE11151, GSE19982, GSE2109, GSE8271 and GSE11024 were combined into a discovery dataset. The transcriptomic differences were identified with unsupervised learning in the discovery dataset (97.8% accuracy) with density based UMAP (DBU). The top 30 genes were identified by univariate gene expression analysis and ROC analysis, to create a gene signature called COGS. COGS, combined with DBU, was able to differentiate chRCC from RO in the discovery dataset with an accuracy of 97.8%. The classification accuracy of COGS was validated in an independent meta-dataset consisting of TCGA-KICH and GSE12090, where COGS could differentiate chRCC from RO with 100% accuracy. The differentially expressed genes were involved in carbohydrate metabolism, transcriptomic regulation by TP53, beta-catenin-dependent Wnt signaling, and cytokine (IL-4 and IL-13) signaling highly active in cancer cells. Using multiple datasets and machine learning, we constructed and validated COGS as a tool that can differentiate chRCC from RO and complement histology in routine clinical practice to distinguish these two tumors. Full article
(This article belongs to the Special Issue New Insights into Kidney Cancer)
Show Figures

Figure 1

Figure 1
<p>Flow chart depicting selection and preparation of chRCC and RO arrays from GEO for meta-analysis.</p>
Full article ">Figure 2
<p>Quality control of the discovery dataset showing batch effects before and after correction. Principal component analysis showing differences in batch (<b>A</b>) is higher than difference in histology (<b>B</b>) for chromophobe (chRCC) and renal oncocytoma (RO) and normal kidney tissue arrays (N) before batch effect correction. After batch correction by empirical bayes (ComBat), histological differences (<b>D</b>) are higher than batch differences (<b>C</b>).</p>
Full article ">Figure 3
<p>Implementation of unsupervised machine learning algorithm (UMLA) for differentiating chRCC and RO: (<b>A</b>) two dimension embedding for the whole genome (n = 15,875 genes) with UMAP, showing two clusters with high concordance with their histological classification; (<b>B</b>) representative map showing optimized final parameter for UMAP, best performing for maximum inter-cluster and minimum intra-cluster distance, red = chRCC, blue = RO; (<b>C</b>) representative map showing poorly fit parameters for UMAP analysis, red = “chRCC, blue = RO; (<b>D</b>) representative iterations for DBU (Iteration no 70, &amp; 136). All 1000 iterations were tracked to determine final groups where support from &gt; 70% iterations were needed, red triangles = cluster 1 in machine learning model, green triangles = cluster 2 in machine learning model (<b>E</b>) group consensus heatmap. Samples are presented in columns and iterations are in rows. Two colors (dark and light blue) represent two DBU groups based on the 1000 iterations of DBU with 1000 random genes in each iteration; (<b>F</b>) Sankey’s diagram tracking all samples from the study to DBU classification, color represents histology type (ChRCC = green, RO = pink). A total of 87/89 samples follow their histological classification with DBU.</p>
Full article ">Figure 4
<p>Gene selection and unsupervised model consistency: (<b>A</b>,<b>B</b>) boxplot showing log2-transformed expression values for (y-axis) for two representative genes (<span class="html-italic">HOOK2</span> and <span class="html-italic">PNPT1</span>) from COGS in chRCC (green) and RO (magenta), outliers are represented with points (black); (<b>C</b>) group consensus heatmap by DBU with 20 random genes from GS30, showing a consistent classification with unsupervised models; (<b>D</b>) heatmap of COGS in meta-analysis showing expression differences between the subtypes.</p>
Full article ">Figure 5
<p>Molecular and pathway analysis: (<b>A</b>) top 194 Differentially expressed genes (candidate genes) between chRCC and RO. Genes are presented in rows and arrays are in columns; (<b>B</b>) bubble plot showing top upregulated pathways in chRCC and RO (x-axes) when compared to normal kidney tissue from gene set enrichment analysis for canonical pathways for differentially expressed genes. Y-axes represent different canonical pathways and size of the bubble represents normalized enrichment score.</p>
Full article ">Figure 6
<p>COGS validation on RNA-Seq (TCGA-KICH) and micro-array dataset (GSE12090): (<b>A</b>) two-dimensional embedding plot with UMAP using COGS showing no batch effect between the studies in the validation dataset; (<b>B</b>) sample plot with histology annotation shows distinct clusters for chRCC (n = 74) and RO (n = 9) with COGS; (<b>C</b>) unsupervised hierarchical clustering with COGS for validation dataset (<b>D</b>) UMAP of TCGA renal cohort showing distinct cluster for chRCC samples (lime green) for COGS.</p>
Full article ">
17 pages, 1620 KiB  
Review
Implication of Adult Hippocampal Neurogenesis in Alzheimer’s Disease and Potential Therapeutic Approaches
by Hesham Essa, Lee Peyton, Whidul Hasan, Brandon Emanuel León and Doo-Sup Choi
Cells 2022, 11(2), 286; https://doi.org/10.3390/cells11020286 - 15 Jan 2022
Cited by 13 | Viewed by 4641
Abstract
Alzheimer’s disease is the most common neurodegenerative disease, affecting more than 6 million US citizens and representing the most prevalent cause for dementia. Neurogenesis has been repeatedly reported to be impaired in AD mouse models, but the reason for this impairment remains unclear. [...] Read more.
Alzheimer’s disease is the most common neurodegenerative disease, affecting more than 6 million US citizens and representing the most prevalent cause for dementia. Neurogenesis has been repeatedly reported to be impaired in AD mouse models, but the reason for this impairment remains unclear. Several key factors play a crucial role in AD including Aβ accumulation, intracellular neurofibrillary tangles accumulation, and neuronal loss (specifically in the dentate gyrus of the hippocampus). Neurofibrillary tangles have been long associated with the neuronal loss in the dentate gyrus. Of note, Aβ accumulation plays an important role in the impairment of neurogenesis, but recent studies started to shed a light on the role of APP gene expression on the neurogenesis process. In this review, we will discuss the recent approaches to neurogenesis in Alzheimer disease and update the development of therapeutic methods. Full article
(This article belongs to the Special Issue Frontiers in Neurogenesis)
Show Figures

Graphical abstract

Graphical abstract
Full article ">Figure 1
<p>This Figure Illustrating the Alterations of Mitochondrial Functions Leads to Alzheimer’s Disease. (<b>A</b>) Mitochondria in Alzheimer’s disease induced the reactive oxygen species (ROS) and reactive nitrogen species (RNS) production that leads to oxidative stress, mitochondrial dysfunctions, damage the protein, lipid, and DNA. (<b>B</b>) Aβ-protein aggregation induced mitochondrial dysfunction through different pathways.</p>
Full article ">Figure 2
<p>Illustration of molecular pathways involving mitochondrial dysfunction, reactive oxygen and nitrogen species, and their roles in the progression of neurodegeneration in AD. Mitochondrial dysfunction leads to enhanced generation of reactive oxygen species, primarily superoxide, which then may be converted to other ROS or combined with nitric oxide ultimately causing nitro-oxidative stress. ROS and RNS may also damage mitochondrial DNA and restrict neurogenesis. Mitochondrial dysfunction also contributes to the induction of apoptotic pathways involving Bcl/BAX and JNK ultimately exacerbating neurodegeneration.</p>
Full article ">Figure 3
<p>The adult hippocampal neurogenic process is hallmarked by the development and subsequent maturation of stem cells into granular cell layer neurons (GCL) in the dentate gyrus (DG). Initiation of this functional journey begins with radial-glia-like stem cells in the hippocampal subgranular zone (SGZ) which differentiate into multipotent progenitors (Type ii a and b) and then into immature neuroblasts/neurons that are subsequentially fated to mature granular cell layer neurons taking approximately four weeks beginning from radial glia-like stem cells and ending with mature GCL neurons. A subset of neurogenesis related immunohistochemical markers that can be utilized to distinguish stages and cell types of adult neurogenesis.</p>
Full article ">
14 pages, 2836 KiB  
Article
Microfluidic Platforms Designed for Morphological and Photosynthetic Investigations of Chlamydomonas reinhardtii on a Single-Cell Level
by Eszter Széles, Krisztina Nagy, Ágnes Ábrahám, Sándor Kovács, Anna Podmaniczki, Valéria Nagy, László Kovács, Péter Galajda and Szilvia Z. Tóth
Cells 2022, 11(2), 285; https://doi.org/10.3390/cells11020285 - 14 Jan 2022
Cited by 8 | Viewed by 3414
Abstract
Chlamydomonas reinhardtii is a model organism of increasing biotechnological importance, yet, the evaluation of its life cycle processes and photosynthesis on a single-cell level is largely unresolved. To facilitate the study of the relationship between morphology and photochemistry, we established microfluidics in combination [...] Read more.
Chlamydomonas reinhardtii is a model organism of increasing biotechnological importance, yet, the evaluation of its life cycle processes and photosynthesis on a single-cell level is largely unresolved. To facilitate the study of the relationship between morphology and photochemistry, we established microfluidics in combination with chlorophyll a fluorescence induction measurements. We developed two types of microfluidic platforms for single-cell investigations: (i) The traps of the “Tulip” device are suitable for capturing and immobilizing single cells, enabling the assessment of their photosynthesis for several hours without binding to a solid support surface. Using this “Tulip” platform, we performed high-quality non-photochemical quenching measurements and confirmed our earlier results on bulk cultures that non-photochemical quenching is higher in ascorbate-deficient mutants (Crvtc2-1) than in the wild-type. (ii) The traps of the “Pot” device were designed for capturing single cells and allowing the growth of the daughter cells within the traps. Using our most performant “Pot” device, we could demonstrate that the FV/FM parameter, an indicator of photosynthetic efficiency, varies considerably during the cell cycle. Our microfluidic devices, therefore, represent versatile platforms for the simultaneous morphological and photosynthetic investigations of C. reinhardtii on a single-cell level. Full article
(This article belongs to the Special Issue Research on Chlamydomonas Cell Biology)
Show Figures

Graphical abstract

Graphical abstract
Full article ">Figure 1
<p>“Tulip” microfluidics platform for capturing and immobilizing individual <span class="html-italic">C. reinhardtii</span> cells enabling the measurement of their photosynthetic activity. (<b>A</b>) Scheme of the device and a scanning electron microscopy image taken in a region of the schematic view. The direction of the flow is indicated by the arrow. (<b>B</b>) Scanning electron microscopy images of single “Tulip” traps in the microfluidic device. (<b>C</b>) Computational modeling of the flow in the device. The density of the streamlines and the color code represent the velocity magnitude.</p>
Full article ">Figure 2
<p>Capturing <span class="html-italic">C. reinhardtii</span> cells and non-photochemical quenching (NPQ) measurements in the “Tulip” microfluidics platform. (<b>A</b>) About 70% of the traps are occupied by single cells in the device. Images were taken using a Fluar 20×/0.75 objective. (<b>B</b>) Computational modeling of the flow when the outlet is blocked by a cell. The density of the streamlines and the color code indicate the velocity magnitude. (<b>C</b>) Bright-field microscopy image of the trapped cells. Images were taken using a Plan-Neofluar 63×/1.25 Oil objective. (<b>D</b>) Maximum Chl <span class="html-italic">a</span> fluorescence (F<sub>M</sub>) measurement of the captured cells in the “Tulip” device, taken by the Microscopy version of Imaging PAM and using a Plan-Neofluar 63×/1.25 Oil objective. (<b>E</b>) NPQ measurements on individual wild-type (CC-4533) and ascorbate-deficient <span class="html-italic">Crvtc2-1</span> cells, grown and measured in TAP medium at about 383 µmol photon m<sup>−2</sup>s<sup>−1</sup>. (<b>F</b>) NPQ measurements on individual wild-type (CC-4533) and ascorbate-deficient <span class="html-italic">Crvtc2-1</span> cells, grown and measured in HSM medium at about 151 µmol photons m<sup>−2</sup>s<sup>−1</sup>. The results represent an average of five to seven measurements with their standard errors.</p>
Full article ">Figure 3
<p>“Pot” microfluidics platform for capturing individual <span class="html-italic">C. reinhardtii</span> cells enabling cell division and the measurement of their photosynthetic activity. (<b>A</b>) Scheme of the device with seven different types of traps located in parallel channels. (<b>B</b>) Scanning electron microscopy images of the individual traps.</p>
Full article ">Figure 4
<p>Comparison of “Pot” trap Types II and VI. (<b>A</b>) Comparison of the trapping efficiency. The cell loading lasted for 60 min and the trapping efficiency was assessed at 30, 120, and 240 min. The results represent the averages of three independent experiments with their standard error. No significant differences were detected between Types II and VI (Student <span class="html-italic">t</span>-test <span class="html-italic">p</span> &lt; 0.05). (<b>B</b>) Scanning electron microscopy images of the traps from above and at tilted angles. (<b>C</b>) Computational modeling of the flow in trap Type II. The density of the streamlines and the color code represent the velocity magnitude. (<b>D</b>) Streamlines of the fluid flow visualized by fluorescent microbeads (1 µm) in trap Type II. (<b>E</b>) Computational modeling of the flow in trap Type VI. The density of the streamlines and the color code represent the velocity magnitude. (<b>F</b>) Streamlines of the fluid flow visualized by fluorescent microbeads (1 µm) in trap Type VI.</p>
Full article ">Figure 5
<p>Cell division in “Pot” trap Type VI. (<b>A</b>) Scheme of the dark–light cycles and the time of cell loading (green arrow) and Chl <span class="html-italic">a</span> fluorescence measurements (red arrows). (<b>B</b>) Bright-field images of the traps with <span class="html-italic">C. reinhardtii</span> cells at the indicated times. (<b>C</b>) F<sub>V</sub>/F<sub>M</sub> values taken at the indicated times. A representative example is shown. Images were taken by using a Plan-Neofluar 63×/1.25 Oil objective. (<b>D</b>) Averages of F<sub>V</sub>/F<sub>M</sub> values (n = 10 to 13) as determined in (<b>C</b>), originating from six independent experiments. One-way ANOVA with Dunnett multiple comparison test using the 2-h sample as control indicates significant differences at <span class="html-italic">p</span> &lt; 0.1 level.</p>
Full article ">
28 pages, 1706 KiB  
Review
Probiotics in the Prevention of the Calcium Oxalate Urolithiasis
by Paulina Wigner, Michał Bijak and Joanna Saluk-Bijak
Cells 2022, 11(2), 284; https://doi.org/10.3390/cells11020284 - 14 Jan 2022
Cited by 34 | Viewed by 8279
Abstract
Nephrolithiasis ranks third among urological diseases in terms of prevalence, making up about 15% of cases. The continued increase in the incidence of nephrolithiasis is most probably due to changes in eating habits (high protein, sodium, and sugar diets) and lifestyle (reduced physical [...] Read more.
Nephrolithiasis ranks third among urological diseases in terms of prevalence, making up about 15% of cases. The continued increase in the incidence of nephrolithiasis is most probably due to changes in eating habits (high protein, sodium, and sugar diets) and lifestyle (reduced physical activity) in all developed countries. Some 80% of all kidney stones cases are oxalate urolithiasis, which is also characterized by the highest risk of recurrence. Frequent relapses of nephrolithiasis contribute to severe complications and high treatment costs. Unfortunately, there is no known effective way to prevent urolithiasis at present. In cases of diet-related urolithiasis, dietary changes may prevent recurrence. However, in some patients, the condition is unrelated to diet; in such cases, there is evidence to support the use of stone-related medications. Interestingly, a growing body of evidence indicates the potential of the microbiome to reduce the risk of developing renal colic. Previous studies have primarily focused on the use of Oxalobacterformigenes in patients with urolithiasis. Unfortunately, this bacterium is not an ideal probiotic due to its antibiotic sensitivity and low pH. Therefore, subsequent studies sought to find bacteria which are capable of oxalate degradation, focusing on well-known probiotics including Lactobacillus and Bifidobacterium strains, Eubacterium lentum, Enterococcus faecalis, and Escherichia coli. Full article
Show Figures

Figure 1

Figure 1
<p>In supersaturated urine, calcium and oxalate combine to form initially microscopic insoluble crystals. This is the first stage of deposit formation (nucleus formation). Then, individual microcrystals combine into larger forms (crystal growth), which, in turn, can aggregate together to form large, stable deposits (crystal aggregation) [<a href="#B34-cells-11-00284" class="html-bibr">34</a>,<a href="#B35-cells-11-00284" class="html-bibr">35</a>]. In the next stage, the crystals interact with the cells of the renal tubular epithelium. Crystal–cell interaction causes the movement of crystals from the basolateral side of cells to the basal membrane [<a href="#B36-cells-11-00284" class="html-bibr">36</a>]. Injured cells release substances such as the kidney fragment of prothrombin−1 or other anionic proteins that induce crystal agglomeration [<a href="#B37-cells-11-00284" class="html-bibr">37</a>]. Moreover, injured cells can invert their cell membrane, which is anionic to the urinary environment and acts as a place of crystal adhesion. The inverted cell membrane makes it easy for other crystals to attach [<a href="#B38-cells-11-00284" class="html-bibr">38</a>]. Exposure to calcium oxalate crystals induces oxidative stress in renal epithelial cells. In addition, calcium oxalate influences the composition and function of the renal epithelial cell membrane. Calcium oxalate crystals destroy tight junctions and the polarity of the cell membrane that carries the components of the basolateral or tight junction region to the apical surface of the cell, which, in turn, leads to rupture of the cell membrane and the release of intracellular organic substances. Damaged tubular epithelial cells also show increased expression of crystal adhesion molecules such as hyaluronan, osteopontin, and CD44, which promote crystal adhesion and retention. Endocytosed crystals adversely affect mitochondrial function, causing abnormality in the respiratory chain and increasing the mitochondrial production of reactive oxygen species (ROS), which may damage, and induce apoptosis of, renal epithelial cells [<a href="#B39-cells-11-00284" class="html-bibr">39</a>].</p>
Full article ">Figure 2
<p>Oxalate metabolism by <span class="html-italic">Oxalobacter formigenes.</span> OxIT—oxalate transporter, Oxc—oxalyl-CoA decarboxylase, Frc—formyl-CoA transferase.</p>
Full article ">
13 pages, 2587 KiB  
Article
Structure and Function of the ABCD1 Variant Database: 20 Years, 940 Pathogenic Variants, and 3400 Cases of Adrenoleukodystrophy
by Eric J. Mallack, Kerry Gao, Marc Engelen and Stephan Kemp
Cells 2022, 11(2), 283; https://doi.org/10.3390/cells11020283 - 14 Jan 2022
Cited by 25 | Viewed by 4787
Abstract
The progressive neurometabolic disorder X-linked adrenoleukodystrophy (ALD) is caused by pathogenic variants in the ABCD1 gene, which encodes the peroxisomal ATP-binding transporter for very-long-chain fatty acids. The clinical spectrum of ALD includes adrenal insufficiency, myelopathy, and/or leukodystrophy. A complicating factor in disease management [...] Read more.
The progressive neurometabolic disorder X-linked adrenoleukodystrophy (ALD) is caused by pathogenic variants in the ABCD1 gene, which encodes the peroxisomal ATP-binding transporter for very-long-chain fatty acids. The clinical spectrum of ALD includes adrenal insufficiency, myelopathy, and/or leukodystrophy. A complicating factor in disease management is the absence of a genotype–phenotype correlation in ALD. Since 1999, most ABCD1 (likely) pathogenic and benign variants have been reported in the ABCD1 Variant Database. In 2017, following the expansion of ALD newborn screening, the database was rebuilt. To add an additional level of confidence with respect to pathogenicity, for each variant, it now also reports the number of cases identified and, where available, experimental data supporting the pathogenicity of the variant. The website also provides information on a number of ALD-related topics in several languages. Here, we provide an updated analysis of the known variants in ABCD1. The order of pathogenic variant frequency, overall clustering of disease-causing variants in exons 1–2 (transmembrane domain spanning region) and 6–9 (ATP-binding domain), and the most commonly reported pathogenic variant p.Gln472Argfs*83 in exon 5 are consistent with the initial reports of the mutation database. Novel insights include nonrandom clustering of high-density missense variant hotspots within exons 1, 2, 6, 8, and 9. Perhaps more importantly, we illustrate the importance of collaboration and utility of the database as a scientific, clinical, and ALD-community-wide resource. Full article
(This article belongs to the Special Issue Peroxisomal Disorders: Development of Targeted Therapies)
Show Figures

Figure 1

Figure 1
<p>Dandelion plot illustrating variant density in <span class="html-italic">ABCD1</span> (density is indicated by height of dandelion). (<b>A</b>) All variants (pathogenic, benign, VUS, and synonymous) in the <span class="html-italic">ABCD1</span> gene (open circles). The highest variant density is in exon 6 followed by exon 1. (<b>B</b>) Only pathogenic variants in the <span class="html-italic">ABCD1</span> gene (red pins) are shown. The highest event burden and pathogenic variant density are in exon 1 followed by exon 6. (<b>C</b>) All pathogenic variants in exon 1.</p>
Full article ">Figure 2
<p>Missense variant density by chromosome position: (<b>A</b>) across the <span class="html-italic">ABCD1</span> gene, (<b>B</b>) exon 1, (<b>C</b>) exon 2, (<b>D</b>) exon 6, (<b>E</b>) exon 8, and (<b>F</b>) exon 9. Exons are indicated in orange, the PEX19-binding site is indicated in blue, the transmembrane segments are indicated in green and Walker A and B and the ABC signature are indicated in red.</p>
Full article ">Figure 3
<p>The evolutionary conservation of each amino acid within the ABCD1 protein based multiple sequence alignment among 54 different species. The overall height of each symbol represents the relative frequency of each amino acid at that position. Positively charged amino acids (KRH) are in blue; negatively charged amino acids (DE) are in red. Exons are indicated in alternating blue–pink–blue, etc.; the PEX19-binding site is indicated in blue; the 6 transmembrane segments are indicated in green; Walker A and B and the ABC signature are indicated in orange. Error bars indicating an approximate Bayesian 95% confidence interval are indicated in grey.</p>
Full article ">
16 pages, 4719 KiB  
Article
Freeze-Dried Curdlan/Whey Protein Isolate-Based Biomaterial as Promising Scaffold for Matrix-Associated Autologous Chondrocyte Transplantation—A Pilot In-Vitro Study
by Katarzyna Klimek, Marta Tarczynska, Wieslaw Truszkiewicz, Krzysztof Gaweda, Timothy E. L. Douglas and Grazyna Ginalska
Cells 2022, 11(2), 282; https://doi.org/10.3390/cells11020282 - 14 Jan 2022
Cited by 11 | Viewed by 2810
Abstract
The purpose of this pilot study was to establish whether a novel freeze-dried curdlan/whey protein isolate-based biomaterial may be taken into consideration as a potential scaffold for matrix-associated autologous chondrocyte transplantation. For this reason, this biomaterial was initially characterized by the visualization of [...] Read more.
The purpose of this pilot study was to establish whether a novel freeze-dried curdlan/whey protein isolate-based biomaterial may be taken into consideration as a potential scaffold for matrix-associated autologous chondrocyte transplantation. For this reason, this biomaterial was initially characterized by the visualization of its micro- and macrostructures as well as evaluation of its mechanical stability, and its ability to undergo enzymatic degradation in vitro. Subsequently, the cytocompatibility of the biomaterial towards human chondrocytes (isolated from an orthopaedic patient) was assessed. It was demonstrated that the novel freeze-dried curdlan/whey protein isolate-based biomaterial possessed a porous structure and a Young’s modulus close to those of the superficial and middle zones of cartilage. It also exhibited controllable degradability in collagenase II solution over nine weeks. Most importantly, this biomaterial supported the viability and proliferation of human chondrocytes, which maintained their characteristic phenotype. Moreover, quantitative reverse transcription PCR analysis and confocal microscope observations revealed that the biomaterial may protect chondrocytes from dedifferentiation towards fibroblast-like cells during 12-day culture. Thus, in conclusion, this pilot study demonstrated that novel freeze-dried curdlan/whey protein isolate-based biomaterial may be considered as a potential scaffold for matrix-associated autologous chondrocyte transplantation. Full article
(This article belongs to the Collection Advances in Cell Culture and Tissue Engineering)
Show Figures

Graphical abstract

Graphical abstract
Full article ">Figure 1
<p>General procedure of isolation and identification of primary human chondrocytes.</p>
Full article ">Figure 2
<p>Stereoscopic microscopy (<b>a</b>) and SEM (<b>b</b>) images showing macro- and microstructures of the novel Cur_WPI scaffold. The magnification and scale bar of the SEM image were 500× and 10 μm, respectively.</p>
Full article ">Figure 3
<p>Degradation percentage of Cur_WPI biomaterial after 9-week incubation in PBS and 0.02% collagenase II solution. * Significantly different results compared with data obtained in PBS solution; <sup>#</sup> significantly different results between data obtained in 0.02% collagenase solution after different time of incubation; one-way ANOVA test followed by Tukey’s multiple comparison, <span class="html-italic">p</span> &lt; 0.05.</p>
Full article ">Figure 4
<p>Relative expression level of genes: collagen II, aggrecan, and SOX-9 in freshly isolated chondrocytes. The results were normalized to the expression level of collagen I in isolated cells. * Significantly different results compared with expression level of collagen I; <sup><span>$</span></sup> significantly different results compared with expression level of aggrecan; <sup>#</sup> significantly different results compared with expression level of SOX-9; one-way ANOVA test followed by Tukey’s multiple comparison, <span class="html-italic">p</span> &lt; 0.05.</p>
Full article ">Figure 5
<p>Confocal microscope images showing viability of chondrocytes cultured on Cur_WPI biomaterial and polystyrene (PS) after 48-h incubation. Live cells emitted green fluorescence, while dead cells gave red fluorescence. Magnification 100×, scale bar was 150 μm.</p>
Full article ">Figure 6
<p>Proliferation of chondrocytes after 4, 8, and 12 days of culture (<b>a</b>). The results were obtained via a WST-8 assay (* significantly different results between Cur_WPI biomaterial and polystyrene (PS) at the same time of incubation; <sup><span>$</span></sup> significantly different results compared with Cur_WPI biomaterial at day 4; <sup>#</sup> significantly different results compared with Cur_WPI biomaterial at day 8; <sup>%</sup> significantly different results compared with PS at day 4; one-way ANOVA test followed by Tukey’s multiple comparison, <span class="html-italic">p</span> &lt; 0.05). Confocal microscope images showing morphology of chondrocytes cultured on Cur_WPI biomaterial and polystyrene (PS, control) after 4-, 8-, and 12-day incubation (<b>b</b>). Nuclei emitted blue fluorescence (visible blue fluorescence in the structure of biomaterial was emitted by WPI), while F-actin filaments gave red fluorescence; magnification 200×, scale bar equals 70 μm.</p>
Full article ">Figure 7
<p>Relative expression of genes: collagen I, collagen II, aggrecan, and SOX-9 in chondrocytes cultured on Cur_WPI scaffold for 12 days. The results were normalized to expression levels of genes in cells cultured on polystyrene. * Significantly different results between expression level of evaluated genes; one-way ANOVA test followed by Tukey’s multiple comparison, <span class="html-italic">p</span> &lt; 0.05.</p>
Full article ">Figure 8
<p>Confocal microscope images presenting characteristic markers—collagen II, aggrecan, and SOX-9 after the 12-day culturing of chondrocytes on Cur_WPI biomaterials and polystyrene (PS). Collagen I was also visualized to determine chondrocyte dedifferentiation towards fibroblast-like cells. Nuclei emitted blue fluorescence, while evaluated markers gave green fluorescence (visible green fluorescence in the structure of biomaterial was emitted by WPI); magnification 200×, scale bar equals 70 μm.</p>
Full article ">
15 pages, 36250 KiB  
Article
Wnt Signaling Rescues Amyloid Beta-Induced Gut Stem Cell Loss
by Prameet Kaur, Ellora Hui Zhen Chua, Wen Kin Lim, Jiarui Liu, Nathan Harmston and Nicholas S. Tolwinski
Cells 2022, 11(2), 281; https://doi.org/10.3390/cells11020281 - 14 Jan 2022
Cited by 5 | Viewed by 3305
Abstract
Patients with Alzheimer’s disease suffer from a decrease in brain mass and a prevalence of amyloid-β plaques. These plaques are thought to play a role in disease progression, but their exact role is not entirely established. We developed an optogenetic model to induce [...] Read more.
Patients with Alzheimer’s disease suffer from a decrease in brain mass and a prevalence of amyloid-β plaques. These plaques are thought to play a role in disease progression, but their exact role is not entirely established. We developed an optogenetic model to induce amyloid-β intracellular oligomerization to model distinct disease etiologies. Here, we examine the effect of Wnt signaling on amyloid in an optogenetic, Drosophila gut stem cell model. We observe that Wnt activation rescues the detrimental effects of amyloid expression and oligomerization. We analyze the gene expression changes downstream of Wnt that contribute to this rescue and find changes in aging related genes, protein misfolding, metabolism, and inflammation. We propose that Wnt expression reduces inflammation through repression of Toll activating factors. We confirm that chronic Toll activation reduces lifespan, but a decrease in the upstream activator Persephone extends it. We propose that the protective effect observed for lithium treatment functions, at least in part, through Wnt activation and the inhibition of inflammation. Full article
(This article belongs to the Section Cell Signaling)
Show Figures

Figure 1

Figure 1
<p>The optogenetic amyloid system in embryos. (<b>a</b>) Scheme of light-induced Aβ-Cry2mCh clustering in <span class="html-italic">Drosophila melanogaster</span> resulting in activation of inflammatory processes which can be rescued by Wnt. Stills from <a href="#app1-cells-11-00281" class="html-app">Video S1</a> (<b>b</b>), <a href="#app1-cells-11-00281" class="html-app">Video S2</a> (<b>c</b>), <a href="#app1-cells-11-00281" class="html-app">Video S3</a> (<b>d</b>), <a href="#app1-cells-11-00281" class="html-app">Video S4</a> (<b>e</b>). Arrowhead is pointing to nervous system constriction.</p>
Full article ">Figure 2
<p>Wnt expression in the <span class="html-italic">Drosophila</span> gut. (<b>a</b>) Model of the <span class="html-italic">Drosophila</span> gut comprising enterocytes (ECs), enteroendocrine (EEs), enteroblasts (EBs) and intestinal stem cells (ISCs). ISCs rest on the external surface of the gut epithelium away from the gut lumen and divide symmetrically to make more ISCs or asymmetrically to form EBs. (<b>b</b>) Representative midgut section of a wg-Gal4 &gt; 10× GFP fly.</p>
Full article ">Figure 3
<p>Wnt and amyloid expression in ISCs. Images of midgut sections of (<b>a</b>–<b>a”</b>) esg-Gal4 &gt; UAS-GFP, UAS-Td-Tomato flies, (<b>b</b>–<b>b”</b>) esg-Gal4 &gt; UAS-GFP, UAS-Aβ<sup>1−42</sup>-CRY2-mCh flies kept in the dark, (<b>c</b>–<b>c”</b>) esgGal4 &gt; UAS-GFP, UAS-wg, UAS-Aβ<sup>1−42</sup>-CRY2-mCh flies kept in the dark, (<b>d</b>–<b>d”</b>) esg-Gal4 &gt; UAS-GFP, UAS-Aβ<sup>1−42</sup>-CRY2-mCh flies kept in the light, (<b>e</b>–<b>e”</b>) esg-Gal4 &gt; UAS-GFP, UAS-wg, UAS-Aβ<sup>1−42</sup>-CRY2-mCh flies kept in the light and (<b>f</b>–<b>f”</b>) esg-Gal4 &gt; UAS-GFP, UAS-wg, UAS-myr-Tomato flies. Scale bar represents 10 µm.</p>
Full article ">Figure 4
<p>Lifespan decrease rescued by Wnt expression. Lifespan analysis of flies expressing TdTomato (control), Wg, Aβ-CRY2-mCh + Wg and Aβ-CRY2-mCh in gut stem cells. Genotype: <span class="html-italic">TdTomato</span>—esg-Gal4&gt;UAS-GFP, UAS-Td-Tomato; <span class="html-italic">Wg</span>—esg-Gal4&gt; UAS-GFP, UAS-wg, <span class="html-italic">Aβ-CRY2-mCh + Wg</span>—esg-Gal4&gt; UAS-GFP, UAS-wg, UAS-Aβ<sup>1-42</sup>-CRY2-mCh; <span class="html-italic">Aβ-CRY2-mCh</span>—esg-Gal4&gt; UAS-GFP, UAS- Aβ<sup>1-42</sup>-CRY2-mCh. (<b>a</b>) The lifespan curves for the various genotypes, and (<b>b</b>) table showing the number of subjects with mean lifespans and <span class="html-italic">p</span>-values. (<b>c</b>) Diagram showing lithium-induced activation of the Wnt pathway inhibiting Toll signalling. Raw data provided in <a href="#app1-cells-11-00281" class="html-app">Supplemental Table S4</a>.</p>
Full article ">Figure 5
<p>Gene expression changes in response to amyloid and Wnt. (<b>a</b>) Principal components analysis of RNA-seq data reveals clear separation of samples by experimental condition (<b>b</b>) Clustering of differentially expressed genes identifies six clusters with distinct expression patterns across the four conditions (<b>c</b>) Expression profiles of representative genes for each of the six clusters (<b>d</b>) KEGG pathway enrichments identifies key developmental and homeostatic pathways associated with the individual clusters (FDR &lt; 10%) (<b>e</b>) Biological process (GO:BP) analysis identifies distinct processes enriched in each of the clusters (FDR &lt; 10%). (<b>f</b>) Expression profiles of genes from Cluster I which are relevant to AD biology.</p>
Full article ">Figure 6
<p>Activated Toll reduces lifespan. Lifespan analysis of TdTomato (control) dark and light, Toll-Cry2-mCh dark and light in the whole fly, Toll-Cry2-mCh dark and light expression in the ISCs only. Genotype: TdTomato—Arm-Gal4 &gt; UAS-Td-Tomato; Toll-Cry2—ArmGal4 &gt; UAS-Toll-Cry2-mCh; Toll-Cry2 (ISCs)—esg-Gal4 &gt; UAS-GFP, UAS-Toll-Cry2-mCh. (<b>a</b>) The lifespan curves for the various genotypes, and (<b>b</b>) table showing the number of subjects with mean lifespans and <span class="html-italic">p</span>-values. Raw data provided in <a href="#app1-cells-11-00281" class="html-app">Supplemental Table S5</a>.</p>
Full article ">Figure 7
<p>Knockdown of persephone extends lifespan. Lifespan analysis of TdTomato (control), psh-RNAi and Dif-RNAi in the whole fly. Genotype: TdTomato—Arm-Gal4 &gt; UAS-Td-Tomato; Dif RNAi—ArmGal4 &gt; UAS-Dif RNAi; Psh RNAi—Arm-Gal4 &gt; UAS-Psh RNAi. (<b>a</b>) The lifespan curves for the various genotypes, and (<b>b</b>) table showing the number of subjects with mean lifespans and <span class="html-italic">p</span>-values. Raw data provided in <a href="#app1-cells-11-00281" class="html-app">Supplemental Table S6</a>.</p>
Full article ">
Previous Issue
Back to TopTop