[go: up one dir, main page]

Next Issue
Volume 12, March
Previous Issue
Volume 12, January


Agronomy, Volume 12, Issue 2 (February 2022) – 313 articles

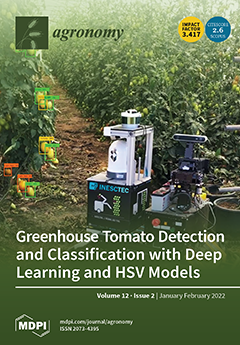
Cover Story (view full-size image): Society seeks to reduce the labour needed in food production. Tomato is the second most harvested vegetable worldwide, and a large fraction of labour costs in greenhouse production is absorbed by the harvesting operation. Being a recurrent task, it becomes an excellent candidate for automation. The development of an accurate fruit detection system is a crucial step to achieve a fully automated robotic harvest. In this study, deep learning models were used for the detection of greenhouse tomatoes and compared with a conventional method based on the HSV colour space for classification based on ripeness.  The results obtained by both approaches highlight their potential use in fruit detection and classification. View this paper.
  • Issues are regarded as officially published after their release is announced to the table of contents alert mailing list.
  • You may sign up for e-mail alerts to receive table of contents of newly released issues.
  • PDF is the official format for papers published in both, html and pdf forms. To view the papers in pdf format, click on the "PDF Full-text" link, and use the free Adobe Reader to open them.
Order results
Result details
Section
Select all
Export citation of selected articles as:
18 pages, 3896 KiB  
Article
The Role of Soil Moisture Information in Developing Robust Climate Services for Smallholder Farmers: Evidence from Ghana
by Samuel J. Sutanto, Spyridon Paparrizos, Gordana Kranjac-Berisavljevic, Baba M. Jamaldeen, Abdulai K. Issahaku, Bizoola Z. Gandaa, Iwan Supit and Erik van Slobbe
Agronomy 2022, 12(2), 541; https://doi.org/10.3390/agronomy12020541 - 21 Feb 2022
Cited by 7 | Viewed by 3474
Abstract
In Ghana, most of the farmers are engaged in small-scale rainfed farming where the success is influenced by the prevailing weather conditions. Current Climate Information Services (CISs) only provide information on rainfall conditions to reduce their farming vulnerability to climate extremes. Access to [...] Read more.
In Ghana, most of the farmers are engaged in small-scale rainfed farming where the success is influenced by the prevailing weather conditions. Current Climate Information Services (CISs) only provide information on rainfall conditions to reduce their farming vulnerability to climate extremes. Access to other practical knowledge, such as soil moisture content would benefit farmers further in the decision-making process. This study aims to assess the role of soil moisture information in farmers’ agricultural decision-making and to understand how this information is being perceived, assessed, and applied. Exploratory research, combined with field visits and farmer interviews, was carried out in Gbulung, Napakzoo, and Yapalsi communities in the outskirts of Tamale, northern Ghana in October–December 2021. Results show that soil moisture information is highly important for activities, such as fertilizer application and sowing. Soil moisture information, however, is not readily available to the farmers, causing them to rely solely on their indigenous knowledge to monitor the soil moisture conditions. Our study reveals that developing a CIS embedded with soil moisture advisory module (CIS-SM) will help farmers in conducting strategic and tactical decision-making in their daily farming activities. Full article
Show Figures

Figure 1

Figure 1
<p>Map showing locations of the study area in northern Ghana. Gbulung community is located in the Kumbungu district, northwest of Tamale, the regional capital, while Nakpanzoo and Yapalsi communities are located at the Savelugu district north of the Tamale.</p>
Full article ">Figure 2
<p>Agricultural-related information received by the smallholder farmers and their dependency on weather and water information for farming decision-making. (<b>a</b>) Source of information, (<b>b</b>) type of information, (<b>c</b>) frequency of information received by farmers, dependency on water (mainly runoff and residual water content) and weather information.</p>
Full article ">Figure 3
<p>Farmer perception on (<b>a</b>) the importance of weather and water-related information and (<b>b</b>) the quality of weather and water-related information. Acronym Imp stands for important.</p>
Full article ">Figure 4
<p>Information related to soil moisture measurement: (<b>a</b>) percentage of farmers measures soil moisture by feeling, (<b>b</b>) percentage of farmers measures soil moisture by smell, and (<b>c</b>) depth of measurement.</p>
Full article ">Figure 5
<p>Farmers’ perception on the importance of soil moisture in farming decision-making stages. Acronym impt stands for important.</p>
Full article ">Figure 6
<p>(<b>a</b>) Farmer’s perception on the importance of forecast information, (<b>b</b>) the percentage of forecast lead-time needs by smallholder farmers, and (<b>c</b>) forecast variable needs of smallholder farmers. R stands for Rainfall, T stands for Temperature, H stands for humidity, S stands for storm, and SM stands for soil moisture.</p>
Full article ">
19 pages, 2135 KiB  
Article
Effects of Tray-Drying on the Physicochemical, Microbiological, Proximate, and Sensory Properties of White- and Red-Fleshed Loquat (Eriobotrya Japonica Lindl.) Fruit
by Ilenia Tinebra, Roberta Passafiume, Dario Scuderi, Antonino Pirrone, Raimondo Gaglio, Eristanna Palazzolo and Vittorio Farina
Agronomy 2022, 12(2), 540; https://doi.org/10.3390/agronomy12020540 - 21 Feb 2022
Cited by 9 | Viewed by 4580
Abstract
Loquat fruits, highly valued by consumers for their characteristic aroma and pleasant taste, have a short post-harvest life and are susceptible to mechanical damage, loss of firmness, and initial organoleptic characteristics. The aim of this work was to develop a drying method suitable [...] Read more.
Loquat fruits, highly valued by consumers for their characteristic aroma and pleasant taste, have a short post-harvest life and are susceptible to mechanical damage, loss of firmness, and initial organoleptic characteristics. The aim of this work was to develop a drying method suitable for storing loquat fruits in polyamide/polyethylene (PA/PE) bags containing two gaseous mixtures (treatments): MAPN2 (100% N2) and MAPP (21% O2 and 0.04% CO2), at room temperature (20 ± 1 °C) for at least 2 months. The effects of these conditions on the physico-chemical, microbiological, proximate, and sensory properties of fruit stored over a 50-day time interval were studied. The results showed that convective tray dehydration treatment at 70° for 12 h had good drying efficiency for loquat slices. In addition, the MAPN2 packaging limited the browning of the slices, keeping the microbial groups below the detection limits, with a clear positive effect on some minerals and vitamins, which were higher in concentration compared to the MAPP-packed samples. From an applicative point of view, the tray drying method for loquat fruits is useful on a small scale but could also be easily industrialized. Full article
Show Figures

Figure 1

Figure 1
<p>A representative sample of the cultivars Claudia (<b>a</b>) and Peluche (<b>b</b>) after 50 days of storage with MAP N<sub>2</sub> and MAP P treatment.</p>
Full article ">Figure 2
<p>Firmness values of the dehydrated loquat slices over the period of storage. Asterisks between box plots indicate statistical significance of difference using Student’s T-statistic with *—<span class="html-italic">p</span> &lt; 0.05, **—<span class="html-italic">p</span> &lt; 0.01. No asterisk indicates a non-significant difference between the means of the treatments.</p>
Full article ">Figure 3
<p>Chroma (<span class="html-italic">C</span>*<sub>ab</sub>) values of the dehydrated loquat samples analyzed over the course of the experiment. Box plots are filled with the median color value of the group, transformed from the CIE <span class="html-italic">L</span>*<span class="html-italic">a</span>*<span class="html-italic">b</span>* color space into printable hexadecimal values using the R package color-space. Asterisks between box plots indicate statistical significance of difference using Student’s T-statistic, with *—<span class="html-italic">p</span> &lt; 0.05, and ***—<span class="html-italic">p</span> &lt; 0.001. No asterisk indicates a non-significant difference between the means of the treatments.</p>
Full article ">Figure 4
<p>Hue angle (<span class="html-italic">h</span>°) values of the dehydrated loquat samples analyzed over the course of the experiment. Box plots are filled with the median color value of the group, transformed from the CIE <span class="html-italic">L</span>*<span class="html-italic">a</span>*<span class="html-italic">b</span>* color space into printable hexadecimal values using the R package color-space. Asterisks between box plots indicate statistical significance of difference using Student’s T-statistic, with **—<span class="html-italic">p</span> &lt; 0.01. No asterisk indicates a non-significant difference between the means of the treatments.</p>
Full article ">Figure 5
<p>Color difference (Δ<span class="html-italic">E</span>) of the dehydrated loquat slices compared after the various storage times compared to the color measured on the freshly dehydrated slices just after the dehydration process. Box plots are filled with the median color value of the group, transformed from the CIE <span class="html-italic">L</span>*<span class="html-italic">a</span>*<span class="html-italic">b</span>* color space into printable hexadecimal values using the R package color-space. Asterisks between box plots indicate statistical significance of difference using Student’s T-statistic, with ***—<span class="html-italic">p</span> &lt; 0.001. No asterisk indicates a non-significant difference between the means of the treatments.</p>
Full article ">Figure 6
<p>Results of the sensory analysis conducted on the dehydrated loquat slices at 0 (<b>a</b>), 10 (<b>b</b>), 20 (<b>c</b>), 30 (<b>d</b>), 40 (<b>e</b>), and 50 (<b>f</b>) days of storage. Legend: visual appearance (VA); color (CL); browning (BR); loquat odor (OL); honey odor (OH); off-odor (OO); crispness (FF); softness (GM); juiciness (JUI); loquat flavor (FL); caramel flavor (FC); sweetness (SW); acidity (AC); sourness (SO).</p>
Full article ">
13 pages, 1605 KiB  
Article
Acclimatization of In Vitro Banana Seedlings Using Root-Applied Bio-Nanofertilizer of Copper and Selenium
by Tarek A. Shalaby, Said M. El-Bialy, Mohammed E. El-Mahrouk, Alaa El-Dein Omara, Hossam S. El-Beltagi and Hassan El-Ramady
Agronomy 2022, 12(2), 539; https://doi.org/10.3390/agronomy12020539 - 21 Feb 2022
Cited by 15 | Viewed by 2665
Abstract
The production of in vitro banana transplants has become an important practice in the global banana production. Proper and enough nutrients are needed for banana production particularly during the acclimatization period. To avoid the environmental problem resulting from the chemical fertilizers, nanofertilizers of [...] Read more.
The production of in vitro banana transplants has become an important practice in the global banana production. Proper and enough nutrients are needed for banana production particularly during the acclimatization period. To avoid the environmental problem resulting from the chemical fertilizers, nanofertilizers of Se and Cu were separately applied during the acclimatization of banana. The biological form of nano-Cu (50 and 100 mg L−1) and nano-Se (25, 50, 75, and 100 mg L−1) were studied on acclimatized banana transplants under greenhouse conditions. Both applied nanofertilizers enhanced the growth of transplant by 10.9 and 12.6% for dry weight after nano-Se and nano-Cu application up to 100 mg L−1, respectively. The survival rate was also increased by increasing applied doses of both nanofertilizers up to 100 mg L−1, whereas the highest survival rate (95.3%) was recorded for nano-Cu. All studied photosynthetic pigments and its fluorescence were improved by applying nanofertilizers. Studied antioxidant enzymatic activities (CAT, PPO, and POX) were also increased. A pH decrease in the growing medium was noticed after applying nano-Cu, which may explain the high bioavailability of studied nutrients (N, P, K, Cu, Fe, Se, and Zn) by banana transplants. Full article
(This article belongs to the Special Issue The Role of Plant Biostimulants in Stressful Agriculture)
Show Figures

Figure 1

Figure 1
<p>Effect of different concentrations of nano-Se and nano-Cu on some vegetative growth of banana transplants (dry weight, height, leaves number per plant), survival rate %. (Abbreviations: T1, T2, T3, T4 and T5 represent control, 25, 50, 75, 100 mg L<sup>−1</sup> nano-Se, respectively, whereas T6 and T7 represent 50, 100 mg L<sup>−1</sup> nano-Cu. Values are means ± standard deviation (SD) from three replicates.) Columns have the same letter are not significant according to Duncan’s multiple range test at <span class="html-italic">p</span> ≤ 0.05.</p>
Full article ">Figure 2
<p>Effect of different concentrations of nano-Se and nano-Cu on some vegetative growth of banana plants (plant diameter, root height per plant and number of roots per plant). (Abbreviations: T1, T2, T3, T4 and T5 represent control, 25, 50, 75, 100 mg L<sup>−1</sup> nano- Se, respectively, whereas T6 and T7 represent 50, 100 mg L<sup>−1</sup> nano-Cu. Values are means ± standard deviation (SD) from three replicates.) Columns have the same letter are not significant according to Duncan’s multiple range test at <span class="html-italic">p</span> ≤ 0.05.</p>
Full article ">Figure 3
<p>General photos for different treatments, which present different doses of applied nano-Se and nano-Cu.</p>
Full article ">Figure 4
<p>Effect of different concentrations of nano-Se particles on Ch a, Ch b, total Ch and carotenoids in banana leaves. (Abbreviations: T1, T2, T3, T4 and T5 represent control, 25, 50, 75, 100 mg L<sup>−1</sup> nano-Se, respectively, whereas T6 and T7 represent 50, 100 mg L<sup>−1</sup> nano-Cu. Values are means ± standard deviation (SD) from three replicates). Columns have the same letter are not significant according to Duncan’s multiple range test at <span class="html-italic">p</span> ≤ 0.05.</p>
Full article ">Figure 5
<p>Effect of different concentrations of nano-Se particles on antioxidant activities, catalase (CAT), poly phenol oxidase (PPO) and peroxidase (POX) in banana leaves. (Abbreviations: T1, T2, T3, T4 and T5 represent control, 25, 50, 75, 100 mg L<sup>−1</sup> nano-Se, respectively, whereas T6 and T7 represent 50, 100 mg L<sup>−1</sup> nano-Cu. Values are means ± standard deviation (SD) from three replicates.).Columns have the same letter are not significant according to Duncan’s multiple range test at <span class="html-italic">p</span> ≤ 0.05.</p>
Full article ">
15 pages, 2269 KiB  
Communication
Monitoring and Inference of Behavioral Resistance in Beneficial Insects to Insecticides in Two Pest Control Systems: IPM and Organic
by José Alfonso Gómez-Guzmán, María Sainz-Pérez and Ramón González-Ruiz
Agronomy 2022, 12(2), 538; https://doi.org/10.3390/agronomy12020538 - 21 Feb 2022
Cited by 4 | Viewed by 2465
Abstract
Pyrethrins are the most widely used insecticide class in olive groves with organic management. Although there are data sets about insect pests of stored products and human parasites developing resistance to pyrethrins, there is no information on the long-term effect on olive agroecosystems. [...] Read more.
Pyrethrins are the most widely used insecticide class in olive groves with organic management. Although there are data sets about insect pests of stored products and human parasites developing resistance to pyrethrins, there is no information on the long-term effect on olive agroecosystems. A field method based on the experimental induction of sublethal effects by means of insecticide application, and the monitoring of the response of insects through post-treatment sampling, has recently been developed. This method has allowed for the detection of populations behaviorally resistant to organophosphates in integrated pest management (IPM) and conventional crops. With the application of a similar methodology, this study aimed to verify the possible reaction of natural enemies in organic crops, using pyrethrins as an inducing insecticide. The study was carried out in 2019 in two olive groves in southern Spain (Jaén, Andalusia), one of them being IPM and the other being an organic production system. The results did not allow for verification of the behavioral resistance in populations of natural enemies of both IPM and organic management against pyrethrins, while against dimethoate, behavioral resistance was verified in IPM management. The possible causes involved in obtaining these results are discussed. Full article
Show Figures

Figure 1

Figure 1
<p>Location of the selected olive groves in the municipality of Jaén: Integrated pest management (IPM) and organic (ORG). Source: Own elaboration using the Google Earth Pro geographic information system.</p>
Full article ">Figure 2
<p>Distribution of the plots into the three organic olive grove blocks. Source: Own elaboration using the Google Earth Pro geographic information system.</p>
Full article ">Figure 3
<p>Abundance values obtained by the species in the control plots of the organic (light color) and IPM (dark color) olive groves.</p>
Full article ">Figure 4
<p>Statistic capture values (median, quartile 25, quartile 75, maximum, and minimum) of the major beneficial species in the control plots of organic (light color) and IPM (dark color) olive groves. The level of statistical significance obtained from the Mann–Whitney U test is also indicated (<span class="html-italic">p</span>-value).</p>
Full article ">Figure 5
<p>Statistic capture values (median, quartile 25, quartile 75, maximum and minimum) of the main beneficial species in the control plots (white color), treated with organophosphate Dimethoate 40% © (dark color) and pyrethrins (light color), of the two olive groves (organic/IPM). The <span class="html-italic">p</span>-value (Kruskal–Wallis test) is indicated in the upper right corner. The <span class="html-italic">p</span>-values indicated above the boxplots correspond to the comparison with respect to the control plot (<b>bold letters</b>) and between the two insecticides (<span class="html-italic">italic letters</span>).</p>
Full article ">
20 pages, 6147 KiB  
Article
Assessing Soil Organic Carbon, Soil Nutrients and Soil Erodibility under Terraced Paddy Fields and Upland Rice in Northern Thailand
by Noppol Arunrat, Sukanya Sereenonchai, Praeploy Kongsurakan and Ryusuke Hatano
Agronomy 2022, 12(2), 537; https://doi.org/10.3390/agronomy12020537 - 21 Feb 2022
Cited by 15 | Viewed by 3317
Abstract
Terracing is the oldest technique for water and soil conservation on natural hilly slopes. In Northern Thailand, terraced paddy fields were constructed long ago, but scientific questions remain on how terraced paddy fields and upland rice (non-terraced) differ for soil organic carbon (SOC) [...] Read more.
Terracing is the oldest technique for water and soil conservation on natural hilly slopes. In Northern Thailand, terraced paddy fields were constructed long ago, but scientific questions remain on how terraced paddy fields and upland rice (non-terraced) differ for soil organic carbon (SOC) stocks, soil nutrients and soil erodibility. Therefore, this study aims to evaluate and compare SOC stocks, soil nutrients and soil erodibility between terraced paddy fields and upland rice at Ban Pa Bong Piang, Chiang Mai Province, Thailand. Topsoil (0–10 cm) was collected from terraced paddies and upland rice fields after harvest. Results showed that SOC stocks were 21.84 and 21.61 Mg·C·ha−1 in terraced paddy and upland rice fields, respectively. There was no significant difference in soil erodibility between terraced paddies (range 0.2261–0.2893 t·h·MJ−1·mm−1) and upland rice (range 0.2238–0.2681 t·h·MJ−1·mm−1). Most soil nutrients (NH4-N, NO3-N, available K, available Ca and available Mg) in the terraced paddy field were lower than those in the upland rice field. It was hypothesized that the continuous water flows from plot-to-plot until lowermost plot caused dissolved nutrients to be washed and removed from the flat surface, leading to a short period for accumulating nutrients into the soil. An increase in soil erodibility was associated with decreasing SOC stock at lower toposequence points. This study suggested that increasing SOC stock is the best strategy to minimize soil erodibility of both cropping systems, while proper water management is crucial for maintaining soil nutrients in the terraced paddy field. Full article
(This article belongs to the Special Issue Resilience in Soils and Land Use)
Show Figures

Figure 1

Figure 1
<p>Study area. (<b>a</b>) Overall study area, (<b>b</b>) terraced paddy field and (<b>c</b>) upland rice. The aerial images were taken from Google maps on 25 February 2020. The photos were taken on 14 November 2020 by Noppol Arunrat.</p>
Full article ">Figure 1 Cont.
<p>Study area. (<b>a</b>) Overall study area, (<b>b</b>) terraced paddy field and (<b>c</b>) upland rice. The aerial images were taken from Google maps on 25 February 2020. The photos were taken on 14 November 2020 by Noppol Arunrat.</p>
Full article ">Figure 2
<p>Particle size distribution for terraced paddy field and upland rice areas.</p>
Full article ">Figure 3
<p>Comparison of soil physical and chemical properties between terraced paddy field and upland rice.</p>
Full article ">Figure 3 Cont.
<p>Comparison of soil physical and chemical properties between terraced paddy field and upland rice.</p>
Full article ">Figure 4
<p>Trend analysis charts of soil physical and chemical properties between terraced paddy field and upland rice.</p>
Full article ">Figure 4 Cont.
<p>Trend analysis charts of soil physical and chemical properties between terraced paddy field and upland rice.</p>
Full article ">Figure 4 Cont.
<p>Trend analysis charts of soil physical and chemical properties between terraced paddy field and upland rice.</p>
Full article ">Figure 5
<p>Soil organic carbon (Mg·C·ha<sup>−1</sup>, bar area) and <span class="html-italic">K</span>-value (line) of under different toposequences, and trend analysis charts of soil organic carbon and <span class="html-italic">K</span>-value. (<b>a</b>) Upland rice area, (<b>b</b>) terraced paddy field, (<b>c</b>) trend analysis chart of <span class="html-italic">K</span>-value and (<b>d</b>) trend analysis chart of SOC stock.</p>
Full article ">Figure 5 Cont.
<p>Soil organic carbon (Mg·C·ha<sup>−1</sup>, bar area) and <span class="html-italic">K</span>-value (line) of under different toposequences, and trend analysis charts of soil organic carbon and <span class="html-italic">K</span>-value. (<b>a</b>) Upland rice area, (<b>b</b>) terraced paddy field, (<b>c</b>) trend analysis chart of <span class="html-italic">K</span>-value and (<b>d</b>) trend analysis chart of SOC stock.</p>
Full article ">Figure 6
<p>Principal component analysis (PCA) and the loading values of soil properties and toposequences for terraced paddy field samples (red area) and upland rice samples (blue area).</p>
Full article ">
13 pages, 1193 KiB  
Article
Organic Matter in Riverbank Sediments and Fluvisols from the Flood Zones of Lower Vistula River
by Mirosław Kobierski and Magdalena Banach-Szott
Agronomy 2022, 12(2), 536; https://doi.org/10.3390/agronomy12020536 - 21 Feb 2022
Cited by 10 | Viewed by 2202
Abstract
The research objective of this study was to determine whether and to what extent the form of use of Fluvisols (arable soil and grassland) of a Lower Vistula floodplain valley (Fordonska Valley, Poland) determined their relative organic matter properties, as compared with nearby [...] Read more.
The research objective of this study was to determine whether and to what extent the form of use of Fluvisols (arable soil and grassland) of a Lower Vistula floodplain valley (Fordonska Valley, Poland) determined their relative organic matter properties, as compared with nearby riverbank sediments. Riverbank sediments were sampled from a depth of 0–20 cm, and soil samples from 0 to30 cm, all in three replicates. Basic physico-chemical soil properties were determined: texture, pH, and the contents of total organic carbon (TOC), total nitrogen (TN), dissolved organic carbon (DOC) and dissolved organic nitrogen (DON). Humic acids (HAs) were extracted by the Schnitzer method and analysed to assess their spectrometric parameters in the UV–VIS range and hydrophilic and hydrophobic properties. Riverbank sediment samples contained significantly lower TOC and TN contents than Fluvisols, regardless of land-use type. The TOC, TN, DOC and DON contents and properties of humic acids in the Fluvisol surface layer depended on land-use type, because the arable soils had significantly lower TOC, TN, DOC and DON contents than the grasslands, despite having a similar grain size (texture). Based on the A2/4, A2/6, A4/6 ratios, it was found that HA molecules isolated from the humus horizon of arable soils had a higher degree of maturity than HAs isolated from grassland soil samples. The spectrometric properties of humic acids isolated from riverbank sediments showed a higher degree of maturity than those from Fluvisols. This research showed that the properties of humic acids in Fluvisols are determined by the quantity and quality of organic matter transported in suspended matter that accumulates annually in flood valleys during flood events. The current land-use type of Fluvisols significantly influenced the properties of organic matter, and thus of humic acids. Therefore, these properties can be used to evaluate the transformation of organic matter that occurs in Fluvisols depending on the type of use. Full article
Show Figures

Figure 1

Figure 1
<p>Schematic map and sampling places: (<b>a</b>) riverbank sediments; (<b>b</b>) floodplain.</p>
Full article ">Figure 2
<p>The percentage share of hydrophilic (HIL) and hydrophobic (HOB) fractions in humic acids isolated from riverbank sediments (RBS), arable soils (AS) and grassland soils (GL).</p>
Full article ">Figure 3
<p>The hydrophilic–hydrophobic properties and parameters ΔlogK in humic acids isolated from riverbank sediments (RBS), arable soils (AS) and grassland soils (GL).</p>
Full article ">Figure 4
<p>Dependency diagram of the values A4/6 on A2/4 ratio in the molecules of humic acids (HAs).</p>
Full article ">
14 pages, 19067 KiB  
Article
Utilisation of Oil Palm’s Empty Fruit Bunch Spikelets for Oil-Spill Removal
by Nurul Aini Puasa, Siti Aqlima Ahmad, Nur Nadhirah Zakaria, Noor Azmi Shaharuddin, Khalilah Abdul Khalil, Alyza Azzura Azmi, Claudio Gomez-Fuentes, Faradina Merican, Azham Zulkharnain, Yih-Yih Kok and Chiew-Yen Wong
Agronomy 2022, 12(2), 535; https://doi.org/10.3390/agronomy12020535 - 21 Feb 2022
Cited by 3 | Viewed by 2805
Abstract
Agricultural sorbents have received attention for their effectiveness in oil removal. In Malaysia, oil palm’s empty fruit bunch (EFB) spikelets are an abundant agricultural waste that provides a non-toxic, renewable resource of cellulosic materials. In this study, the effectiveness of EFB spikelets to [...] Read more.
Agricultural sorbents have received attention for their effectiveness in oil removal. In Malaysia, oil palm’s empty fruit bunch (EFB) spikelets are an abundant agricultural waste that provides a non-toxic, renewable resource of cellulosic materials. In this study, the effectiveness of EFB spikelets to remove oil spills from seawater pollution in a filter system was investigated and the best optimisation approach for filtering conditions was determined. Experiments for oil spill clean-up were performed using a filter-based oil sorption system with a series of conditions such as temperature, time, packing density, and oil concentration to evaluate sorption capacity, oil and water absorbed efficiency. Fourier transform infrared spectroscopy (FTIR) was used to characterise the physicochemical properties of untreated and treated EFB fibres. Based on one-factor-at -a-time (OFAT) analysis conducted at 160 °C for 30 min on 0.1 g/cm3 of packing density containing 25% diesel, 8.667 mL of oil and 5 mL of water was absorbed. In response surface methodology (RSM), the three parameters of temperature, packing density and diesel concentration were observed as significant. From RSM fitting model analysis, the predicted value obtained for both oil and water absorbed were 8.805 and 5.213 mL, respectively. The experimental RSM values of 9 and 5 mL of oil and water absorbed were obtained. The result demonstrated the validity of the model as the experimental RSM values were close to the RSM model’s prediction. As compared to OFAT, the RSM method is more efficient in oil removal. This research contributes to a better knowledge of the usage of a natural sorbent as a method of diesel pollution remediation. Full article
(This article belongs to the Special Issue Innovative Approaches in Agricultural Waste Management)
Show Figures

Figure 1

Figure 1
<p>Comparison of IR spectra between untreated EFB spikelets before and after wetting with oil.</p>
Full article ">Figure 2
<p>Comparison of IR spectra between EFB spikelets treated with 160 °C before and after wetting with oil.</p>
Full article ">Figure 3
<p>Temperature effects on treated EFB spikelets. The average effectiveness of oil absorption (%), the efficiency of water absorption (%), and the sorption capacity (g/g) on temperature were all found. SEM of three replicates illustrated by vertical bars.</p>
Full article ">Figure 4
<p>Time effects on treated EFB spikelets. The average efficiency of oil absorption (%), the efficiency of water absorption (%), and the sorption capacity (g/g) on time were obtained. SEM of three replicates illustrated by vertical bars.</p>
Full article ">Figure 5
<p>Packing density effects on treated EFB spikelets. The average effectiveness of oil absorption (%), the efficiency of water absorption (%), and the sorption capacity (g/g) on packing density were all found. SEM of three replicates illustrated by vertical bars.</p>
Full article ">Figure 6
<p>Oil concentration effects on treated EFB spikelets. The average efficiency of oil absorbed (%), the efficiency of water absorbed (%) and sorption capacity (g/g) on oil concentration were obtained. SEM of three replicates illustrated by vertical bars.</p>
Full article ">Figure 7
<p>Design Expert (Stat Ease, Inc.) generates 3D Contour plots of the significantly interacting model terms (<b>a</b>) A: temperature and B: packing density, (<b>b</b>) A: temperature and C: oil concentration, and (<b>c</b>) B: packing density and C: oil concentration.</p>
Full article ">
18 pages, 2556 KiB  
Article
Effect of Clay Mineralogy and Soil Organic Carbon in Aggregates under Straw Incorporation
by Bin Xue, Li Huang, Xiaokun Li, Jianwei Lu, Ruili Gao, Muhammad Kamran and Shah Fahad
Agronomy 2022, 12(2), 534; https://doi.org/10.3390/agronomy12020534 - 21 Feb 2022
Cited by 28 | Viewed by 4008
Abstract
The interaction between soil organic carbon (SOC) and clay minerals is a critical mechanism for retaining SOC and protecting soil fertility and long-term agricultural sustainability. The SOC composition and minerals speciation in clay fractions (<2 μm) within soil aggregates under straw removed (T) [...] Read more.
The interaction between soil organic carbon (SOC) and clay minerals is a critical mechanism for retaining SOC and protecting soil fertility and long-term agricultural sustainability. The SOC composition and minerals speciation in clay fractions (<2 μm) within soil aggregates under straw removed (T) and straw incorporation (TS) conditions were analyzed by X-ray diffraction, Fourier transform infrared spectra and X-ray photoelectron spectroscopy. The TS treatment promoted enrichment of clay in aggregates. The TS increased the contents of SOC (27.0–86.6%), poorly crystalline Fe oxide (Feo), and activity of Fe oxides (Feo/Fed); whereas, it reduced the concentrations of free Fe oxide (Fed) in the clay fractions within aggregates. Straw incorporation promoted the accumulation of aromatic-C and carboxylic-C in the clay fraction within aggregates. The relative amount of hydroxy-interlayered vermiculite, aliphatic-C, and alcohol-C in the clay fractions within the macroaggregates was higher than that microaggregates, whereas the relative amounts of illite, kaolinite, Fe(III), and aromatic-C had a reverse tendency. The hydroxy-interlayered vermiculite in clay fractions showed positive correlation with the amounts of C–C(H) (r = 0.93) and C–O (r = 0.96 *, p < 0.05). The concentration of Feo and Feo/Fed ratio was positively correlated with the amounts of C=C and C(O)O content in clay within aggregates. Long-term straw incorporation induced transformation of clay minerals and Fe oxide, which was selectively stabilized straw-derived organic compounds in clay fractions within soil aggregates. Full article
Show Figures

Figure 1

Figure 1
<p>Schema about the fractionation of soil aggregates and extraction of clay fractions (&lt;2 µm) within aggregates. Macroaggregates (Macro, &gt;250 μm), microaggregates (Micro, 53–250 μm), and silt+clay fractions (Silt+clay, &lt;53 μm).</p>
Full article ">Figure 2
<p>The clay content (<b>a</b>) and organic carbon contents in clay fractions (<b>b</b>) within aggregates under the conventional tillage without straw (T) and conventional tillage with straw incorporation (TS). Macroaggregates: &gt;250 μm; microaggregates: 53–250 μm; silt+clay: &lt;53 μm. Values are means ± SE, <span class="html-italic">n</span> = 3. Different capital and lowercase letters indicate significant differences between different aggregate fractions for the same treatment and between different treatments for the same aggregate fraction, respectively, at <span class="html-italic">p</span> &lt; 0.05 according to Duncan’s multiple range test.</p>
Full article ">Figure 3
<p>The Fe<sub>d</sub> (<b>a</b>) and Fe<sub>o</sub> (<b>b</b>) concentration and Fe<sub>o</sub>/Fe<sub>d</sub> ratio (<b>c</b>) in clay fractions within aggregate-sized classes under the conventional tillage without straw (T) and conventional tillage with straw incorporation (TS). Macroaggregates &gt; 250 μm; microaggregates: 53–250 μm; silt+clay: &lt;53 μm. Values are means ± SE, <span class="html-italic">n</span> = 3. Different capital and lowercase letters indicate significant differences between different aggregate fractions for the same treatment and between different treatments for the same aggregate fraction, respectively, at <span class="html-italic">p</span> &lt; 0.05 according to Duncan’s multiple range test.</p>
Full article ">Figure 4
<p>Correlation between Fe<sub>o</sub>/Fe<sub>d</sub> ratio and SOC concentration in the clay within aggregates.</p>
Full article ">Figure 5
<p>X-ray diffraction spectra of minerals for clay fractions within macroaggregates (&gt;250 μm) and microaggregates (53–250 μm) using a powder specimen slide of soil under the conventional tillage without straw (T) and conventional tillage with straw incorporation (TS). Q—quartz; Go—goethite; K—kaolinite; I—illite; H—hematite; V— vermiculite; HIV—hydroxy-interlayered vermiculite.</p>
Full article ">Figure 6
<p>X-ray diffraction spectra of minerals for clay fractions within macroaggregates (&gt;250 μm) and microaggregates (53–250 μm) using an oriented specimen slide of soil under the conventional tillage without straw (T) and conventional tillage with straw incorporation (TS). V—vermiculite; I—illite; K—kaolinite; Q—quartz; HIV—hydroxy-interlayered vermiculite; (<b>a</b>) T, macroaggregates; (<b>b</b>) T, microaggregates; (<b>c</b>) TS, macroaggregates; (<b>d</b>) TS, microaggregates.</p>
Full article ">Figure 7
<p>High-resolution XPS spectrum of Fe for clay fractions within macroaggregates (&gt;250 μm) and microaggregates (53–250 μm) of soil under the conventional tillage without straw (T) and conventional tillage with straw incorporation (TS). (<b>a</b>) T, macroaggregates; (<b>b</b>) T, microaggregates; (<b>c</b>) TS, macroaggregates; (<b>d</b>) TS, microaggregates.</p>
Full article ">Figure 8
<p>Fourier transform infrared (FTIR) spectra of clay within macroaggregates (&gt;250 μm) and microaggregates (53–250 μm). T—straw removed; TS—straw incorporation.</p>
Full article ">Figure 9
<p>C 1s X-ray photoelectron spectroscopy (XPS) peak-fitting spectra of clay fractions within macroaggregates (&gt;250 μm) and microaggregates (53–250 μm) of soil under the conventional tillage without straw (T) and conventional tillage with straw incorporation (TS). (<b>a</b>) T, macroaggregates; (<b>b</b>) T, microaggregates; (<b>c</b>) TS, macroaggregates; (<b>d</b>) TS, microaggregates.</p>
Full article ">Figure 10
<p>Pearson correlation coefficients between the relative percentages of clay minerals, Fe (oxyhydr)oxides and different organic functional groups in clay fractions within aggregates. <span class="html-italic">n</span> = 4, * Correlation is significant at <span class="html-italic">p</span> &lt; 0.05.</p>
Full article ">
16 pages, 7888 KiB  
Article
Temporal Movement of a Dieback Front in a Population of Parkinsonia in Northern Australia
by Naomi D. Diplock and Victor J. Galea
Agronomy 2022, 12(2), 533; https://doi.org/10.3390/agronomy12020533 - 21 Feb 2022
Cited by 1 | Viewed by 1693
Abstract
The temporal progress of Parkinsonia aculeata dieback through a well-established, naturally occurring dieback affected site was monitored using two transects over a seven-year period. This revealed the time and spatial dynamics underlying the nature of this disorder. Assessment of this site demonstrated a [...] Read more.
The temporal progress of Parkinsonia aculeata dieback through a well-established, naturally occurring dieback affected site was monitored using two transects over a seven-year period. This revealed the time and spatial dynamics underlying the nature of this disorder. Assessment of this site demonstrated a decline in individual plant health over consecutive years, with 98% of parkinsonia plants dying over the study period. Minimal recruitment of new plants led to a collapse in the parkinsonia population. Macrophomina phaseolina (Botryosphaeriaceae) was the only species with known pathogenicity on parkinsonia found in the transect site. This information provides a valuable insight into the timeframe involved in this disease process from infection through to plant death. This is the first research to date to assess the temporal movement of parkinsonia dieback. Full article
(This article belongs to the Section Weed Science and Weed Management)
Show Figures

Figure 1

Figure 1
<p>Typical symptoms of dieback on <span class="html-italic">Parkinsonia aculeata</span>. Dieback affected plant (<b>a</b>); Dieback lesion moving from tip to a position lower on the branch (<b>b</b>); Stem vascular bundle staining (<b>c</b>).</p>
Full article ">Figure 2
<p>Transect orientation at Koon Kool Station. Transect lines are 50 m in length running in the general direction of east to west [<a href="#B15-agronomy-12-00533" class="html-bibr">15</a>]. Red arrow shows the direction of travel of dieback front.</p>
Full article ">Figure 3
<p>Satellite image of 50 m transects at Koon Kool Station one year before the trial establishment [<a href="#B15-agronomy-12-00533" class="html-bibr">15</a>]. Red dashes outline a stand of parkinsonia plants.</p>
Full article ">Figure 4
<p>Satellite image of 50 m transects at Koon Kool Station one year after the final assessment (2013) [<a href="#B16-agronomy-12-00533" class="html-bibr">16</a>]. Parkinsonia stand observed in 2004 no longer visible.</p>
Full article ">Figure 5
<p>Transect 1 viewed at 0 m (start of transect) at establishment in 2005 (<b>a</b>), and final assessment in 2012 (<b>b</b>). Note the obvious disappearance of live parkinsonia plants (with light-green foliage) from the background in the second photograph.</p>
Full article ">Figure 6
<p>Transect 2 viewed at 0 m (start of transect) at establishment in 2005 (<b>a</b>); and final assessment in 2012 (<b>b</b>). Note the reduced parkinsonia population (light-green foliage) in the second photograph.</p>
Full article ">Figure 7
<p>Transect 1, Individual Plant Health from June 2005 to June 2008 with a final rating in 2012. Health categories: <span class="html-fig-inline" id="agronomy-12-00533-i001"> <img alt="Agronomy 12 00533 i001" src="/agronomy/agronomy-12-00533/article_deploy/html/images/agronomy-12-00533-i001.png"/></span> = dead, <span class="html-fig-inline" id="agronomy-12-00533-i002"> <img alt="Agronomy 12 00533 i002" src="/agronomy/agronomy-12-00533/article_deploy/html/images/agronomy-12-00533-i002.png"/></span> = ratings 1–35, <span class="html-fig-inline" id="agronomy-12-00533-i003"> <img alt="Agronomy 12 00533 i003" src="/agronomy/agronomy-12-00533/article_deploy/html/images/agronomy-12-00533-i003.png"/></span> = ratings 36–74, <span class="html-fig-inline" id="agronomy-12-00533-i004"> <img alt="Agronomy 12 00533 i004" src="/agronomy/agronomy-12-00533/article_deploy/html/images/agronomy-12-00533-i004.png"/></span> = ratings 75–110.</p>
Full article ">Figure 8
<p>Transect 2, Individual Plant Health from June 2005 to June 2008 with a final rating in 2012. Health categories: <span class="html-fig-inline" id="agronomy-12-00533-i005"> <img alt="Agronomy 12 00533 i005" src="/agronomy/agronomy-12-00533/article_deploy/html/images/agronomy-12-00533-i005.png"/></span> = dead, <span class="html-fig-inline" id="agronomy-12-00533-i006"> <img alt="Agronomy 12 00533 i006" src="/agronomy/agronomy-12-00533/article_deploy/html/images/agronomy-12-00533-i006.png"/></span> = ratings 1–35, <span class="html-fig-inline" id="agronomy-12-00533-i007"> <img alt="Agronomy 12 00533 i007" src="/agronomy/agronomy-12-00533/article_deploy/html/images/agronomy-12-00533-i007.png"/></span> = ratings 36–74, <span class="html-fig-inline" id="agronomy-12-00533-i008"> <img alt="Agronomy 12 00533 i008" src="/agronomy/agronomy-12-00533/article_deploy/html/images/agronomy-12-00533-i008.png"/></span> = ratings 75–110.</p>
Full article ">Figure 9
<p>Transect 1, Individual seedling recruitment and health rating from June 2005 to June 2008 with a final rating in 2012. Health categories: <span class="html-fig-inline" id="agronomy-12-00533-i009"> <img alt="Agronomy 12 00533 i009" src="/agronomy/agronomy-12-00533/article_deploy/html/images/agronomy-12-00533-i009.png"/></span> = dead, <span class="html-fig-inline" id="agronomy-12-00533-i010"> <img alt="Agronomy 12 00533 i010" src="/agronomy/agronomy-12-00533/article_deploy/html/images/agronomy-12-00533-i010.png"/></span> = ratings 1–35, <span class="html-fig-inline" id="agronomy-12-00533-i011"> <img alt="Agronomy 12 00533 i011" src="/agronomy/agronomy-12-00533/article_deploy/html/images/agronomy-12-00533-i011.png"/></span> = ratings 36–74, <span class="html-fig-inline" id="agronomy-12-00533-i012"> <img alt="Agronomy 12 00533 i012" src="/agronomy/agronomy-12-00533/article_deploy/html/images/agronomy-12-00533-i012.png"/></span> = ratings 75–110.</p>
Full article ">Figure 10
<p>Transect 2, Individual seedling recruitment and health rating from June 2005 to June 2008 with a final rating in 2012. Health categories: <span class="html-fig-inline" id="agronomy-12-00533-i013"> <img alt="Agronomy 12 00533 i013" src="/agronomy/agronomy-12-00533/article_deploy/html/images/agronomy-12-00533-i013.png"/></span> = dead, <span class="html-fig-inline" id="agronomy-12-00533-i014"> <img alt="Agronomy 12 00533 i014" src="/agronomy/agronomy-12-00533/article_deploy/html/images/agronomy-12-00533-i014.png"/></span> = ratings 1–35, <span class="html-fig-inline" id="agronomy-12-00533-i015"> <img alt="Agronomy 12 00533 i015" src="/agronomy/agronomy-12-00533/article_deploy/html/images/agronomy-12-00533-i015.png"/></span> = ratings 36–74, <span class="html-fig-inline" id="agronomy-12-00533-i016"> <img alt="Agronomy 12 00533 i016" src="/agronomy/agronomy-12-00533/article_deploy/html/images/agronomy-12-00533-i016.png"/></span> = ratings 75–110.</p>
Full article ">Figure 11
<p>Predicted vigour ratings of dieback affected plants over a period of 20 years (0–25) using the Markov chain model. Health categories: 0 = dead (red), 1 = ratings 1–35 (yellow), 2 = ratings 36–74 (light green), 3 = ratings 75–100 (dark green).</p>
Full article ">Figure 12
<p>Percentage of predicted and actual health ratings of plants 2008–2012 using the Markov chain model. Health categories: 0 = dead (red), 1 = ratings 1–35 (yellow), 2 = ratings 36–74 (light green), 3 = ratings 75–100 (dark green).</p>
Full article ">
20 pages, 3180 KiB  
Article
Evaluation of Methods for Measuring Fusarium-Damaged Kernels of Wheat
by Arlyn J. Ackerman, Ryan Holmes, Ezekiel Gaskins, Kathleen E. Jordan, Dawn S. Hicks, Joshua Fitzgerald, Carl A. Griffey, Richard Esten Mason, Stephen A. Harrison, Joseph Paul Murphy, Christina Cowger and Richard E. Boyles
Agronomy 2022, 12(2), 532; https://doi.org/10.3390/agronomy12020532 - 21 Feb 2022
Cited by 8 | Viewed by 4257
Abstract
Fusarium head blight (FHB) is one of the most economically destructive diseases of wheat (Triticum aestivum L.), causing substantial yield and quality loss worldwide. Fusarium graminearum is the predominant causal pathogen of FHB in the U.S., and produces deoxynivalenol (DON), a mycotoxin [...] Read more.
Fusarium head blight (FHB) is one of the most economically destructive diseases of wheat (Triticum aestivum L.), causing substantial yield and quality loss worldwide. Fusarium graminearum is the predominant causal pathogen of FHB in the U.S., and produces deoxynivalenol (DON), a mycotoxin that accumulates in the grain throughout infection. FHB results in kernel damage, a visual symptom that is quantified by a human observer enumerating or estimating the percentage of Fusarium-damaged kernels (FDK) in a sample of grain. To date, FDK estimation is the most efficient and accurate method of predicting DON content without measuring presence in a laboratory. For this experiment, 1266 entries collectively representing elite varieties and SunGrains advanced breeding lines encompassing four inoculated FHB nurseries were represented in the analysis. All plots were subjected to a manual FDK count, both exact and estimated, near-infrared spectroscopy (NIR) analysis, DON laboratory analysis, and digital imaging seed phenotyping using the Vibe QM3 instrument developed by Vibe imaging analytics. Among the FDK analytical platforms used to establish percentage FDK within grain samples, Vibe QM3 showed the strongest prediction capabilities of DON content in experimental samples, R2 = 0.63, and higher yet when deployed as FDK GEBVs, R2 = 0.76. Additionally, Vibe QM3 was shown to detect a significant SNP association at locus S3B_9439629 within major FHB resistance quantitative trait locus (QTL) Fhb1. Visual estimates of FDK showed higher prediction capabilities of DON content in grain subsamples than previously expected when deployed as genomic estimated breeding values (GEBVs) (R2 = 0.71), and the highest accuracy in genomic prediction, followed by Vibe QM3 digital imaging, with average Pearson’s correlations of r = 0.594 and r = 0.588 between observed and predicted values, respectively. These results demonstrate that seed phenotyping using traditional or automated platforms to determine FDK boast various throughput and efficacy that must be weighed appropriately when determining application in breeding programs to screen for and develop resistance to FHB and DON accumulation in wheat germplasms. Full article
(This article belongs to the Special Issue Wheat Breeding: Procedures and Strategies – Series Ⅱ)
Show Figures

Figure 1

Figure 1
<p><span class="html-italic">Fusarium</span>-damaged kernel standards, where each Petri dish contained 1000 randomly subsampled kernels from the Hilliard check entry, represented in 5% FDK increments such that the dish labeled “0” represents 0% FDK and 100% healthy kernels. All predetermined standards were used to train inspectors to best estimate FDK percentiles of experimental subsamples.</p>
Full article ">Figure 2
<p>Vibe QM3 image output of the 50% standard used for quality control testing. FDK are signified by the red box, labeled “FDK_3” in color key, corresponding to the title of the FDK calibration file used, while healthy kernels are signified by white box, labeled “nonFDK” in color key.</p>
Full article ">Figure 3
<p>(<b>a</b>) Violin plots of all platforms represented by individual environment. All platforms represented in percentage FDK except DON, which is shown in ppm. Samples examined in VISUAL in FSC2020 were not also examined by other platforms in FSC2020, resulting in additional FDK values for VISUAL over other platforms, creating visual differences between maximum values of violin plots. (<b>b</b>) Broad-sense heritability on an entry means basis was calculated for each trait as denoted by “<span class="html-italic">H2</span>”. Corresponding averages and standard deviations for FSC19 (Florence, SC 2019), FSC20 (Florence, SC 2020), WLA20 (Winnsboro, LA 2020), and MtVA19 (Mt. Holly, VA 2019).</p>
Full article ">Figure 4
<p>Correlation matrix of raw phenotypic data: on the diagonal, distribution of each platform; lower left corner, bivariate scatter plots between platforms; upper right corner, correlation coefficients between platforms. All correlations were significant at the <span class="html-italic">p</span> &lt; 0.001 level.</p>
Full article ">Figure 5
<p>The potential of FDK platforms to predict DON resistance and perform as a proxy phenotype. (<b>a</b>) Genetic correlation between DON resistance and platform-derived FDK. (<b>b</b>) Linear regression between platform-derived FDK GEBVs and DON resistance GEBVs. (<b>c</b>) Linear regression between platform-derived FDK and DON content per sample as raw phenotypic data.</p>
Full article ">Figure 6
<p>Manhattan plots for GWAS results of VIBE, MANUAL, and VISUAL using BLUE values. VIBE detects significant SNP association at locus S3B_9439629, known to be within <span class="html-italic">Fhb1</span> QTL on chromosome 3B (−log<sub>10</sub>(<span class="html-italic">p</span>) of 5.53).</p>
Full article ">Figure 7
<p>Genomic prediction accuracies for each FDK platform as developed from rrBLUP model. Each box-and-whiskers plot represents 1000 Pearson’s correlations, each correlation representing a coefficient of correlation from a stratified five-fold cross-validation scheme.</p>
Full article ">
19 pages, 33794 KiB  
Article
Effects of COVID-19 Pandemic on Agricultural Food Production among Smallholder Farmers in Northern Drakensberg Areas of Bergville, South Africa
by Bonginkosi E. Mthembu, Xolile Mkhize and Georgina D. Arthur
Agronomy 2022, 12(2), 531; https://doi.org/10.3390/agronomy12020531 - 21 Feb 2022
Cited by 14 | Viewed by 10116
Abstract
COVID-19 pandemic has greatly affected social and economic activities in the agriculture systems. The extent of pandemic disruptions on agriculture food production systems is lamentably scanty in rural areas. A survey was carried out in the Northern Drakensberg areas of Bergville, and it [...] Read more.
COVID-19 pandemic has greatly affected social and economic activities in the agriculture systems. The extent of pandemic disruptions on agriculture food production systems is lamentably scanty in rural areas. A survey was carried out in the Northern Drakensberg areas of Bergville, and it assessed the impact of COVID-19 on agricultural food production in smallholder farming systems comprising crop-livestock systems. A survey was conducted using structured questionnaires that measured the impact of COVID-19 within farming operations and average crop yield trends pre-COVID-19 and during COVID-19. Most farmers (77.1 to 92.4%) reported having limitations in accessing agricultural inputs of seeds, fertilizers, herbicides, fungicides, and insecticides during the COVID-19 pandemic. Results indicated a continuous decrease in yields of maize, dry beans, and soybeans across two years of cropping seasons during the COVID-19 pandemic. The study demonstrated that COVID-19 lockdowns accompanied by movement restrictions negatively impacted food production of staple crops (maize, dry beans, soybeans) despite suitable rains received during COVID-19 production periods. COVID-19 policies and legislations sensitive to the plight of poor rural communities are necessary as these communities are more reliant on local agricultural food production for their livelihoods and income. Strong co-operations must be established among input suppliers, smallholder farmers associations, extension services, and local retailers to assist smallholders to obtain inputs at local retailers even during COVID-19 lockdown restrictions. Full article
(This article belongs to the Special Issue COVID-19 Crises & Implications to Agri-Food Sector)
Show Figures

Figure 1

Figure 1
<p>Map showing the Bergville area within uThukela Catchment Region in KwaZulu Natal Province, South Africa.</p>
Full article ">Figure 2
<p>Variables highlighting direct impacts on farming operation during COVID-19.</p>
Full article ">Figure 3
<p>Rainfall (mm) patterns in different months during 2016/2017 to 2020/2021 of the growing seasons. Source: Weather and Climate [<a href="#B34-agronomy-12-00531" class="html-bibr">34</a>].</p>
Full article ">Figure 4
<p>Key essential resources for conducive agribusiness operations.</p>
Full article ">Figure 5
<p>Degrees of impact for human capital.</p>
Full article ">Figure 6
<p>Relationships between total rainfall and maize yields during 2016/2017 to 2020/2021 growing seasons. Blue: total rainfall. Source: Weather and Climate [<a href="#B34-agronomy-12-00531" class="html-bibr">34</a>]; Yellow: maize yield. Source: own data gathered from survey during the study.</p>
Full article ">Figure 7
<p>Relationships between total rainfall and dry bean yields during 2016/2017 to 2020/2021 growing seasons. Blue: total rainfall. Source: Weather and Climate [<a href="#B34-agronomy-12-00531" class="html-bibr">34</a>]; Yellow: dry bean yield. Source: own data gathered from survey during the study.</p>
Full article ">Figure 8
<p>Relationships between total rainfall and soybean yields during 2016/2017 to 2020/2021 growing seasons. Blue: Total rainfall. Source: Weather and Climate [<a href="#B34-agronomy-12-00531" class="html-bibr">34</a>]; Yellow: soybean yield. Source: own data gathered from survey during the study.</p>
Full article ">
19 pages, 973 KiB  
Article
Measuring Soil Quality Indicators under Different Climate-Smart Land Uses across East African Climate-Smart Villages
by John Walker Recha, Kennedy O. Olale, Andrew M. Sila, Gebermedihin Ambaw, Maren Radeny and Dawit Solomon
Agronomy 2022, 12(2), 530; https://doi.org/10.3390/agronomy12020530 - 21 Feb 2022
Cited by 3 | Viewed by 3153
Abstract
The present study assessed soil physical-chemical characteristics as reliable soil health indicators in six climate-smart land use types; agroforestry, community forest, cropland with soil and water conservation (SWC), crop land without SWC, grassland and control across climate-smart villages (CSVs) in Lushoto (Tanzania), Hoima [...] Read more.
The present study assessed soil physical-chemical characteristics as reliable soil health indicators in six climate-smart land use types; agroforestry, community forest, cropland with soil and water conservation (SWC), crop land without SWC, grassland and control across climate-smart villages (CSVs) in Lushoto (Tanzania), Hoima (Uganda), Wote and Nyando (Kenya). Soils were sampled at three depths; 0–15 cm, 15–45 cm and 45–100 cm and then analyzed for bulk density (BD), pH, exchangeable bases (Ca, Mg, K, Na), extractable Fe, Mn, Zn, exchangeable acidity (ExAc), Electrical conductivity (EC), total carbon (TC), total nitrogen (TN) and cation exchange capacity (CEC). Land use types and sampling depths significantly affected soil properties (p < 0.05), High bulk density (BD) was measured at 45–100 cm depth in grassland (1.47 g/cm3) and crop land (1.50 g/cm3) in Kenya and Tanzania, respectively. BD in Ugandan grasslands was statistically lower (p < 0.05) than BD in other land use types at all depths. Soil pH of surface soil (0–15 cm) ranged from 6.67 ± 0.67 (agroforestry) to 6.27 ± 0.85 (grassland). Ex. bases (Ca, Mg, K and Na) and extractable Fe, Mn, Zn, ExAc, EC, TC, TN and CEC were significantly affected by land uses (p ≤ 0.05). Soil properties were significantly correlated, a positive correlation between silt % (p < 0.01) and pH, sand and Ca (p < 0.05). EC and pH, exchangeable Ca, exchangeable bases, exchangeable K and C: N ratio was observed. There was a negative correlation (p < 0.05) between pH and clay. The study has shown that improving soil properties using land use systems leads to an increase in soil nutrients. Full article
(This article belongs to the Section Soil and Plant Nutrition)
Show Figures

Figure 1

Figure 1
<p>The Hoima, Nyando, and Lushoto Climate-Smart Villages study sites [<a href="#B25-agronomy-12-00530" class="html-bibr">25</a>].</p>
Full article ">Figure 2
<p>Bulk density (g/cm<sup>3</sup>) physical soil quality indicator in relation to the country, land use and soil depths (Mean ± Std Dev). Means within Country followed by different letters (a, b, c, d) are significantly different (<span class="html-italic">p</span> &lt; 0.05) with respect to land use and soil depths. AF—Agroforestry, CF—Community forest, CL with SWC—Cropland with soil and water conservation, CL without SWC—Cropland without soil and water conservation, GL—Grassland, C—Control.</p>
Full article ">
9 pages, 392 KiB  
Article
The Essential-Oil-Bearing Rose Collection Variability Study in Terms of Biochemical Parameters
by Viktor Zolotilov, Natalya Nevkrytaya, Olga Zolotilova, Sevilia Seitadzhieva, Elena Myagkikh, Vladimir Pashtetskiy and Mikhail Karpukhin
Agronomy 2022, 12(2), 529; https://doi.org/10.3390/agronomy12020529 - 20 Feb 2022
Cited by 6 | Viewed by 2580
Abstract
The primary task when breeding new varieties of essential-oil-bearing rose is to increase the essential oil content and quality. The purpose of the present research is to study the essential-oil-bearing rose collection variability in terms of the essential oil content and component composition [...] Read more.
The primary task when breeding new varieties of essential-oil-bearing rose is to increase the essential oil content and quality. The purpose of the present research is to study the essential-oil-bearing rose collection variability in terms of the essential oil content and component composition and to identify opportunities for isolating the specimens promising for selection. The study of a collection of 112 specimens was carried out in 2017–2020 in the context of the piedmont of Crimea. The decanted essential oil content was determined using the hydrodistillation method. The component composition of rose essential oil was analyzed by gas chromatography on Crystal 5000.2. The essential oil components were identified by comparing their Kovats retention indices to the literature values. A high variability in the essential oil content in the collection (Cv = 36.3% at the average, over 4 years) and the major components content in the essential oil (Cv = 22.1–45.9%) was found. In the context of the piedmont of Crimea, the major components’ percentage content in essential oil from all the specimens including the five Bulgarian varieties did not meet the GOST ISO 9842-2017 standard requirements. This is indicative of a high-degree sensitivity to the soil and weather conditions in the region. It was found that the citronellol, geraniol, and nerol content in essential oil dropped significantly in extreme high temperature and drought conditions. Seven specimens rich in essential oil contained in the raw plant material (0.030–0.049%) and thirteen specimens with a high yield of concrete (0.31–0.39%) were identified and have been recommended for inclusion in the breeding process. Full article
(This article belongs to the Special Issue Innovative Technologies in Crop Production and Animal Husbandry)
Show Figures

Figure 1

Figure 1
<p>(<b>A</b>) Average monthly air temperature during the period of active vegetation, 2017–2020, and (<b>B</b>) average monthly precipitation during the period of active vegetation, 2017–2020.</p>
Full article ">
19 pages, 3018 KiB  
Article
Considerations on Field Methodology for Macrofungi Studies in Fragmented Forests of Mediterranean Agricultural Landscapes
by Abel Fernández Ruiz, David Rodríguez de la Cruz, José Luis Vicente Villardón, Sergio Sánchez Durán, Prudencio García Jiménez and José Sánchez Sánchez
Agronomy 2022, 12(2), 528; https://doi.org/10.3390/agronomy12020528 - 20 Feb 2022
Cited by 2 | Viewed by 3164
Abstract
The methodology used for the determination of macrofungal diversity in Mediterranean areas differs in the time of sampling and the number of years displayed, making it difficult to compare results. Furthermore, the results could be refuted because the studies are being conducted over [...] Read more.
The methodology used for the determination of macrofungal diversity in Mediterranean areas differs in the time of sampling and the number of years displayed, making it difficult to compare results. Furthermore, the results could be refuted because the studies are being conducted over an insufficient number of years or without considering the variation of the meteorological conditions from one year to the next and its effects on fruiting time, which might not fit the sampling. In order to optimize field work on fungal fruiting in Mediterranean environments dominated by holm oak (Quercus ilex L.), a weekly field analysis of macrofungal diversity from February 2009 to June 2013 was carried out in a Mediterranean holm oak forest in the middle-west of the Iberian Peninsula. The results revealed that fruiting bodies appeared throughout the year and that there was a delay in autumn fruiting, overlapping with spring. All this seems to indicate that weekly collection throughout the year and for a period of two years could be sufficient to estimate the macrofungal biodiversity of this ecosystem. Full article
(This article belongs to the Special Issue Resilience in Soils and Land Use)
Show Figures

Figure 1

Figure 1
<p>Location of Mediterranean habitats used in the analysis of Alpha and Beta Diversity. 1: La Orbada Forest (CW, Spain), 2: Campanarios de Azaba Biological Reserve (CW, Spain), 3: Foros (C, Portugal), 4: Peloponnese (S, Greece), 5: Fango forest (Corsica, France), 6: Collestrada forest (C, Italy).</p>
Full article ">Figure 2
<p>Total number of collected species accumulated by months.</p>
Full article ">Figure 3
<p>Number of weeks of collection for the most abundant species.</p>
Full article ">Figure 4
<p>Total number of species collected by seasons.</p>
Full article ">Figure 5
<p>Total number of species collected per years and months.</p>
Full article ">Figure 6
<p>Total number of collections per week in December and January for the four years of survey.</p>
Full article ">Figure 7
<p>New species (accumulated) identified during the studied period in La Orbada forest by weeks of sampling.</p>
Full article ">Figure 8
<p>(<b>a</b>) Species rarefaction curve S(est), Upper and lower bounds of the 95% confidence interval. (<b>b</b>) Smooth richness accumulation curves for the non-parametric estimators ICE, Chao 2, Jack 1, Jack 2.</p>
Full article ">Figure 9
<p>Groups identified in the PCA by week. The points (S) indicate the weeks of sampling.</p>
Full article ">Figure 10
<p>PCA for the months in the 2009–2012 period. The points correspond to the year and month.</p>
Full article ">Figure 11
<p>Average species collected by seasons. Percentages (%) over the studied period.</p>
Full article ">Figure 12
<p>Percentage of total fungal collections sorted by season and form of nutrition.</p>
Full article ">Figure 13
<p>Total percentage of new identified species per collection years from February 2009 to June 2013.</p>
Full article ">
20 pages, 3525 KiB  
Article
Impact of Olive Trees on the Microclimatic and Edaphic Environment of the Understorey Durum Wheat in an Alley Orchard of the Mediterranean Area
by Anna Panozzo, Hsin-Ya Huang, Bruno Bernazeau, Florence Meunier, Olivier Turc, Robin Duponnois, Yves Prin, Teofilo Vamerali and Dominique Desclaux
Agronomy 2022, 12(2), 527; https://doi.org/10.3390/agronomy12020527 - 20 Feb 2022
Cited by 7 | Viewed by 2372
Abstract
In the current context of climate change, the impact of trees in agroforestry systems is expected to mitigate water and heat stresses, particularly in semi-arid environments. Within this framework, in a two-year trial conducted at INRAE in Southern France, the dynamics of microclimatic [...] Read more.
In the current context of climate change, the impact of trees in agroforestry systems is expected to mitigate water and heat stresses, particularly in semi-arid environments. Within this framework, in a two-year trial conducted at INRAE in Southern France, the dynamics of microclimatic parameters and the edaphic environment of durum wheat were investigated under a yearly-pruned (AF) and a never-pruned (AF+) 6-m apart alley olive orchard, in comparison with controls under full sun. Here it was recorded a reduction of photosynthetic active radiation (PAR) by 30% and 51% in AF and AF+, respectively, during the wheat cycle, together with a marked reduction of wind speed compared to controls (–85% in AF and −99% in AF+). A significant buffer effect was also highlighted for air temperature, averagely +1.7 °C during the night and −3.2 °C during the daytime under the moderate shading of AF. The positive effect of trees on soil water conservation increased with the intensity of shading, particularly during the critical wheat stage of grain filling, with benefits on wheat root mycorrhization, and NH4+ and NO3 abundance in the arable layer. Despite some of the environmental modifications being favorable for the understorey wheat, these were not translated into yield improvements, suggesting that the severe shading associated with the small inter-row and evergreen trees has a prevailing effect, that requires to be managed through appropriate tree pruning. Full article
Show Figures

Figure 1

Figure 1
<p>Photosynthetic active radiation (PAR; µmol s<sup>−1</sup> m<sup>−2</sup>; mean ± S.E.) recorded in three treatments (C = Control, AF = yearly pruned olive grove, AF+ = never pruned olive grove) during 2015–16 (<b>left</b>) and 2016–17 (<b>right</b>) wheat-growing seasons at stem elongation (from sowing to 7 April), heading and anthesis (from 8 April to 10 May), and maturity (from 11 May to harvesting). Numbers above histograms indicate the percentage variation as compared to controls within each wheat cycle period. Within the same period and year, different letters indicate significant differences according to the Tukey’s HSD test (<span class="html-italic">p</span> ≤ 0.05).</p>
Full article ">Figure 2
<p>Hourly dynamics of air temperature (temp; <b>left</b>) and relative humidity (RH; <b>right</b>) recorded in C and AF treatments expressed as AF and C difference: temp.AF-temp.C (°C) and RH.AF-RH.C (%) for each hour of the day during the 2016–17 wheat growing season, from sowing to harvesting. Above the x axis, day length is divided into 3 intervals: Time1 = 12 pm–5 am, Time2 = 6 am–12 am, Time3 = 1 pm–11 pm. For each hour of the day, asterisks indicate a significant difference between values recorded in C and AF treatments (<span class="html-italic">p</span> ≤ 0.05).</p>
Full article ">Figure 3
<p>Soil water potential as hourly average pressure potential (KPa) recorded by tensiometers placed in the three treatments (C, AF and AF+) at four soil depths, i.e., 30 (<b>top-left</b>), 60 (<b>top-right</b>), 90 (<b>bottom-left</b>) and 110 (<b>bottom-right</b>) cm, during the 2nd year (2016–17) wheat growing season. Timeline in the x axis is divided into three wheat cycle periods: stem elongation (Stem elong) (from sowing to 7 April), heading and anthesis (Head_Anth) (from 8 April to 10 May) and maturity (Mat) (from 11 May to harvesting). The secondary vertical axis indicates daily rainfall (mm) within the same period.</p>
Full article ">Figure 4
<p>Soil water potential as hourly average pressure potential (KPa) recorded by tensiometers placed in the three treatments (C, AF and AF+) at four soil depths, i.e., 30 (<b>top-left</b>), 60 (<b>top-right</b>), 90 (<b>bottom-left</b>) and 110 (<b>bottom-right</b>) cm, during the 1st year (2015–16) wheat growing season. Timeline in the x axis is divided into three periods: stem elongation (Stem elong) (from sowing to 7 April; data not available in 2015–16), heading and anthesis (Head_Anth) (from 8 April to 10 May) and maturity (Mat) (from 11 May to harvesting). The secondary vertical axis indicates daily rainfall (mm) within the same period.</p>
Full article ">Figure 5
<p>NH<sub>4</sub><sup>+</sup> and NO<sub>3</sub><sup>−</sup> concentration (mg Kg<sup>−1</sup> TS, TS = total solids; mean ±S.E., <span class="html-italic">n</span> = 13) of the soil samples collected in the three treatments (C, AF and AF+) during February both in 2016 (<b>left</b>) and 2017 (<b>right</b>). Each soil sample was divided into three subsamples according to the depth: 0–30, 30–60 and 60–90 cm. Standard error bars refer to the average NH<sub>4</sub><sup>+</sup> and NO<sub>3</sub><sup>−</sup> concentration of the entire samples (0–90 cm depth). For each year and each ion, different capital letters indicate significant difference between treatments considering the 0–90 cm soil profile; small letters indicate significant difference between treatments within each of the three-soil subsample (0–30, 30–60 and 60–90 cm), according to Tukey’s HSD test (<span class="html-italic">p</span> ≤ 0.05).</p>
Full article ">
20 pages, 3441 KiB  
Article
Development of Pedotransfer Functions to Predict Soil Physical Properties in Southern Quebec (Canada)
by Simon Perreault, Anas El Alem, Karem Chokmani and Athyna N. Cambouris
Agronomy 2022, 12(2), 526; https://doi.org/10.3390/agronomy12020526 - 20 Feb 2022
Cited by 5 | Viewed by 3333
Abstract
Pedotransfer functions (PTFs) are empirical fits to soil property data and have been used as an alternative tool to in situ measurements for estimating soil hydraulic properties for the last few decades. PTFs of Saxton and Rawls, 2006 (PTFs’S&R.2006) are some of the [...] Read more.
Pedotransfer functions (PTFs) are empirical fits to soil property data and have been used as an alternative tool to in situ measurements for estimating soil hydraulic properties for the last few decades. PTFs of Saxton and Rawls, 2006 (PTFs’S&R.2006) are some of the most widely used because of their global aspect. However, empirical functions yield more accurate results when trained locally. This study proposes a set of agricultural PTFs developed for southern Quebec, Canada for three horizons (A, B, and C). Four response variables (bulk density (ρb), saturated hydraulic conductivity (Ksat), volumetric water content at field capacity (θ33), and permanent wilting point (θ1500)) and four predictors (clay, silt, organic carbon, and coarse fragment percentages) were used in this modeling process. The new PTFs were trained using the stepwise forward regression (SFR) and canonical correlation analysis (CCA) algorithms. The CCA- and SFR-PTFs were in most cases more accurate. Θ1500 and at θ33 estimates were improved with the SFR. The ρb in the A horizon was moderately estimated by the PTFs’S&R.2006, while the CCA- and SFR-PTFs performed equally well for the B and C horizons, yet qualified weak. However, for all PTFs for all horizons, Ksat estimates were unacceptable. Estimation of ρb and Ksat could be improved by considering other morphological predictors (soil structure, drainage information, etc.). Full article
Show Figures

Figure 1

Figure 1
<p>Map of the Monteregie soil surface textural groups.</p>
Full article ">Figure 2
<p>Development procedures of PTFs using CCA method.</p>
Full article ">Figure 3
<p>Cross-correlation and distribution matrix of primary and secondary soil properties. <sup>1</sup> Transformed data; * significant correlation (<span class="html-italic">p</span> = 0.05).</p>
Full article ">Figure 4
<p>Accuracy assessment of Saxton and Rawls’s PTFs (<b>I</b>) and PTFs developed using SFR (<b>II</b>) and CCA (<b>III</b>): (<b>a</b>) field capacity (θ<sub>33</sub>); (<b>b</b>) permanent wilting point (θ<sub>1500</sub>); (<b>c</b>) bulk density (ρ<sub>b</sub>); (<b>d</b>) saturated hydraulic conductivity (K<sub>sat</sub>).</p>
Full article ">
11 pages, 1781 KiB  
Article
Trapping of Ceratitis capitata Using the Low-Cost and Non-Toxic Attractant Biodelear
by Nikos A. Kouloussis, Vassilis G. Mavraganis, Petros Damos, Charalampos S. Ioannou, Eleftheria Bempelou, Dimitris S. Koveos and Nikos T. Papadopoulos
Agronomy 2022, 12(2), 525; https://doi.org/10.3390/agronomy12020525 - 20 Feb 2022
Cited by 8 | Viewed by 3430
Abstract
Trapping is considered a powerful tool in the monitoring and control of fruit flies of high economic importance such as the Mediterranean fruit fly, Ceratitis capitata (Diptera: Tephritidae). However, the cost of trapping and, in some cases, the safety of the chemicals used [...] Read more.
Trapping is considered a powerful tool in the monitoring and control of fruit flies of high economic importance such as the Mediterranean fruit fly, Ceratitis capitata (Diptera: Tephritidae). However, the cost of trapping and, in some cases, the safety of the chemicals used as baits are concerning for growers and the environment. Here we present a novel, low cost, environmentally friendly, female-specific bait for C. capitata, called Biodelear, that consists of a mixture of attracting compounds such us pyrazines, pyranones and amorphous nitrogen-based polymers. The new bait was compared to the commercially available attractant Biolure® (Suterra LLC, Bend, OR, USA) in Greece. McPhail-type traps were deployed in an orange orchard located in Athens. Five traps per treatment were used for several weeks during 2009 and four traps per treatment in 2010. Traps contained either 17 g of Biodelear or one Biolure Unipack dispenser. The results showed that both baits were highly efficient in attracting C. capitata females, and to a lesser extent, males. Although Biolure initially appeared to outperform Biodelear, later in the season the two attractants converged in efficacy. In both years, female captures were similar in traps baited with Biolure and Biodelear. However, male captures were higher in Biodelear-baited traps in 2010. In addition, Biodelear seemed to be longer lasting than Biolure, despite not being formulated into a slow-release dispersion system. The low cost of Biodelear and its strong, long-lasting effects render it suitable for mass trapping of the Mediterranean fruit fly. Full article
Show Figures

Figure 1

Figure 1
<p>The McPhail type trap used in our trapping experiments to host both the Biodelear and the Biolure dispensers.</p>
Full article ">Figure 2
<p>Boxplots (horizontal line = medians, box = quartiles, vertical line = Q1 − 1.5 ∗ (inter quartile range) and Q3 + 1.5 ∗ IQR, dots = outliers) depicting captures (per trap check) of males (<b>left</b>), females (<b>centre</b>) and total (<b>right</b>, males + females) medflies in trap checks conducted during October and November 2009 in traps baited with Biodelear and Biolure.</p>
Full article ">Figure 3
<p>Proportion of female captures in traps baited with either Biodelear or Biolure during October and November 2009 in relation to the date of trap check.</p>
Full article ">Figure 4
<p>Boxplots depicting captures (per trap check) of males (<b>left</b>), females (<b>center</b>) and total (<b>right</b>, males + females) medflies in trap checks conducted during July and August 2010 in traps baited with Biodelear and Biolure.</p>
Full article ">Figure 5
<p>Box plots depicting the effect of the type (Biodelear, Biolure) and age of lure (New, Old) on captures of males (<b>left</b>), females (<b>middle</b>), and total (<b>right</b>) captures of adult medflies in field trials conducted in October and November 2010.</p>
Full article ">
12 pages, 1105 KiB  
Article
The Influence of Different Cooling Systems on the Microclimate, Photosynthetic Activity and Yield of a Tomato Crops (Lycopersicum esculentum Mill.) in Mediterranean Greenhouses
by María Ángeles Moreno-Teruel, Francisco Domingo Molina-Aiz, Alejandro López-Martínez, Patricia Marín-Membrive, Araceli Peña-Fernández and Diego Luis Valera-Martínez
Agronomy 2022, 12(2), 524; https://doi.org/10.3390/agronomy12020524 - 19 Feb 2022
Cited by 5 | Viewed by 2475
Abstract
The purpose of this study was to analyse the effect of different evaporative cooling systems compared to natural ventilation on the microclimate, photosynthetic activity and yield of a tomato crop (Lycopersicum esculentum Mill.) in a spring-summer cycle. In this study, the expenditure [...] Read more.
The purpose of this study was to analyse the effect of different evaporative cooling systems compared to natural ventilation on the microclimate, photosynthetic activity and yield of a tomato crop (Lycopersicum esculentum Mill.) in a spring-summer cycle. In this study, the expenditure of electricity and water caused by the different refrigeration systems and their economic cost was analysed. The study was carried out in three multi-span greenhouses: (i) a greenhouse with evaporative pads and fans and natural ventilation (PS + NV); (ii) a greenhouse with a fog system and natural ventilation (FS + NV); (iii) a greenhouse only with natural ventilation (NV). The photosynthetic activity was higher in the greenhouse with natural ventilation (14.7 µmol CO2 m−2 s−1) than in the greenhouse with the pad-fan system (14.6 µmol CO2 m−2 s−1; without a statistically significant difference) and in the greenhouse with fog system (13.4 µmol CO2 m−2 s−1; with a statistically significant difference). The production was higher in the greenhouse with the pad-fan system (5.0 kg m−2) than in the greenhouse with natural ventilation (4.8 kg m−2; without a statistically significant difference) and in the greenhouse with a fog system (4.5 kg m−2; with a statistically significant difference). In general, photosynthetic activity and crop production increased as the maximum temperature (and the number of hours of exposure to high temperatures) decreased. It has been observed that the improvement in temperature conditions inside the greenhouses in spring-summer cycles produces increases in the photosynthetic activity of the tomato crop and, consequently, growth in production. The energy and water consumption derived from the use of active-type cooling systems have not been offset by a representative improvement in photosynthetic activity or crop production. Full article
(This article belongs to the Special Issue Characteristics and Technology in Mediterranean Agriculture)
Show Figures

Figure 1

Figure 1
<p>Panoramic view of the experimental greenhouses. Natural ventilation (NV), fog system (FS + NV) and evaporative pads and fans system (PS + NV).</p>
Full article ">Figure 2
<p>Average daily temperature during the development of the test. Natural ventilation (NV)<sub>,</sub> fog system (FS + NV) and evaporative pads and fans system (PS + NV).</p>
Full article ">Figure 3
<p>Average daily relative humidity during the development of the test. Natural ventilation (NV)<sub>,</sub> fog system (FS + NV) and evaporative pads and fans system (PS + NV).</p>
Full article ">Figure 4
<p>Marketable yield obtained in the experimental sectors under the influence of the different cooling systems. Natural ventilation (NV)<sub>,</sub> fog system (FS + NV) and evaporative pads and fans system (PS + NV).</p>
Full article ">
16 pages, 3488 KiB  
Article
Dual Response Optimization of Ultrasound-Assisted Oil Extraction from Red Fruit (Pandanus conoideus): Recovery and Total Phenolic Compounds
by Endah Prasetia Susanti, Abdul Rohman and Widiastuti Setyaningsih
Agronomy 2022, 12(2), 523; https://doi.org/10.3390/agronomy12020523 - 19 Feb 2022
Cited by 4 | Viewed by 2634
Abstract
Red fruit oil (RFO) is a high-value oil that contains functional compounds, mainly phenolic compounds, providing antioxidant activity. Therefore, an optimal extraction method is essential to recover the RFO and phenolic compounds simultaneously. This research aimed to optimize the ultrasound-assisted extraction (UAE) for [...] Read more.
Red fruit oil (RFO) is a high-value oil that contains functional compounds, mainly phenolic compounds, providing antioxidant activity. Therefore, an optimal extraction method is essential to recover the RFO and phenolic compounds simultaneously. This research aimed to optimize the ultrasound-assisted extraction (UAE) for oil from red fruit using the Box-Behnken design combined with response surface methodology. The studied UAE factors, including sample-to-solvent ratio (1:3, 1:2, and 1:1 g mL−1), extraction temperature (60, 75, and 90 °C), and pulse duty-cycle (0.20, 0.50, and 0.80 s−1). Analysis of variance revealed that the three studied factors significantly influenced the recovered RFO, while the level of total phenolic compounds in the extracts was defined merely by extraction temperature (p < 0.05). These significant factors were then included in the optimization models (R2 > 0.99, lack-of-fit p > 0.05). The proposed UAE setting by the multiresponse optimization was an extraction temperature of 67 °C, a pulse duty-cycle of 0.50 s−1, and a sample-to-solvent ratio of 1:2.5 g mL−1. Subsequently, the extraction kinetic was evaluated, confirming full recovery at 60 min of extraction time. The developed method was then applied to extract six red fruit clones. Mbarugum clones provided high RFO recovery (9.60%), with an uppermost total phenolic compound of (42.63 mg GAE g−1) among the six red fruit clones. Additionally, the resulting RFO showed eminent antioxidant activities, indicated by excellent values of IC50 DPPH (37.69 mg L−1), IC50 FIC (30.43 mg L−1), FRAP reducing power (63.55 mg AAEA g−1), and IC50 ABTS (93.88 mg L−1). In contrast with a wet rendering method, UAE enhanced the RFO recovery by 53.02%, resulting in a higher level of total phenolic compounds. Henceforth, the proposed UAE method is a promising technique to substitute conventional oil production in the food and pharmaceutical industries. Full article
(This article belongs to the Special Issue Extraction and Analysis of Bioactive Compounds in Crops)
Show Figures

Figure 1

Figure 1
<p>Red fruit drupe from six red fruit clones: (<b>a</b>) Edewewits clone; (<b>b</b>) Menjib Rumbai clone; (<b>c</b>) Memeri clone; (<b>d</b>) Monsor clone; (<b>e</b>) Monsrus clone; and (<b>f</b>) Mbarugum clone.</p>
Full article ">Figure 2
<p>Pareto chart for the standardized effects of factors in the extraction process: (<b>a</b>) oil yield (%); (<b>b</b>) total phenolic compounds (mg GAE g<sup>−1</sup>). The vertical line crossing the bars shows that the corresponding factor has a statistically significant 95% confidence level. <span style="color:yellow">■</span> Indicates a positive effect and <span style="color:#045FB4">■</span> indicates a negative effect. A: Temperature; B: Pulse-duty cycle; C: Sample-to-solvent ratio.</p>
Full article ">Figure 3
<p>Response surface graphs regarding desirability response: (<b>a</b>) temperature vs. pulse-duty cycle and (<b>b</b>) temperature vs. sample-to-solvent ratio.</p>
Full article ">Figure 4
<p>The effect of ultrasound-assisted extraction (UAE) time on oil yield and level of total phenolic compounds (TPC). Different letters above (yield) and below (TPC) the tick marks indicate a significant difference (<span class="html-italic">p</span> &lt; 0.05).</p>
Full article ">Figure 5
<p>The oil yield of six red fruit clones using the optimized condition of ultrasound-assisted extraction (UAE) and wet rendering (WR) methods. Different letters within a column indicate a significant difference (<span class="html-italic">p</span> &lt; 0.05).</p>
Full article ">Figure 6
<p>Total phenolic compounds of six clones producing red fruit oil using the optimized condition of ultrasound-assisted extraction (UAE) and wet rendering (WR) methods. Different letters above the bars indicate a significant difference (<span class="html-italic">p</span> &lt; 0.05).</p>
Full article ">
17 pages, 1357 KiB  
Review
Utilizing Genomic Selection for Wheat Population Development and Improvement
by Lance F. Merrick, Andrew W. Herr, Karansher S. Sandhu, Dennis N. Lozada and Arron H. Carter
Agronomy 2022, 12(2), 522; https://doi.org/10.3390/agronomy12020522 - 19 Feb 2022
Cited by 17 | Viewed by 4546
Abstract
Wheat (Triticum aestivum L.) breeding programs can take over a decade to release a new variety. However, new methods of selection, such as genomic selection (GS), must be integrated to decrease the time it takes to release new varieties to meet the [...] Read more.
Wheat (Triticum aestivum L.) breeding programs can take over a decade to release a new variety. However, new methods of selection, such as genomic selection (GS), must be integrated to decrease the time it takes to release new varieties to meet the demand of a growing population. The implementation of GS into breeding programs is still being explored, with many studies showing its potential to change wheat breeding through achieving higher genetic gain. In this review, we explore the integration of GS for a wheat breeding program by redesigning the traditional breeding pipeline to implement GS. We propose implementing a two-part breeding strategy by differentiating between population improvement and product development. The implementation of GS in the product development pipeline can be integrated into most stages and can predict within and across breeding cycles. Additionally, we explore optimizing the population improvement strategy through GS recurrent selection schemes to reduce crossing cycle time and significantly increase genetic gain. The recurrent selection schemes can be optimized for parental selection, maintenance of genetic variation, and optimal cross-prediction. Overall, we outline the ability to increase the genetic gain of a breeding program by implementing GS and a two-part breeding strategy. Full article
(This article belongs to the Special Issue Wheat Breeding: Procedures and Strategies – Series Ⅱ)
Show Figures

Graphical abstract

Graphical abstract
Full article ">Figure 1
<p>Overview of the two-part breeding strategy based on an 11 year breeding program from parental crossing to variety release. The recurrent selection scheme is shown in red arrows using F<sub>1</sub>s for continuous crossing within-population improvement, whereas the blue lines show the product development (PD) pipeline. The yellow arrows display the possible implementations of GS into the PD pipeline for integration into the recurrent selection scheme, which include utilizing lines from the preliminary yield trials (two-part) or lines from headrows (two-part + headrows) to update the GS training population.</p>
Full article ">Figure 2
<p>The implementation of GS for recurrent and parental selection based on an 11 year breeding program from parental crossing to variety release within the two-part breeding strategy. The recurrent selection scheme is shown in red arrows using F<sub>1</sub>s for continuous crossing within-population improvement, whereas the blue arrows show the product development (PD) pipeline. The yellow arrows display the possible implementations of GS into the PD pipeline to select lines for integration into the recurrent selection scheme. GS can be implemented as early as the F<sub>2</sub> stage, through doubled-haploid production or speed breeding without phenotypic screening. Further, GS can be implemented throughout the PD pipeline with an increasing number of phenotyping stages, from a single stage of phenotyping in headrows to the conventional method of phenotyping up to the 10th year in yield trials.</p>
Full article ">Figure 3
<p>The implementation of GS for within and across breeding cycles based on an 11 year breeding program from parental crossing to variety release. The within-cycle selection is shown by the orange vertical arrows within cycles for advancement through various yield trials such as using GS to predict the performance of lines for advancements from the preliminary yield trials to the advanced yield trials compared to the blue arrows for the traditional phenotypic selection. Across cycle selection across a single year is shown using red arrows using preliminary and advanced yield trials to predict inbred lines and yield trials from cycle 1 to cycle 2. Green arrows show the across cycle selection across multiple breeding cycles and are accomplished similarly to selection across a single year but can utilize historical data using multiple cycles for prediction purposes.</p>
Full article ">Figure 4
<p>Genomic selection recurrent selection schemes comparing the number of recurrent selection cycles achieved over three years with <span class="html-italic">N</span> being the number of selected recombinant inbred lines (ILs), doubled-haploids (DHs), F<sub>1</sub>, or F<sub>2</sub> lines. Recurrent selection with minimal crossing using F<sub>2</sub> lines consists of developing an initial IL population and then implementing GS to select <span class="html-italic">N</span> ILs to recombine, and the F<sub>1</sub>s are then self-pollinated to form an F<sub>2</sub> population that makes up the next recurrent selection cycle. This method can achieve approximately one cycle per year. Recurrent selection using F<sub>1</sub>s is similar to recurrent selection using F<sub>2</sub>s. However, the F<sub>1</sub>s are not self-pollinated, and recurrent selection is implemented on the F<sub>1</sub>s to make up the next recurrent selection cycle and achieve up to two cycles per year. Further, the number of recurrent selection cycles can be increased by utilizing the existing breeding program and the use of speed breeding to decrease time to maturity for crossing and selection purposes.</p>
Full article ">
26 pages, 2962 KiB  
Article
Biodisinfection as a Profitable Fertilization Method for Horticultural Crops in the Framework of the Circular Economy
by Francisco José Castillo-Díaz, Luis Jesús Belmonte-Ureña, Francisco Camacho-Ferre and Julio César Tello Marquina
Agronomy 2022, 12(2), 521; https://doi.org/10.3390/agronomy12020521 - 19 Feb 2022
Cited by 13 | Viewed by 3411
Abstract
Intensive agriculture has resulted in various environmental impacts that affect ecosystems. In some cases, the application of conventional fertilizers has deteriorated water quality, which includes the marine environment. For this reason, institutions have designed various strategies based on the principles of the circular [...] Read more.
Intensive agriculture has resulted in various environmental impacts that affect ecosystems. In some cases, the application of conventional fertilizers has deteriorated water quality, which includes the marine environment. For this reason, institutions have designed various strategies based on the principles of the circular economy and the bioeconomy. Both of these dynamics aim to reduce excessive fertilization and to inhibit the negative externalities it generates. In our work, a field trial is presented in which a 100% reduction in conventional inorganic fertilizers has been evaluated through a production methodology based on fertilization with reused plant debris in combination with other organic compounds. Based on one tomato crop, the profitability of this production technique has been analyzed in comparison with other conventional vegetable production techniques. The productivity and economic yield of the alternative crop was similar to that of the conventional crop, with a 37.2% decrease in water consumption. The reuse of biomass reduced production costs by 4.8%, while the addition of other organic amendments increased them by up to 22%. The results of our trial show that farms are more sustainable and more profitable from a circular point of view when using these strategies. Full article
(This article belongs to the Special Issue Circular Economy and Sustainable Development in Agriculture)
Show Figures

Figure 1

Figure 1
<p>Cumulative tomato production in the three years of study (September–April cycles) as a function of crop nutrition: (<b>a</b>) Crop 1; (<b>b</b>): Crop 2; (<b>c</b>): Crop 3. Values (mean ± standard deviation). Different letters indicate significant differences (<span class="html-italic">p</span> ≤ 0.05, Tukey’s HDS test). No fertilization (test); inorganic fertilization (IF); inorganic fertilization + 0.5 kg·m<sup>−2</sup> of <span class="html-italic">Brassica carinata</span> pellets (IFB1); inorganic fertilization + 1.0 kg·m<sup>−2</sup> of <span class="html-italic">Brassica carinata</span> pellets (IFB2); 3.5 kg·m<sup>−2</sup> of tomato plant debris (PD); 3.5 kg·m<sup>−2</sup> of tomato plant debris + 0.5 kg·m<sup>−2</sup> of <span class="html-italic">Brassica carinata</span> pellets (PDB1); 3.5 kg·m<sup>−2</sup> of tomato plant debris + 1.0 kg·m<sup>−2</sup> of <span class="html-italic">Brassica carinata</span> pellets (PDB2); inorganic fertilization + 3.5 kg·m<sup>−2</sup> of tomato plant debris (IFPD); inorganic fertilization + 5 kg·m<sup>−2</sup> of tomato plant debris (IFPD1); 5 kg·m<sup>−2</sup> of tomato plant debris (PD1); 6.5 kg·m<sup>−2</sup> of tomato plant debris (PD2). * Source: own elaboration based on Castillo-Díaz et al. [<a href="#B23-agronomy-12-00521" class="html-bibr">23</a>].</p>
Full article ">Figure 2
<p>Number of leaves, height, aerial dry weight, root dry weight, and leaf area of cucumber seedlings grown in a controlled environment chamber. Values (mean ± standard deviation). Different letters indicate significant differences (<span class="html-italic">p</span> ≤ 0.05, Tukey’s HDS test; z: <math display="inline"><semantics> <mrow> <msqrt> <mi>x</mi> </msqrt> </mrow> </semantics></math>). No fertilization (test); inorganic fertilization (IF); inorganic fertilization + 0.5 kg·m<sup>−2</sup> of <span class="html-italic">Brassica carinata</span> pellets (IFB1); inorganic fertilization + 1.0 kg·m<sup>−2</sup> of <span class="html-italic">Brassica carinata</span> pellets (IFB2); 3.5 kg·m<sup>−2</sup> of tomato plant debris (PD); 3.5 kg·m<sup>−2</sup> of tomato plant debris + 0.5 kg·m<sup>−2</sup> of <span class="html-italic">Brassica carinata</span> pellets (PDB1); 3.5 kg·m<sup>−2</sup> of tomato plant debris + 1.0 kg·m<sup>−2</sup> of <span class="html-italic">Brassica carinata</span> pellets (PDB2); inorganic fertilization + 3.5 kg·m<sup>−2</sup> of tomato plant debris (IFPD); inorganic fertilization + 5 kg·m<sup>−2</sup> of tomato plant debris (IFPD1); 5 kg·m<sup>−2</sup> of tomato plant debris (PD1); 6.5 kg·m<sup>−2</sup> of tomato plant debris (PD2). * Source: own elaboration based on Castillo-Díaz et al. [<a href="#B23-agronomy-12-00521" class="html-bibr">23</a>].</p>
Full article ">Figure 3
<p>Number of leaves, height, aerial dry weight, root dry weight, and leaf area of tomato seedlings grown in a controlled environment chamber. Values (mean ± standard deviation). Different letters indicate significant differences (<span class="html-italic">p</span> ≤ 0.05, Tukey’s HDS test). No fertilization (test); inorganic fertilization (IF); inorganic fertilization + 0.5 kg·m<sup>−2</sup> of <span class="html-italic">Brassica carinata</span> pellets (IFB1); inorganic fertilization + 1.0 kg·m<sup>−2</sup> of <span class="html-italic">Brassica carinata</span> pellets (IFB2); 3.5 kg·m<sup>−2</sup> of tomato plant debris (PD); 3.5 kg·m<sup>−2</sup> of tomato plant debris + 0.5 kg·m<sup>−2</sup> of <span class="html-italic">Brassica carinata</span> pellets (PDB1); 3.5 kg·m<sup>−2</sup> of tomato plant debris + 1.0 kg·m<sup>−2</sup> of <span class="html-italic">Brassica carinata</span> pellets (PDB2); inorganic fertilization + 3.5 kg·m<sup>−2</sup> of tomato plant debris (IFPD); inorganic fertilization + 5 kg·m<sup>−2</sup> of tomato plant debris (IFPD1); 5 kg·m<sup>−2</sup> of tomato plant debris (PD1); 6.5 kg·m<sup>−2</sup> of tomato plant debris (PD2). *Source: own elaboration based on Castillo-Díaz et al. [<a href="#B23-agronomy-12-00521" class="html-bibr">23</a>].</p>
Full article ">Figure 4
<p>Irrigation water applied in the IF and PD blocks during the third cycle of tomato cultivation. Inorganic fertilization (IF); inorganic fertilization + 3.5 kg·m<sup>−2</sup> of tomato plant debris (IFPD); inorganic fertilization + 5 kg·m<sup>−2</sup> of tomato plant debris (IFPD1); 3.5 kg·m<sup>−2</sup> of tomato plant debris (PD); 5 kg·m<sup>−2</sup> of tomato plant debris (PD1); 6.5 kg·m<sup>−2</sup> of tomato plant debris (PD2).</p>
Full article ">Figure 5
<p>Pre-tax economic benefit in the three years of study in September–April tomato cycles as a function of crop nutrition: (<b>a</b>) Crop 1; (<b>b</b>): Crop 2; (<b>c</b>): Crop 3. Values (mean ± standard deviation). Different letters indicate significant differences (<span class="html-italic">p</span> ≤ 0.05, Tukey’s HDS test). No fertilization (test); inorganic fertilization (IF); inorganic fertilization + 0.5 kg·m<sup>−2</sup> of <span class="html-italic">Brassica carinata</span> pellets (IFB1); inorganic fertilization + 1.0 kg·m<sup>−2</sup> of <span class="html-italic">Brassica carinata</span> pellets (IFB2); 3.5 kg·m<sup>−2</sup> of tomato plant debris (PD); 3.5 kg·m<sup>−2</sup> of tomato plant debris + 0.5 kg·m<sup>−2</sup> of <span class="html-italic">Brassica carinata</span> pellets (PDB1); 3.5 kg·m<sup>−2</sup> of tomato plant debris + 1.0 kg·m<sup>−2</sup> of <span class="html-italic">Brassica carinata</span> pellets (PDB2); inorganic fertilization + 3.5 kg·m<sup>−2</sup> of tomato plant debris (IFPD); inorganic fertilization + 5 kg·m<sup>−2</sup> of tomato plant debris (IFPD1); 5 kg·m<sup>−2</sup> of tomato plant debris (PD1); 6.5 kg·m<sup>−2</sup> of tomato plant debris (PD2). Source: own elaboration based on Torresano and Camacho-Ferre [<a href="#B47-agronomy-12-00521" class="html-bibr">47</a>], Honore et al. [<a href="#B2-agronomy-12-00521" class="html-bibr">2</a>], Junta de Andalucia [<a href="#B48-agronomy-12-00521" class="html-bibr">48</a>], Torres-Nieto [<a href="#B49-agronomy-12-00521" class="html-bibr">49</a>], and specialized agricultural supply centers.</p>
Full article ">Figure 6
<p>Comparison of the economic performance of the five horticultural alternatives evaluated from February 2016 to January 2021. <b>Methodology 1:</b> conventional; <b>Methodology 2</b>: self-management of plant debris and reduction in water, soil management, and chemical soil disinfectants; <b>Methodology 3:</b> Methodology 2 + reduction of inorganic fertilization; TNR: total income; TC: total costs; NP: economic benefit. Source: own elaboration based on Torresano and Camacho-Ferre [<a href="#B47-agronomy-12-00521" class="html-bibr">47</a>], Honore et al. [<a href="#B2-agronomy-12-00521" class="html-bibr">2</a>], Junta de Andalucia [<a href="#B48-agronomy-12-00521" class="html-bibr">48</a>], Torres-Nieto [<a href="#B49-agronomy-12-00521" class="html-bibr">49</a>], and specialized agricultural supply centers.</p>
Full article ">
20 pages, 6417 KiB  
Article
An Air Convection Wall with a Hollow Structure in Chinese Solar Greenhouses: Thermal Performance and Effects on Microclimate
by Yunfei Zhuang, Shumei Zhao, Jieyu Cheng, Pingzhi Wang, Na Lu, Chengwei Ma, Wenxin Xing and Kexin Zheng
Agronomy 2022, 12(2), 520; https://doi.org/10.3390/agronomy12020520 - 19 Feb 2022
Cited by 5 | Viewed by 2281
Abstract
A Chinese solar greenhouse (CSG) is a horticultural facility that uses solar energy to promote a growth environment for crops and provides high-efficiency thermal storage performance to meet the demand of vegetables’ growth in winter. Besides being an important load-bearing structure in CSGs, [...] Read more.
A Chinese solar greenhouse (CSG) is a horticultural facility that uses solar energy to promote a growth environment for crops and provides high-efficiency thermal storage performance to meet the demand of vegetables’ growth in winter. Besides being an important load-bearing structure in CSGs, the north wall is a heat sink, storing during the day in order to act as a heat source during the night. At times, the night temperature is lower than the minimum growth temperature requirement of vegetables, and the additional heating is needed. Therefore, optimizing the heat storage and release performance of the north wall in a CSG is an important approach for improving growth environment and reducing consumption of fossil fuel. This study proposes a heat storage north wall with a hollow layer on the basis of air convection, aiming to optimize the utilization of solar energy in CSGs. By the air convection effects, the hollow layer collects and stores surplus solar energy in the air during the day and transfers it to the cultivation space for heating at night. Additionally, field tests were conducted to compare the natural and forced convection strategies via airflow and heat transfer efficiency. The final effect on the indoor temperature ensured that the lowest temperatures at night were above 5 °C under both the natural and forced convection strategies during the winter in the Beijing suburbs where the average minimum temperature is below −10.8 °C during the experimental period. The hollow structure improves the utilization efficiency of solar energy in CSGs and ensures winter production efficiency in northern China. Full article
(This article belongs to the Special Issue Energy Efficient Greenhouses and Energy Saving Technologies)
Show Figures

Figure 1

Figure 1
<p>Structure of the air convection heat storage north wall: (<b>a</b>) Schematic of the air convection north wall with a hollow structure; and (<b>b</b>) schematic of the indoor surface with vents.</p>
Full article ">Figure 2
<p>Circulation direction of natural convection: (<b>a</b>) circulation direction during the day; and (<b>b</b>) circulation direction at night. (1) Upper vent, (2) inner layer of north wall, (3) lower vents, (4) outer layer of north wall, (5) hollow layer, (6) gable south roof frame, (7) insulation layer, (8) cultivation space, (9) thermal blanket, (10) north rear roof, (11) insulation layer, and (12) direction of airflow (Red indicates hot air and blue indicates cold air).</p>
Full article ">Figure 3
<p>Field and structure of the experimental Chinese solar greenhouse. Note: The units of height and span are meter (m) and millimeter (mm), respectively.</p>
Full article ">Figure 4
<p>Schematic of the sensor locations and measuring points: (<b>a</b>) vertical view; (<b>b</b>) side view. Note: The air temperatures of the test and control compartments are averaged with <span class="html-italic">T</span><sub>a1</sub>–<span class="html-italic">T</span><sub>a3</sub>; the air velocity and temperature of the vents are averaged with <span class="html-italic">WT</span><sub>1</sub>–<span class="html-italic">WT</span><sub>4</sub>; the heat flux of the indoor wall surface is averaged with <span class="html-italic">H</span><sub>iw1</sub> and <span class="html-italic">H</span><sub>iw2</sub>; the heat fluxes of the hollow layer surfaces are averaged with <span class="html-italic">H</span><sub>ow1</sub>–<span class="html-italic">H</span><sub>ow4</sub>; and the internal temperature of the north wall is averaged with <span class="html-italic">T<sub>wu</sub></span> and <span class="html-italic">T<sub>wd</sub></span> at the same depth (e.g., the temperature at 0 mm is represented by the average of <span class="html-italic">T<sub>wu1</sub> and T<sub>wd1</sub></span>).</p>
Full article ">Figure 5
<p>Comparison of indoor and outdoor temperatures under different conditions: (<b>a</b>) NCW and NW; and (<b>b</b>) NCW and FCW.</p>
Full article ">Figure 6
<p>Internal temperature distribution of the wall with blocked internal convection (NW), wall with natural internal convection (NCW), and wall with forced internal convection (FCW) on a sunny day.</p>
Full article ">Figure 7
<p>Temperature distribution in the wall at the typical thermal storage time (14:00) and release time (06:00) on a sunny day. Note: Wall depth was calculated in the indoor direction to the outdoor direction.</p>
Full article ">Figure 8
<p>Heat flux of different surfaces of the NCW and FCW.</p>
Full article ">Figure 9
<p>Ratio of heat storage and release of the different surfaces over several days.</p>
Full article ">Figure 10
<p>Wall surface temperatures of the FCW and NCW at 06:00 (January 24, 2018): (<b>a</b>) FCW; and (<b>b</b>) NCW.</p>
Full article ">Figure 11
<p>Air velocity of the vents under natural convection and forced convection.</p>
Full article ">Figure 12
<p>Temperature difference between the upper and lower vents of the NCW and FCW.</p>
Full article ">Figure 13
<p>Airflow and heat transfer of forced and natural convection at night (January 23).</p>
Full article ">Figure 14
<p>Daily accumulated heat storage and release of the NCW and FCW.</p>
Full article ">
16 pages, 2033 KiB  
Article
Seasonal Dynamics of Soil Bacterial Community under Long-Term Abandoned Cropland in Boreal Climate
by Alena Zhelezova, Timofey Chernov, Dmitry Nikitin, Azida Tkhakakhova, Natalia Ksenofontova, Aleksei Zverev, Olga Kutovaya and Mikhail Semenov
Agronomy 2022, 12(2), 519; https://doi.org/10.3390/agronomy12020519 - 19 Feb 2022
Cited by 7 | Viewed by 2553
Abstract
The collapse of collective farming in Russia after 1990 led to the abandonment of 23% of the agricultural area. Microbial biomass is a transit pool between fresh and soil organic matter; therefore, structural changes in soil microbial community determine the carbon cycle processes [...] Read more.
The collapse of collective farming in Russia after 1990 led to the abandonment of 23% of the agricultural area. Microbial biomass is a transit pool between fresh and soil organic matter; therefore, structural changes in soil microbial community determine the carbon cycle processes caused by self-restoration of arable lands after abandonment. Here, we assessed the influence of monthly changes in moisture and temperature on the bacterial community structure and abundance in Retisols under long-term abandoned cropland. Two periods with pronounced differences in bacterial properties were revealed: the growing period from March to September and the dormant period from October to February. The growing period was characterized by higher bacterial abundance and diversity compared to the dormant period. The relative abundances of the bacterial community dominants (Alpha-, Gamma- and Deltaproteobacteria, subgroup 6 of phylum Acidobacteria) did not change significantly over the year, either in total or active communities. The relative abundances of Bacteroidetes and Verrucomicrobia increased in the growing period, whereas Actinobacteria and Chloroflexi were more abundant in the dormant period. The microbial gene abundances positively correlated with soil and air temperature, but not with soil moisture. Thus, the seasonal dynamics of soil microbial communities are closely related to soil temperature and should be considered when assessing carbon cycles in abandoned lands. Full article
Show Figures

Figure 1

Figure 1
<p>Weather and soil conditions during the study period. The sampling depth for upper organic horizon is 10 cm, the sampling depth for lower mineral horizon is 55 cm.</p>
Full article ">Figure 2
<p>Seasonal dynamics of DNA yields. the sampling depth for upper organic horizon is 10 cm, the sampling depth for lower mineral horizon is 55 cm.</p>
Full article ">Figure 3
<p>Seasonal dynamics of bacterial and archaeal 16S gene (DNA) and gene transcript (cDNA) copy numbers in soil (10 cm is the sampling depth for upper organic horizon, 55 cm is the sampling depth for lower mineral horizon).</p>
Full article ">Figure 4
<p>Relative abundances of different classes in total bacterial communities of the upper organic soil horizon throughout the season.</p>
Full article ">Figure 5
<p>Relative abundances of different classes in active bacterial communities of the upper organic soil horizon throughout the season.</p>
Full article ">Figure 6
<p>Non-metric multidimensional scaling plots of total (<b>A</b>) and active (<b>B</b>) soil bacterial community patterns in different sampling times using UniFrac (10 cm is the sampling depth for upper organic horizon, 55 cm is the sampling depth for lower mineral horizon).</p>
Full article ">
20 pages, 9904 KiB  
Review
Precision Pollination Strategies for Advancing Horticultural Tomato Crop Production
by Angus Dingley, Sidra Anwar, Paul Kristiansen, Nigel W. M. Warwick, Chun-Hui Wang, Brian M. Sindel and Christopher I. Cazzonelli
Agronomy 2022, 12(2), 518; https://doi.org/10.3390/agronomy12020518 - 18 Feb 2022
Cited by 10 | Viewed by 10757
Abstract
Global climate change and anthropological activities have led to a decline in insect pollinators worldwide. Agricultural globalisation and intensification have also removed crops from their natural insect pollinators, and sparked research to identify alternate natural insect pollinators and artificial technologies. In certain countries [...] Read more.
Global climate change and anthropological activities have led to a decline in insect pollinators worldwide. Agricultural globalisation and intensification have also removed crops from their natural insect pollinators, and sparked research to identify alternate natural insect pollinators and artificial technologies. In certain countries such as Australia the importation of commercial insect pollinators is prohibited, necessitating manual labour to stimulate floral pollination. Artificial pollination technologies are now increasingly essential as the demand for food grown in protected facilities increases worldwide. For tomato fruits, precision pollination has the ability to vastly improve their seed set, size, yield, and quality under optimal environmental conditions and has become financially beneficial. Like many crops from the Solanaceae, tomatoes have a unique self-pollinating mechanism that requires stimulation of the floral organs to release pollen from the poricidal anthers. This review investigates various mechanisms employed to pollinate tomato flowers and discusses emerging precision pollination technologies. The advantages and disadvantages of various pollinating technologies currently available in the protected-cropping industry are described. We provide a buzz perspective on new promising pollination technologies involving robotic air and acoustic devices that are still in their nascency and could provide non-contact techniques to automate pollination for the tomato horticultural industry. Full article
Show Figures

Figure 1

Figure 1
<p>Comparison of the Australian global import and export markets of processed tomato fruits (tonnes of product). Most tomato imports come from Italy, USA and China. The tomato export market primarily consists of smaller countries geographically close to Australia such as New Zealand, Japan, Vietnam and Thailand. Data were sourced from a 2017 report [<a href="#B30-agronomy-12-00518" class="html-bibr">30</a>].</p>
Full article ">Figure 2
<p>A stylised diagram of the tomato floral anatomy. This general morphology is consistent across angiosperms. The diagram illustrates the male sexual organs (androecium) that consists of the anther containing pollen grains encased in a sac-like structure called the microsporangia. The poricidal anther is not freely accessible and legitimate access is restricted to bees capable of vibrating the anther. Mechanical vibrations disrupt trichomes binding the poricidal anthers to assist in the release of pollen. The anther is attached to the filament that protrudes from below the female gynoecium. The gynoecium consists of the ovary, style and stigma to which the pollen grains bind.</p>
Full article ">Figure 3
<p>Stylised diagram of tomato flower and fruit development stages. (<b>A</b>) Tomato flower development. A numbered scale (1–9) is used to denote each new stage. It can take ~1–2 days/stage until the flower bud (stage 1) reaches full maturity (stage 9; ~15–17 days). (<b>B</b>) Tomato developmental stages after pollination showing stages of fruit development. The numbered scale shows the pollinated flower (stage 1), expanding fruit (stage 2), mature green fruit (stage 3), ripening fruit (Breaker stage 4) and mature ripe fruit (stage 5).</p>
Full article ">Figure 4
<p>The relationship between environment and pollination success. As the environmental conditions move away from the optimum conditions, pollination outcomes rapidly diminish [<a href="#B46-agronomy-12-00518" class="html-bibr">46</a>].</p>
Full article ">Figure 5
<p>Stylised diagram of a bee buzzing a tomato flower. Bumblebees grasp the anther cone with their mandibles and vibrate their thorax. The mechanical and acoustic vibrations accelerate movement of the poricidal anthers to release pollen that can self-pollinate the tomato flower [<a href="#B13-agronomy-12-00518" class="html-bibr">13</a>].</p>
Full article ">Figure 6
<p>The variable properties of a soundwave. Amplitude is the maximum distance of displacement for a vibrating particle from its mean position, so as amplitude increases the volume of a sound increases (<b>top row</b>); as frequency increases so does pitch (<b>middle row</b>). Velocity is a measure of distance over a period of time (m/s), whereas acceleration is the change in velocity over a time period (m/s<sup>2</sup>). In the <b>bottom row</b>, the velocity of the left wave is 4 m/s, whereas the velocity of the right wave is 8 m/s. The change in speed to transition from the left to right wave would require an increase in acceleration.</p>
Full article ">Figure 7
<p>Stylised image showing different pollination techniques utilised in the tomato protected-cropping industry: (1) Natural buzz by bees can effectively pollinate multiple tomato flowers within a protected environment; (2) The electric toothbrush can mechanically stimulate individual flowers making it effective for cross-pollination breeding programs; (3) A tuning fork or wand placed below the floral truss can vibrate the entire truss leading to efficient pollination; (4) Wooden sticks tapped onto trellis strings multiple times will force plant vibrations leading to effective pollination of many trusses and flowers; (5) Commercial robotic devices have been engineered to eject pulses of air that mechanically shake the floral truss leading to targeted pollination of flowers in a high throughput manner; (6) Acoustic speakers could be commercially developed to emit sonic waves that accelerate floral movement without physical contact and trigger successful pollination of an entire floral truss; (7) Robotic drone technology has been developed to force mechanical air movement of specific intensity above the crop leading to pollination of upper floral trusses.</p>
Full article ">
13 pages, 1928 KiB  
Article
Effects of Short-Term Tillage Managements on CH4 and N2O Emissions from a Double-Cropping Rice Field in Southern of China
by Haiming Tang, Chao Li, Lihong Shi, Kaikai Cheng, Li Wen, Weiyan Li and Xiaoping Xiao
Agronomy 2022, 12(2), 517; https://doi.org/10.3390/agronomy12020517 - 18 Feb 2022
Cited by 7 | Viewed by 2016
Abstract
Soil carbon (C) content plays an important role in maintaining or increasing soil quality and soil fertility. However, the impacts of different tillage and crop residue incorporation managements on greenhouse gas (GHG) emissions from paddy fields under the double-cropping rice (Oryza sativa [...] Read more.
Soil carbon (C) content plays an important role in maintaining or increasing soil quality and soil fertility. However, the impacts of different tillage and crop residue incorporation managements on greenhouse gas (GHG) emissions from paddy fields under the double-cropping rice (Oryza sativa L.) system in southern China still need further study. Therefore, a field experiment was conducted to determine the impacts of different short-term (5-years) tillage and crop residue incorporation managements on soil organic carbon (SOC) content, SOC stock, and GHG emissions from paddy fields under the double-cropping rice system in southern China. The field experiment included four tillage treatments: rotary tillage with all crop residues removed as a control (RTO), conventional tillage with crop residue incorporation (CT), rotary tillage with crop residue incorporation (RT), and no-tillage with crop residue retention (NT). These results indicated that SOC stock in paddy fields with CT, RT, and NT treatments increased by 4.64, 3.60, 3.50 Mg ha−1 and 4.68, 4.21, and 4.04 Mg ha−1 in 2019 and 2020, respectively, compared with RTO treatment. The results showed that early rice and late rice yield with CT treatment increased by 7.22% and 19.99% in 2019 and 6.19% and 6.40% in 2020, respectively, compared with RTO treatment. A two-year (2019–2020) investigation of GHG results indicated that methane emissions from paddy fields with NT treatment were decreased, but nitrous oxide emissions from paddy fields were increased. The lowest mean global warming potential (GWP) and per yield GWP carbon dioxide were found with NT treatment, compared to RT and CT treatments. Therefore, it was a beneficial practice for maintaining SOC stock and decreasing GHG mitigation under the double-cropping rice system in southern China by applying no-tillage with crop residue retention management. Full article
(This article belongs to the Special Issue In Memory of Professor Longping Yuan, the Father of Hybrid Rice)
Show Figures

Figure 1

Figure 1
<p>Daily precipitation and daily mean temperature of paddy field during experimental period. (<b>a</b>) was the 2019, (<b>b</b>) was the 2020.</p>
Full article ">Figure 2
<p>Impacts of different short-term tillage managements on early rice and late rice yield under the double-cropping rice system. CT: conventional tillage with crop residue incorporation; RT: rotary tillage with crop residue incorporation; NT: no-tillage with crop residue retention; RTO: rotary tillage with all crop residues removed as a control. Error bars represent standard error of the mean. Different lowercase letters indicated a significant difference at the 0.05 level. The same as below. (<b>a</b>) was the 2019, (<b>b</b>) was the 2020.</p>
Full article ">Figure 3
<p>Impacts of different short-term tillage managements on CH<sub>4</sub> emission flux from double-cropping rice field in 2019 (<b>a</b>) and 2020 (<b>b</b>).</p>
Full article ">Figure 3 Cont.
<p>Impacts of different short-term tillage managements on CH<sub>4</sub> emission flux from double-cropping rice field in 2019 (<b>a</b>) and 2020 (<b>b</b>).</p>
Full article ">Figure 4
<p>Impacts of different short-term tillage managements on N<sub>2</sub>O emission flux from double-cropping rice field in 2019 (<b>a</b>) and 2020 (<b>b</b>).</p>
Full article ">Figure 4 Cont.
<p>Impacts of different short-term tillage managements on N<sub>2</sub>O emission flux from double-cropping rice field in 2019 (<b>a</b>) and 2020 (<b>b</b>).</p>
Full article ">
17 pages, 1708 KiB  
Article
Combination of Limited Meteorological Data for Predicting Reference Crop Evapotranspiration Using Artificial Neural Network Method
by Ahmed Elbeltagi, Attila Nagy, Safwan Mohammed, Chaitanya B. Pande, Manish Kumar, Shakeel Ahmad Bhat, József Zsembeli, László Huzsvai, János Tamás, Elza Kovács, Endre Harsányi and Csaba Juhász
Agronomy 2022, 12(2), 516; https://doi.org/10.3390/agronomy12020516 - 18 Feb 2022
Cited by 43 | Viewed by 3344
Abstract
Reference crop evapotranspiration (ETo) is an important component of the hydrological cycle that is used for water resource planning, irrigation, and agricultural management, as well as in other hydrological processes. The aim of this study was to estimate the ETo [...] Read more.
Reference crop evapotranspiration (ETo) is an important component of the hydrological cycle that is used for water resource planning, irrigation, and agricultural management, as well as in other hydrological processes. The aim of this study was to estimate the ETo based on limited meteorological data using an artificial neural network (ANN) method. The daily data of minimum temperature (Tmin), maximum temperature (Tmax), mean temperature (Tmean), solar radiation (SR), humidity (H), wind speed (WS), sunshine hours (Ssh), maximum global radiation (gradmax), minimum global radiation (gradmin), day length, and ETo data were obtained over the long-term period from 1969 to 2019. The analysed data were divided into two parts from 1969 to 2007 and from 2008 to 2019 for model training and testing, respectively. The optimal ANN for forecasting ETo included Tmax, Tmin, H, and SR at hidden layers (4, 3); gradmin, SR, and WS at (6, 4); SR, day length, Ssh, and Tmean at (3, 2); all collected parameters at hidden layer (5, 4). The results showed different alternative methods for estimation of ETo in case of a lack of climate data with high performance. Models using ANN can help promote the decision-making for water managers, designers, and development planners. Full article
Show Figures

Figure 1

Figure 1
<p>Map of the study area within Hungary.</p>
Full article ">Figure 2
<p>ANN structure.</p>
Full article ">Figure 3
<p>Yearly values of ET<sub>o</sub> (1969–2019).</p>
Full article ">Figure 4
<p>Neural network layouts for the optimal combined variables for predicting the ET<sub>o</sub> in Debrecen (<b>a</b>) Structural Network Design of the Superior Model—Hidden Layers (4, 3); (<b>b</b>) Structural Network Design of the Superior Model—Hidden Layers (6, 4); (<b>c</b>) Structural Network Design of the Superior Model—Hidden Layers (3, 2); (<b>d</b>) Structural Network Design of the Superior Model — Hidden Layers (5, 4).</p>
Full article ">Figure 4 Cont.
<p>Neural network layouts for the optimal combined variables for predicting the ET<sub>o</sub> in Debrecen (<b>a</b>) Structural Network Design of the Superior Model—Hidden Layers (4, 3); (<b>b</b>) Structural Network Design of the Superior Model—Hidden Layers (6, 4); (<b>c</b>) Structural Network Design of the Superior Model—Hidden Layers (3, 2); (<b>d</b>) Structural Network Design of the Superior Model — Hidden Layers (5, 4).</p>
Full article ">Figure 5
<p>Comparison between model prediction and observed ET<sub>o</sub> values for the optimal ANNs at the different hidden layers for Debrecen (<b>a</b>) performance of model with hidden layers (3, 2); (<b>b</b>) performance of model with hidden layers (4, 3); (<b>c</b>) performance of model with hidden layers (5, 4); (<b>d</b>) performance of model with hidden layers (6, 4).</p>
Full article ">
12 pages, 1399 KiB  
Article
Evaluation of ‘Lorca’ Cultivar Aptitude for Minimally Processed Artichoke
by Marina Giménez-Berenguer, María E. García-Pastor, Santiago García-Martínez, María J. Giménez and Pedro J. Zapata
Agronomy 2022, 12(2), 515; https://doi.org/10.3390/agronomy12020515 - 18 Feb 2022
Cited by 5 | Viewed by 2380
Abstract
Previous research works have reported that ‘Lorca’ artichoke cultivar presents a lower total phenolic content than other cultivars rich in phenolic compounds, which could show a lower susceptibility to enzymatic browning and increase its aptitude for fresh-cut processing. The aim of this study [...] Read more.
Previous research works have reported that ‘Lorca’ artichoke cultivar presents a lower total phenolic content than other cultivars rich in phenolic compounds, which could show a lower susceptibility to enzymatic browning and increase its aptitude for fresh-cut processing. The aim of this study was to analyze the total phenolic content as well as browning evaluation by image analysis and polyphenol oxidase (PPO) enzyme activity in ‘Lorca’ cultivar in order to characterize the key factors which influence its phenolic levels for minimally processed artichokes. Thus, artichokes were harvested and classified on three head orders (main, secondary, and tertiary), as well as three development stages (initial, intermediate, and advanced). Variance components analysis was carried out for total phenolic content considering three factors: plant, flower head order, and internal development stage. For the first time, the internal development stage has been related to total phenolic content, and results showed that artichoke head order and internal development stage were responsible for a variability of 22.17% and 15.55%, respectively. Main artichoke heads and those at the advanced development stage presented the lowest phenolic concentration as well as the lowest PPO activity; therefore, they exhibit the lowest browning process, which could increase their use in ready-to-eat products at market. Full article
Show Figures

Graphical abstract

Graphical abstract
Full article ">Figure 1
<p>Scale of internal development stage: (<b>a</b>) initial development stage; (<b>b</b>) intermediate development stage; (<b>c</b>) advanced development stage.</p>
Full article ">Figure 2
<p>Effect of colour change (Δ Hue angle) of fresh-cut artichoke heads every 15 s for 3 min. Different letters show statistical differences (<span class="html-italic">t</span> Student test, <span class="html-italic">p</span> &lt; 0.05) among artichoke head orders for ‘Lorca’ cultivar.</p>
Full article ">Figure 3
<p>Enzymatic browning process of different flower head orders at time 0 s, 90 s, and 180 s for ‘Lorca’ cultivar.</p>
Full article ">
21 pages, 5053 KiB  
Review
Optical Spectrometry to Determine Nutrient Concentrations and other Physicochemical Parameters in Liquid Organic Manures: A Review
by Michael Horf, Sebastian Vogel, Harm Drücker, Robin Gebbers and Hans-Werner Olfs
Agronomy 2022, 12(2), 514; https://doi.org/10.3390/agronomy12020514 - 18 Feb 2022
Cited by 12 | Viewed by 2847
Abstract
Nutrient concentrations in livestock manures and biogas digestates show a huge variability due to disparities in animal husbandry systems concerning animal species, feed composition, etc. Therefore, a nutrient estimation based on recommendation tables is not reliable when the exact chemical composition is needed. [...] Read more.
Nutrient concentrations in livestock manures and biogas digestates show a huge variability due to disparities in animal husbandry systems concerning animal species, feed composition, etc. Therefore, a nutrient estimation based on recommendation tables is not reliable when the exact chemical composition is needed. The alternative, to analyse representative fertilizer samples in a standard laboratory, is too time- and cost-intensive to be an accepted routine method for farmers. However, precise knowledge about the actual nutrient concentrations in liquid organic fertilizers is a prerequisite to ensure optimal nutrient supply for growing crops and on the other hand to avoid environmental problems caused by overfertilization. Therefore, spectrometric methods receive increasing attention as fast and low-cost alternatives. This review summarizes the present state of research based on optical spectrometry used at laboratory and field scale for predicting several parameters of liquid organic manures. It emphasizes three categories: (1) physicochemical parameters, e.g., dry matter, pH, and electrical conductivity; (2) main plant nutrients, i.e., total nitrogen, ammonium nitrogen, phosphorus, potassium, magnesium, calcium, and sulfur; and (3) micronutrients, i.e., manganese, iron, copper, and zinc. Furthermore, the commonly used sample preparation techniques, spectrometer types, measuring modes, and chemometric methods are presented. The primarily promising scientific results of the last 30 years contributed to the fact that near-infrared spectrometry (NIRS) was established in commercial laboratories as an alternative method to wet chemical standard methods. Furthermore, companies developed technical setups using NIRS for on-line applications of liquid organic manures. Thus, NIRS seems to have evolved to a competitive measurement procedure, although parts of this technique still need to be improved to ensure sufficient accuracy, especially in quality management. Full article
Show Figures

Figure 1

Figure 1
<p>Typical VIS-NIR reflectance spectra for liquid organic manures (pig, cattle, digestate) from a study conducted in north Germany (detected with UV-VIS-NIR fibered ArcOptix spectrometer, ArcOptix, Neuchatel, Switzerland).</p>
Full article ">
19 pages, 2675 KiB  
Article
Effects of Closing Cut Date and Nitrogen Fertilization on Seed Yield and Seed Quality in Two Novel Cultivars of Urochloa spp.
by Weenaporn Juntasin, Yoshimi Imura, Ichiro Nakamura, Mohammad Amzad Hossain, Sarayut Thaikua, Rattikan Poungkaew and Yasuhiro Kawamoto
Agronomy 2022, 12(2), 513; https://doi.org/10.3390/agronomy12020513 - 18 Feb 2022
Cited by 1 | Viewed by 1924
Abstract
Two field trials were conducted in Thailand to determine an appropriate closing cut date (CCD) and rate of nitrogen application (N-rate) to maximize seed yield and seed quality of the two novel cultivars (cv.) of Urochloa spp. (Synonym Brachiaria spp.), cv. ‘OKI-1’ (an [...] Read more.
Two field trials were conducted in Thailand to determine an appropriate closing cut date (CCD) and rate of nitrogen application (N-rate) to maximize seed yield and seed quality of the two novel cultivars (cv.) of Urochloa spp. (Synonym Brachiaria spp.), cv. ‘OKI-1’ (an open-pollinated tetraploid Urochloa ruziziensis (R. Germ. and C.M. Evrard) Crins originated from cv. ‘Miyaokikoku-ichigou’) and cv. ‘Br-203’ (U. ruziziensis cv. ‘Miyaokikoku-ichigou’ × U. hybrid cv. ‘Mulato’). The following treatments were evaluated in this study: four CCDs (uncut, 15 June, 1 July, and 15 July) and four N-rates (0, 50, 100, and 150 kg/ha). The cv. ‘OKI-1’ showed somewhat differences in tiller number/m2 (TN), fertile tiller percentage (FTP), inflorescence number/tiller (IN/T) and spikelet number/raceme (SN/R) with the CCD, while the cv. ‘Br-203’ showed only in SN/R. However, TN and SN/R were highest for 15 June, and FTP and IN/T were highest for 1 July in cv. ‘OKI-1’. The cv. ‘OKI-1’ showed the highest total seed yield (TSY), pure seed yield (PSY), and pure germinated seed yield (PGSY) for 1 July, followed by 15 June, and the cv. ‘Br-203’ showed the highest TSY, PSY, and PGSY for 15 July, followed by 1 July. Nitrogen (N) fertilization showed a negative effect on TSY for both the cultivars due to the higher N content in the soil. Withholding N fertilizer, a CCD in late-June to early-July and early-July to mid-July is recommended for cv. ‘OKI-1’ and cv. ‘Br-203’, respectively. Full article
Show Figures

Figure 1

Figure 1
<p>Grasses were cut by hand at the time specified for each closing cut date.</p>
Full article ">Figure 2
<p>Stretching three nylon net sheets in the plot.</p>
Full article ">Figure 3
<p>Experimental plots during seed harvesting.</p>
Full article ">Figure 4
<p>Meteorological, climatological, and geophysics data at the Lampang Animal Nutrition Research and Development Center in 2018 and 2019: (<b>A</b>) The average monthly rainfall and the number of rainy days in a month; (<b>B</b>) The monthly average relative humidity, the monthly average minimum, and the maximum temperature; (<b>C</b>) The monthly average day length and average daily sunshine duration.</p>
Full article ">
15 pages, 13456 KiB  
Article
Phytotoxicity and Plant Defence Induction by Cinnamomum cassia Essential Oil Application on Malus domestica Tree: A Molecular Approach
by Pierre-Yves Werrie, Anthony Juillard, Christelle Heintz, Marie-Noëlle Brisset and Marie-Laure Fauconnier
Agronomy 2022, 12(2), 512; https://doi.org/10.3390/agronomy12020512 - 18 Feb 2022
Cited by 7 | Viewed by 2428
Abstract
Essential oils (EOs) are actively investigated as an alternative to numerous synthetic biocide products. Due to their large spectra of biological activities, the impact of EOs on non-target organisms should be characterized for biopesticide development purposes. In this study the potential phytotoxicity of [...] Read more.
Essential oils (EOs) are actively investigated as an alternative to numerous synthetic biocide products. Due to their large spectra of biological activities, the impact of EOs on non-target organisms should be characterized for biopesticide development purposes. In this study the potential phytotoxicity of Cinnamomum cassia EO (CEO) on apple trees (Malus domestica) was investigated in terms of oxidative burst (glutathione redox state) and damage (malondialdehyde). At 2%, CEO concentration the reduced glutathione leaf content drops from 269.6 ± 45.8 to 143 ± 28.4 nmol g−1FW, after 30 min, illustrating a rapid and strong oxidative burst. Regarding oxidative damage, malondialdehyde increased significantly 24 h post application to 10.7 ± 3.05 nmol g−1FW. Plant defence induction was previously suspected after trans-cinnamaldehyde (CEO main compound) application. Therefore, the elicitor potential was investigated by qRT-PCR, on the expression level of 29 genes related to major defence pathways (PR protein, secondary metabolism, oxidative stress, parietal modification). Multivariate analysis and increased expression levels suggest induction of systemic resistance. Hence, the present research illustrates the dose–dependent phytotoxicity of CEO in terms of lipid peroxidation. Transcriptional data illustrates the elicitor properties of CEO. These findings can help to design pest management strategies considering both their risks (phytotoxicity) and benefits (defence activation combined with direct biocide properties). Full article
Show Figures

Figure 1

Figure 1
<p>Effect of <span class="html-italic">C. cassia</span> EO (CEO) (1 and 2% <span class="html-italic">v</span>/<span class="html-italic">v</span>) and tween 80 application on glutathione leaf content over time (<span class="html-italic">n</span> = 5): (<b>left</b>) Reduced glutathione GSH (nmol g<sup>−1</sup><sub>FW</sub>); (<b>center</b>) Total glutathione GSH+GSSG (nmol g<sup>−1</sup><sub>FW</sub>;) (<b>right</b>) the glutathione ratio GSH/GSH+GSSG (%). Star on boxplot indicates significantly different distributions (* <span class="html-italic">p</span> &lt; 0.05, ** <span class="html-italic">p</span> &lt; 0.01, *** <span class="html-italic">p</span> &lt; 0.001, pairwise <span class="html-italic">t</span>-test).</p>
Full article ">Figure 2
<p>Effect of <span class="html-italic">C. cassia</span> EO (CEO) (1 and 2% <span class="html-italic">v</span>/<span class="html-italic">v</span>) and tween 80 application on malondialdehyde (MDA) leaf content (ng/g) over time (<span class="html-italic">n</span> = 5). Star on boxplot indicates significantly different distributions (* <span class="html-italic">p</span> &lt; 0.05, ** <span class="html-italic">p</span> &lt; 0.01, *** <span class="html-italic">p</span> &lt; 0.001, pairwise <span class="html-italic">t</span>-test).</p>
Full article ">Figure 3
<p>Effect of <span class="html-italic">C. cassia</span> EO (CEO) (1 and 2% <span class="html-italic">v</span>/<span class="html-italic">v</span>) and tween 80 application on photosynthetic pigment leaf content over time (<span class="html-italic">n</span> = 5): (<b>left</b>) Chlorophyll a content (µg/g); (<b>center</b>) Chlorophyll b content (µg/g); (<b>right</b>) Carotenoid content (µg/g). Star on boxplot indicates significantly different distributions (* <span class="html-italic">p</span> &lt; 0.05, ** <span class="html-italic">p</span> &lt; 0.01).</p>
Full article ">Figure 4
<p>Effect of <span class="html-italic">C. cassia</span> EO (CEO 1% (<span class="html-italic">v</span>/<span class="html-italic">v</span>)), Bion, tween 80 and water application on mean normalised log 2 expression level (<span class="html-italic">n</span> = 4) by days of 29 mRNA transcripts of selected defence genes analysed by principal component analysis (PCA) with barycenter representation (<b>left</b>) and variable contribution to dimensions (<b>right</b>).</p>
Full article ">Figure 5
<p>Effect of <span class="html-italic">C. cassia</span> EO (CEO 1% (<span class="html-italic">v</span>/<span class="html-italic">v</span>)), Bion, tween 80 and water application on mean normalised log 2 expression levels (<span class="html-italic">n</span> = 4) by days of 29 mRNA transcripts of selected defence genes analysed by heatmap (deviations to the water controls) and the pairwise Conover test with compact letter displays (different letter representing significantly different mean).</p>
Full article ">
Previous Issue
Next Issue
Back to TopTop