[go: up one dir, main page]

Next Issue
Volume 10, October
Previous Issue
Volume 10, August


Agronomy, Volume 10, Issue 9 (September 2020) – 232 articles

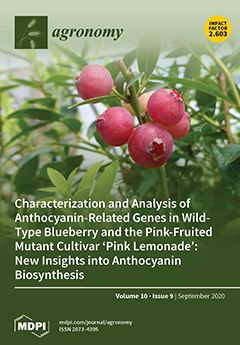
Cover Story (view full-size image): Blueberries are one of the richest sources of antioxidants, such as anthocyanins, among fruits and vegetables. The characteristic dark blue color of the fruit is a result of the accumulation of anthocyanins in the skin of the berry. In this study, we used pink-fruited ‘Pink Lemonade’ to further our understanding of anthocyanin biosynthesis in blueberry and attempt to identify the affected gene in this mutant. Expression analysis of the metabolic structural genes combined with bioinformatic analyses led to the isolation and sequencing of a regulatory gene: the transcription factor MYB1. The presence of sequence variants in the MYB1 gene, along with changes in the highly conserved features of the sequence, provide a mechanistic explanation for the mutant phenotype. Collectively, these results provide valuable information on the regulation of flavonoid biosynthesis in blueberry. View this paper
  • Issues are regarded as officially published after their release is announced to the table of contents alert mailing list.
  • You may sign up for e-mail alerts to receive table of contents of newly released issues.
  • PDF is the official format for papers published in both, html and pdf forms. To view the papers in pdf format, click on the "PDF Full-text" link, and use the free Adobe Reader to open them.
Order results
Result details
Section
Select all
Export citation of selected articles as:
25 pages, 3893 KiB  
Article
Assessment of the Capacity of Beneficial Bacterial Inoculants to Enhance Canola (Brassica napus L.) Growth under Low Water Activity
by Dasun Premachandra, Lee Hudek, Aydin Enez, Ross Ballard, Steve Barnett, Christopher M.M. Franco and Lambert Brau
Agronomy 2020, 10(9), 1449; https://doi.org/10.3390/agronomy10091449 - 22 Sep 2020
Cited by 5 | Viewed by 3959
Abstract
Canola (Brassica napus L.) is the third largest crop produced in Australia after wheat and barley. For such crops, the variability of water access, reduced long-term annual rainfall and increasing water prices, higher overall production costs, and variability in production quantity and [...] Read more.
Canola (Brassica napus L.) is the third largest crop produced in Australia after wheat and barley. For such crops, the variability of water access, reduced long-term annual rainfall and increasing water prices, higher overall production costs, and variability in production quantity and quality are driving the exploration of new tools to maintain production in an economical and environmentally sustainable way. Microorganisms associated with the rhizosphere have been shown to enhance plant growth and offer a potential way to maintain or even increase crop production quality and yield in an environmentally sustainable way. Here, seven bacterial isolates from canola rhizosphere samples are shown to enhance canola growth, particularly in low water activity systems. The seven strains all possessed commonly described plant growth promoting traits, including the ability to produce indole-3-acetic acid and 1-aminocyclopropane-1-carboxylate deaminase, and the capacity to solubilise nutrients (Fe2+/3+ and PO43−). When the isolates were inoculated at the time of sowing in pot-based systems with either sand or clay loam media, and in field trials, a significant increase in dry root and shoot biomass was recorded compared to uninoculated controls. It is likely that the strains’ plant growth promoting capacity under water stress is due to the combined effects of the bacterial phenotypes examined here. Full article
Show Figures

Figure 1

Figure 1
<p>The effect of reducing water activity on <span class="html-italic">B. napus</span> L. total biomass after 7 days of growth compared to normal water activity “control” (50% Hoagland and Arnon solidified with 1.5% agar medium and no added PEG) to −0.25 MPA (10% PEG overlayed), −0.5 (20% PEG overlayed), −0.7 MPA (30% PEG overlayed), −1.2 MPA (50% PEG Overlayed), and −1.7 (70% PEG overlayed) was assessed. “a” denotes significant difference (<span class="html-italic">p</span> &lt; 0.05) in total dry plant biomass measured for plants germinated and grown on 50% strength Hoagland and Arnon medium with 1.5% agar and 20–30% PEG compared to “control” plants germinated and grown on 50% strength Hoagland and Arnon medium with 1.5% agar. “b” denotes significant difference (<span class="html-italic">p</span> &lt; 0.05) in total dry plant biomass measured for plant germinated and grown on 50% strength Hoagland and Arnon medium with 1.5% agar and 50% PEG compared to “control” plants and all other treatment groups. “c” denotes significant difference (<span class="html-italic">p</span> &lt; 0.05) in total dry plant biomass measured for plants germinated and grown on 50% strength Hoagland and Arnon medium with 1.5% agar and 70% PEG compared to “control” plants and all other treatment groups.</p>
Full article ">Figure 2
<p>Effect of bacterial isolates on plant shoot (<b>A</b>) and root (<b>B</b>) biomass after 30 days in a laboratory based growth chamber at 22 °C, a low nutrient sand based medium supplemented with 50% Hoagland and Arnon solution and a controlled water activity of 3%. For each strain, 1 × 10<sup>3</sup> CFU of each strain was added when seeds were sown. “a” denotes significant (<span class="html-italic">p</span> &lt; 0.05) difference in dry shoot biomass for plants inoculated with <span class="html-italic">P. fluorescens</span> DUS11-9 and <span class="html-italic">Pseudomonas</span> sp. DUS5-2 compared to uninoculated control plants, and plants treated with other inoculants. “b” denotes significant (<span class="html-italic">p</span> &lt; 0.05) difference in dry shoot biomass for plants inoculated with <span class="html-italic">P. agglomerans</span> DUS1-2 compared to uninoculated control plants, and all other inoculated plants. “c” denotes significant (<span class="html-italic">p</span> &lt; 0.05) difference in dry root biomass for plants inoculated with <span class="html-italic">Pseudomonas</span> sp. DUS5-2 compared to uninoculated control plants, and all other inoculated plants.</p>
Full article ">Figure 3
<p>Effect of bacterial isolates on plant shoot (<b>A</b>) and root (<b>B</b>) biomass after 30 days in a laboratory based growth chamber at 22 °C, a low nutrient sand based medium supplemented with 50% Hoagland and Arnon solution and a controlled water activity of 1.5%. For each strain, 1 × 10<sup>3</sup> CFU of each strain was added when seeds were sown. “a” denotes significant (<span class="html-italic">p</span> &lt; 0.05) difference in dry shoot and root biomass compared to uninoculated control plants and plants inoculated with <span class="html-italic">Pseudomonas</span> sp. DUS5-2 or <span class="html-italic">P. agglomerans</span> DUS1-2.</p>
Full article ">Figure 3 Cont.
<p>Effect of bacterial isolates on plant shoot (<b>A</b>) and root (<b>B</b>) biomass after 30 days in a laboratory based growth chamber at 22 °C, a low nutrient sand based medium supplemented with 50% Hoagland and Arnon solution and a controlled water activity of 1.5%. For each strain, 1 × 10<sup>3</sup> CFU of each strain was added when seeds were sown. “a” denotes significant (<span class="html-italic">p</span> &lt; 0.05) difference in dry shoot and root biomass compared to uninoculated control plants and plants inoculated with <span class="html-italic">Pseudomonas</span> sp. DUS5-2 or <span class="html-italic">P. agglomerans</span> DUS1-2.</p>
Full article ">Figure 4
<p>Effect of bacterial isolates on plant shoot (<b>A</b>) and root (<b>B</b>) biomass after 91 days in a glasshouse system with media (soil) maintained at 8% water activity. For inoculated plants, 1 × 10<sup>3</sup> CFU of each strain were added when seeds were sown. Five biological replicates (five pots) with five technical replicates (five plants per pot) were set up and grown for 91 days for each treatment group. Significantly (<span class="html-italic">p</span> &lt; 0.05) increased dry shoot (<b>A</b>) and dry root (<b>B</b>) biomass of inoculated plants compared to uninoculated control plants are denoted by the letter “a”.</p>
Full article ">Figure 4 Cont.
<p>Effect of bacterial isolates on plant shoot (<b>A</b>) and root (<b>B</b>) biomass after 91 days in a glasshouse system with media (soil) maintained at 8% water activity. For inoculated plants, 1 × 10<sup>3</sup> CFU of each strain were added when seeds were sown. Five biological replicates (five pots) with five technical replicates (five plants per pot) were set up and grown for 91 days for each treatment group. Significantly (<span class="html-italic">p</span> &lt; 0.05) increased dry shoot (<b>A</b>) and dry root (<b>B</b>) biomass of inoculated plants compared to uninoculated control plants are denoted by the letter “a”.</p>
Full article ">Figure 5
<p>Effect of bacterial isolates on plant shoot (<b>A</b>) and root (<b>B</b>) biomass after 91 days in a glasshouse system with media (soil) maintained at 8% water activity. For inoculated plants, 1 × 10<sup>3</sup> CFU of each strain were added when seeds were sown. Five biological replicates (five pots) with five technical replicates (five plants per pot) were set up and grown for 91 days for each treatment group. Significantly (<span class="html-italic">p</span> &lt; 0.05) increased dry shoot (<b>A</b>) and dry root (<b>B</b>) biomass of inoculated plants compared to uninoculated control plants are denoted by an “a”.</p>
Full article ">Figure 5 Cont.
<p>Effect of bacterial isolates on plant shoot (<b>A</b>) and root (<b>B</b>) biomass after 91 days in a glasshouse system with media (soil) maintained at 8% water activity. For inoculated plants, 1 × 10<sup>3</sup> CFU of each strain were added when seeds were sown. Five biological replicates (five pots) with five technical replicates (five plants per pot) were set up and grown for 91 days for each treatment group. Significantly (<span class="html-italic">p</span> &lt; 0.05) increased dry shoot (<b>A</b>) and dry root (<b>B</b>) biomass of inoculated plants compared to uninoculated control plants are denoted by an “a”.</p>
Full article ">Figure 6
<p>Effect of bacterial isolates on rhizosheath mass for plants growth in 8% (<b>A</b>) or 4% (<b>B</b>) water activity after 91 days of growth in a glasshouse system in the presence of plant growth promoting (PGP) bacterial strains (control plants were uninoculated). For inoculated plants, 1 × 10<sup>3</sup> CFU of each strain were added when seeds were sown. Five biological replicates (five pots) with five technical replicates (five plants per pot) were set up and grown for 91 days for each treatment group. For rhizosheath mass from plants grown in 8% water activity: “a” denotes significant (<span class="html-italic">p</span> &lt; 0.05) difference between rhizosheath of plants inoculated with <span class="html-italic">Janthinobacterium</span> sp. DUS1-33 compared to control plants rhizosheath. “b” denotes significant (<span class="html-italic">p</span> &lt; 0.05) difference between <span class="html-italic">P. fluorescens</span> DUS11-9 and DUS1-29 compared to rhizosheaths of uninoculated control plants, or plants inoculated with <span class="html-italic">Pseudomonas</span> sp. DUS5-2, <span class="html-italic">P. fluorescens</span> DUS1-14, or <span class="html-italic">P. agglomerans</span> DUS1-2. “c” denotes significant (<span class="html-italic">p</span> &lt; 0.05) difference between <span class="html-italic">P. protegens</span> DUS1-27 with rhizosheaths from all other treatments apart from <span class="html-italic">P. fluorescens</span> DUS1-29. For rhizosheath mass from plants grown in 4% water activity: “d” denotes significant (<span class="html-italic">p</span> &lt; 0.05) difference between rhizosheaths of plants inoculated with <span class="html-italic">Pseudomonas</span> sp. DUS5-2 compared to uninoculated control plants and plants inoculated with <span class="html-italic">Janthinobacterium</span> sp. DUS1-33. “e” denotes significant (<span class="html-italic">p</span> &lt; 0.05) difference between rhizosheaths of plants inoculated with <span class="html-italic">P. fluorescens</span> DUS11-9 compared to uninoculated control plants and plants inoculated with <span class="html-italic">Pseudomonas</span> strains DUS1-29 and DUS1-27, <span class="html-italic">P. agglomerans</span> DUS1-2, or <span class="html-italic">Janthinobacterium</span> sp. DUS1-33.</p>
Full article ">Figure 6 Cont.
<p>Effect of bacterial isolates on rhizosheath mass for plants growth in 8% (<b>A</b>) or 4% (<b>B</b>) water activity after 91 days of growth in a glasshouse system in the presence of plant growth promoting (PGP) bacterial strains (control plants were uninoculated). For inoculated plants, 1 × 10<sup>3</sup> CFU of each strain were added when seeds were sown. Five biological replicates (five pots) with five technical replicates (five plants per pot) were set up and grown for 91 days for each treatment group. For rhizosheath mass from plants grown in 8% water activity: “a” denotes significant (<span class="html-italic">p</span> &lt; 0.05) difference between rhizosheath of plants inoculated with <span class="html-italic">Janthinobacterium</span> sp. DUS1-33 compared to control plants rhizosheath. “b” denotes significant (<span class="html-italic">p</span> &lt; 0.05) difference between <span class="html-italic">P. fluorescens</span> DUS11-9 and DUS1-29 compared to rhizosheaths of uninoculated control plants, or plants inoculated with <span class="html-italic">Pseudomonas</span> sp. DUS5-2, <span class="html-italic">P. fluorescens</span> DUS1-14, or <span class="html-italic">P. agglomerans</span> DUS1-2. “c” denotes significant (<span class="html-italic">p</span> &lt; 0.05) difference between <span class="html-italic">P. protegens</span> DUS1-27 with rhizosheaths from all other treatments apart from <span class="html-italic">P. fluorescens</span> DUS1-29. For rhizosheath mass from plants grown in 4% water activity: “d” denotes significant (<span class="html-italic">p</span> &lt; 0.05) difference between rhizosheaths of plants inoculated with <span class="html-italic">Pseudomonas</span> sp. DUS5-2 compared to uninoculated control plants and plants inoculated with <span class="html-italic">Janthinobacterium</span> sp. DUS1-33. “e” denotes significant (<span class="html-italic">p</span> &lt; 0.05) difference between rhizosheaths of plants inoculated with <span class="html-italic">P. fluorescens</span> DUS11-9 compared to uninoculated control plants and plants inoculated with <span class="html-italic">Pseudomonas</span> strains DUS1-29 and DUS1-27, <span class="html-italic">P. agglomerans</span> DUS1-2, or <span class="html-italic">Janthinobacterium</span> sp. DUS1-33.</p>
Full article ">Figure 7
<p>Total plant dry biomass for plants grown in either sand-based systems with 3% water activity (3% sand), sand-based system with 1.5% water activity (1.5% sand), soil-based system and 8% water activity (8% soil) or soil-based system with 4% water activity (4% soil). The ranking is based on PCA analysis where total dry plant biomass of uninoculated control plants or inoculated plants was compared across the four growth systems.</p>
Full article ">Figure 8
<p>Field trial assessment of PGP effect of bacterial isolates on plants after 91 days of growth based on dry shoot (<b>A</b>) and dry root (<b>B</b>) biomass from triplicate 10 m<sup>2</sup> plots for each treatment. For each strain, 1 × 10<sup>3</sup> CFU of each strain was added when seeds were sown. Bacterial strains that significantly (<span class="html-italic">p</span> &lt; 0.05) increase dry shoot biomass for plants inoculated with <span class="html-italic">P. fluorescens</span> DUS1-29 to uninoculated control plants or plants inoculated with other strains is denoted by an “a”.</p>
Full article ">Figure 9
<p>Principal component analysis of the effect bacterial isolates have on <span class="html-italic">B. napus</span> L. total plant dry biomass for plants grown in either sand-based systems with 3% water activity (3% sand), sand-based system with 1.5% water activity (1.5% sand), soil-based system and 8% water activity (8% soil), soil-based system with 4% water activity (4% soil), or field conditions (Field Trial). Ranking is based on PCA analysis where total dry plant biomass of uninoculated control plants or inoculated plants was compared across the five growth systems.</p>
Full article ">
18 pages, 3259 KiB  
Article
A Typological Concept to Predict the Nitrogen Release from Organic Fertilizers in Farming Systems
by André Sradnick and Carmen Feller
Agronomy 2020, 10(9), 1448; https://doi.org/10.3390/agronomy10091448 - 22 Sep 2020
Cited by 23 | Viewed by 4407
Abstract
The prediction of nitrogen (N) mineralization or immobilization in organic fertilizers is an important tool to optimize fertilizer use, especially in intensive agricultural systems. Our aim was to derive a model to predict the N mineralization/immobilization from readily available information on the properties [...] Read more.
The prediction of nitrogen (N) mineralization or immobilization in organic fertilizers is an important tool to optimize fertilizer use, especially in intensive agricultural systems. Our aim was to derive a model to predict the N mineralization/immobilization from readily available information on the properties of organic fertilizers in farming practice. On the basis of a literature review, a characterization of organic fertilizers was performed, revealing a large variance in fertilizer properties within the defined categories and subcategories. A partial linear model was derived and used for the prediction of N mineralization/immobilization based on the type of fertilizer and the carbon (C) to organic nitrogen (Norg) ratio. Depending on the previously defined category, a strong mineralization (e.g., plant- and animal-based commercial fertilizers) or a predominant immobilization (e.g., compost and slurries) was detected. For a total of seven main categories and their subcategories, individual models were developed. This work shows that the mineralization properties of organic fertilizers can be sufficiently predicted through a simple classification into a fertilizer category and through the C to Norg ratio. Full article
(This article belongs to the Section Soil and Plant Nutrition)
Show Figures

Figure 1

Figure 1
<p>Boxplot of organic N content in the fertilizer main groups (capital letters) and subgroups. The circles are the means and the stripes are the medians of the observations.</p>
Full article ">Figure 2
<p>Boxplot of organic C in the fertilizer main groups (capital letters) and subgroups. The circles are means and the stripes are the medians of the observations.</p>
Full article ">Figure 3
<p>Boxplot of organic C to organic N ratio in the fertilizer main groups (capital letters) and subgroups. The circles are means and the stripes are the medians of the observations.</p>
Full article ">Figure 4
<p>Boxplot of potential inorganic N release (<span class="html-italic">N</span><sub>0</sub>) of the fertilizer main groups (capital letters) and subgroups. The circles are the means and the stripes are the medians of the observations.</p>
Full article ">Figure 5
<p>Boxplot of the mineralization rate constant <span class="html-italic">k</span> [°Cd]<sup>−1</sup> of the fertilizer main groups (capital letters) and subgroups. The circles are the means and the stripes are the medians of the observations.</p>
Full article ">Figure 6
<p>Dependency of potential inorganic N release within 150 days after organic fertilizer application on the fertilizer C to organic N ratio in different fertilizer classes.</p>
Full article ">Figure 7
<p>Dependency of potential inorganic N release within 150 days after organic fertilizer application on the fertilizer C to organic N ratio in different fertilizer classes.</p>
Full article ">
34 pages, 1910 KiB  
Review
Sociotechnical Context and Agroecological Transition for Smallholder Farms in Benin and Burkina Faso
by Parfait K. Tapsoba, Augustin K. N. Aoudji, Madeleine Kabore, Marie-Paule Kestemont, Christian Legay and Enoch G. Achigan-Dako
Agronomy 2020, 10(9), 1447; https://doi.org/10.3390/agronomy10091447 - 22 Sep 2020
Cited by 16 | Viewed by 7114
Abstract
West Africa is facing the challenge of its population’s food insecurity in a context of accelerated degradation of natural resources. In order to efficiently face this double bottleneck, agroecological interventions were implemented as a way to promote best agricultural practices. Agroecology is a [...] Read more.
West Africa is facing the challenge of its population’s food insecurity in a context of accelerated degradation of natural resources. In order to efficiently face this double bottleneck, agroecological interventions were implemented as a way to promote best agricultural practices. Agroecology is a mode of production that nowadays questions our food system which, despite technological progress, still struggles to feed the world’s population. This systematic review is part of the vision of a deep agroecology and aims at analyzing the institutional, political, organizational, and social obstacles and levers for an agroecological transition and its amplification in Burkina Faso and Benin. For this purpose, a structured literature review was conducted using grey and published literature. It appears that despite the mitigated results of the implementation of the Green Revolution model of agricultural production in West Africa, African public authorities seem to have placed once again their faith in conventional production practices to respond to the challenges facing agriculture in the region. This situation goes beyond the regional framework to take root at the national level, (e.g., Burkina Faso, Benin), with the corollary of an apparent lack of institutional interest in sustainable modes of production. However, there is a network of stakeholders who are developing promising initiatives for scaling up agroecological practices. Full article
(This article belongs to the Special Issue Agroecology and Organic Agriculture for Sustainable Crop Production)
Show Figures

Figure 1

Figure 1
<p>Global lexicometric overview of used documents’ titles.</p>
Full article ">Figure 2
<p>Research conceptual framework.</p>
Full article ">Figure 3
<p>Organizational dynamics of stakeholders in the agroecological transition in Benin and Burkina Faso.</p>
Full article ">Figure 4
<p>Schematic pathway of the transition process.</p>
Full article ">
20 pages, 2333 KiB  
Article
Biochar Impacts on Acidic Soil from Camellia Oleifera Plantation: A Short-Term Soil Incubation Study
by Qianqian Song, Yifan He, Yuefeng Wu, Shipin Chen, Taoxiang Zhang and Hui Chen
Agronomy 2020, 10(9), 1446; https://doi.org/10.3390/agronomy10091446 - 22 Sep 2020
Cited by 5 | Viewed by 2626
Abstract
Nowadays, biochar is increasingly used widely as an important soil amendment to enhance soil nutrients availability. Therefore, we investigated the effect of C.oleifera shell biochar (CSB) on C.oleifera plantation soils to provide evidence that C. oleifera shell as a raw material [...] Read more.
Nowadays, biochar is increasingly used widely as an important soil amendment to enhance soil nutrients availability. Therefore, we investigated the effect of C.oleifera shell biochar (CSB) on C.oleifera plantation soils to provide evidence that C. oleifera shell as a raw material in biochar has great potential to be a soil amendment. For this, a short-term incubation experiment was conducted in controlled conditions to evaluate the effects of CSB application on two soil chemical properties, microbial biomass, and enzymatic activity. We compared two acidic soils, mixed with CSB of three pyrolysis temperatures (300, 500, and 700 °C), and two application rates (3% and 5% (w/w)), incubated for 180 days. The results showed that the soil pH, total P (TP), and available P (AP) significantly increased under 5CSB700 in two soils, and indicated CSB application rate and pyrolysis temperature had a significant impact on soil pH, TP, and AP (p < 0.05). CSB application also significantly increased the total inorganic P in two soils and presented a significantly positive correlation with soil pH, TP, and AP under redundancy analysis. The results suggested that CSB application has a variable effect on soil enzymatic activity, microbial biomass C (MBC), and microbial biomass P (MBP) on average, while it increased the soil microbial biomass N (MBN) in both soils. We concluded that CSB could be a soil amendment to increase soil nutrients of C.oleifera plantation soils. Before the application of biochar to C.oleifera plantation forest soils, long-term studies are required to assess the effects of biochar under field conditions and its promoting effect on the growth of C. oleifera. Full article
Show Figures

Figure 1

Figure 1
<p>Redundancy analyses (RDA) of the correlations between soil chemical properties and P fractionation in all treatments. (<b>A</b>): RDA of red soil with 3% application rate of <span class="html-italic">C. oleifera</span> shell biochar (CSB); (<b>B</b>): RDA of red soil with 5% application rate of CSB; (<b>C</b>): RDA of purple soil with 3% application rate of CSB; (<b>D</b>): RDA of purple soil with 5% application rate of CSB; The blue arrows indicate the soil chemical properties had a significant effect on soil inorganic P fractions (<span class="html-italic">p</span> &lt; 0.05).</p>
Full article ">Figure 2
<p>Soil enzyme activities in both soils after 180 days of incubation. The <span class="html-italic">X</span>-axis indicates different soil types, including red soil and purple soil. (<b>A</b>): InA activity in both soils after 180 days of incubation. (<b>B</b>): UA activity in both soils after 180 days of incubation. (<b>C</b>): AcPA activity in both soils after 180 days of incubation. (<b>D</b>): CatA activity in both soils after 180 days of incubation. Control: red/purple soil without biochar application; Abbreviation: InA: invertase activity, UA: urease activity, AcPA: acid phosphatase, CatA: catalase activity. Different lowercase letters within a line indicated significant differences between treatments at the <span class="html-italic">p</span> &lt; 0.05 level. Error bars indicating S.E, (<span class="html-italic">n</span> = 3).</p>
Full article ">Figure 3
<p>Soil microbial biomass in both soils after 180 days of incubation. The <span class="html-italic">X</span>-axis indicates different soil types, including red soil and purple soil. (<b>A</b>): MBC in both soils after 180 days of incubation. (<b>B</b>): MBN in both soils after 180 days of incubation. (<b>C</b>): MBP in both soils after 180 days of incubation. Control: red/purple soil without biochar application; Abbreviation: MBC represents microbial biomass carbon; MBN indicates microbial biomass nitrogen; MBP indicates microbial biomass phosphorus; Error bars indicating S.E, (<span class="html-italic">n</span> = 3). Different lowercase letters within a line indicated significant differences among treatments at the <span class="html-italic">p</span> &lt; 0.05 level.</p>
Full article ">Figure 4
<p>Score plot of the principal component analysis (PCA).</p>
Full article ">
15 pages, 10043 KiB  
Perspective
Predisposing Factors for “Olive Quick Decline Syndrome” in Salento (Apulia, Italy)
by Marco Scortichini
Agronomy 2020, 10(9), 1445; https://doi.org/10.3390/agronomy10091445 - 22 Sep 2020
Cited by 16 | Viewed by 4251
Abstract
Recently, a new severe disease has been reported in the Salento area (Apulia region, southern Italy) in the multimillennial olive agro-ecosystem, given the common name “olive quick decline syndrome” (OQDS). Together with Xylella fastidiosa subsp. pauca, some pathogenic fungi such as Phaeoacremonium [...] Read more.
Recently, a new severe disease has been reported in the Salento area (Apulia region, southern Italy) in the multimillennial olive agro-ecosystem, given the common name “olive quick decline syndrome” (OQDS). Together with Xylella fastidiosa subsp. pauca, some pathogenic fungi such as Phaeoacremonium spp. have been found associated with the disease. The main predisposing factors to the disease seem to be local cultivar susceptibility, depletion of some micronutrients in the soil that could be related to some agronomical practices favoring the depletion of soil fertility, an incorrect pruning cycle, climatic changes that result in increased soil waterlogging, and frost and drought events. The possible synergistic action of microorganisms other than X. f. subsp. pauca cannot be excluded. The features characterizing the areas where OQDS first appeared and subsequently spread, described and discussed here, would point to a rather fragile environment where one or more adverse climatic and/or edaphic factors could have acted together. The intrinsic peculiarities and management of the Salento olive agro-ecosystem could also have played a fundamental role in enhancing the virulence of X. f. subsp. pauca once introduced from abroad. Full article
Show Figures

Figure 1

Figure 1
<p>Symptoms on trunk and twigs of olive trees induced by <span class="html-italic">Pseudomonas savastanoi</span> pv. <span class="html-italic">savastanoi</span>. The infection causes a decrease of compounds related to the tree defense, such as phenolic compounds.</p>
Full article ">Figure 2
<p>Soil ionome comparison between areas of Apulia and Basilicata (BAT-PZ) not affected by olive quick decline syndrome (OQDS) and areas of Salento (BR, LE, TA) characterized by the occurrence of OQDS revealed different zinc (Zn) and copper (Cu) content despite a similar calcareous origin. Areas where OQDS is present show a marked reduction of both ions. BAT-PZ, Barletta–Andria–Trani province; PZ, Potenza province; BR, Brindisi province; LE, Lecce province; TA, Taranto province. Reproduced from [<a href="#B45-agronomy-10-01445" class="html-bibr">45</a>].</p>
Full article ">Figure 3
<p>An example of a centennial olive tree showing good pruning care. Note the reddish color of the trunk due to ferric sulfate.</p>
Full article ">Figure 4
<p>Hard pruning performed on centennial trees to reduce <span class="html-italic">Xylella fastidiosa</span> subsp. <span class="html-italic">pauca</span> inoculums greatly worsens the symptoms of OQDS.</p>
Full article ">Figure 5
<p>Waterlogging in olive groves due to a relative excess of precipitation occurring over a short time. The soil of Salento where olive groves are cultivated can be very solid, which does not allow the water to infiltrate. Prolonged anaerobic conditions in the soil can occur, causing deleterious effects to the root system of the trees.</p>
Full article ">Figure 6
<p>During 2017 the Salento area faced frost (first part of January) and drought (only 7.8 mm of rainfall from 1 June to 30 August). These severe phenomena have occurred more often in the last decades than in the past. Reproduced with permission from [<a href="#B78-agronomy-10-01445" class="html-bibr">78</a>].</p>
Full article ">Figure 7
<p>Abandonment of olive groves led to further spread of <span class="html-italic">Xylella fastidiosa</span> subsp. <span class="html-italic">pauca</span> due to proliferation of the insect vector.</p>
Full article ">
14 pages, 1396 KiB  
Article
Genome-Wide Association Study (GWAS) Analysis of Camelina Seedling Germination under Salt Stress Condition
by Zinan Luo, Aaron Szczepanek and Hussein Abdel-Haleem
Agronomy 2020, 10(9), 1444; https://doi.org/10.3390/agronomy10091444 - 22 Sep 2020
Cited by 20 | Viewed by 3848
Abstract
Camelina sativa is an important renewable oilseed crop for biofuel and feedstock that can relieve the reliance on petroleum-derived oils and reduce greenhouse gases and waste solids resulting from petroleum-derived oils consumption. C. sativa has recently seen revived attention due to its high [...] Read more.
Camelina sativa is an important renewable oilseed crop for biofuel and feedstock that can relieve the reliance on petroleum-derived oils and reduce greenhouse gases and waste solids resulting from petroleum-derived oils consumption. C. sativa has recently seen revived attention due to its high oil content, high omega-3 unsaturated fatty acids, short life cycle, broader regional adaptation, and low-input agronomic requirements. However, abiotic stress such as salinity stress has imposed threatens on plant photosynthesis and growth by reducing water availability or osmotic stress, ion (Na+ and Cl) toxicity, nutritional disorders and oxidative stress yield. There still remains much to know for the molecular mechanisms underlying these effects. In this study, a preliminary study applying 10 C. sativa cultivars to be treated under a gradient NaCl concentrations ranging from 0–250 mM and found that 100 mM was the optimal NaCl concentration to effectively differentiate phenotypic performance among different genotypes. Then, a spring panel consisting of 211 C. sativa accessions were germinated under 100 mM NaCl concentration. Six seedling germination traits, including germination rate at two stages (5-day and 9-day seedling stages), germination index, dry and fresh weight, and dry/fresh ratio, were measured. Significant correlations were found between the germination rate at two stages as well as plant biomass traits. Combining the phenotypic data and previously obtained genotypic data, a total of 17 significant trait-associated single nucleotide polymorphisms (SNPs) for the germination rate at the two stages and dry weight were identified from genome-wide association analysis (GWAS). These SNPs are located on putative candidate genes controlling plant root development by synergistically mediating phosphate metabolism, signal transduction and cell membrane activities. These identified SNPs could provide a foundation for future molecular breeding efforts aimed at improved salt tolerance in C. sativa. Full article
(This article belongs to the Special Issue New Oilseed Crops for Biofuel and Biobased Applications)
Show Figures

Figure 1

Figure 1
<p>Preliminary salt treatment study determines the optimal salt stress conditions for <span class="html-italic">Camelina sativa</span>. (<b>a</b>) germination percentage of <span class="html-italic">Camelina sativa</span> cultivars seedlings under different NaCl salt concentrations; and (<b>b</b>) germination percentage of 10 <span class="html-italic">C. sativa</span> cultivars seedling under different NaCl salt concentrations. Note: letters “a” or “b” refer to significant difference levels.</p>
Full article ">Figure 2
<p>(<b>a</b>) Best linear unbiased predictor (BLUP) values of germination rate after 5- and 9-days of planting and germination index (GI) for 211 <span class="html-italic">C. sativa</span> accessions germinated under 100 mM NaCl; and (<b>b</b>) dry weight BLUPs of the 211 <span class="html-italic">C. sativa</span> accessions germinated under 100 mM NaCl.</p>
Full article ">Figure 3
<p>Manhattan plots for significant trait-associated single nucleotide polymorphisms (SNPs) in Camelina sativa under salt stress. (<b>A</b>) dry weight; (<b>B</b>) germination percentage after 5 days on 100 mM NaCl; (<b>C</b>) germination percentage after 9 days on 100 mM NaCl.</p>
Full article ">
18 pages, 4284 KiB  
Article
Quality and Storability of Trellised Greenhouse-Grown, Winter-Harvested, New Sweet Acorn Squash Hybrids
by Ayobami Adeeko, Fabiola Yudelevich, Ginat Raphael, Lior Avraham, Hana Alon, Merav Zaaroor Presman, Sharon Alkalai-Tuvia, Harry S. Paris, Elazar Fallik and Carmit Ziv
Agronomy 2020, 10(9), 1443; https://doi.org/10.3390/agronomy10091443 - 22 Sep 2020
Cited by 4 | Viewed by 3384
Abstract
Acorn squash (Cucurbita pepo) is a familiar fruit vegetable in North America, appreciated for its attractive appearance, good flavor, nutritional content and long storage life. A breeding program in Israel has produced three new acorn squash hybrids of enhanced sweetness and [...] Read more.
Acorn squash (Cucurbita pepo) is a familiar fruit vegetable in North America, appreciated for its attractive appearance, good flavor, nutritional content and long storage life. A breeding program in Israel has produced three new acorn squash hybrids of enhanced sweetness and flavor. Presently, we evaluated productivity, quality, and storability of these new cultivars in fall plantings. The plants were grown trellised, in an insect-proof greenhouse, for fruit production during the winter to meet consumer demand. The plants were highly productive and bore fruits of superb quality, but there was a high incidence of fungal rots during postharvest cold storage. Pre-treating the fruits with hot water brushing and rinsing before storage was found effective in reducing rot incidence of the fruits stored at 15 °C, but only for one cultivar. Storing the fruits at 10 °C with reduced humidity (Rh 70%) enabled a 3-month shelf life with significantly reduced fruit-rot incidence and minimal effect on fruit quality of all three cultivars. Storage at 20 °C with reduced humidity was suitable for a 1-month period. These protocols for prolonging storage life will help attain controlled, gradual year-round marketing of quality acorn squash at uniform, reasonable price levels for farmers and consumers, and could facilitate overseas export. Full article
Show Figures

Graphical abstract

Graphical abstract
Full article ">Figure 1
<p>(<b>a</b>) Trellised growth of acorn squash in the netted greenhouse. (<b>b</b>) Fruit load on a trellised plant.</p>
Full article ">Figure 2
<p>Fruits of the three tested cultivars harvested from trellis-grown plants.</p>
Full article ">Figure 3
<p>Correlation between total soluble solids (TSS) and percent dry weight (DW) in acorn squash fruit flesh at the time of harvest (<span class="html-italic">n</span> = 90, <span class="html-italic">r</span> = 0.607, <span class="html-italic">p &lt;</span> 0.0001).</p>
Full article ">Figure 4
<p>Pulp color a * measured for fruits with different levels of carotenoids.</p>
Full article ">Figure 5
<p>Fruit decay during cold storage at 15 °C Rh 95%. Rot incidents were recorded weekly. Cumulative data of 2 months of storage are presented. Each experiment was conducted 3 times (with fruits of three different harvests), each experiment included 2 repeats for each treatment. Bars indicate standard error. Means without a common letter are significantly different (Tukey HSD, α = 0.05).</p>
Full article ">Figure 6
<p>Fruit decay incidence under various storage conditions of the three hybrids (1700, 2054 and 2005). Rot incidences were recorded weekly. Cumulative data of 3 months of storage are presented. Each experiment was conducted at least 4 times (from fruits of 4 different harvests), each experiment included 2 repeats for each treatment. Bars indicate standard error. Two-component analysis is presented for cultivar and storage condition. Means without a common letter are significantly different (Tukey HSD, α = 0.05).</p>
Full article ">Figure 7
<p>Fruit weight loss under four storage conditions, by cultivar from one representative experiment. WL was evaluated periodically. Bars indicate standard error; <span class="html-italic">n</span> = 20 fruits for each storage condition of each cultivar, for a total of 240 fruits.</p>
Full article ">Figure 8
<p>Fruits stored at 15 °C Rh 95% or 20 °C Rh 60% for 1 and 2 months.</p>
Full article ">Figure 9
<p>Fruits stored at 15 °C Rh 95%, 10 °C Rh 95% or 10 °C Rh 70%for 3 months.</p>
Full article ">Figure 10
<p>Hedonic test of the fruit flesh of three Hybrids 1700, 2054 and 2005, from two harvests (Harvest 1 and Harvest 2), upon harvest or after three months of storage at 10 °C Rh 70% or 15 °C Rh 95%. Results of sweetness (Sweet), texture, general impression (Impression) and bitterness at harvest or at the end of storage are presented. 1/2 indicate harvest number. The score of each parameter was 1 to 4: Sweetness 1—not sweet, 2—slightly sweet, 3—moderately sweet, 4—very sweet. Texture 1—very fibrous, 2—fibrous, 3—slightly fibrous, 4—very smooth. General impression 1—not tasty, 2—slightly tasty, 3—moderately tasty, 4—very tasty. Bitterness 1—very bitter, 2—moderately bitter, 3—slightly bitter, 4—not bitter.</p>
Full article ">
12 pages, 1558 KiB  
Article
Rootstock Effects on Yield and Some Consumer Important Fruit Quality Parameters of Eggplant cv. ‘Madonna’ under Protected Cultivation
by Maryam Mozafarian, Nazatul Syaima Binti Ismail and Noémi Kappel
Agronomy 2020, 10(9), 1442; https://doi.org/10.3390/agronomy10091442 - 22 Sep 2020
Cited by 8 | Viewed by 3347
Abstract
This study aimed to investigate the effect of different rootstocks on the yield and quality of eggplant cv. ‘Madonna’ in soilless pot culture in an unheated polyethylene greenhouse. The eggplant was grafted onto several rootstocks, including tomato rootstocks Optifort (O) and Emperador (E), [...] Read more.
This study aimed to investigate the effect of different rootstocks on the yield and quality of eggplant cv. ‘Madonna’ in soilless pot culture in an unheated polyethylene greenhouse. The eggplant was grafted onto several rootstocks, including tomato rootstocks Optifort (O) and Emperador (E), and four Solanum rootstocks; Solanum grandiflorum × Solanum melongena (SH), Solanum torvum (ST), Solanum melongena × Solanum integrifolium (SI), and Solanum integrifolium (A) compared with self-grafted (SG) and self-rooted (SR) as control. The results showed that the total marketable yield significantly increased by grafting onto ST (3.94 kg/plant), SH (3.36 kg/plant), and A (3.34 kg/plant) relative to SR (1.65 kg/plant). The chromatics characters of skin and pulp are slightly influenced by rootstocks. Our findings confirmed that grafting eggplant decreased firmness (except SH) of the flesh. Fruit harvested from the Optifort/Madonna combination had the rounded shape, lowest firmness, and Brix value, while the lowest oxidation potential was observed in this combination. The highest seed number was observed in SH/Madonna and SI/Madonna combinations. During the sensory evaluation, the lightest fruit flesh was found in SR, ST, and O, and the sweetest taste was observed in fruits harvested from ST rootstock. Full article
Show Figures

Figure 1

Figure 1
<p>Temperature and relative humidity at the greenhouse during cultivation.</p>
Full article ">Figure 2
<p>Effect of different rootstock combinations on fruit seed number. SR = self-root; SG = self-grafting; SH = <span class="html-italic">S. grandiflorum</span> × <span class="html-italic">S. melongena</span>; ST = <span class="html-italic">S. torvum</span>; SI = <span class="html-italic">S. melongena</span> × <span class="html-italic">S. integrifolium</span>; A = <span class="html-italic">S. integrifolium</span>; E = Emperador; O = Optifort.</p>
Full article ">Figure 3
<p>Effect of different rootstock combinations on sensory evaluation of fruit by trained panellists.</p>
Full article ">
12 pages, 586 KiB  
Communication
Opportunities and Challenges in Doubled Haploids and Haploid Inducer-Mediated Genome-Editing Systems in Cucurbits
by Isidre Hooghvorst and Salvador Nogués
Agronomy 2020, 10(9), 1441; https://doi.org/10.3390/agronomy10091441 - 22 Sep 2020
Cited by 17 | Viewed by 4917
Abstract
Doubled haploids have played a major role in cucurbit breeding for the past four decades. In situ parthenogenesis via irradiated pollen is the preferred technique to obtain haploid plantlets whose chromosomes are then doubled in Cucurbitaceae, such as melon, cucumber, pumpkin, squash and [...] Read more.
Doubled haploids have played a major role in cucurbit breeding for the past four decades. In situ parthenogenesis via irradiated pollen is the preferred technique to obtain haploid plantlets whose chromosomes are then doubled in Cucurbitaceae, such as melon, cucumber, pumpkin, squash and winter squash. In contrast to doubled haploid procedures in other species, in situ parthenogenesis in cucurbits presents many limiting factors which impede efficient production of haploids. In addition, it is very time-consuming and labor-intensive. However, the haploid inducer-mediated genome-editing system is a breakthrough technology for producing doubled haploids. Several reports have described using the CRISPR/Cas9 system in cucurbit species, and although its application has many bottlenecks, the targeted knock-out of the CENH3 gene will allow breeders to obtain haploid inducer lines that can be used to obtain parthenogenetic embryos. In this review, we discuss the progress made towards the development of doubled haploids and haploid inducer genotypes using CRISPR/Cas9 technologies in cucurbit species. The present review provides insights for the application of haploid inducer-mediated genome-editing system in cucurbit species Full article
Show Figures

Figure 1

Figure 1
<p>Schematic representation of the obtention of a haploid inducer line and its maintainer. WT: wild type.</p>
Full article ">
19 pages, 1372 KiB  
Article
Assessment of the Bioavailability and Speciation of Heavy Metal(loid)s and Hydrocarbons for Risk-Based Soil Remediation
by Diana Agrelli, Antonio Giandonato Caporale and Paola Adamo
Agronomy 2020, 10(9), 1440; https://doi.org/10.3390/agronomy10091440 - 22 Sep 2020
Cited by 17 | Viewed by 3096
Abstract
For the assessment of the environmental and sanitary risks deriving from contamination of agricultural soils, it is crucial to identify and characterize the contaminants and study the soil chemical properties influencing their mobility and bioavailability. This information is essential for the selection of [...] Read more.
For the assessment of the environmental and sanitary risks deriving from contamination of agricultural soils, it is crucial to identify and characterize the contaminants and study the soil chemical properties influencing their mobility and bioavailability. This information is essential for the selection of the best site remediation and securing strategy. The study site of this work is agricultural land of 6 ha in the province of Naples (Italy) subject to the past illegal burial of industrial wastes, principally from tanneries. With the aim of identifying the contaminants and assessing their mobility and bioavailability, the soil of the site was characterized for the main chemical and physical properties and for the concentration of potentially toxic elements and hydrocarbons. The readily and potentially bioavailable fractions of the main metal contaminants and their distribution in the soil geochemical fractions were determined by extraction in 1 M of NH4NO3, 0.05 M of ethylenediaminetetraacetic acid (EDTA) pH 7, and European Community Bureau of Reference (EU-BCR) sequential fractionation. Further, the speciation of heavy hydrocarbons and chromium was carried out. The agricultural soil was widely contaminated by chromium, zinc, and heavy hydrocarbons (up to 4487, 1846, and 1800 mg/kg, respectively). In some sub-areas, contaminations by cadmium, lead, and copper (up to 283, 417, and 1183 mg/kg, respectively) were also observed. The chromium was found to be scarcely mobile and bioavailable and was mainly associated with the oxidizable, residual, and reducible fractions of the soil (on average 56%, 25%, and 19% of the total, respectively). However, chromium speciation revealed the presence of a significant amount of highly toxic Cr(VI) (above the legal threshold of 2 mg/kg), despite the low oxidizing power of the soil. Zinc was more mobile and bioavailable than chromium and was mainly distributed among the acetic acid-extractable and reducible fractions of the soil (on average 28% and 47% of the total, respectively). Cadmium was found to be very mobile and bioavailable, and was mainly distributed in the acetic acid-extractable and reducible fractions of the soil (on average 40% and 45% of the total). The speciation of heavy hydrocarbons showed that they consist almost entirely of long-chain aliphatic hydrocarbons, considered not very toxic and immobile. These results suggest that the use of not-edible plant coverage might be the best securing and remediation action for the study site, with the potential to preserve the soil ecosystem services, contain the risk of soil erosion and particle dispersion, and phytoextract the bioavailable metals. Full article
(This article belongs to the Special Issue Agronomic Approaches for Remediation of Contaminated Soils)
Show Figures

Figure 1

Figure 1
<p>Total contents of HH-C &gt; 10, Cr, Zn, Pb, Cu, and Cd (aqua regia digestion) in the soil samples (<span class="html-italic">n</span> = 507) collected in the study site. Each plot represents the minimum and maximum (whiskers) and median (bar) values; the box ranges from the 25° to 75° percentile. Red lines indicate the Italian contamination threshold concentration for agricultural soil set by D.M. 46/2019.</p>
Full article ">Figure 2
<p>Correlation between the total amount (aqua regia digestion) of Cr, Zn, Pb, Cu, and Cd and the amounts extracted by NH<sub>4</sub>NO<sub>3</sub> and EDTA from the 10 selected soil samples.</p>
Full article ">Figure 3
<p>BCR sequential extractions of Cr, Zn, Pb, Cu, and Cd from 7 of the 10 selected soil samples. For each element, the distribution is shown in percentage terms.</p>
Full article ">Figure 4
<p>Comparison of the Cr, Zn Pb, Cu, and Cd amounts extracted by NH<sub>4</sub>NO<sub>3</sub> (small graphs within the main graphs), EDTA, and Step 1 of the BCR sequential extraction. For Pb, the NH<sub>4</sub>NO<sub>3</sub> extracted amounts were for all samples &lt; 0.1 mg/kg.</p>
Full article ">Figure 5
<p>Percent of Cr(VI) spike recovery in the function of the soil organic carbon content.</p>
Full article ">
15 pages, 1135 KiB  
Article
Soil Nitrogen in Response to Interseeded Cover Crops in Maize–Soybean Production Systems
by Yesuf Assen Mohammed, Swetabh Patel, Heather L. Matthees, Andrew W. Lenssen, Burton L. Johnson, M. Scott Wells, Frank Forcella, Marisol T. Berti and Russ W. Gesch
Agronomy 2020, 10(9), 1439; https://doi.org/10.3390/agronomy10091439 - 22 Sep 2020
Cited by 10 | Viewed by 2591
Abstract
Improved agronomic management strategies are needed to minimize the impact that current maize (Zea mays L.) and soybean (Glycine max (L.) Merr.) production practices have on soil erosion and nutrient losses, especially nitrogen (N). Interseeded cover crops in standing maize and [...] Read more.
Improved agronomic management strategies are needed to minimize the impact that current maize (Zea mays L.) and soybean (Glycine max (L.) Merr.) production practices have on soil erosion and nutrient losses, especially nitrogen (N). Interseeded cover crops in standing maize and soybean scavenge excess soil N and thus reduce potential N leaching and runoff. The objectives were to determine the impact that pennycress (Thlaspi arvense L.) (PC), winter camelina (Camelina sativa (L.) Crantz) (WC), and winter rye (Secale cereale L.) (WR) cover crops have on soil N, and carbon (C) and N accumulation in cover-crop biomass. The cover crops were interseeded in maize at the R5 growth stage and in soybean at R7 in four replicates over two growing seasons at four locations. Soil and aboveground biomass samples were taken in autumn and spring. Data from the maize and soybean systems were analyzed separately. The results showed that cover crops had no effect on soil NH4+-N under both systems. However, winter rye decreased soil NO3-N up to 76% compared with no-cover-crop treatment in the soybean system. Pennycress and WC scavenged less soil N than WR. Similarly, N and C accumulation in PC and WC biomass were less than in WR, in part because of their poor growth performance under the interseeding practice. Until PC and WC varieties with improved suitability for interseeding are developed, other agronomic practices may need to be explored for improving N scavenging in maize and soybean cropping systems to reduce nutrient leaching and enhance crop diversification. Full article
(This article belongs to the Section Innovative Cropping Systems)
Show Figures

Figure 1

Figure 1
<p>Mean soil NH<sub>4</sub><sup>+</sup>-N (mg kg<sup>−1</sup>) at 0–15 cm and 15–60 cm soil depths for control (no-cover crop), pennycress (PC), winter camelina (WC), and winter rye (WR) when cover crops were interseeded in standing maize and soybean at (<b>a</b>) Ames, (<b>b</b>) Morris, (<b>c</b>) Prosper, and (<b>d</b>) Rosemount. Data for Rosemount under maize are not included due to technical error. AUT = soil samples taken in autumn; SPR = soil samples taken in spring; RSH = soil sample taken immediately following relayed soybean harvesting. There was no statistical difference among treatments for same soil depth and same season in a system at a specific location. Error bars are standard error of the means.</p>
Full article ">Figure 2
<p>Mean soil NO<sub>3</sub><sup>−</sup>-N (mg kg<sup>−1</sup>) at 0–15 cm and 15–60 cm soil depths for control (no-cover crop), pennycress (PC), winter camelina (WC), and winter rye (WR) when cover crops were interseeded in standing maize at (<b>a</b>) Ames, (<b>b</b>) Morris, and (<b>c</b>) Prosper. AUT = soil samples taken in autumn; SPR = soil samples taken in spring; RSH = soil sample taken immediately following relayed soybean harvesting. Means with the same letter under same soil depth and same season at a location were statistically the same.</p>
Full article ">Figure 3
<p>Mean soil NO<sub>3</sub><sup>−</sup>-N (mg kg<sup>−1</sup>) at 0–15 cm and 15–60 cm soil depths for control (no-cover crop), pennycress (PC), winter camelina (WC), and winter rye (WR) when cover crops were interseeded in standing soybean at (<b>a</b>) Ames, (<b>b</b>) Morris, (<b>c</b>) Prosper, and (<b>d</b>) Rosemount. AUT = soil samples taken in autumn; SPR = soil samples taken in spring; RSH = soil sample taken immediately following relayed soybean harvesting. Means with the same letter under same soil depth and same season at a location were statistically the same.</p>
Full article ">Figure 4
<p>Mean nitrogen accumulation (kg N ha<sup>−1</sup>) for the different cover-crops (PC = pennycress, WC = winter camelina, and WR = winter rye) biomass in autumn (AUT) and spring (SPR) at Ames, Morris, Prosper, and RM (Rosemount) when cover crops were interseeded in standing (<b>a</b>) maize and (<b>b</b>) soybean. Means with same letter within a location and a season for the same system were statistically the same. Data for maize system and in autumn for soybean system for Rosemount (RM) are not available.</p>
Full article ">Figure 5
<p>Mean carbon accumulation (kg C ha<sup>−1</sup>) in the different cover-crop (PC = pennycress, WC = winter camelina, and WR = winter rye) biomass in autumn (AUT) and spring (SPR) at Ames, Morris, Prosper, and RM (Rosemount) when cover crops were interseeded in standing (<b>a</b>) maize and (<b>b</b>) soybean. Means with same letter within a location and a season for the same system were statistically same. Data for maize system and in autumn for soybean system at Rosemount (RM) are not available.</p>
Full article ">
14 pages, 1270 KiB  
Article
Nitrogen Fixation and Resource Partitioning in Alfalfa (Medicago sativa L.), Cicer Milkvetch (Astragalus cicer L.) and Sainfoin (Onobrychis viciifolia Scop.) Using 15N Enrichment under Controlled Environment Conditions
by Gazali Issah, Jeff J. Schoenau, Herbert A. Lardner and J. Diane Knight
Agronomy 2020, 10(9), 1438; https://doi.org/10.3390/agronomy10091438 - 22 Sep 2020
Cited by 17 | Viewed by 3911
Abstract
Availability of nitrogen (N) limits pasture production. Inclusion of legumes into grass pastures can provide an alternative N source through biological N2 fixation (BNF), and enhance retention and cycling of soil C and N. Despite the use of alfalfa (Medicago sativa [...] Read more.
Availability of nitrogen (N) limits pasture production. Inclusion of legumes into grass pastures can provide an alternative N source through biological N2 fixation (BNF), and enhance retention and cycling of soil C and N. Despite the use of alfalfa (Medicago sativa L.), cicer milkvetch (Astragalus cicer L.) and sainfoin (Onobrychis viciifolia Scop.) in grass-legume pastures to improve forage quality, relative BNF potentials and resource partitioning are unknown. We quantified BNF using 15N isotope dilution and estimated resource partitioning in alfalfa, two cultivars of cicer milkvetch and two cultivars of sainfoin under controlled conditions. Percentage of nitrogen derived from atmosphere followed the order alfalfa (92%) > cicer milkvetch (87%) > sainfoin (81%); corresponding to estimated N contributions of 200, 128 and 65 kg N ha−1 yr−1, respectively, based on total herbage. Root dry matter was 24% to 36% greater than shoot dry matter in all of the legumes, providing substantial below-ground C and N. Cultivars of the same species did not differ in any measured parameter (p > 0.05). Despite the lower BNF in cicer milkvetch and sainfoin compared to alfalfa, their use may not negatively affect stand productivity and C storage. Full article
(This article belongs to the Section Grassland and Pasture Science)
Show Figures

Figure 1

Figure 1
<p>Nitrogen derived from the atmosphere (% Ndfa) in the shoot (<b>a</b>), root (<b>b</b>), and whole plant (<b>c</b>) among legume species and cultivars (<span class="html-italic">n</span> = 4) grown under controlled environment conditions. ALF = alfalfa, OXY = Oxley II milkvetch, VEL = Veldt milkvetch, COM = Common sainfoin, MTV = Mountainview sainfoin. The box is comprised of the 75th percentile, median, and 25th percentile, while the upper and lower whiskers are the maximum and minimum values, respectively. Boxes with the same letters indicate no significant differences among legume cultivars within a panel (<span class="html-italic">p</span> &gt; 0.05) according to Tukey’s HSD test.</p>
Full article ">Figure 2
<p>Amount of N fixed (g N pot<sup>−1</sup>) in the shoot (<b>a</b>), root (<b>b</b>), and whole plant (<b>c</b>) among legume species and cultivars (<span class="html-italic">n</span> = 4) grown under controlled environment conditions. ALF = alfalfa, OXY = Oxley II milkvetch, VEL = Veldt milkvetch, COM = Common sainfoin, MTV = Mountainview sainfoin. The box is comprised of the 75th percentile, median, and 25th percentile, while the upper and lower whiskers are the maximum and minimum values, respectively. Boxes with the same letters indicate no significant differences among legume cultivars within a panel (<span class="html-italic">p</span> &gt; 0.05) according to Tukey’s HSD test.</p>
Full article ">Figure 3
<p>Root:shoot ratio in biomass (<b>a</b>) and quantitative nitrogen (<b>b</b>) among legumes species and cultivars (<span class="html-italic">n</span> = 4) grown under controlled environment conditions. ALF = alfalfa, OXY = Oxley II milkvetch, VEL = Veldt milkvetch, COM = Common sainfoin, MTV = Mountainview sainfoin. The box is comprised of the 75th percentile, median, and 25th percentile, while the upper and lower whiskers are the maximum and minimum values, respectively. Boxes with the same letters indicate no significant differences among legume cultivars within a panel (<span class="html-italic">p</span> &gt; 0.05) according to Tukey’s HSD test.</p>
Full article ">Figure 4
<p>Shoot (<b>a</b>) and root dry matter yield (<b>b</b>) (g pot<sup>−1</sup>) among legume species and cultivars (<span class="html-italic">n</span> = 4) grown under controlled environment conditions. ALF = alfalfa, OXY = Oxley II milkvetch, VEL = Veldt milkvetch, COM = Common sainfoin, MTV = Mountainview sainfoin. The box is comprised of the 75th percentile, median, and 25th percentile, while the upper and lower whiskers are the maximum and minimum values, respectively. Boxes with the same letters indicate no significant differences among legume cultivars within a panel (<span class="html-italic">p</span> &gt; 0.05) according to Tukey’s HSD test.</p>
Full article ">
16 pages, 2762 KiB  
Article
Genotyping-by-Sequencing to Unlock Genetic Diversity and Population Structure in White Yam (Dioscorea rotundata Poir.)
by Ranjana Bhattacharjee, Paterne Agre, Guillaume Bauchet, David De Koeyer, Antonio Lopez-Montes, P. Lava Kumar, Michael Abberton, Patrick Adebola, Asrat Asfaw and Robert Asiedu
Agronomy 2020, 10(9), 1437; https://doi.org/10.3390/agronomy10091437 - 22 Sep 2020
Cited by 17 | Viewed by 4595
Abstract
White yam (Dioscorearotundata Poir.) is one of the most important tuber crops in West Africa, where it is indigenous and represents the largest repository of biodiversity through several years of domestication, production, consumption, and trade. In this study, the genotyping-by-sequencing (GBS) [...] Read more.
White yam (Dioscorearotundata Poir.) is one of the most important tuber crops in West Africa, where it is indigenous and represents the largest repository of biodiversity through several years of domestication, production, consumption, and trade. In this study, the genotyping-by-sequencing (GBS) approach was used to sequence 814 genotypes consisting of genebank landraces, breeding lines, and market varieties to understand the level of genetic diversity and pattern of the population structure among them. The genetic diversity among different genotypes was assessed using three complementary clustering methods, the model-based admixture, discriminant analysis of principal components (DAPC), and phylogenetic tree. ADMIXTURE analysis revealed an optimum number of four groups that matched with the number of clusters obtained through phylogenetic tree. Clustering results obtained from ADMIXTURE analysis were further validated using DAPC-based clustering. Analysis of molecular variance (AMOVA) revealed high genetic diversity (96%) within each genetic group. A network analysis was further carried out to depict the genetic relationships among the three genetic groups (breeding lines, genebank landraces, and market varieties) used in the study. This study showed that the use of advanced sequencing techniques such as GBS coupled with statistical analysis is a robust method for assessing genetic diversity and population structure in a complex crop such as white yam. Full article
(This article belongs to the Section Crop Breeding and Genetics)
Show Figures

Figure 1

Figure 1
<p>Distribution and density of filtered single nucleotide polymorphism (SNPs) across 21 pseudo chromosomes, as suggested by Tamiru et al. [<a href="#B38-agronomy-10-01437" class="html-bibr">38</a>]. The horizontal axis displays the chromosome length. The number of SNPs in a given region is indicated at the bottom right.</p>
Full article ">Figure 2
<p>Transition and transversion based on bi-allelic SNP markers. Tv: Transversions; Ts: Transitions; A: Adenine; T: Thymine; G: Guanine; C: Cytosine. Chart developed using SNIPLAY software [<a href="#B55-agronomy-10-01437" class="html-bibr">55</a>].</p>
Full article ">Figure 3
<p>(<b>A</b>) Graph representing number of clusters vs. Bayesian Information Criterion (BIC). In the x-axis, a different number of clusters that could be considered in the population are presented. In the y-axis, the BIC value associated with each number of clusters is presented. (<b>B</b>) Discriminant analysis of principal components (DAPC) with K = 2. (<b>C</b>) Discriminant analysis of principal components (DAPC) with K = 3. (<b>D</b>) Discriminant analysis of principal components (DAPC) with K = 4. (<b>E</b>) Discriminant analysis of principal components (DAPC) with K = 5. (<b>F</b>) Discriminant analysis of principal components (DAPC) with K = 12. The axes represent the first two linear discriminants. Each color represents a cluster and each dot represents an individual.</p>
Full article ">Figure 4
<p>Population structure with K = 2, 3, 4, and 10 for 803 <span class="html-italic">Dioscorea</span> genotypes using 3432 SNPs. The genotypes represented by vertical bars along the horizontal axis were classified into K color segments based on their estimated membership fraction in each K cluster. Accessions on the x-axis were sorted in the same order for each K.</p>
Full article ">Figure 5
<p>The genetic networks obtained using QGRAPH. The figure represents networks for all genetic groups with the node size depicting genetic relationships among different genotypes based on the observed heterozygosity and allelic richness. (<b>A</b>) Network analysis between breeding lines and market varieties; (<b>B</b>) Network analysis between breeding lines and genebank landraces; (<b>C</b>) Network analysis between genebank landraces and market varieties.</p>
Full article ">
20 pages, 2145 KiB  
Article
Crambe: Seed Yield and Quality in Response to Nitrogen and Sulfur—A Case Study in Northeastern Poland
by Mateusz Sokólski, Dariusz Załuski and Krzysztof Jankowski
Agronomy 2020, 10(9), 1436; https://doi.org/10.3390/agronomy10091436 - 21 Sep 2020
Cited by 11 | Viewed by 3160
Abstract
The aim of this study was to determine the effect of nitrogen (0, 30, 60, 90, 120 kg ha−1) and sulfur (0, 15, and 30 kg ha−1) fertilization on the morphometric parameters of plants, seed yield components, seed and [...] Read more.
The aim of this study was to determine the effect of nitrogen (0, 30, 60, 90, 120 kg ha−1) and sulfur (0, 15, and 30 kg ha−1) fertilization on the morphometric parameters of plants, seed yield components, seed and straw yield, N fertilizer use efficiency (NFUE), and quality of crambe seeds. The experiment had a randomized complete block design, and it was carried out in Bałcyny (northeastern Poland) in 2017–2019. In northeastern Poland, the average seed yields ranged from 0.96 to 1.64–1.82 Mg ha−1 (hulled seeds). Seed yield increased significantly in response to 120 kg N ha−1 and 15 kg S ha−1. The NFUE of crambe decreased by 28% with a rise in N rate. Hulled crambe seeds accumulated 324–394 g kg−1 DM of crude fat, 208–238 g kg−1 DM of total protein, and 118–137 g kg−1 DM of crude fiber. Nitrogen fertilization decreased the crude fat content (by 6%), and it increased the total protein content (by 11%) and the crude fiber content (by 14%) of crambe seeds. Sulfur fertilization increased crude fat content (by 4–5%) without inducing significant differences in the total protein content and the crude fat content of seeds. Full article
Show Figures

Figure 1

Figure 1
<p>Total monthly rainfall (mm) and average monthly temperature (°C) during the growing season of crambe in 2017–2019 and the long-term average (1981–2015) at the experimental site.</p>
Full article ">Figure 2
<p>The effect of N fertilization on the shoot diameter of crambe plants across growing seasons (2017–2019). Error bars represent the standard deviation.</p>
Full article ">Figure 3
<p>The effect of N fertilization on the number of seeds plant<sup>−1</sup> and 1000-seed weight of crambe across growing seasons (2017–2019). Error bars represent the standard deviation.</p>
Full article ">Figure 4
<p>The effect of N fertilization on crambe seed yields and harvest index across growing seasons (2017–2019). Error bars represent the standard deviation.</p>
Full article ">Figure 5
<p>Nitrogen fertilizer use efficiency in treatments with different S fertilization rates (across years).</p>
Full article ">Figure 6
<p>The effect of N fertilization on the total protein content of crambe seeds across growing seasons (2017–2017). Error bars represent the standard deviation.</p>
Full article ">Figure 7
<p>The effect of S fertilization on the crude fat content of crambe seeds across growing seasons (2017–2019). Error bars represent the standard deviation.</p>
Full article ">
25 pages, 2249 KiB  
Article
Banana Biomass Estimation and Yield Forecasting from Non-Destructive Measurements for Two Contrasting Cultivars and Water Regimes
by Bert Stevens, Jan Diels, Allan Brown, Stanley Bayo, Patrick A. Ndakidemi and Rony Swennen
Agronomy 2020, 10(9), 1435; https://doi.org/10.3390/agronomy10091435 - 21 Sep 2020
Cited by 17 | Viewed by 4391
Abstract
The largest abiotic constraint threatening banana (Musa spp.) production is water stress, impacting biomass buildup and yields; however, so far no studies have investigated the effects of water stress on allometric equations in banana. Weighted least square regression models were built for [...] Read more.
The largest abiotic constraint threatening banana (Musa spp.) production is water stress, impacting biomass buildup and yields; however, so far no studies have investigated the effects of water stress on allometric equations in banana. Weighted least square regression models were built for (i) estimating aboveground vegetative dry biomass (ABGVD) and corm dry biomass (cormD) and (ii) forecasting bunch fresh weight (bunchF), based on non-destructive parameters for two cultivars, Mchare Huti-Green Bell (HG, AA) and Cavendish Grande Naine (GN, AAA), under two irrigation regimes: full irrigation (FI) and rainfed (RF). FI affected growth, yield, and phenological parameters in the field (p < 0.05) depending on the onset of moisture stress. Pseudostem volume (Vpseudo) proved a good predictor for estimating ABGVD (R2adj = 0.88–0.92; RRMSE = 0.14–0.19), but suboptimal for cormD (R2adj = 0.90–0.89, RRMSE = 0.21–0.26 for HG; R2adj = 0.34–0.57, RRMSE = 0.38–0.43 for GN). Differences between RF and FI models (p < 0.05) were small as 95%CI overlapped. Vpseudo at flowering predicted bunchF in FI plots correctly (R2adj = 0.70 for HG, R2adj = 0.43 for GN; RRMSE = 0.12–0.15 for HG and GN). Differences between FI and RF models were pronounced as 95%CI did not overlap (p < 0.05). Bunch allometry was affected by irrigation, proving bunchF forecasting needs to include information on moisture stress during bunch filling or information on bunch parameters. Our allometric relationships can be used for rapid and non-destructive aboveground vegetative biomass (ABGVD) assessment over time and to forecast bunch potentials based on Vpseudo at flowering. Full article
Show Figures

Figure 1

Figure 1
<p><b>Water regimes in Huti Green and Grande Naine Experiments.</b> (<b>a</b>) Precipitation (mm month<sup>−1</sup>) in Arusha, Tanzania over the course of the experiments; (<b>b</b>) Average weekly volumetric water content, vwc (m<sup>3</sup>m<sup>−3</sup>) in the upper 60 cm of the soil under two irrigation regimes (FI: full irrigation noted in blue, and RF: rainfed noted in orange). Error bars note mean ± standard deviation. SAT notes the vwc at saturation, FC notes the vwc at field capacity and PWP notes the vwc at permanent wilting point; (<b>c</b>) Phenological events for Huti Green Bell and Grande Naine (planting, sucker selection, flowering and harvest) for cycle 1 (C1) and cycle 2 (C2). Error bars note mean date ± standard deviation. Planting and sucker selection occurred on a single day, hence no standard deviations are present.</p>
Full article ">Figure 2
<p><b>Effect of moisture and ET<sub>0</sub> on growth rates.</b> (<b>a</b>) V<sub>rate</sub>, pseudostem growth rate (L day<sup>−1</sup>) vs. R<sub>PF</sub>, Ratio of cumulative water added (W) and cumulative ET0 between planting and flowering; (<b>b</b>) B<sub>rate</sub>, bunch growth rate (kg day<sup>−1</sup>) vs. V<sub>rate</sub> (L day<sup>−1</sup>) specifying the effect of earlier vegetative growth on bunch rates; and (<b>c</b>) B<sub>rate</sub> vs. R<sub>FH</sub>, Ratio of cumulative water added (W) and cumulative ET0 between flowering and harvest. Dots note observations for individual plants. Lines note regression lines for each cultivar-cycle group. C1 and C2 note C1 and C2 respectively. FI notes full irrigation, RF notes rainfed.</p>
Full article ">Figure 3
<p><b>Aboveground vegetative dry matter (ABGVD, kg plant<sup>−1</sup>) models.</b> (<b>a</b>) actual ABGVD vs. pseudostem volume (V<sub>pseudo</sub>) at sampling (L) for Huti Green Bell (HG) and Grande Naine (GN). Regression models were specific models for treatment and cultivar as shown in <a href="#agronomy-10-01435-t005" class="html-table">Table 5</a>; (<b>b</b>) Comparison of actual ABGVD (kg plant<sup>−1</sup>) with estimated ABGVD (kg plant<sup>−1</sup>) as obtained using the specific regression models for treatment and cultivar as shown in <a href="#agronomy-10-01435-t005" class="html-table">Table 5</a>. FI notes full irrigation, RF notes rainfed.</p>
Full article ">Figure 4
<p><b>Corm dry matter (cormD, kg plant<sup>−1</sup>) models.</b> (<b>a</b>) Actual cormD vs. pseudostem volume (V<sub>pseudo</sub>) at destructive sampling (L) for Huti Green Bell (HG) and Grande Naine (GN). Regression models were specific models for treatment and cultivar as shown in <a href="#agronomy-10-01435-t005" class="html-table">Table 5</a>; (<b>b</b>) Comparison of actual cormD vs. estimated cormD as obtained using the specific regression models for treatment and cultivar as shown in <a href="#agronomy-10-01435-t005" class="html-table">Table 5</a>. FI notes full irrigation, RF notes rainfed.</p>
Full article ">Figure 5
<p><b>Bunch fresh weight (bunchF, kg plant<sup>−1</sup>) models.</b> (<b>a</b>) Actual bunchF vs. pseudostem volume at flowering (V<sub>pseudo, Flower</sub>, L) for Huti Green Bell (HG) and Grande Naine (GN). Regression models were specific models for treatment and cultivar as shown in <a href="#agronomy-10-01435-t004" class="html-table">Table 4</a>; (<b>b</b>) Comparison of actual bunchF (kg plant<sup>−1</sup>) with estimated bunchF (kg plant<sup>−1</sup>) as obtained using the specific regression models for treatment and cultivar as shown in <a href="#agronomy-10-01435-t004" class="html-table">Table 4</a>. FI notes full irrigation, RF notes rainfed.</p>
Full article ">
18 pages, 3104 KiB  
Article
Phenotypic and Nodule Microbial Diversity among Crimson Clover (Trifolium incarnatum L.) Accessions
by Virginia Moore, Brian Davis, Megan Poskaitis, Jude E. Maul, Lisa Kissing Kucek and Steven Mirsky
Agronomy 2020, 10(9), 1434; https://doi.org/10.3390/agronomy10091434 - 21 Sep 2020
Cited by 5 | Viewed by 4013
Abstract
Crimson clover (Trifolium incarnatum L.) is the most common legume cover crop in the United States. Previous research found limited genetic variation for crimson clover within the National Plant Germplasm System (NPGS) collection. The aim of this study was to assess the [...] Read more.
Crimson clover (Trifolium incarnatum L.) is the most common legume cover crop in the United States. Previous research found limited genetic variation for crimson clover within the National Plant Germplasm System (NPGS) collection. The aim of this study was to assess the phenotypic and nodule microbial diversity within the NPGS crimson clover collection, focusing on traits important for cover crop performance. Experiments were conducted at the Beltsville Agricultural Research Center (Maryland, USA) across three growing seasons (2012–2013, 2013–2014, 2014–2015) to evaluate 37 crimson clover accessions for six phenotypic traits: fall emergence, winter survival, flowering time, biomass per plant, nitrogen (N) content in aboveground biomass, and proportion of plant N from biological nitrogen fixation (BNF). Accession effect was significant across all six traits. Fall emergence of plant introductions (PIs) ranged from 16.0% to 70.5%, winter survival ranged from 52.8% to 82.0%, and growing degree days (GDD) to 25% maturity ranged from 1470 GDD to 1910 GDD. Biomass per plant ranged from 1.52 to 6.51 g, N content ranged from 1.87% to 2.24%, and proportion of plant N from BNF ranged from 50.2% to 85.6%. Accessions showed particularly clear differences for fall emergence and flowering time, indicating greater diversity and potential for selection in cover crop breeding programs. Fall emergence and winter survival were positively correlated, and both were negatively correlated with biomass per plant and plant N from BNF. A few promising lines performed well across multiple key traits, and are of particular interest as parents in future breeding efforts, including PIs 369045, 418900, 561943, 561944, and 655006. In 2014–2015, accessions were also assessed for nodule microbiome diversity, and 11 genera were identified across the sampled nodules. There was large variation among accessions in terms of species diversity, but this diversity was not associated with observed plant traits, and the functional implications of nodule microbiome diversity remain unclear. Full article
(This article belongs to the Special Issue Genetics, Genomics, and Breeding of Legume Crops)
Show Figures

Figure 1

Figure 1
<p>Effect of crimson clover accession on fall emergence in Beltsville, MD, evaluated as emerged plants per seeds planted. Grand mean, harvest year means, and least significant difference (LSD) estimates are displayed.</p>
Full article ">Figure 2
<p>Effect of crimson clover accession on winter survival in Beltsville, MD, evaluated as surviving plants in the spring per plants emerged in the fall. Grand mean, harvest year means, and least significant difference (LSD) estimates are displayed.</p>
Full article ">Figure 3
<p>Effect of crimson clover accession on flowering time in Beltsville, MD, evaluated as growing degree days (GDD) to 25% flowering, calculated at a base temperature of 0 °C. Grand mean, harvest year means, and least significant difference (LSD) estimates are displayed.</p>
Full article ">Figure 4
<p>Effect of crimson clover accession on biomass per plant in Beltsville, MD, evaluated as dry weight per plant at harvest. Data are presented on a log scale. Grand mean, harvest year means, and least significant difference (LSD) estimates are displayed.</p>
Full article ">Figure 5
<p>Effect of crimson clover accession on plant nitrogen content in Beltsville, MD, evaluated as percent N of dry weight. Data were log-transformed, but reverse-transformed for display purposes. Grand mean, harvest year means, and least significant difference (LSD) estimates are displayed.</p>
Full article ">Figure 6
<p>Effect of crimson clover accession on proportion of plant nitrogen content as biologically fixed nitrogen (BNF) in Beltsville, MD, evaluated as percent BNF per total N content. Grand mean, harvest year means, and least significant difference (LSD) estimates are displayed.</p>
Full article ">
12 pages, 993 KiB  
Article
An Assessment of Seaweed Extracts: Innovation for Sustainable Agriculture
by Daniel El Chami and Fabio Galli
Agronomy 2020, 10(9), 1433; https://doi.org/10.3390/agronomy10091433 - 21 Sep 2020
Cited by 12 | Viewed by 4037
Abstract
Plant growth regulators (PGRs) are described in the literature as having a significant role in securing crop management of modern agriculture in conditions of abiotic and biotic stressors. A joint field experiment was carried out to assess the role of seaweed-based extracts in [...] Read more.
Plant growth regulators (PGRs) are described in the literature as having a significant role in securing crop management of modern agriculture in conditions of abiotic and biotic stressors. A joint field experiment was carried out to assess the role of seaweed-based extracts in pear trees and to test the “less for more” theory, which consists of getting more and better agricultural produce using fewer innovative inputs. The trials took place on two production seasons (from March till September 2018–2019) and the selected case study was on a pear orchard (Pyrus communis L. cv. Abate Fètel) in Emilia Romagna (Italy) by Fondazione Navarra and Timac Agro Italia S.p.A. Results demonstrate that, depending on the yearly climate conditions, it was possible to substantially reduce the primary nutrients by 35–46% and total fertilisation units applied by 13% and significantly improve quantitative and qualitative production indicators (average weight of fruits (5%) and total yield (19–55%)). Results also confirm a positive correlation between plant growth regulators and agronomic efficiency of pears which increased between five and nine times compared to the conventional nutrition programme. These outcomes constitute scientific evidence for decision making in farm management. Full article
Show Figures

Figure 1

Figure 1
<p>Harvested area of pear (<b>top</b>) and total production (<b>bottom</b>) in the top 3 countries and the world.</p>
Full article ">Figure 2
<p>Historic average of precipitation and temperature in Ferrara (1961–1990) (after [<a href="#B24-agronomy-10-01433" class="html-bibr">24</a>]).</p>
Full article ">Figure 3
<p>Improvement of fruit weight (<b>top</b>) and total harvest (<b>bottom</b>) under TIMAC treatment.</p>
Full article ">
18 pages, 1496 KiB  
Article
Additive Type Affects Fermentation, Aerobic Stability and Mycotoxin Formation during Air Exposure of Early-Cut Rye (Secale cereale L.) Silage
by Horst Auerbach and Peter Theobald
Agronomy 2020, 10(9), 1432; https://doi.org/10.3390/agronomy10091432 - 21 Sep 2020
Cited by 15 | Viewed by 2847
Abstract
Whole-crop rye harvested before maturity represents a valuable forage for silage production. Due to the scarcity of data on fermentation characteristics and aerobic stability (ASTA) and the lack of information on mycotoxin formation during aeration of early-cut rye (ECR) silage after silo opening, [...] Read more.
Whole-crop rye harvested before maturity represents a valuable forage for silage production. Due to the scarcity of data on fermentation characteristics and aerobic stability (ASTA) and the lack of information on mycotoxin formation during aeration of early-cut rye (ECR) silage after silo opening, we evaluated the effects of different additive types and compositions. Wilted forage was treated with various biological and chemical additives, ensiled in 1.5-L glass jars and stored for 64 days. Fermentation pattern, yeast and mould counts and ASTA were determined at silo opening. In total 34 mycotoxins were analysed in wilted forage and in silage before and after 240 h of air exposure. Chemical additives caused the lowest dry matter (DM) losses during fermentation accompanied with the lowest ethanol production and the highest water-soluble carbohydrate concentration. Aerobic deterioration, which started within two days after silo opening in silage left untreated and inoculated with homofermentative lactic acid bacteria, was prevented by the combined use of hetero- and homofermentative lactic acid bacteria and the chemical additive containing sodium nitrite, hexamethylene tetramine and potassium sorbate. Moreover, these two additives largely restricted the formation of the mycotoxin roquefortine C to < 0.05 mg kg−1 DM after aeration, whereas untreated silage contained 85.2 mg kg−1 DM. Full article
Show Figures

Figure 1

Figure 1
<p>Effects of additive type and composition on the aerobic stability (ASTA) and the cumulated temperature (TCUM) in early-cut rye silage after 64 days of storage. CON, no additive; LAB<sub>ho</sub>, homofermentative inoculant composed of <span class="html-italic">L. plantarum</span> DSM 16,627 and <span class="html-italic">L. paracasei</span> NCIMB, total inoculation rate: 1.5 × 10<sup>5</sup> cfu g<sup>−1</sup>; LAB<sub>heho</sub>, inoculant composed of <span class="html-italic">L. buchneri</span> CNCM-I 4323 and <span class="html-italic">P. acidilactici</span> DSM, total inoculation rate: 1.67 × 10<sup>5</sup> cfu g<sup>−1</sup>; SNHE, liquid chemical additive containing sodium nitrite (300 g L<sup>−1</sup>) and hexamethylene tetramine (200 g L<sup>−1</sup>), 2 mL kg<sup>−1</sup>; SNHEPS, liquid chemical additive containing sodium nitrite (195 g L<sup>−1</sup>), hexamethylene tetramine (71 g L<sup>−1</sup>) and potassium sorbate (106 g L<sup>−1</sup>), 2 mL kg<sup>−1</sup>; &gt;denotes that ASTA was greater than 240 h; <sup>a–b</sup> open bars for TCUM bearing different superscripts differ, Tukey´s test, <span class="html-italic">p</span> &lt; 0.001, SEM = 17.2; <sup>x–z</sup> solid bars for ASTA with unlike superscripts differ, non-parameteric rank test of ANOVA-type statistics, <span class="html-italic">p</span> &lt; 0.01, SEM = 0–13.7, calculated separately for each treatment due to non-normal data distribution, <span class="html-italic">n</span> = 15.</p>
Full article ">Figure 2
<p>Relationship between the total fungal count at silo opening (x) and the aerobic stability (y) in early-cut rye silage treated with additives of different type and composition and stored for 64 days upon subsequent air exposure for 240 h. R<sup>2</sup> = 0.98, root mean square error (RMSE) = 0.09, <span class="html-italic">p</span> &lt; 0.001, <span class="html-italic">n</span> = 15.</p>
Full article ">Figure 3
<p>Relationship between the aerobic stability (x) and the cumulated temperature (y) in early-cut rye silage treated with additives of different type and composition and stored for 64 days upon subsequent air exposure for 240 h. R<sup>2</sup> = 0.96, RMSE = 27.2, <span class="html-italic">p</span> &lt; 0.001, <span class="html-italic">n</span> = 15.</p>
Full article ">Figure 4
<p>Effects of additive type on the concentration of the mycotoxin roquefortine C in early-cut rye silage stored for 64 days before (black bar) and after (grey bar) subsequent air exposure for 240 h. LAB<sub>heho</sub>, inoculant composed of <span class="html-italic">L. buchneri</span> CNCM-I 4323 and <span class="html-italic">P. acidilactici</span> DSM, total inoculation rate: 1.67 × 10<sup>5</sup> cfu g<sup>−1</sup>; SNHEPS, liquid chemical additive containing sodium nitrite (195 g L<sup>−1</sup>), hexamethylene tetramine (71 g L<sup>−1</sup>) and potassium sorbate (106 g L<sup>−1</sup>), 2 mL kg<sup>−1</sup>; Unlike letters in brackets denote significance of effect of aeration (X,Y, <span class="html-italic">p</span> &lt; 0.001) and of effect of additive (x,y, <span class="html-italic">p</span> &lt; 0.001), aeration × additive interaction not significant, ANOVA-type statistics, SEM = 0-8.79, calculated separately for each treatment due to non-normality of data.</p>
Full article ">
13 pages, 2184 KiB  
Article
The Influence of UV on the Production of Free Terpenes in Vitis vinifera cv. Shiraz
by Wen Miao, Jiaqiang Luo, Junda Liu, Kate Howell and Pangzhen Zhang
Agronomy 2020, 10(9), 1431; https://doi.org/10.3390/agronomy10091431 - 20 Sep 2020
Cited by 11 | Viewed by 3410
Abstract
Terpenes contribute to the desirable flavour and aroma of grapes and wine. The biosynthesis of these plant secondary metabolites is influenced by both physiological and environmental factors, such as grapevine phenological stage and sunlight exposure. In this study, we investigated the influence of [...] Read more.
Terpenes contribute to the desirable flavour and aroma of grapes and wine. The biosynthesis of these plant secondary metabolites is influenced by both physiological and environmental factors, such as grapevine phenological stage and sunlight exposure. In this study, we investigated the influence of ultraviolet (UV) at different grapevine phenological stages on free terpenes in grape at harvest. Two types of transparent polymer films were applied to grape bunches to eliminate both UV-A and UV-B or only eliminate UV-B, followed by the identification and quantification of terpenes using headspace solid-phase microextraction with gas chromatography–mass spectrometry (HS–SPME–GC–MS) analysis. In all, 27 free terpenes were identified, including eight monoterpenes/monoterpenoids, four norisoprenoids and fifteen sesquiterpenes. Higher concentrations of γ-terpinene, linalool and β-damascenone were observed in grapes with UV-B attenuation compared to the naturally exposed grape bunches. Elevated α-muurolene was observed in UV-attenuated grapes from pre-veraison to harvest, while higher concentrations of γ-cadinene were observed in naturally exposed grapes. The impacts of UV exclusion on grape terpenes at harvest were specific to phenological stages, where applying UV films from veraison to intermediate ripeness reduced the concentrations of key terpenes in grape harvest and UV attenuation from intermediate ripeness to harvest promoted the accumulation of α-muurolene and γ-cadinene. This study provides information for viticulturists to better manage grape terpene composition through UV shading. Full article
(This article belongs to the Special Issue Extraction and Analysis of Natural Product in Plant)
Show Figures

Figure 1

Figure 1
<p>Experimental design for the ultraviolet (UV) attenuation trial at different phenological stages of grapevine development. The treatments were as follows: (i) control: grape bunches were naturally exposed to sunlight; (ii) grape bunches were enclosed by polyethylene terephthalate glycol (PETG) or polycarbonate (PC) film from pre-veraison to harvest (TW PETG/TW PC); (iii) grape bunches were enclosed by PETG or PC from pre-veraison to full veraison (TV PETG/TV PC); (iv) grape bunches were enclosed by PETG or PC from full veraison to intermediate ripe (TI PETG/TI PC); (v) grape bunches were enclosed by PETG or PC from intermediate ripe to harvest period (TH PETG/TH PC).</p>
Full article ">Figure 2
<p>Gas chromatography–mass spectrometry (GC–MS) chromatograms showing the identified terpenes in (<b>A</b>) vintage 2016 and (<b>B</b>) vintage 2017. Peaks: (1) cymene(m- and p-); (2) γ-terpinene; (3) linalool; (4) citronellal; (5) menthol (+isomenthol); (6) α-terpineol; (7) geraniol; (8) geranylacetone; (9) theaspirane (isomer 1); (10) theaspirane (isomer 2); (11) (<span class="html-italic">E</span>)-β-damascenone; (12) β-ionone; (13) α-ylangene; (14) β-bourbonene; (15) <span class="html-italic">cis</span>-muurola-4(15),5-diene; (16) α-humulene; (17) α-muurolene; (18) γ-cadinene; (19) δ-cadinene; (20) calamenene(<span class="html-italic">cis</span> + trans); (21) zonarene; (22) α-calacorene; (23) ω-cadinene; (24) 1-epi-cubenol; (25) γ-eudesmol; (26) cubenol; (27) cadalene.</p>
Full article ">Figure 3
<p>Comparison of key grape terpenes in vintages 2016 and 2017. One-way ANOVA was conducted to compare the concentration of (<b>A</b>) free monoterpenes, (<b>B</b>) free norisoprenoid and (<b>C</b>) sesquiterpene between control and TW treatments. * represents significant difference at <span class="html-italic">p</span> &lt; 0.05.</p>
Full article ">Figure 4
<p>Comparison of key grape terpenes at harvest treated with UV attenuation at different phenological stages in (<b>A</b>) vintage 2016 and (<b>B</b>) vintage 2017. Two-way ANOVA was conducted to compare grape terpenes between different UV attenuation sheets (A, B were used to illustrate the statistically significant differences at <span class="html-italic">p</span> &lt; 0.05) and applied stages (a, b, c were used to illustrate the statistically significant differences at <span class="html-italic">p</span> &lt; 0.05).</p>
Full article ">
14 pages, 4681 KiB  
Article
Comparative Study of Three Low-Tech Soilless Systems for the Cultivation of Geranium (Pelargonium zonale): A Commercial Quality Assessment
by Luca Brentari, Nicola Michelon, Giorgio Gianquinto, Francesco Orsini, Federico Zamboni and Duilio Porro
Agronomy 2020, 10(9), 1430; https://doi.org/10.3390/agronomy10091430 - 20 Sep 2020
Cited by 5 | Viewed by 2969
Abstract
The study evaluated the feasibility of simplified hydroponics for the growth of rooted cuttings of geranium (Pelargonium zonale) for commercial purposes in local farms in Northern Italy. Tested systems included a control where soilless system on substrate (peat) (T-1), usually adopted [...] Read more.
The study evaluated the feasibility of simplified hydroponics for the growth of rooted cuttings of geranium (Pelargonium zonale) for commercial purposes in local farms in Northern Italy. Tested systems included a control where soilless system on substrate (peat) (T-1), usually adopted by local farmers, was compared against an open-cycle drip system on substrate (peat) (T-2), and a Nutrient Film Technique system (T-3). For commercial features, assessed parameters included flowering degree (flowering timing, numbers of inflorescences plant−1, and number of flowers inflorescence−1), numbers of leaves plant−1, number of branches plant−1, final height of plant, and the aesthetic-commercial assessment index. Assessed parameters also included fresh and dry weight, SPAD Index, the water consumption, and the water use efficiency (WUE). The soilless systems typology significantly affected rooted cuttings growth, commercial features, and WUE. The adoption of an open-cycle drip system (T-2) resulted in a significant improvement of all the crop commercial characteristics as compared with other treatments, making plants more attractive for the market. The water consumption was higher in T-2 as compared with T-1 and T-3, but it allowed for the highest fresh weight, and therefore also the highest WUE. The results indicate that the typology of soilless system significantly enhances the commercial characteristics of geranium. Full article
(This article belongs to the Special Issue Soilless Culture, Growing Media and Horticultural Plants)
Show Figures

Figure 1

Figure 1
<p>T1, farm system with substrate. Schematic representation of the growing system used.</p>
Full article ">Figure 2
<p>T-2, open-cycle drip system with substrate. Schematic representation of the growing system used.</p>
Full article ">Figure 3
<p>T-3, Nutrient Film Technique system. Schematic representation of the growing system used.</p>
Full article ">Figure 4
<p>Effect of growing systems on <span class="html-italic">Pelargonium zonale</span>: (<b>a</b>) plants with inflorescences just visible; (<b>b</b>) plants at flowering start phase; (<b>c</b>) plants at full flowering phase; and (<b>d</b>) leaf number. T-1, farm system with substrate; T-2, open-cycle drip system with substrate; T-3, Nutrient Film Technique; DAT, Days After Transplanting.</p>
Full article ">Figure 5
<p>Height of <span class="html-italic">Pelargonium zonale</span> plant during growing period in response to the growing system used. Mean values ± standard error. T-1, farm system with substrate; T-2, open-cycle drip system with substrate; T-3, Nutrient Film Technique.</p>
Full article ">Figure 6
<p>Effect of growing system used on <span class="html-italic">Pelargonium zonale</span>. (<b>a</b>) Plan fresh weight (g plant<sup>−1</sup>) in relation to growing system and relative partitioning into different organs. Means values ± standard error for total biomass. (<b>b</b>) Plan dry weight (g plant<sup>−1</sup>) in relation to growing system and relative partitioning into different organs. Mean values ± standard error for total biomass. T-1, farm system with substrate; T-2, open-cycle drip system with substrate; T-3, Nutrient Film Technique.</p>
Full article ">
17 pages, 2760 KiB  
Article
Impact of Water Stress on Microbial Community and Activity in Sandy and Loamy Soils
by Sylwia Siebielec, Grzegorz Siebielec, Agnieszka Klimkowicz-Pawlas, Anna Gałązka, Jarosław Grządziel and Tomasz Stuczyński
Agronomy 2020, 10(9), 1429; https://doi.org/10.3390/agronomy10091429 - 19 Sep 2020
Cited by 66 | Viewed by 5413
Abstract
Prolonged drought and extreme precipitation can have a significant impact on the activity and structure of soil microbial communities. The aim of the study was to assess the impact of drought length on the dynamics of mineral nitrogen, enzyme activities and bacterial diversity [...] Read more.
Prolonged drought and extreme precipitation can have a significant impact on the activity and structure of soil microbial communities. The aim of the study was to assess the impact of drought length on the dynamics of mineral nitrogen, enzyme activities and bacterial diversity in two soils of different texture (sand and silt loam, according to USDA classification). An additional objective was to evaluate the effect of compost on the alleviation of soil microbial responses to stress conditions, i.e. alternating periods of drought and excessive soil moisture. The pot study was carried out in a greenhouse under controlled conditions. Compost was added at an amount equal to 3% of soil to the sandy soil, which was characterised by a significantly lower water retention capacity. Specific levels of water stress conditions were created through application of drought and soil watering periods. For each soil, four levels of moisture regimes were set-up, including optimal conditions kept at 60% of field water holding capacity, and three levels of water stress: The low level—2 week period without watering; the medium level—1 month drought period followed by watering to full but short-term soil saturation with water; and the high level—2 month drought period followed by full and long-term saturation with the same total amount of water, as in other variants. The soil water regime strongly modified the activities of dehydrogenases and acid and alkaline phosphatase, as well as the bacterial diversity. Loamy soil exhibited greater resistance to the inhibition of soil enzymatic activity. After irrigation, following both a 1 month and 2 month drought, the enzyme activities and nitrification largely recovered in soil with a loamy texture. Drought induced substantial shifts in the functional diversity of bacterial communities. The use of such C substrates, as carboxylic and acetic acids, was strongly inhibited by water deficit. Water deficit induced changes in the relative abundances of particular phyla, for example, an increase in Acidobacteria or a decrease in Verrucomicrobia. The study clearly proves the greater susceptibility of microbial communities to drought in sandy soils and the important role of exogenous organic matter in protecting microbial activity in drought periods. Full article
(This article belongs to the Special Issue Climate Change, Agriculture, and Food Security)
Show Figures

Figure 1

Figure 1
<p>Scheme of soil watering and sampling during the 9 weeks of the pot experiment; Arabic numerals—week of the experiment; W—watering day; Roman numerals—sampling day.</p>
Full article ">Figure 2
<p>Average use of groups of carbon substrates based on readings in the 144 h of incubation. Ctrl, Low, Med, High—optimal moisture and low, medium and high water stress, respectively; 1M, 2M—month of the experiment; I, III, IV—sampling time.</p>
Full article ">Figure 3
<p>Heat map of the metabolic profile of microorganisms based on the use of various C sources using the EcoPlate method after 144 h of incubation. Ctrl, Low, Med, High—optimal moisture and low, medium and high water stress, respectively; 1M, 2M—month of the experiment; I, III, IV—sampling time.</p>
Full article ">Figure 4
<p>Principal component analysis (PCA) of metabolic activity parameters based on readings after 144 h of incubation of the EcoPlate. Ctrl, Low, Med, High—optimal moisture and low, medium and high water stress, respectively; 1M, 2M—month of the experiment; I, III, IV—sampling time.</p>
Full article ">Figure 5
<p>Most abundant phyla in loamy soil as a result of water stress. Ctrl, Low, Med, High—optimal moisture and low, medium and high water stress, respectively; I, III, IV—sampling time.</p>
Full article ">Figure 6
<p>Most abundant genus in loamy soil as result of water stress. Ctrl, Low, Med, High—optimal moisture and low, medium and high water stress, respectively; I, III, IV—sampling time.</p>
Full article ">
15 pages, 4139 KiB  
Article
Effects of Bacillus subtilis and Pseudomonas fluorescens Inoculation on Attributes of the Lettuce (Lactuca sativa L.) Soil Rhizosphere Microbial Community: The Role of the Management System
by Eirini Angelina, Efimia M. Papatheodorou, Triantafyllia Demirtzoglou and Nikolaos Monokrousos
Agronomy 2020, 10(9), 1428; https://doi.org/10.3390/agronomy10091428 - 19 Sep 2020
Cited by 19 | Viewed by 5751
Abstract
Inoculation with beneficial microbes has been proposed as an effective practice for the improvement of plant growth and soil health. Since soil acts as a physicochemical background for soil microbial communities, we hypothesized that its management will mediate the effects of microbial inoculants [...] Read more.
Inoculation with beneficial microbes has been proposed as an effective practice for the improvement of plant growth and soil health. Since soil acts as a physicochemical background for soil microbial communities, we hypothesized that its management will mediate the effects of microbial inoculants on the indigenous soil microbes. We examined the effects of bacterial inoculants [Bacillus subtilis (Ba), Pseudomonas fluorescens (Ps), and both (BaPs)] on the growth of Lactuca sativa cultivated in soils that originated from an organic maize (OS) and a conventional barley (CS) management system. Moreover, the biomass and the community structure of the rhizosphere microbial communities and the soil enzyme activities were recorded. The root weight was higher in CS than OS, while the foliage length was greater in OS than CS treatments. Only in OS pots, inoculants resulted in higher biomasses of bacteria, fungi, and actinomycetes compared to the control with the highest values being recorded in Ps and BaPs treated soils. Furthermore, different inoculants resulted in different communities in terms of structure mainly in OS soils. For soil enzymes, the effect of the management system was more important due to the high organic matter existing in OS soils. We suggest that for microbial inoculation to be effective it should be considered together with the management history of the soil. Full article
Show Figures

Figure 1

Figure 1
<p>Mean values (±SE) of root weight, shoot weight, and shoot length in conventionally and organically managed systems. “Management” on the top of the graphs, indicates a significant effect of the management type, as revealed by two-way analysis of variance (ANOVA). (**: <span class="html-italic">p</span> &lt; 0.01)</p>
Full article ">Figure 2
<p>Mean biomass (±SE) of total microbes, fungi, Gram<sup>+</sup> and Gram<sup>−</sup> bacteria, actinomycetes, and microeukaryotes in the conventionally and organically managed systems, at the four treatments. “Inoculum”, “Management”, and “Inoculum × Management” at the top of the graphs, indicate a significant effect of these factors and their interaction, respectively, as revealed by two-way ANOVA (*: <span class="html-italic">p</span> &lt; 0.05, **: <span class="html-italic">p</span> &lt; 0.01, ***: <span class="html-italic">p</span> &lt; 0.001, for all cases <span class="html-italic">n</span> = 4). The different letters above bars represent statistically significant differences between treatments described by the inoculum type × management system as emerged from Fisher’s test (Fisher post hoc; a: Corresponds to the highest value).</p>
Full article ">Figure 3
<p>Mean values (±SE) of microbial ratios in the conventionally and organically managed systems, at the four treatments. “Inoculum”, “Management”, and “Inoculum × Management” at the top of the graphs, indicate a significant effect of these factors and their interaction, respectively, as revealed by two-way ANOVA (*: <span class="html-italic">p</span> &lt; 0.05, ***: <span class="html-italic">p</span> &lt; 0.001, for all cases <span class="html-italic">n</span> = 4). The different letters above bars represent statistically significant differences between treatments described by the inoculum type × management system as emerged from Fisher’s test (Fisher post hoc; a: Corresponds to the highest value).</p>
Full article ">Figure 4
<p>Mean values (±SE) of acid phosphatase, urease, and <span class="html-italic">β</span>-glucosidase enzymes in the conventionally and organically managed systems, at the four treatments. “Inoculum”, “Management” at the top of the graphs, indicate a significant effect of these factors, as revealed by two-way ANOVA (**: <span class="html-italic">p</span> &lt; 0.01, ***: <span class="html-italic">p</span> &lt; 0.001, for all cases <span class="html-italic">n</span> = 4). Superscript letters in parentheses following the term “Inoculum” denote the significant differences between inoculum types (C: Control, Ba: <span class="html-italic">B. subtilis</span>, Ps: <span class="html-italic">P. fluorescens</span> and BaPs: <span class="html-italic">B. subtilis</span> and <span class="html-italic">P. fluorescens</span>) as emerged from Fisher’s test (Fisher post hoc; a: Corresponds to the highest value).</p>
Full article ">Figure 5
<p>Ordination of the soil samples and the phospholipid (PLFA) biomarkers on a principal component analysis (PCA) biplot. Each point corresponds to the mean value of the loadings of the four samples belonging to the same treatment at the first and second axis (the first symbol corresponds to the management system (1: Conventional system (CS), 2: Organic system (OS)) and the second symbol corresponds to the inoculum treatment; Ba: <span class="html-italic">B. subtilis</span>; Ps: <span class="html-italic">P. fluorescens</span>; BaPs: Both inoculants; C: Control). Error bars indicate standard errors at both axes (<span class="html-italic">n</span> = 4).</p>
Full article ">
16 pages, 5704 KiB  
Article
Antifungal Activity of Chitosan Oligomers–Amino Acid Conjugate Complexes against Fusarium culmorum in Spelt (Triticum spelta L.)
by Laura Buzón-Durán, Jesús Martín-Gil, José Luis Marcos-Robles, Ángel Fombellida-Villafruela, Eduardo Pérez-Lebeña and Pablo Martín-Ramos
Agronomy 2020, 10(9), 1427; https://doi.org/10.3390/agronomy10091427 - 19 Sep 2020
Cited by 19 | Viewed by 3892
Abstract
Fusarium head blight (FHB) is a complex disease of cereals caused by Fusarium species, which causes severe damages in terms of yield quality and quantity worldwide, and which produces mycotoxin contamination, posing a serious threat to public health. In the study presented herein, [...] Read more.
Fusarium head blight (FHB) is a complex disease of cereals caused by Fusarium species, which causes severe damages in terms of yield quality and quantity worldwide, and which produces mycotoxin contamination, posing a serious threat to public health. In the study presented herein, the antifungal activity against Fusarium culmorum of chitosan oligomers (COS)–amino acid conjugate complexes was investigated both in vitro and in vivo. The amino acids assayed were cysteine, glycine, proline and tyrosine. In vitro tests showed an enhancement of mycelial growth inhibition, with EC50 and EC90 effective concentration values ranging from 320 to 948 µg·mL−1 and from 1107 to 1407 µg·mL−1 respectively, for the conjugate complexes, as a result of the synergistic behavior between COS and the amino acids, tentatively ascribed to enhanced cell membrane damage originating from lipid peroxidation. Tests on colonies showed a maximum percentage reduction in the number of colonies at 1500 µg·mL−1 concentration, while grain tests were found to inhibit fungal growth, reducing deoxynivalenol content by 89%. The formulation that showed the best performance, i.e., the conjugate complex based on COS and tyrosine, was further investigated in a small-scale field trial with artificially inoculated spelt (Triticum spelta L.), and as a seed treatment to inhibit fungal growth in spelt seedlings. The field experiment showed that the chosen formulation induced a decrease in disease severity, with a control efficacy of 83.5%, while the seed tests showed that the treatment did not affect the percentage of germination and resulted in a lower incidence of root rot caused by the pathogen, albeit with a lower control efficacy (50%). Consequently, the reported conjugate complexes hold enough promise for crop protection applications to deserve further examination in larger field trials, with other Fusarium spp. pathogens and/or Triticum species. Full article
(This article belongs to the Special Issue Strategies for the Control of Fusarium Head Blight in Cereals)
Show Figures

Graphical abstract

Graphical abstract
Full article ">Figure 1
<p>Radial growth values of <span class="html-italic">F. culmorum</span> in the presence of the different treatments, which consisted of chitosan oligomers (COS), amino acids (cysteine, Cys; glycine, Gly; proline, Pro; tyrosine, Tyr), and the conjugate complexes consisting of COS–amino acids (1:1 v/v). A 75 mm radial growth was obtained for the potato dextrose agar (PDA) control (C). Concentrations labelled with the same letters are not significantly different at <span class="html-italic">p</span> &lt; 0.05 by Tukey’s test. All values are presented as the average of three repetitions. Error bars represent the standard deviation across three replicates.</p>
Full article ">Figure 2
<p>Sensitivity test. Radial growth of mycelium for: (<b>a</b>) control (PDA), (<b>b</b>) COS only, (<b>c</b>) COS–Cys, (<b>d</b>) COS–Gly, (<b>e</b>) COS–Pro, (<b>f</b>) COS–Tyr. From top to bottom: 62.5, 93.75, 125, 187.5, 250, 375, 500, 750, 1000 and 1500 µg·mL<sup>−1</sup>. Only one replicate is shown.</p>
Full article ">Figure 3
<p>Effect of the COS–tyrosine conjugate complex treatment on the number of colonies formation of <span class="html-italic">F. culmorum</span> after 5 days. Suspension of fungal spores soaked for 24 h at different concentration of conjugate complex, and 50 µl of treated spores were spread on PDA medium. (<b>a</b>) control, (<b>b</b>) 500 µg·mL<sup>−1</sup>, (<b>c</b>) 1000 µg·mL<sup>−1</sup> and (<b>d</b>) 1500 µg·mL<sup>−1</sup>. Only one replicate is shown.</p>
Full article ">Figure 4
<p>Effect of the application of COS–tyrosine conjugate complex on the growth of <span class="html-italic">F. culmorum</span> on spelt grain: (<b>a</b>) positive control, (<b>b</b>) negative control, (<b>c</b>) treated grain at a dose of 1500 µg·mL<sup>−1</sup>.</p>
Full article ">Figure 5
<p>Germination tests: (<b>a</b>) negative control, (<b>b</b>) treated seeds, (<b>c</b>) positive control. Only one replicate is shown.</p>
Full article ">Figure 6
<p>(<b>a</b>) Healthy (top) vs. infected (bottom) seedlings, (<b>b</b>) healthy seedling roots, (<b>c</b>) root rot symptoms, (<b>d</b>) root shortening.</p>
Full article ">Figure 7
<p>(<b>a</b>) Microplots used in the field trials, with spelt plants in growth stage (GS) 65, (<b>b</b>) healthy treated ear, (<b>c</b>) ear with attack of intermediate severity, (<b>d</b>) positive control, entirely affected.</p>
Full article ">Figure 8
<p>Hydrogen bonding in the COS–tyrosine conjugate complex.</p>
Full article ">
14 pages, 6846 KiB  
Article
Salt Stress Induces Differentiated Nitrogen Uptake and Antioxidant Responses in Two Contrasting Barley Landraces from MENA Region
by Fatma Ezzahra Ben Azaiez, Sawsen Ayadi, Giorgia Capasso, Simone Landi, Valeria Paradisone, Salma Jallouli, Zied Hammami, Zoubeir Chamekh, Inès Zouari, Youssef Trifa and Sergio Esposito
Agronomy 2020, 10(9), 1426; https://doi.org/10.3390/agronomy10091426 - 19 Sep 2020
Cited by 17 | Viewed by 2963
Abstract
The interaction between salinity and nitrogen metabolism has been investigated in two barley landraces, one tolerant (“100/1B”) and one susceptible to salinity (“Barley medenine”) from the Middle East and North Africa (MENA) region. Barley plants were exposed to 50 mM NaCl for 7 [...] Read more.
The interaction between salinity and nitrogen metabolism has been investigated in two barley landraces, one tolerant (“100/1B”) and one susceptible to salinity (“Barley medenine”) from the Middle East and North Africa (MENA) region. Barley plants were exposed to 50 mM NaCl for 7 days; then, salinity was increased to 150 mM NaCl in the presence (10 mM) or limitation (1 mM) of ammonium as a nitrogen source. Upon salinity, “100/1B” was shown to support N assimilation by enhancing the glutamine synthetase (GS) and glutamine oxoglutarate aminotransferase (GOGAT) cycle under high N, and the stimulation of the glutamate dehydrogenase (GDH) pathway under low N treatment. In “Barley medenine”, salinity reduced the GS/GOGAT cycle, and increased GDH activity. Upon salinity, Heat Shock Proteins 70 and PEPC remained unchanged in “100/1B”, while they decreased in “Barley medenine”. The tolerance degree is a determining factor in enzymes’ occurrence and regulation: exposed to salinity, “100/1B” rapidly increased APX and PEPC activities, while this was delayed in “Barley medenine”. Salinity increased cyt-G6PDH levels in “100/1B”, while “Barley medenine” showed a decrease in G6PDH isoforms. Correlation analyses confirm GOGAT was related to G6PDH; GDH and APX with PEPC in “100/1B” under moderate salinity; severe salinity correlated GDH with G6PDH and PEPC. In “Barley medenine” under salinity, GOGAT was correlated with G6PDH, while APX showed a relation with PEPC. Therefore, specific enzymatic activities and occurrence can be used to determine stress responsiveness of different landraces. We suggest that the rapid increase in G6PDH, APX, and nitrogen assimilation enzymes activities represents an index of tolerance in “100/1B” and a stress symptom in “Barley medenine”. Full article
(This article belongs to the Special Issue Analysis of Crop Genetic and Germplasm Diversity)
Show Figures

Figure 1

Figure 1
<p>Scheme of the adopted experimental strategy. Stressed plants treated by low and high N were collected after 3 and 7 days of moderate stress (50 mM NaCl); then, a severe stress (150 mM NaCl) was applied and plants were collected after further 1 and 3 days. Control plants (without NaCl) were collected before any treatment, and after N application at the end of experiment.</p>
Full article ">Figure 2
<p>Effects of salinity and N supply on “100/1B” and “Barley medenine” leaves.</p>
Full article ">Figure 3
<p>Effects of salinity and N concentration on G6PDH and APX enzymatic activities in barley plants growth in hydroponic system. Levels of low N concentrations are in grey bars; high N concentrations are in black bars. Legend: (BT), before treatment; (50 mM 3D), 3 days of moderate stress; (50 mM 7D), 7 days of moderate stress; (150 mM 8D), 7 days in 50 mM NaCl and 1 day in 150 mM NaCl (severe stress); (150 mM 10d) 7 days in 50 mM NaCl and 3 days in 150 mM NaCl (severe stress); (CT 10D) control treatment for 10 days. (<b>A</b>)100/1B, G6PDH activity; (<b>B</b>): Barley Medenine, G6PDH activity; (<b>C</b>) 100/1B, APX activity; (<b>D</b>): Barley Medenine, APX activity. Letters indicate significant differences between different treatments. (<span class="html-italic">p</span> &lt; 0.05, ANOVA: Duncan’s test).</p>
Full article ">Figure 4
<p>Western blotting of leaves of “100/1B” (<b>A</b>) and “Barley medenine” (<b>B</b>) grown under low N (1 mM NH<sub>4</sub><sup>+</sup>) and high N (10 mM NH<sub>4</sub><sup>+</sup>) using antisera Fd-GOGAT, cyt-G6PDH, P1-G6PDH, P2-G6PDH, Chl-HSP70, Cyt-HSP70, PEPCase, and Tubulin (as control for equal loading). Legend: (BT), before treatment; (50 mM 3D), 3 days of moderate stress; (50 mM 7D), 7 days of moderate stress; (150 mM 8D), 7 days in 50 mM NaCl and 1 day in 150 mM NaCl (severe stress); (150 mM 10d) 7 days in 50 mM NaCl and 3 days in 150 mM NaCl (severe stress); (CT 10D) control treatment for 10 days. Images are representative of two or three WB from different experiments.</p>
Full article ">Figure 5
<p>Effects of salinity and N concentration on NADH-GOGAT and GDH enzymatic activities in barley plants growth in hydroponic system. Levels of low N concentrations are in grey bars; high N concentrations are in black bars. Legend: (BT), before treatment; (50 mM 3D), 3 days of moderate stress; (50 mM 7D), 7 days of moderate stress; (150 mM 8D), 7 days in 50 mM NaCl and 1 day in 150 mM NaCl (severe stress); (150 mM 10d) 7 days in 50 mM NaCl and 3 days in 150 mM NaCl (severe stress); (CT 10D) control treatment for 10 days. (<b>A</b>)100/1B, GOGAT activity; (<b>B</b>): Barley Medenine, GOGAT activity; (<b>C</b>) 100/1B, GDH activity; (<b>D</b>): Barley Medenine, GDH activity.Letters indicate significant differences between different treatments. (<span class="html-italic">p</span> &lt; 0.05, ANOVA: Duncan’s test).</p>
Full article ">Figure 6
<p>Effects of salinity and N concentration on PEP carboxylase (PEPC) enzymatic activity in barley plants growth in hydroponic system. Levels of low N concentrations are in grey bars; high N concentrations are in black bars. Legend: (BT), before treatment; (50 mM 3D), 3 days of moderate stress; (50 mM 7D), 7 days of moderate stress; (150 mM 8D), 7 days in 50 mM NaCl and 1 day in 150 mM NaCl (severe stress); (150 mM 10d) 7 days in 50 mM NaCl and 3 days in 150 mM NaCl (severe stress); (CT 10D) control treatment for 10 days. (<b>A</b>)100/1B, PEPC activity; (<b>B</b>): Barley Medenine, PEPC activity; Letters indicate significant differences between different treatments. (<span class="html-italic">p</span> &lt; 0.05, ANOVA: Duncan’s test).</p>
Full article ">
14 pages, 273 KiB  
Article
Sequential Applications of Synthetic Auxins and Glufosinate for Escaped Palmer Amaranth Control
by Frances B. Browne, Xiao Li, Katilyn J. Price, Ryan Langemeier, Alvaro Sanz-Saez de Jauregui, J. Scott McElroy, Yucheng Feng and Andrew Price
Agronomy 2020, 10(9), 1425; https://doi.org/10.3390/agronomy10091425 - 19 Sep 2020
Cited by 6 | Viewed by 3140
Abstract
Field and greenhouse studies were conducted to investigate the influence of sequence and timing of synthetic auxins and glufosinate on large Palmer amaranth (Amaranthus palmeri) control. Field studies were performed in Henry County, AL where treatments were applied to Palmer amaranth [...] Read more.
Field and greenhouse studies were conducted to investigate the influence of sequence and timing of synthetic auxins and glufosinate on large Palmer amaranth (Amaranthus palmeri) control. Field studies were performed in Henry County, AL where treatments were applied to Palmer amaranth with average heights of 37 and 59 cm in 2018 and 2019, respectively. Sequential applications of 2,4-D/dicamba + glyphosate followed by (fb) glufosinate at labeled rates 3 or 7 days after initial treatment (DAIT) were used in addition to the reverse sequence with a 7-day interval. Time intervals of 3 or 7 days between applications did not influence Palmer amaranth control. Palmer amaranth was controlled 100% by dicamba + glyphosate fb glufosinate and 2,4-D + glufosinate fb glufosinate 7 DAIT in 2018. However, herbicide performance was reduced due to delayed application and taller plants in 2019 with up to 23% less visual injury. To further investigate Palmer amaranth response to dicamba and glufosinate applied sequentially, a greenhouse study was conducted in 2019 where physiological measurements were recorded over a 35-day period. Treatments were applied to Palmer amaranth averaging 38 cm tall and included dicamba + glyphosate fb glufosinate 7 DAIT, the reverse sequence, and a single application of dicamba + glufosinate + glyphosate. Glufosinate severely inhibited mid-day photosynthesis compared to dicamba with up to 90% reductions in CO2 assimilation 1 DAIT. In general, Palmer amaranth respiration and stomatal conductance were not affected by herbicides in this study. Applications of dicamba + glyphosate fb glufosinate 7 DAIT was the only treatment hindered Palmer amaranth regrowth with 52% reduction in leaf biomass compared to nontreated control. These data suggest Palmer amaranth infested fields are more likely to be rescued with sequential applications of synthetic auxins and glufosinate, but consistent control of large Palmer is not probable. Full article
(This article belongs to the Section Pest and Disease Management)
45 pages, 1271 KiB  
Review
Sprouts and Microgreens: Trends, Opportunities, and Horizons for Novel Research
by Angelica Galieni, Beatrice Falcinelli, Fabio Stagnari, Alessandro Datti and Paolo Benincasa
Agronomy 2020, 10(9), 1424; https://doi.org/10.3390/agronomy10091424 - 19 Sep 2020
Cited by 93 | Viewed by 20780
Abstract
Sprouts and microgreens have attracted tremendous interest across multiple disciplines in recent years. Here, we critically review the most recent advances to underscore research prospects and niches, and related challenges, not yet addressed or fully pursued. In particular, we report a number of [...] Read more.
Sprouts and microgreens have attracted tremendous interest across multiple disciplines in recent years. Here, we critically review the most recent advances to underscore research prospects and niches, and related challenges, not yet addressed or fully pursued. In particular, we report a number of themes that merit special attention as a result of their relevance to plant science, nutrition, health, and zootechnics: (1) species not yet or inadequately investigated, such as wild plants, and fruit tree strains; (2) abiotic and biotic factors, and biostimulants, for elicitation strategies and metabolic engineering; (3) sanitization and processing technologies to obtain high-quality products; (4) digestive fate and impact of bioactive elements, antinutrients, and allergens on human nutrition; (5) experimental challenges to researching health benefits; (6) the opportunity to generate natural product libraries for drug discovery; and (7) sprouts in animal feeding to improve both animal health and the nutritional value of animal products for the human diet. The convergence of different themes involving interdisciplinary competencies advocate fascinating research pursuits, for example, the elicitation of metabolic variants to generate natural product collections for identification and selection of bioactive chemicals with a role as nutraceuticals, key constituents of functional foods, or interactive partners of specific drugs. Full article
(This article belongs to the Special Issue Sprouts, Microgreens and Edible Flowers as Novel Functional Foods)
Show Figures

Graphical abstract

Graphical abstract
Full article ">Figure 1
<p>Schematic example of an experimental workflow aimed to select and identify pharmacologically active chemicals from sprouts.</p>
Full article ">
15 pages, 2180 KiB  
Article
Spatiotemporal Distribution of Cattle Dung Patches in a Subtropical Soybean-Beef System under Different Grazing Intensities in Winter
by Francine D. da Silva, Pedro A. de A. Nunes, Christian Bredemeier, Monica Cadenazzi, Lúcio P. Amaral, Fernando M. Pfeifer, Ibanor Anghinoni and Paulo C. de F. Carvalho
Agronomy 2020, 10(9), 1423; https://doi.org/10.3390/agronomy10091423 - 19 Sep 2020
Cited by 5 | Viewed by 3143
Abstract
Cattle dung distribution in pastoral ecosystems is uneven and affects nutrient availability to plants. Thus, identifying its spatiotemporal patterns is crucial to understanding the mechanisms underlying the system functioning. We aimed to characterize the spatiotemporal distribution of dung patches in mixed black oat [...] Read more.
Cattle dung distribution in pastoral ecosystems is uneven and affects nutrient availability to plants. Thus, identifying its spatiotemporal patterns is crucial to understanding the mechanisms underlying the system functioning. We aimed to characterize the spatiotemporal distribution of dung patches in mixed black oat (Avena strigosa Schreb.) and Italian ryegrass (Lolium multiflorum Lam.) pastures grazed at different intensities (sward heights of 0.1, 0.2, 0.3 and 0.4 m) in the winter stocking period of an integrated soybean-beef system in southern Brazil. All dung patches were located and georeferenced every 20 days. Dung distribution was analyzed using Thiessen polygons and semivariogram analysis. The spatial pattern of dung deposition was virtually similar over time but created distinct patterns in paddocks managed at different grazing intensities. Dung patch density was greater close to attraction points, resting and socialization areas regardless of grazing intensity. Lighter grazing intensities presented stronger spatial patterns with increased dung density in those areas, but those patterns weakened with increasing grazing intensity. Dung patches covered 0.4%, 0.9%, 1.1% and 1.5% of the area in paddocks managed at 0.4, 0.3, 0.2 and 0.1 m sward heights, respectively. Geostatistics proved useful for identifying spatial patterns in integrated crop-livestock systems and will potentially support further investigations. Full article
(This article belongs to the Section Farming Sustainability)
Show Figures

Figure 1

Figure 1
<p>The location of the experimental area (<b>left</b>) and an aerial view of the paddocks (<b>right</b>) used for the description of the spatiotemporal patterns of dung deposition in the winter stocking period of an integrated soybean-beef cattle system in southern Brazil. Paddock dimensions and the target sward heights (0.1, 0.2, 0.3 and 0.4 m) assigned to them are shown in the aerial view. The pastures consisted of a mixture of black oat (<span class="html-italic">Avena strigosa</span> Schreb.) and Italian ryegrass (<span class="html-italic">Lolium multiflorum</span> Lam.) grazed by steers under continuous stocking method.</p>
Full article ">Figure 2
<p>Cumulative spatial distribution of dung patches at different grazing intensities. Sward heights of (<b>a</b>) 0.1 m, (<b>b</b>) 0.2 m, (<b>c</b>) 0.3 m and (<b>d</b>) 0.4 m on mixed black oat (<span class="html-italic">Avena strigosa</span> Schreb.) and Italian ryegrass (<span class="html-italic">Lolium multiflorum</span> Lam.) pastures at the end of the stocking period of an integrated soybean-beef cattle system in southern Brazil. The smaller/darker the polygons, the higher the dung density. Arrows indicate watering and salt feeding sites as well as paddock gates.</p>
Full article ">Figure 3
<p>Spatiotemporal distribution of cattle dung patches in the paddock managed under light grazing intensity (sward height of 0.4 m) as a representation of dung distribution over different sampling dates in 2010.</p>
Full article ">Figure 4
<p>Overall semivariograms of the areas of Thiessen polygons around dung patches in paddocks grazed at different intensities by steers. Grazing intensities were given by the sward heights of (<b>a</b>) 0.1 m, (<b>b</b>) 0.2 m, (<b>c</b>) 0.3 m and (<b>d</b>) 0.4 m on mixed black oat (<span class="html-italic">Avena strigosa</span> Schreb.) and Italian ryegrass (<span class="html-italic">Lolium multiflorum</span> Lam.) pastures at the end of the stocking period of an integrated soybean-beef cattle system in southern Brazil.</p>
Full article ">
22 pages, 1722 KiB  
Article
Overview of Kaolin Outcomes from Vine to Wine: Cerceal White Variety Case Study
by Lia-Tânia Dinis, Sara Bernardo, Carlos Matos, Aureliano Malheiro, Rui Flores, Sandra Alves, Carina Costa, Sílvia Rocha, Carlos Correia, Ana Luzio and José Moutinho-Pereira
Agronomy 2020, 10(9), 1422; https://doi.org/10.3390/agronomy10091422 - 18 Sep 2020
Cited by 22 | Viewed by 4883
Abstract
Kaolin protective effect was assessed in a white grapevine cultivar ‘Cerceal’ in ‘Alentejo’ Region (southeast Portugal) where plants face extreme conditions during the summer season. We addressed the hypothesis that kaolin effects lead to several changes in leaves, fruits, and wine characteristics on [...] Read more.
Kaolin protective effect was assessed in a white grapevine cultivar ‘Cerceal’ in ‘Alentejo’ Region (southeast Portugal) where plants face extreme conditions during the summer season. We addressed the hypothesis that kaolin effects lead to several changes in leaves, fruits, and wine characteristics on the primary and secondary metabolism. Results showed that kaolin reduces leaf temperature which provokes an improvement in physiological parameters such as net photosynthesis and water use efficiency. This protection interferes with berry color, leaving them more yellowish, and an increase in phenolic compounds were observed in all fruit tissues (skin, seed, and pulp). Additionally, both berry and wine characteristics were strongly affected, with an increase of tartaric and malic acid and consequently high total acidity, while the sugar concentration decreased 8.9% in berries provoking a low wine alcohol level. Results also showed that kaolin induces high potassium, magnesium, and iron, and low copper and aluminum concentrations. Moreover, the control wine showed higher content of esters related with hostile notes whereas wine from kaolin treated vines presented higher content of esters associated with fruity notes. Overall, the results strengthen the promising nature of kaolin application as a summer stress mitigation strategy protecting grapevine plants and improving fruit quality and creating more balanced wines. Full article
(This article belongs to the Special Issue Environmental Stress on Crops Physiology and Biochemistry)
Show Figures

Figure 1

Figure 1
<p>Daily mean temperature (Tmean, dashed grey line), maximum temperature (Tmax, grey line), and precipitation (black line) in 2016 and 2017. The filled arrows show the days of the kaolin application in 2016 (DOY 129) and 2017 (DOY155), and dashed arrows indicate the days of experimental measurements and material collection for prior analysis. DOY: day of the year.</p>
Full article ">Figure 2
<p>Leaf temperature of control and kaolin treated leaves in veraison and maturation in the midday period in 2016 and 2017. Values are presented as mean ± SD (<span class="html-italic">n</span> = 24 per treatment). Different lowercase letters represent significant differences between treatments (control vs. kaolin), in the same stage of the season, and * represents significant differences between stages within the same treatment (<span class="html-italic">p</span> &lt; 0.05). Absence of superscript indicates no significant differences.</p>
Full article ">Figure 3
<p>JIP parameters in control and kaolin treated grapevines from veraison and maturation stages in the midday period in 2016 and 2017. Values are presented as mean ± SD (<span class="html-italic">n</span> = 10). Different lowercase letters represent significant differences between treatments (control vs. kaolin), in the same period of the day (morning/midday) within the stage of the season (veraison/maturation), and * represents significant differences between stages of the season within the same period of the day (<span class="html-italic">p</span> &lt; 0.05). Absence of superscript indicates no significant differences.</p>
Full article ">Figure 4
<p>Heatmap and dendrogram representation of the 51 volatile components from ‘Cerceal’ cv. wines under study: control and kaolin treated grapevines, which reveals the distinction among wines. The content of each compound was illustrated through different colors (from dark blue, minimum, to dark red, maximum). Dendrogram for the HCA results using Ward’s cluster algorithm to the data set was also included. Differences corresponding to <span class="html-italic">p</span> &lt; 0.05 were considered significant and were marked with *.</p>
Full article ">
21 pages, 3252 KiB  
Article
Biochar Type, Ratio, and Nutrient Levels in Growing Media Affects Seedling Production and Plant Performance
by Antonios Chrysargyris, Munoo Prasad, Anna Kavanagh and Nikos Tzortzakis
Agronomy 2020, 10(9), 1421; https://doi.org/10.3390/agronomy10091421 - 18 Sep 2020
Cited by 30 | Viewed by 5759
Abstract
Biochar can be used as an alternative component in growing media, positively affecting plant growth/yield, but also media properties. In the present study, two commercial grade biochars (BFW-forest wood; and BTS-fresh wood screening), mainly wood-based materials, were used at 7.5% and 15% ( [...] Read more.
Biochar can be used as an alternative component in growing media, positively affecting plant growth/yield, but also media properties. In the present study, two commercial grade biochars (BFW-forest wood; and BTS-fresh wood screening), mainly wood-based materials, were used at 7.5% and 15% (v/v), adding nutrient in two levels (100% and 150% standard fertilizer level-Fert). Biochar affected growing media properties, with increases on pH and changes on the nutrient content levels. Biochar BFW enhanced the emergence of seeds in comparison to the control. Increased fertilizer levels benefited plant yield in BFW and BTS at 7.5%, but not at 15%. Leaf stomatal conductance was reduced at 150% fertilized biochars (BFW + Fert and BTS + Fert) at 7.5%, while total chlorophylls increased at BTS + Fert at 7.5% and 15%. The addition of biochars decreased the antioxidant activity in the plant. Lipid peroxidation in lettuce was increased in most cases with the presence of biochars (BFW, BTS) and 150% fertilization, activating antioxidant (superoxide oxidase and peroxidase) enzymatic metabolisms. The addition of Biochars in the growing media increased the content of nutrients in seedlings, as plants could absorb more available nutrients. Biochar of beech, spruce, and pine species (BFW) at 7.5% was more promising for substituting peat to produce lettuce seedlings. However, examining different species (tomato, leek, impatiens, and geranium) with BFW at 7.5%, the results were not common, and each species needs to be evaluated further. Full article
(This article belongs to the Special Issue Soilless Culture, Growing Media and Horticultural Plants)
Show Figures

Figure 1

Figure 1
<p>Lettuce cumulative seedling emergence in peat (P) with different biochar types (BFW, BTS) and ratio (7.5%, 15%) and mineral doses (with standard or with Fertilizers-Fert.). Error bars show SE (<span class="html-italic">n</span> = 4).</p>
Full article ">Figure 2
<p>Effects of peat (P) with different biochar types (BFW, BTS) and ratio (7.5%, 15%) and mineral doses (with standard or with additional Fertilizers-F.) on lettuce total phenols and antioxidant activity. (<b>A</b>) total phenols, (<b>B</b>) DPPH, and (<b>C</b>) FRAP. Significant differences (<span class="html-italic">p</span> &lt; 0.05) among treatments are indicated by different letters. Error bars show SE (<span class="html-italic">n</span> = 4). Dotted line presents the levels of control treatment (100% peat).</p>
Full article ">Figure 3
<p>Effects of peat (P) with different biochar types (BFW, BTS) and ratio (7.5%, 15%) and mineral doses (with standard or with additional Fertilizers-F) on lettuce lipid peroxidation, hydrogen peroxide and antioxidant enzymes activity. (<b>A</b>) Lipid peroxidation (MDA), (<b>B</b>) H<sub>2</sub>O<sub>2</sub>, (<b>C</b>) superoxide dismutase (SOD), (<b>D</b>) catalase (CAT), and (<b>E</b>) peroxidase activity (POD). Significant differences (<span class="html-italic">p</span> &lt; 0.05) among treatments are indicated by different letters. Error bars show SE (<span class="html-italic">n</span> = 4). Dotted line presents the levels of control treatment (100% peat).</p>
Full article ">Figure 4
<p>Effects of peat (P) with different biochar types (BFW, BTS) and ratio (7.5%, 15%) and mineral doses (with standard or with additional Fertilizers-F) on lettuce macro- and micronutrient content. Significant differences (<span class="html-italic">p</span> &lt; 0.05) among treatments are indicated by different letters. Error bars show SE (<span class="html-italic">n</span> = 4). Dotted line presents the levels of control treatment (100% peat).</p>
Full article ">Figure 4 Cont.
<p>Effects of peat (P) with different biochar types (BFW, BTS) and ratio (7.5%, 15%) and mineral doses (with standard or with additional Fertilizers-F) on lettuce macro- and micronutrient content. Significant differences (<span class="html-italic">p</span> &lt; 0.05) among treatments are indicated by different letters. Error bars show SE (<span class="html-italic">n</span> = 4). Dotted line presents the levels of control treatment (100% peat).</p>
Full article ">Figure 5
<p>Effects of peat (P; light grey) with BFW at 7.5% (dark grey) with additional Fertilizers-Fert. on tomato, leek, geranium, and impatiens plant growth, physiology, and nutrient content-related parameters. Significant differences (<span class="html-italic">p</span> &lt; 0.05) among treatments are indicated by different letters. Error bars show SE (<span class="html-italic">n</span> = 4). ns: not significant.</p>
Full article ">Figure 5 Cont.
<p>Effects of peat (P; light grey) with BFW at 7.5% (dark grey) with additional Fertilizers-Fert. on tomato, leek, geranium, and impatiens plant growth, physiology, and nutrient content-related parameters. Significant differences (<span class="html-italic">p</span> &lt; 0.05) among treatments are indicated by different letters. Error bars show SE (<span class="html-italic">n</span> = 4). ns: not significant.</p>
Full article ">
15 pages, 1751 KiB  
Article
Organic Carrot (Daucus carota L.) Production Has an Advantage over Conventional in Quantity as Well as in Quality
by Ingrid Bender, Liina Edesi, Inga Hiiesalu, Anne Ingver, Tanel Kaart, Hedi Kaldmäe, Tiina Talve, Ilmar Tamm and Anne Luik
Agronomy 2020, 10(9), 1420; https://doi.org/10.3390/agronomy10091420 - 18 Sep 2020
Cited by 18 | Viewed by 6560
Abstract
Organic production is one of the fastest growing food sectors globally. However, average yield in organic vegetable production is up to 33% lower than in conventional production. This difference could be due to higher fertilization rates in conventional, compared to organic, farming. We [...] Read more.
Organic production is one of the fastest growing food sectors globally. However, average yield in organic vegetable production is up to 33% lower than in conventional production. This difference could be due to higher fertilization rates in conventional, compared to organic, farming. We aimed to compare yield and quality characteristics of carrots produced under equal nitrogen fertilization rates over four years in organic and conventional conditions. We found a 14.5% higher marketable, and 10.0% lower discarded, yield in the organic compared to the average conventional treatments. In addition, carrots managed organically had 14.1% lower nitrate and 10.0% higher vitamin C content than carrots managed conventionally. There were no convincing effects of cultivation system on the nitrogen, total sugar, or dry matter content of carrots. Organically managed carrots were free of pesticide residues, while several residues were found in carrots managed conventionally. Our study reveals that organic management of carrots may exceed that of conventional methods in yield and several quality characteristics, while being free of pesticide residues. Organic fertilizer gave an advantage over mineral fertilizer, when equal rates of nitrogen were used in both production systems. Full article
(This article belongs to the Special Issue Organic vs. Conventional Cropping Systems)
Show Figures

Figure 1

Figure 1
<p>Biplot of principal component analysis by treatments. Vectors indicate the direction of increase of the carrot yield and quality parameters respective to the first two principal components; symbols distinguished by treatments mark the location of single samples in the PC1-PC2-plane.</p>
Full article ">Figure 2
<p>Biplot of principal component analysis by year. Vectors indicate the direction of increase of the carrot yield and quality parameters respective to the first two principal components; symbols distinguished by year mark the location of single samples in the PC1-PC2-plane.</p>
Full article ">
Previous Issue
Next Issue
Back to TopTop